



Abstract
There is a long history of adapting airborne sound insulation in buildings to the actual needs. A first pan-European work was published with COST Action TU0901: Integrating and Harmonizing Sound Insulation Aspects in Sustainable Urban Housing Constructions in which the differences between the sound insulation measure and the standard sound level difference were documented. Furthermore, ISO 16283-1: Field measurement of sound insulation in buildings and of building elements—Part 1: Airborne sound insulation states: Compared to DnT, R’ has a weaker connection to the subjective impression of airborne sound insulation. To investigate this relationship a simplified listening test and a computer-simulated variation studies of a synthesized airborne sound insulation were carried out. A test sound was generated from a speech, a music, and a noise signal, each of which was filtered by six frequency responses of solid structures. In a paired comparison task, 16 participants judged the loudness of the resulting 18 sounds. The results of the listening test show that perceived loudness is significantly correlated to the single number quantity DnT,w but less to the single number quantity R’w. This finding was confirmed across all signal types. Thus, the results confirm the statement in ISO 16283-1, that the single number quantity DnT,w has a stronger connection to the subjective impression of airborne sound insulation as the quantity R’w.
Keywords
Introduction
ISO 16283-1 contains recommendations for the characterization of sound insulation. First, there is the apparent sound reduction index R’, which is transferred to a single number quantity R’w (weighted apparent sound reduction index) by the use of the assessment procedure described in ISO 717-1.1–3 Second, there is the standardized level difference DnT, which also can be transferred to a single number quantity DnT,w (weighted standardized level difference). Both single number quantities are based on common measurements and calculations namely the detection of the difference of the source room level and the receiving room level, the measurement of the reverberation time and the subsequent weighting method corresponding to ISO 717-1.
Both single number quantities R’w and DnT,w coexists as characteristics for sound insulation. In the comparison of the single number quantities R’w and DnT,w a central question remains unanswered: Which of these quantities better reflects the subjectively perceived sound insulation? Initial indication published by COST Action TU0901 3 showed that a certain subjective judged difference between the measure of sound insulation DnT,w and R’w exists. However, no listening test has been performed to compare both quantities with subjective impressions. In some cases, as mentioned in Rasmussen and Lang, 4 subjective expectations of sound insulation are not met even though the requirements of building codes have been met, as survey studies have revealed complaints of inadequate sound insulation.
Single number quantity R’w and DnT,w
The question, which measure of airborne sound insulation fits best the subjective impression, was discussed in various evaluations and research projects. On the one hand objective evaluation methods as in Kylliäinen et al. 5 and Rasmussen and Rindel 6 and on the other hand subjective evaluation methods were conducted as in Refs.7–11 to compare different quantities. The present study has its focus on the two quantities R’w and DnT,w and its determination is described as follows. Both quantities, that is, R’w and DnT,w, are characteristics of airborne sound insulation and initially are determined as third-band measures R’ and DnT. The apparent sound reduction index (R’) which depends on the sound pressure level in the source and receiving room is linked to the separating structure and the equivalent absorption area. The standardized level difference (DnT) is also depending on the sound pressure level in the source and receiving room, however, it is linked just to the reverberation time. The differences between R’ and DnT are discussed in detail in Neubauer. 12 In summary, it can be stated that both quantities R’ and DnT have in common that they are based on the measured frequency-dependent level difference between the source room and the receiving room (Figure 1).
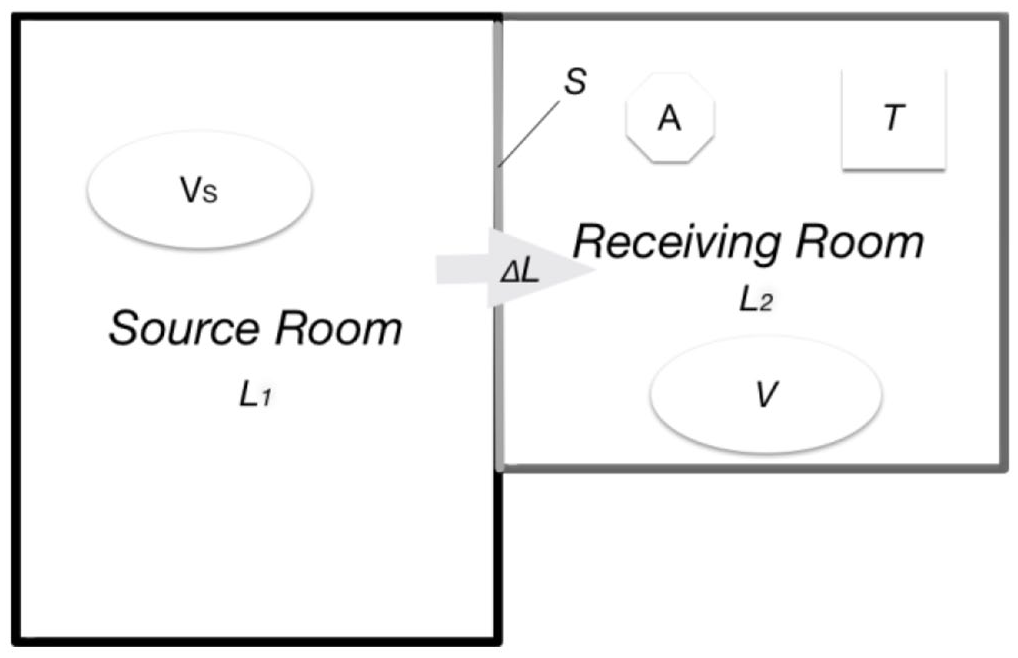
Schematic presentation of an airborne sound insulation measurement.
Another important indicator to determine those two measures is the reverberation time of the receiving room. To calculate the standardized level difference, the actual reverberation time is normalized to an international agreed reference reverberation time of T0 = 0.5 s:

The measurement of the reverberation time in case of the calculation of R’ is used to derive the equivalent absorption area A considering the room volume V using the reverberation time formula according to Sabine:

Here, the condition of a diffuse sound field is assumed. Finally, the calculation of R’ is conducted by considering the equivalent absorption area A relating to the area of the separating structure S:

Linking of R’w and DnT,w
By comparing equations (1) and (2) it is clear, that both quantities are linked by the sound pressure level difference between source and receiving room. Both quantities differ in the different correction term, that is, normalization. For the calculation of DnT-values the measured reverberation time is used directly, based on equation (2), whereas for calculating the R’-values the reverberation time needs to be converted into the equivalent absorption area. Equation (2) is dependent of two factors, the existence of a diffuse sound field and the validity of Sabine’s reverberation theory. Both quantities are frequency dependent. To obtain a single number quantity, the assessment procedure described in ISO 717-1 using a reference curve converts both weighted single number quantities. As specified in ISO 12354-1 13 the difference of both weighted single number quantities is given in equation (4):

This equation denotes, that the difference between R’w and DnT,w depends on the ratio of the receiving room volume as well as on the area of the separating structure. It can be deduced from equation (4) that both single number quantities are identical at a V/S-relation of 3.125 m3/m2, provided that the reverberation time formula according to Sabine is valid. 14
Material and methods
To investigate the relationship between R’w and DnT,w, respectively and the subjective impression of airborne sound insulation a hearing experiment was conducted. In order to hold the experiment close to reality, measurement data of airborne sound insulation measurements were used as starting point. The measurement dataset was analyzed by means of statistical methods to select an exemplary subset of measurements representing separating structures. The frequency-dependent level differences were used as filters to digitally process audio signals and to generate stimuli for the listening test.
Materials and sounds
The measurement data originate from airborne sound insulation measurements taken in the scope of quality inspections between 2001 and 2020. To determine the quantities R’w and DnT,w the measurements were performed and evaluated by using the methods mentioned in section 1.
Measurement data set
The total number of measurements was N = 71. A classification of the data sets basic characteristics is shown in Figure 2. It indicates the construction method and the type of furnishing of walls and ceilings of the receiving rooms.

Classification of the data set by furnishing (left) and construction method (right).
Out of this data set six different structures with the corresponding measurements were selected to be edited and prepared by computer-simulated applications.
Selection of signals and filters
For the listening test, three signal types were chosen, which may typically occur in residential environments: speech, music, and pink noise. With respect to the music signal, a sample out of a pop music theme (“Early in the Morning” by Eddie Rabbit) was extracted. The speech signal was generated by merging a female and a male voice signal, which were taken from the open-source sound carrier EBU SQAM CD of the European Broadcast Union.
All signals were limited to a maximum duration of 12 s. The signals were anechoic, except for the pop music theme, in which a sound processing with an artificial delay effect is inherent. After adjusting the volume of the signals, they were filtered by the frequency responses of the six separating structures. The filtering was applied to acoustically simulate the transmission of the signals through separating structures.
The signals were filtered using digital signal processing. The frequency response of these filters was extracted from the (third band) level difference values L1−L2 of the measurement data. In the following, the selection of the filters and their characteristics are described in more detail. Figure 3 shows the frequency responses of the filters 1–6, which were extracted from the corresponding level difference (L1−L2).
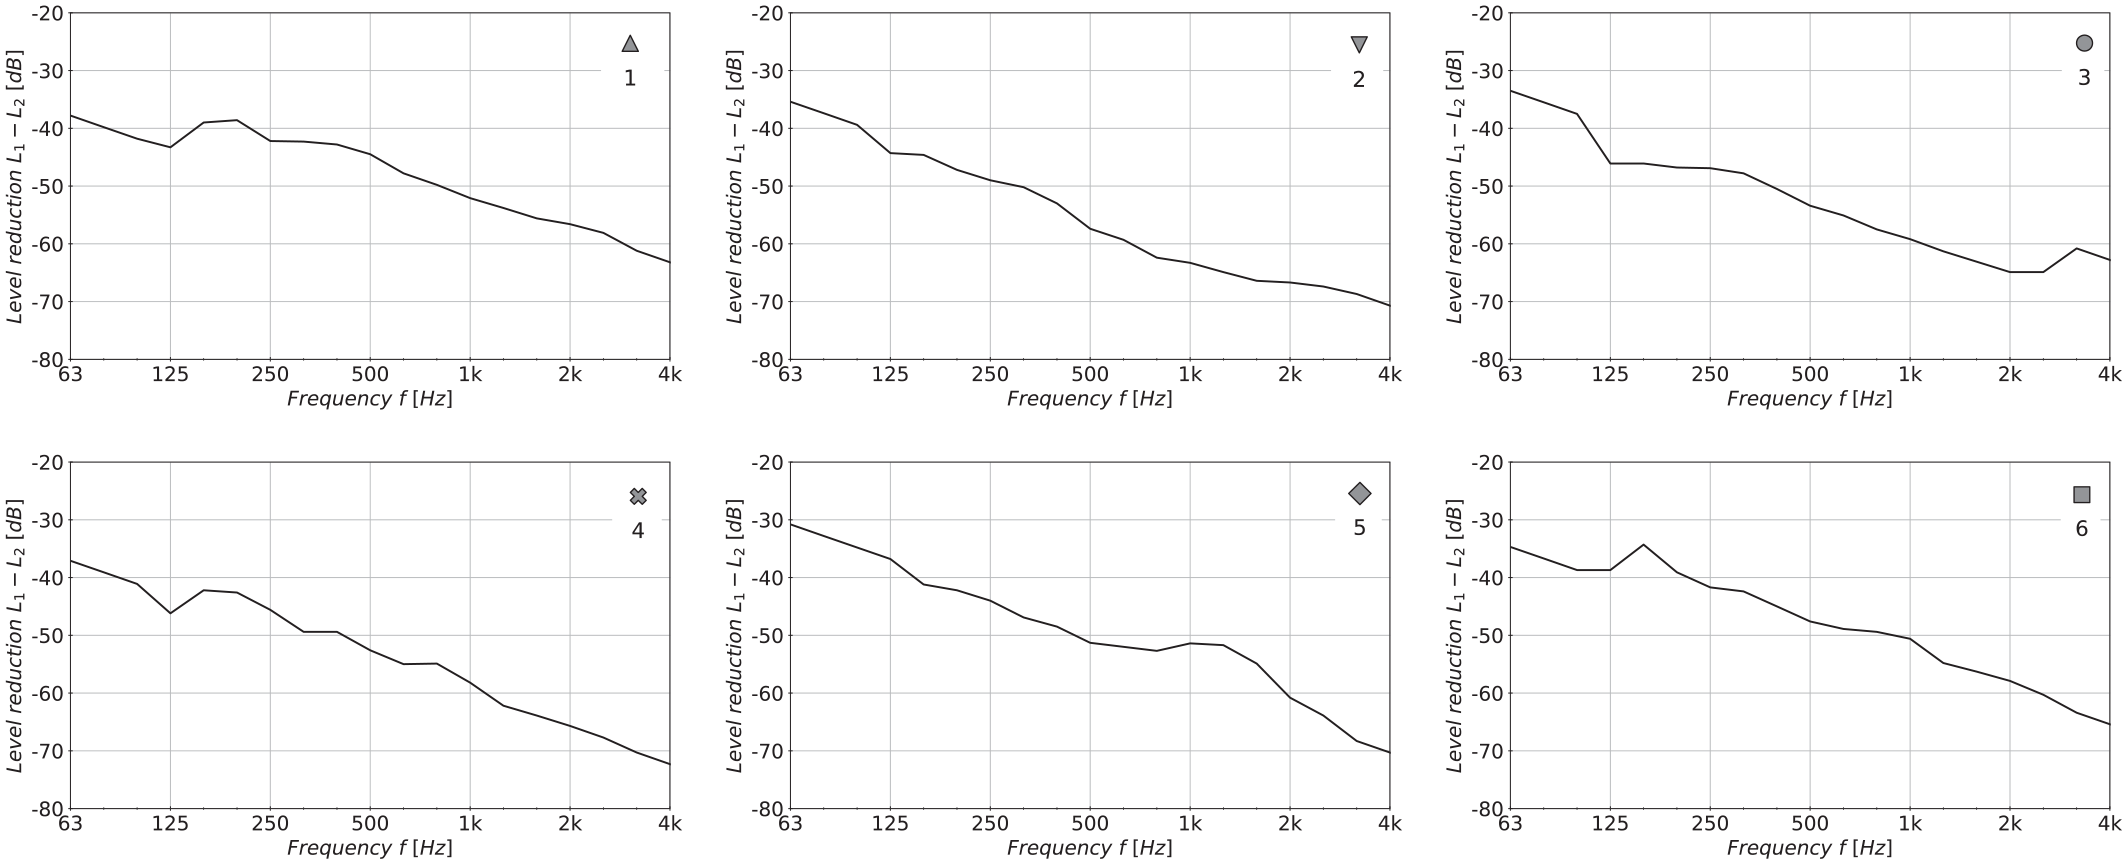
Presentation of the filter’s frequency response (from left to right): 1, 2, and 3 (above) and 4, 5, and 6 (below).
The level difference (see Figure 3) was also used to calculate the third band values of R’ and DnT by the application of equations (1) and (3). The values of R’w and DnT,w were determined according to the calculation methods in ISO 717-1.
To avoid an overstressing of the participants, the number of filters was limited to 6, whereby the interval of the difference (DnT,w−R’w) covers a range of 6 dB, reaching from −2 to +4 dB. This range constitutes a ranking in relation to the values of R’w and DnT,w, that is, the R’w-values cover a range from 51 to 59 dB and the DnT,w-values cover a range from 51 to 60 dB. Table 1 shows the acoustic and geometrical characteristics of the filters.
Selection of the filters with corresponding acoustic and geometrical characteristics.

Participants
In total, 16 participants, all of them office employees, took part in the experiment. They received no payment for their attendance. Verbal informed consent was obtained from the participants for their anonymized answers to be published. None of the participants reported any type of hearing loss. Figure 4 shows the frequency distributions of the participants’ age and gender categories which were assessed by a questionnaire on demographic data.
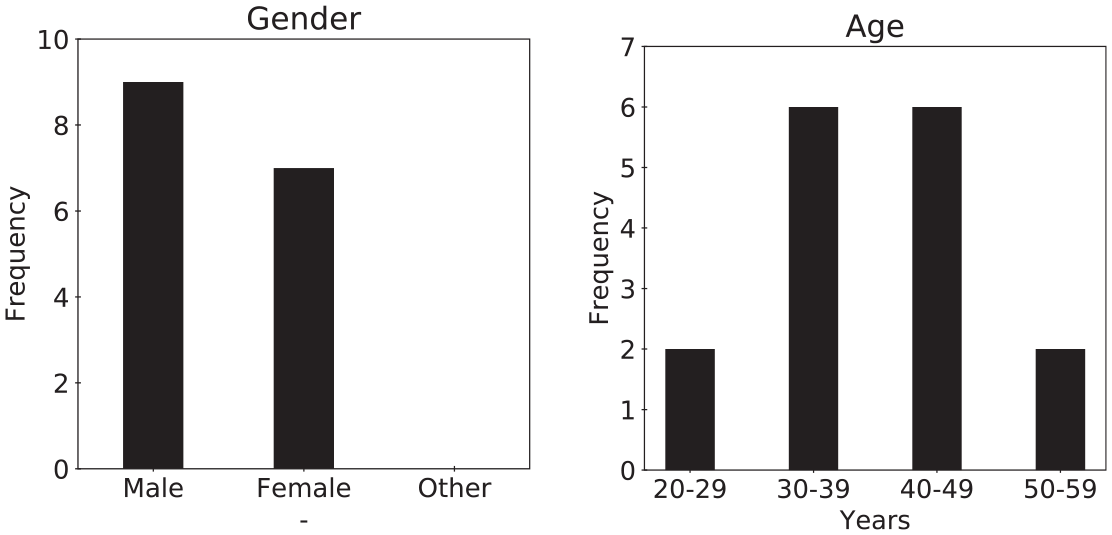
Frequency distribution of the participants’ gender (left) and age (right).
Design and procedure
For the listening test, a within-subject design was used. Paired comparisons were chosen for the answer format. Correspondingly, every participant had to judge each of the 45 pairs of stimuli which were presented in a randomized order to avoid systematic sequence and customization errors. 15 The number of 45 pairs resulted from 15 possible combinations per signal type. Sounds were not compared across signal types. The independent variable in this study is “sound volume” and the dependent variable is the subjective judged sound, which is named in this study as “subjective loudness.”
The listening test was conducted in a silent room with a noise floor between 20 and 23 dB(A). Participants were tested individually. The sound stimuli were played back via closed headphones (Beyerdynamic DT 1770 Pro) which were connected to a professional audio interface (Focusrite Scarlett 4i4). Participants were instructed to select the louder out of two successively presented sound stimuli per trial.
At the beginning of the experimental session, participants had to work on a practice phase, consisting of six trials, to become familiar with the listening conditions and the type of judgments. During the following test phase, the order of the sound pairs was determined by a random generator. Participants took about 45 min to complete the total number of 45 judgments. Finally, participants had to fill in a short questionnaire concerning demographic data.
Data preparation
In order to validate the participants’ judgments, post screenings were conducted by means of a concordance analysis according to Kendall 16 with a subsequent asymptotic verification over Chi 2 distribution and a consistency check. For the latter, the circular error rate was computed and calculated according to Parizet. 17
After excluding the data of one participant from the main analyses, the post screening revealed that the judgments of the remaining participants are concordant and consistent. According to Bortz and Döring, 18 the judgments of the participants were consolidated, and a combined ranking was generated. By means of a dominance matrix and the law of comparative judgment, the judgments were transferred to a relative rank-order. This method was applied separately to each signal type.
Results
To compare the single number quantities R’w and DnT,w, respectively with the subjective impression of airborne sound insulation the rank order of each single number quantity was opposed to the relative rank order of the participants’ subjective judgments. The range of the R’w-values from 51 to 59 dB was compared with the judgments ranging from the loudest perceived signal (“loud”) to the quietest perceived signal (“quiet”). The same procedure was applied with the range of the DnT,w-values from 51 to 60 dB.
To illustrate the results of the listening test, a graphical representation was prepared and to verify the hypothesis of the listening test, statistical methods were applied as illustrated subsequently.
Descriptive representation
Results of the listening test are shown in Figure 5, separated by the signal types of music, speech, and pink noise and separated by the quantities R’w and DnT,w. The visual presentation of the results indicates nearly linear relationships between the subjective judgments and the single number quantity DnT,w. In contrast, the relationships between the subjective judgments and the quantity R’w shows strong deviations from a linear relationship. This pattern can be observed across all signal types.
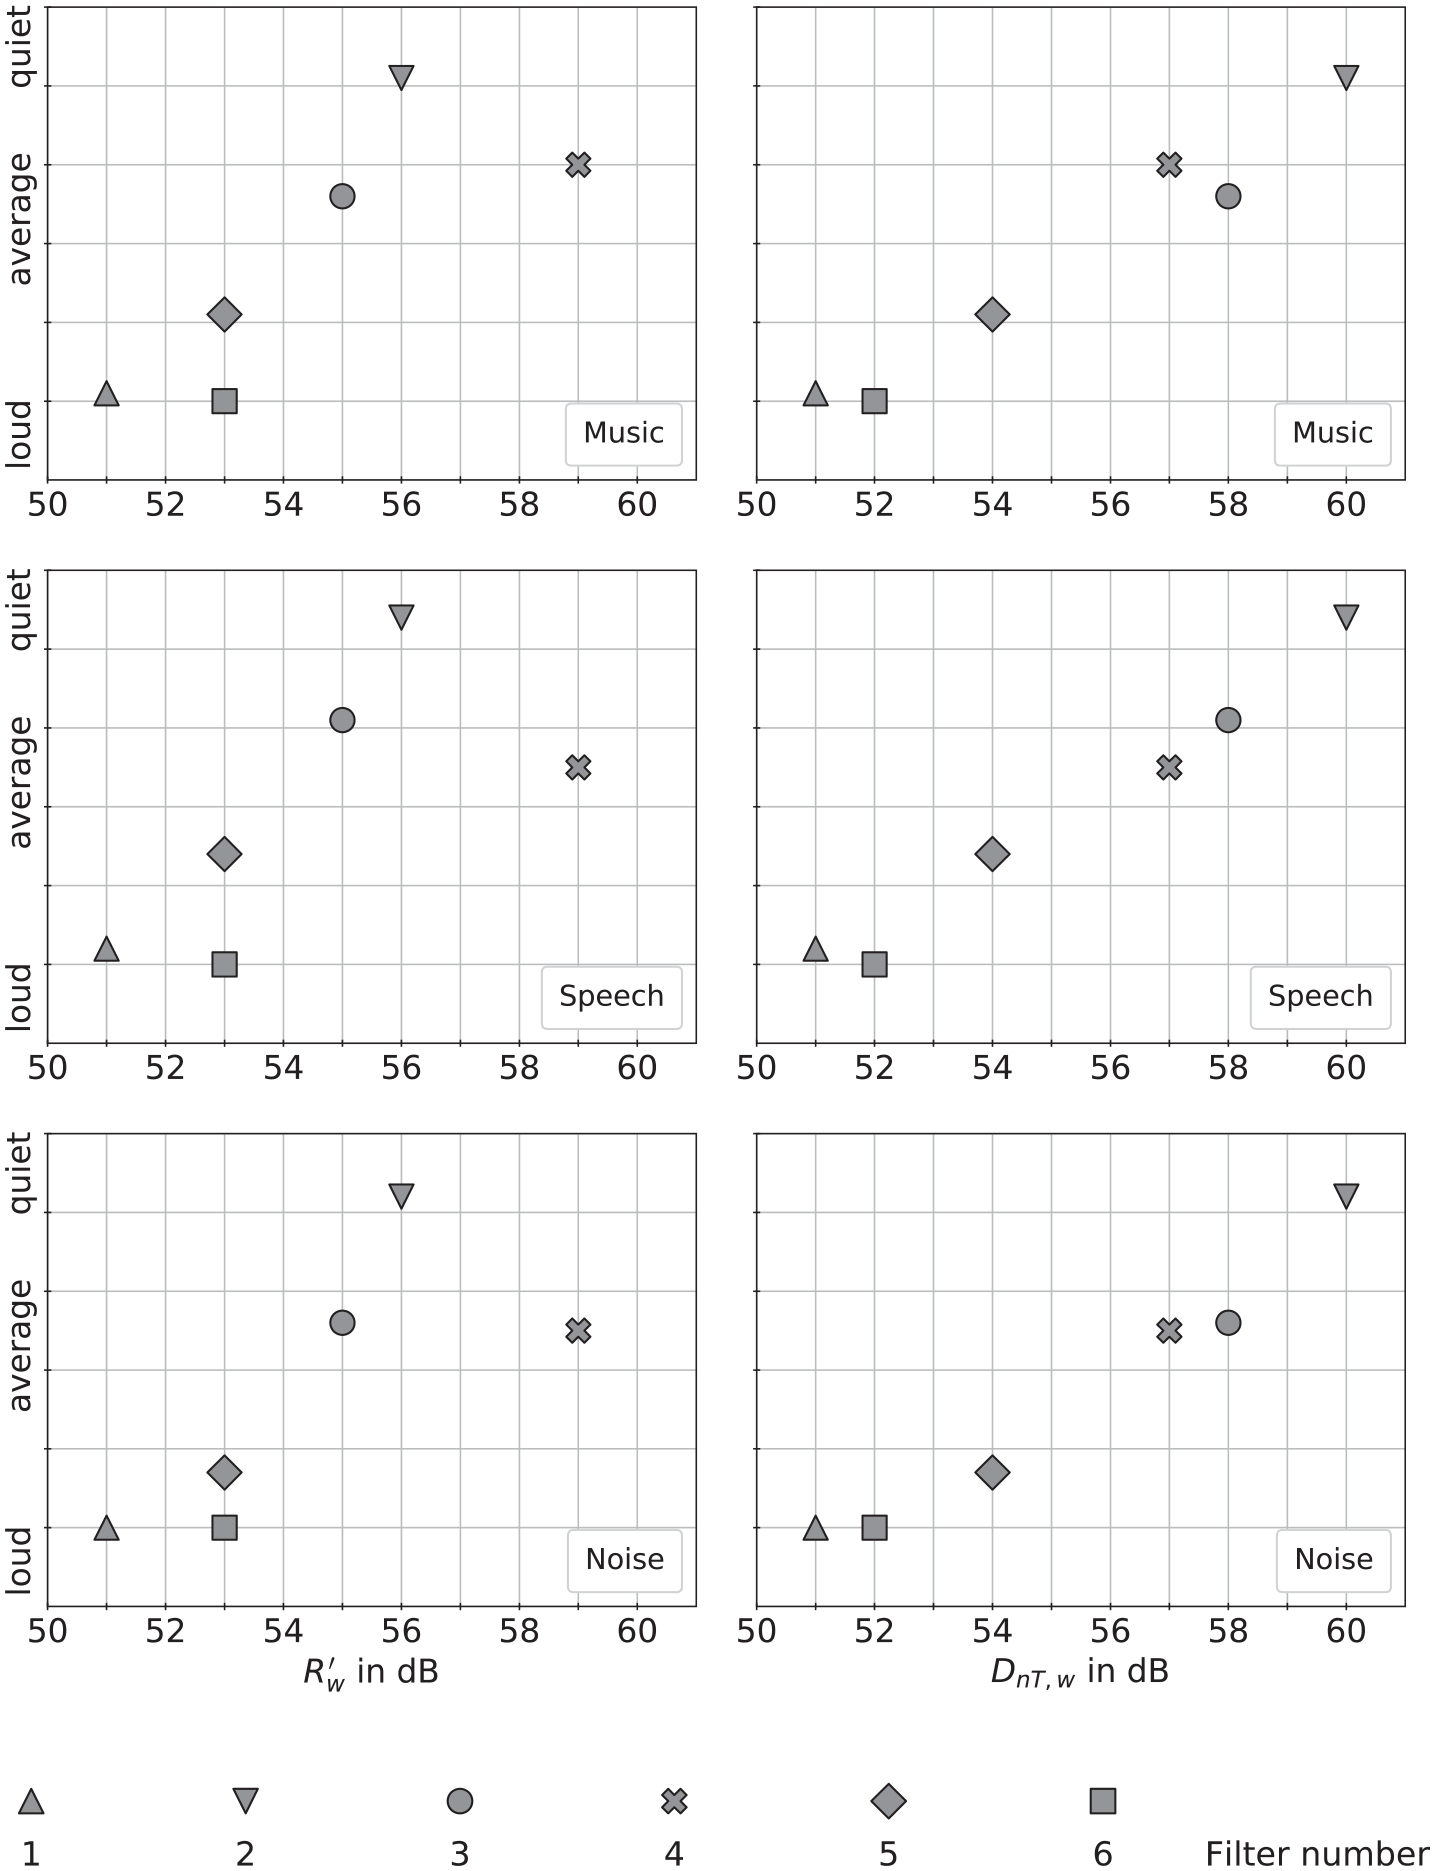
Results of the listening test separated by signal type. The symbols in the graphics correspond to the particular filter number.
Test of the hypothesis
To test the hypothesis, the rank order correlation coefficient Spearman’s ρ was calculated by a comparison of the ranking of the subjective judgments with the ranking of the single number quantities R’w and DnT,w, respectively. In the calculation of the statistical significance for Spearman’s ρ values, the significance level for small sample sizes below 30 was applied by using the table of critical values. 16
According to this table, a particular value of the rank order correlation coefficient reaches significance, if the coefficient is greater than or equal to a corresponding table value, which leads to a rejection of the null hypothesis. In the present case, a critical value of 0.886 corresponds to a significance level of 0.05. The evaluation of the rank order correlation coefficient was carried out according to the calculation methods in Sheskin. 16
The results of the rank order correlations along with the critical value are shown in Figure 6. It becomes apparent, that all of the rank order correlation coefficients concerning R’w lie below the critical value. Thus, contrary to the hypothesis, there is no significant correlation between the subjective judgments and the measure R’w.
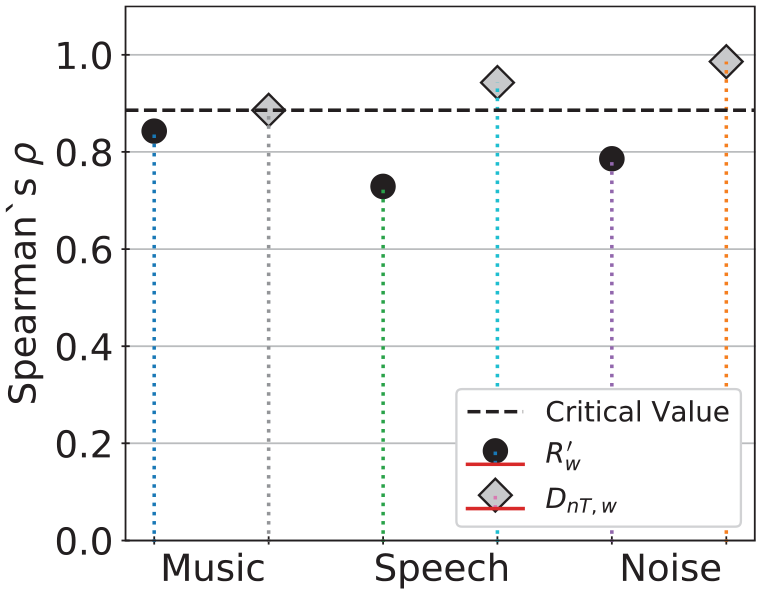
Graphic representation of the rank order correlation coefficients Spearman’s ρ between the subjective judgments and the single number quantities R’w and DnT,w.
Concerning the measure DnT,w, the rank order correlation coefficients are equal to or greater than the critical value 0.886, which means that correlations between subjective judgments and the quantity DnT,w reach statistical significance across all signal types.
Discussion and conclusions
Discussion
The results of the listening test show that the subjective judged sound, which is named in this study as “subjective loudness,” are significantly correlated to the values for DnT,w, whereas the correlation between subjective judgments and R’w does not reach significance. This applies to all different signal types, that is, speech, music, and pink noise. In detail, a comparison of the judgments with respect to the signal type shows a better perception of subjective judgment differences for the music and speech signals compared to the noise signal as it results from the judgments of the sounds for filter 5 and 6.
Another finding can be extracted by the judgments of the sounds for the filter pairs 2 and 3 as well as 5 and 6. Value differences of DnT,w of 2 dB are judged with equal distance of the subjective judgments independent from the amount of the DnT,w-values. From this it can also be deduced, that level differences of 2 dB are actual perceptible whereas differences of 1 dB could hardly be precepted. This is also observed from the judgments of filter 5 and 6 regarding the measure R’w. Although there is a distinct difference of the subjective sound level determined by the participants, the R’w-values exhibit comparable values. So, there is an equal sound insulation of the underlying separating structure but with different judged sound insulation. The opposite is the case when considering the judgments of the filter pairs 3 and 4, where an unexceptional equal subjective sound insulation with a corresponding large difference of the R’w values can be observed.
Overall, it is expected that the characterization of the sound insulation with the measure R’w leads to a conservative interpretation of sound insulation.
Conclusions
In the present study, a listening test was conducted using measurement data of airborne sound insulation in dwellings to compare the relations between the subjectively perceived sound insulation and the single number quantities R’w and DnT,w, respectively. The participants’ judgments showed a stronger relationship with the values of the measure DnT,w than with the values of R’w.
The present results confirm the results of COST Action TU0901 and the statement in ISO 16283-1 that compared to DnT, R’ has a weaker connection to the subjective impression of airborne sound insulation. To validate the results of this listening test further research in laboratory and field settings is suggested.
Footnotes
Declaration of conflicting interests
The author(s) declared no potential conflicts of interest with respect to the research, authorship, and/or publication of this article.
Funding
The author(s) received no financial support for the research, authorship, and/or publication of this article.
