
Abstract
The process of selecting candidates for representative assemblies is a key aspect of democratic governance. We examine how political parties, particularly in quasi-open list proportional representation systems like the Netherlands, weigh candidates’ previous electoral performance in renomination decisions. We propose that different kinds of parties weigh candidates’ popularity and their partisanship differently. Therefore, some parties are more sensitive to electoral performance. Specifically, we look at the differences between branches of national parties and independent local parties, where the latter may be more responsive to the electorate. We test our hypotheses on candidates running in 2018 and 2022 municipal elections in the Netherlands. This provides us with a rich dataset, covering more than 5000 parties running in more than 300 municipalities fielding more than 80,000 candidates while maintaining consistent societal and institutional contexts. Our study enhances our understanding to what extent parties prioritize candidates’ popularity, shedding light on the complexities of candidate selection and renomination decisions.
Introduction
The most important function of political parties is to select candidates for public office. Often referred to as the “secret garden of politics” (Gallagher and Marsh, 1988), this process is difficult to observe directly. Different strategies have been employed to get at this process: experiments on political elites (Berz and Jankowski 2022), qualitative interviews (Vandeleene 2024) and analyses of the outcomes of decision making (André et al., 2017). These have given us important insights into how political parties select the individuals who will stand for election and who will hold positions of power. In the process of selection, the ability of candidates to attract votes is an important criterion as shown by qualitative, experimental and observational analyses (Vandeleene 2024; Crisp et al., 2013; Jankowski and Rehmert, 2022). A solid predictor of a candidate’s ability to gain votes in future elections is their performance in earlier ones (André et al., 2017).
Yet, we also know that some parties seek to weigh the popularity of their candidates by their willingness to toe the party line (Crisp et al., 2013; Dodeigne et al., 2019; Vandeleene 2024). One might be able to put the most popular individual in a town on the party list, but if that person does not agree with the ideology of the party, then that is invitation for political unrest in the subsequent council term. Our core argument is that for different kinds of parties may popularity and partisanship differently. Specifically independent local parties may prioritize popularity more than branches of national parties, as they lack a comprehensive national ideology that every candidate has to subscribe to and value responsiveness to the local community more than national parties (Boogers and Voerman 2010; Otjes 2018, 2020, 2024). We propose that for these parties proven electoral popularity plays a larger role in renomination decisions that in branches of national parties. Our central research question is: how do votes in earlier elections play a role in favorable renomination by independent local parties and branches by national parties?
Our study focuses on a (quasi-)open list proportional representation system. These systems are quite common worldwide, particularly in Europe. Here, parties order candidates on lists and voters can cast a preference vote for one or more specific candidates. These votes often do not affect the election of most candidates, as the list order determines who is elected and only a few candidates are elected on the basis of preference votes. Yet, candidates engage in personal vote-seeking behaviour (André et al., 2017; Put et al., 2021). When selection committees take these preference votes into account when candidates are renominated in subsequent election, this behaviour of individual candidates is rational. We apply the logic developed in earlier research to local elections in the Netherlands.
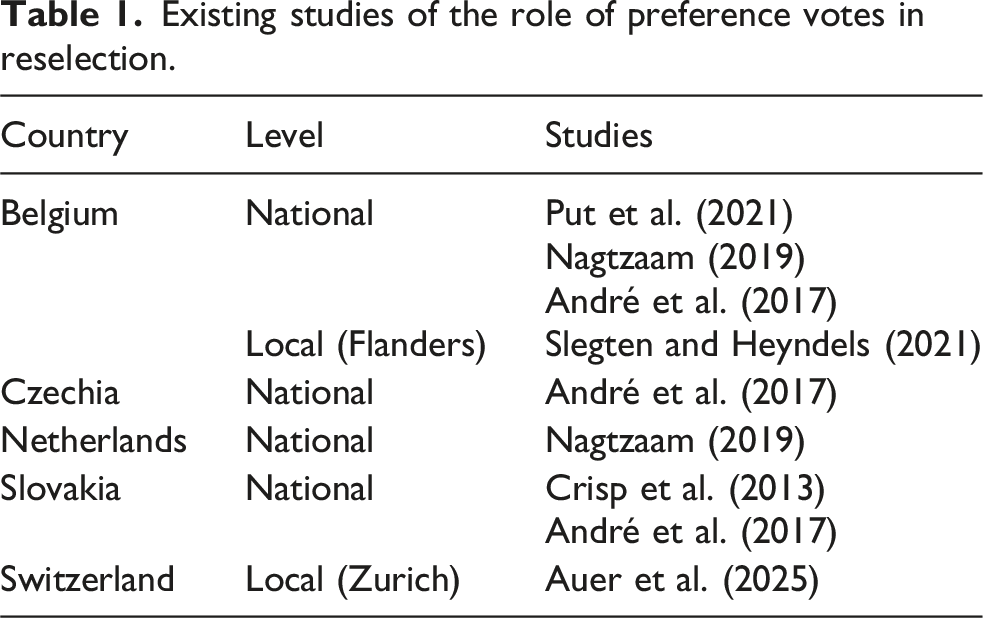
Existing studies of the role of preference votes in reselection.
Popularity and renomination
One of the most important functions of political parties is the selection of candidates for parliamentary elections. When selecting candidates, parties may be sensitive to electoral performance. We can see this in qualitative, observational and experimental analyses. André et al. (2017) cite national-level politicians from Belgium who emphasize that “[p]reference votes are super important for the next nomination process” and that “preference votes are more important than even the work that you do.” Vandeleene (2024), who systematically interviewed members of candidate selection committees in Belgium, notes the ability of candidates to garner votes is an important criterion for parties, more important than competence, as one interviewee say: “[t]he first quality of a candidate is to be well-known”. They also note that they take preference votes into account: “[i]f the score goes up, it’s a good sign and we want him back. If his score goes down, we may say that his time has passed and that we should think of someone else”.
Studies by Crisp et al. (2013), André et al. (2017), Nagtzaam (2019), Slegten and Heyndels (2021), Put et al. (2021) and Auer et al. (2025) show that in open or quasi-open list systems, list position reflects the electoral performance of candidates in previous elections. In open or quasi-open systems individual votes are pooled for the purpose of dividing seats over parties: that is, the more preference votes each candidate on the list is able to garner, the better the result for their party. Therefore, parties have an incentive to maximize the number of total votes for their party by favoring candidates capable of winning preference votes (André et al., 2017). While candidates with good looks, a strong media presence, a sociable personality, verbal qualities and community ties may be able to garner support, the best predictor of a candidate’s future ability to gain votes is their earlier performance (André et al., 2017; Crisp et al., 2013). By rewarding candidates that get more preference votes than expected, parties also give candidates an incentive to spend their time on obtaining preference votes (Crisp et al., 2013; Meriläinen and Tukiainen 2018). Politicians who get more preference votes may also feel more entitled to a better position and giving them what they want may be way to prevent conflict (Meriläinen and Tukiainen 2018; Slegten and Heyndels 2021). Moreover, earlier election results are public proof of a candidate’s popular appeal, by selecting these candidates, parties can signal to voters that they are listening to them (André et al., 2017). Putting popular candidates low on the list can alienate supporters (Crisp et al., 2013; Folke et al., 2016). Already in the 1950s, Van Raalte (1959, p.86) noted that Dutch parties “take good care to present their candidates in sequence that will not ensure the displeasure of their supporters”. All in all, we have good reason to believe that candidates who do well in terms of getting preference votes will be rewarded by a higher list position in the future.
The importance of popular appeal is also supported by experimental research on selection criterion in party elites, popular appeal so far has been an additional attribute that is incorporate into (conjoint) experiments. Results show that party elites prefer candidates who have the potential to attract personal votes (Jankowski and Rehmert, 2022) or to engage with the media (Grahn and Thisell 2024). (1)
Independent local parties
One important choice that the selection committee of a party faces is the choice between popularity and partisanship (André et al., 2017; Berz and Jankowski 2022; Crisp et al., 2013; Dodeigne et al., 2019; Grahn and Thisell 2024; Vandeleene 2024) popular candidates will help the party to gain votes, while candidates that subscribe to the party’s ideology will allow the party to present a clear brand, which may also pay off electorally but will mainly help the party pursue its policy goals (Dodeigne et al., 2019). Interviews by Vandeleene (2024) show that selection committees do not prioritize popularity over everything or lose sight of partisanship completely: “I wouldn’t go and approach someone who is well-known but I’m not sure that […] she shares at least some of my convictions, core values or vision for society. I would have a problem with that.” Crisp et al. (2013) describe the trade-off that parties face in greater detail: parties desire candidates that are both popular and partisan, yet often individual candidates can improve their standing with voters by going in against the established party line.
The extent to which parties have a clearly defined ideology that representatives are expected to follow differs across party types. Independent local parties run in local elections in many European democracies (Otjes 2020). These are parties that run in one municipality without ties to any national party (Åberg and Ahlberger 2015) and often pride themselves on not having an ideology (Boogers and Voerman 2010). That means that compared to national parties, they can be open to more candidates as people who run on their lists do not have to subscribe to a comprehensive national ideology. Moreover, many of these independent local parties have a localist orientation. They emphasize that they represent the interest of the community and are responsive to its needs (Otjes 2024): this responsiveness might express itself in promoting candidates that are embraced by the community in the form of preference votes. On average, branches of national parties are less localist than independent local parties and are therefore less likely to prioritize responsivity in the form of selecting popular candidates. Finally, independent local parties generally have less difficulty in finding candidates than national parties (Boogers and Voerman, 2018: p. 37). A party that had a large number of potential candidates can likely select candidates that are both loyal and popular. For a party that has only a few potential candidates prioritizing loyalty likely comes at the cost of popularity. For these three reasons, it seems likely therefore that in independent local parties electoral popularity plays a larger role in renomination decisions than in national parties. (2)
Case selection
This study examines the relationship between preference votes and list position in the Netherlands at the local level. Open or Quasi-Open List PR is used in national elections over 40 countries on four continents: from Albania and Brazil to Congo and Sri Lanka. 1 Table 1 lists the existing studies of these systems. Belgium has been studied most intensively, both at the national and the local level. In addition, there are studies of Czechia, the Netherlands, Slovakia and Zurich (Switzerland). We examine the Dutch local context, because of the availability of all lists of all candidates running in local elections in 2014, 2018 and 2022. Slegten and Heyndels (2021) and Auer et al.’s (2025) have already shown that this national mechanism can be transferred to the municipal context. We focus on a single country to keep formal institutions and political culture constant while at the same time having access to a large number of cases. Compared to other systems, the Dutch system of List-PR is quite closed, as candidates need 25% of the votes needed for a single seat to win a preference seat (50% in municipalities with fewer than 25,000 inhabitants). This makes it less likely to find an effect of preference votes as they do not often affect the composition of legislatures.
As Otjes (2018) details independent local parties are present in many European democracies, including Austria, Belgium, Denmark, Finland, Germany, the Netherlands, Portugal, Norway, Spain and Sweden. Their vote shares differ from marginal (in Finland with about 2%) to large (e.g., Germany with over a third of the vote). In 2022, independent local parties won 31% of the vote in the Netherlands. Given their prevalence in the Netherlands, it is likely that we can observe significant patterns here. This may be less likely on other countries, merely because independent local parties are a marginal phenomenon in some other countries. All in all, there are reason that would lead one to believe that preference votes matter less in the Netherlands than elsewhere but that here, we are more likely to observe significant patterns for independent local parties specifically.
Methods
Data
Elections, parties and candidates included in the analyses.
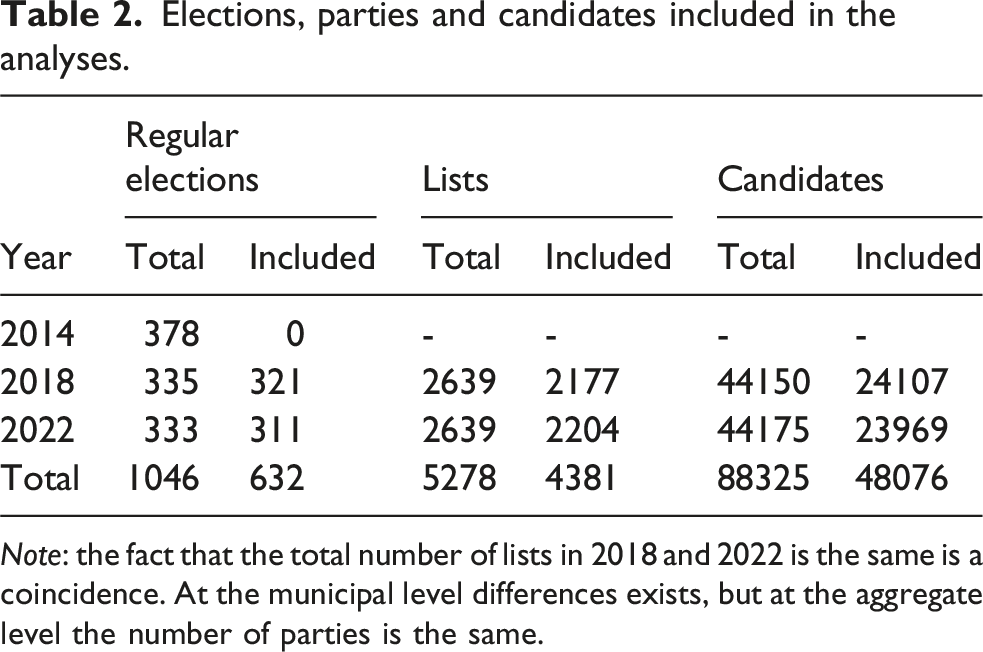
Note: the fact that the total number of lists in 2018 and 2022 is the same is a coincidence. At the municipal level differences exists, but at the aggregate level the number of parties is the same.
The next step was determining whether the parties participating in these 632 elections, also participated in the previous election. As can be seen in Table 2, 5, 278 parties participated in these elections. In 2018, 2177 political parties also participated in the 2014 elections; and in 2022, 2204 political parties also participated in the 2018 elections. This makes a total of 4381 party lists which could be included in our analyses.
The average list has 25 candidates (standard deviation 12 candidates, median 23). 84 lists (less than one percent of all lists presented in 2018 and 2022) had one candidate. 12,450 (eight percent) had 50 candidates. These list lengths are ambitious given that the average council has 27 seats. On average lists have 0.99 candidate per council seat.
The final step in creating the subset of the data on which we will base our analyses was selecting those candidates who participated in two subsequent elections for the same party. 2 Table 2 also shows the number of candidates for the 4381 parties a t = 0, and whether they were also a candidate in the previous election. Approximately half of the candidates (both in 2018 and 2022) also participated in the previous election (in 2014 and 2018 respectively). We focus our analyses on these candidates. In total, we have 48,076 candidates which we can use in the analyses.
The dependent variable: list position at t = 0
The main goal of our paper is to test whether electoral performance at a certain election (t = −1) influences the list position of a candidate at the next election (t = 0). Therefore, our dependent variable reflects the list position of a candidate at election t. Our key dependent variable therefore is list position normalized for list length (‘relative list position’) 3 . We normalize for list length because, as we noted above, the number of candidates per lists varies quite a bit. A shift from place 4 to place 3 on a list of 5 candidates is of a different order than the same shift on a list of 50 candidates. The normalized value ranges from 0 to 1. For this direct measurement it is important to include list position at t = −1 as a control variable. It is crucial to understand that lower values reflect a better list position and that negative coefficients thus mean that higher scores on the variable is associated with an improvement of the list position. We present analyses looking at this dependent variable in the main text (Table 5).
In the literature different operationalizations have been employed which have their own advantages and disadvantages. In previous research, the decimal logarithm of a candidate’s list position at t = 0 has been used as the dependent variable (André et al., 2017: p. 594; Nagtzaam, 2019: p. 112). The advantage of this logarithmic transformation is that it models that it is likely more difficult to shift in the top of the list then at the bottom of the list. The disadvantage of this operationalization is that the results of the model become less intuitive. We look at the logged list position in Appendix A. Alternatively, one could look at the untransformed list position at t = 0. With this operationalisation interpretation becomes easier, as one step of the coefficient represents the number of places one shifts up or down. The drawback of this method is that it treats very different situations as identical. Under any circumstance such direct measurements require that we include list position at t = −1 as a control variable.
An alternative operationalization compares list position at t = −1 and t = 0 in the dependent variable itself, by calculating the difference between both positions. A positive value on this variable means that a candidate is placed more towards the top of the list a t = 0, compared to t = −1 (and thus receives a ‘better’ list position). This would be a good variable to capture whether electoral performance is rewarded (or punished) because it directly compares the list positions of a candidate in the two elections. Using this variable as an interval-ratio scale would result in the same model when we use the untransformed list position as the dependent variable. Here, we could also use the relative difference as an alternative variable instead of the absolute difference between the two list positions. While this perhaps represents a more direct measurement of the variable of interest, it is more difficult to understand as we now model the size of the shift, not the actual list position. We look at the difference in the absolute and relative list position in Appendix A.
Measuring the preference votes at t = −1
The key predictor is the candidate’s electoral performance at t = −1. We know from previous research that the list position of a candidate has the most influence on preference votes (e.g., Miller and Krosnick, 1998; Van Erkel and Thijssen, 2016). Therefore, taking the absolute number of preference votes (or even as a percentage of the total votes cast for a party) would result in a measurement of electoral performance which is strongly influenced by list position. In line with previous research (André et al., 2017; Nagtzaam, 2019; Put et al., 2021) we therefore use rank difference as an indicator of electoral performance 4 .
We calculate rank difference by taking the difference between list position and the rank order of candidates by voters. The voter ranking is determined by sorting the candidates based on the number of votes they received.
5
The rank difference is of course influenced by number of candidates on a list. If the list is longer, rank difference can take higher values. Therefore, we present our models by using the relative rank difference (calculated by dividing rank difference by the number of candidates on the list). The formula is: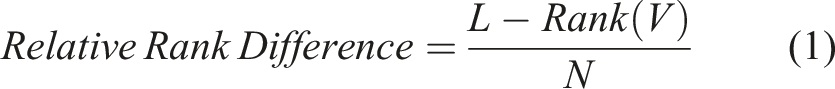
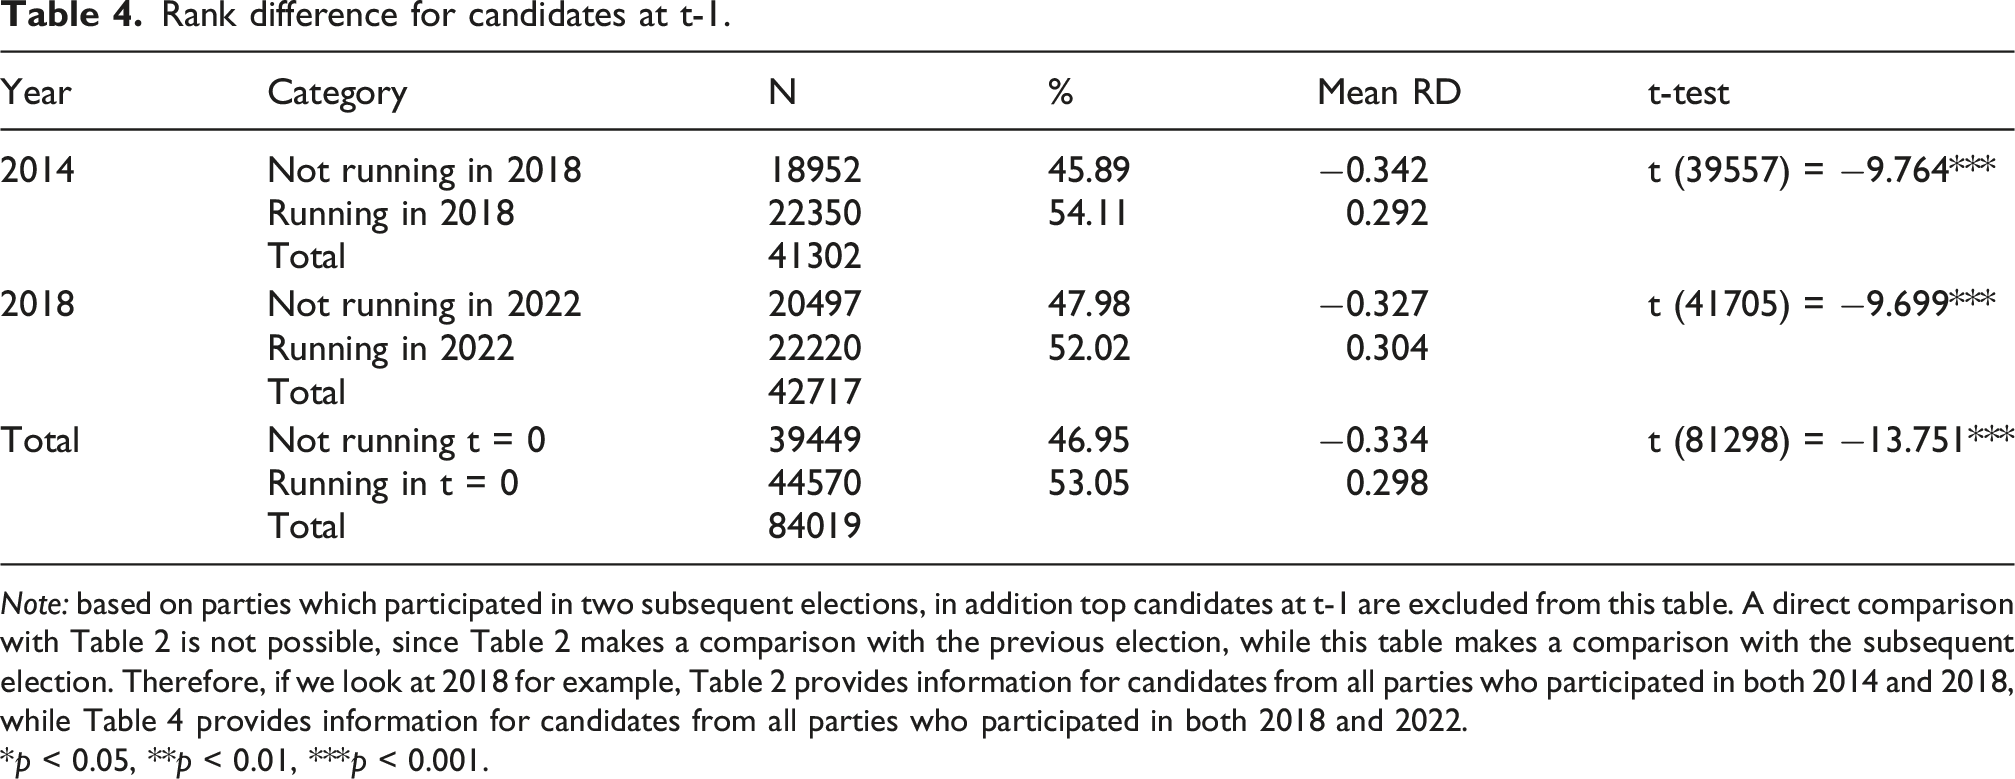
Rank difference for candidates at t = 0.
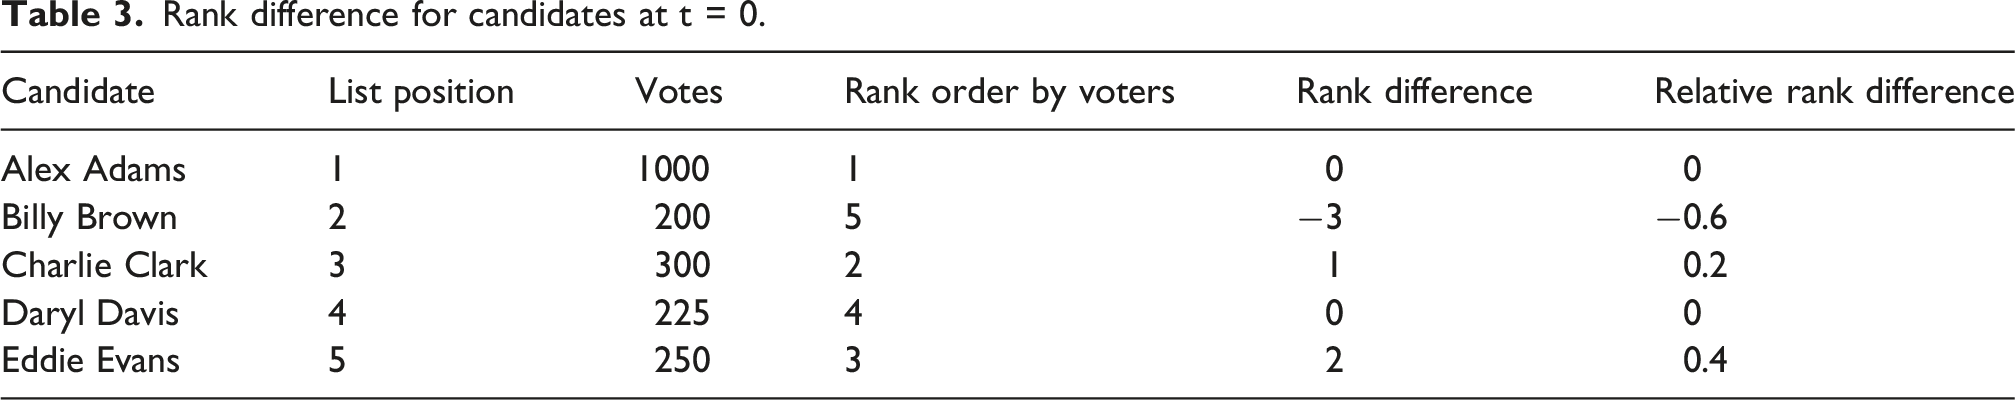
Figure 1 shows the distribution of relative rank differences at t = −1 for all participating candidates.
6
As one can see here most candidates have a rank difference around zero. This shows that in general voter ranking resembles party ranking, although there are some (big) differences as well. A first indication of whether this rank difference has an influence on the candidate selection process is whether there is a relation between rank difference at t = −1 and whether candidates participate at election t = 0 again. Table 4 shows the number of candidates participating in 2014 and 2018 for parties who also participated in respectively 2018 and 2022. As we saw earlier approximately half of the candidates participates in the next election as well. We already see an interesting pattern in this table: candidates who run again in a subsequent election on average have a higher rank difference. These differences are significant as shown by the reported t-tests in Table 4. In Appendix E we present logistic regression models, predicting whether a candidate returns at t = 0, using rank difference at t = −1 as the main predictor and list position and local party as control variables. We present different models with absolute rank difference and relative rank difference, both for 2014 and 2018. In all models a positive rank difference has a significant and substantial effect on the chances of returning for the next election. Relative rank difference at t-1. Rank difference for candidates at t-1. Note: based on parties which participated in two subsequent elections, in addition top candidates at t-1 are excluded from this table. A direct comparison with Table 2 is not possible, since Table 2 makes a comparison with the previous election, while this table makes a comparison with the subsequent election. Therefore, if we look at 2018 for example, Table 2 provides information for candidates from all parties who participated in both 2014 and 2018, while Table 4 provides information for candidates from all parties who participated in both 2018 and 2022. *p < 0.05, **p < 0.01, ***p < 0.001.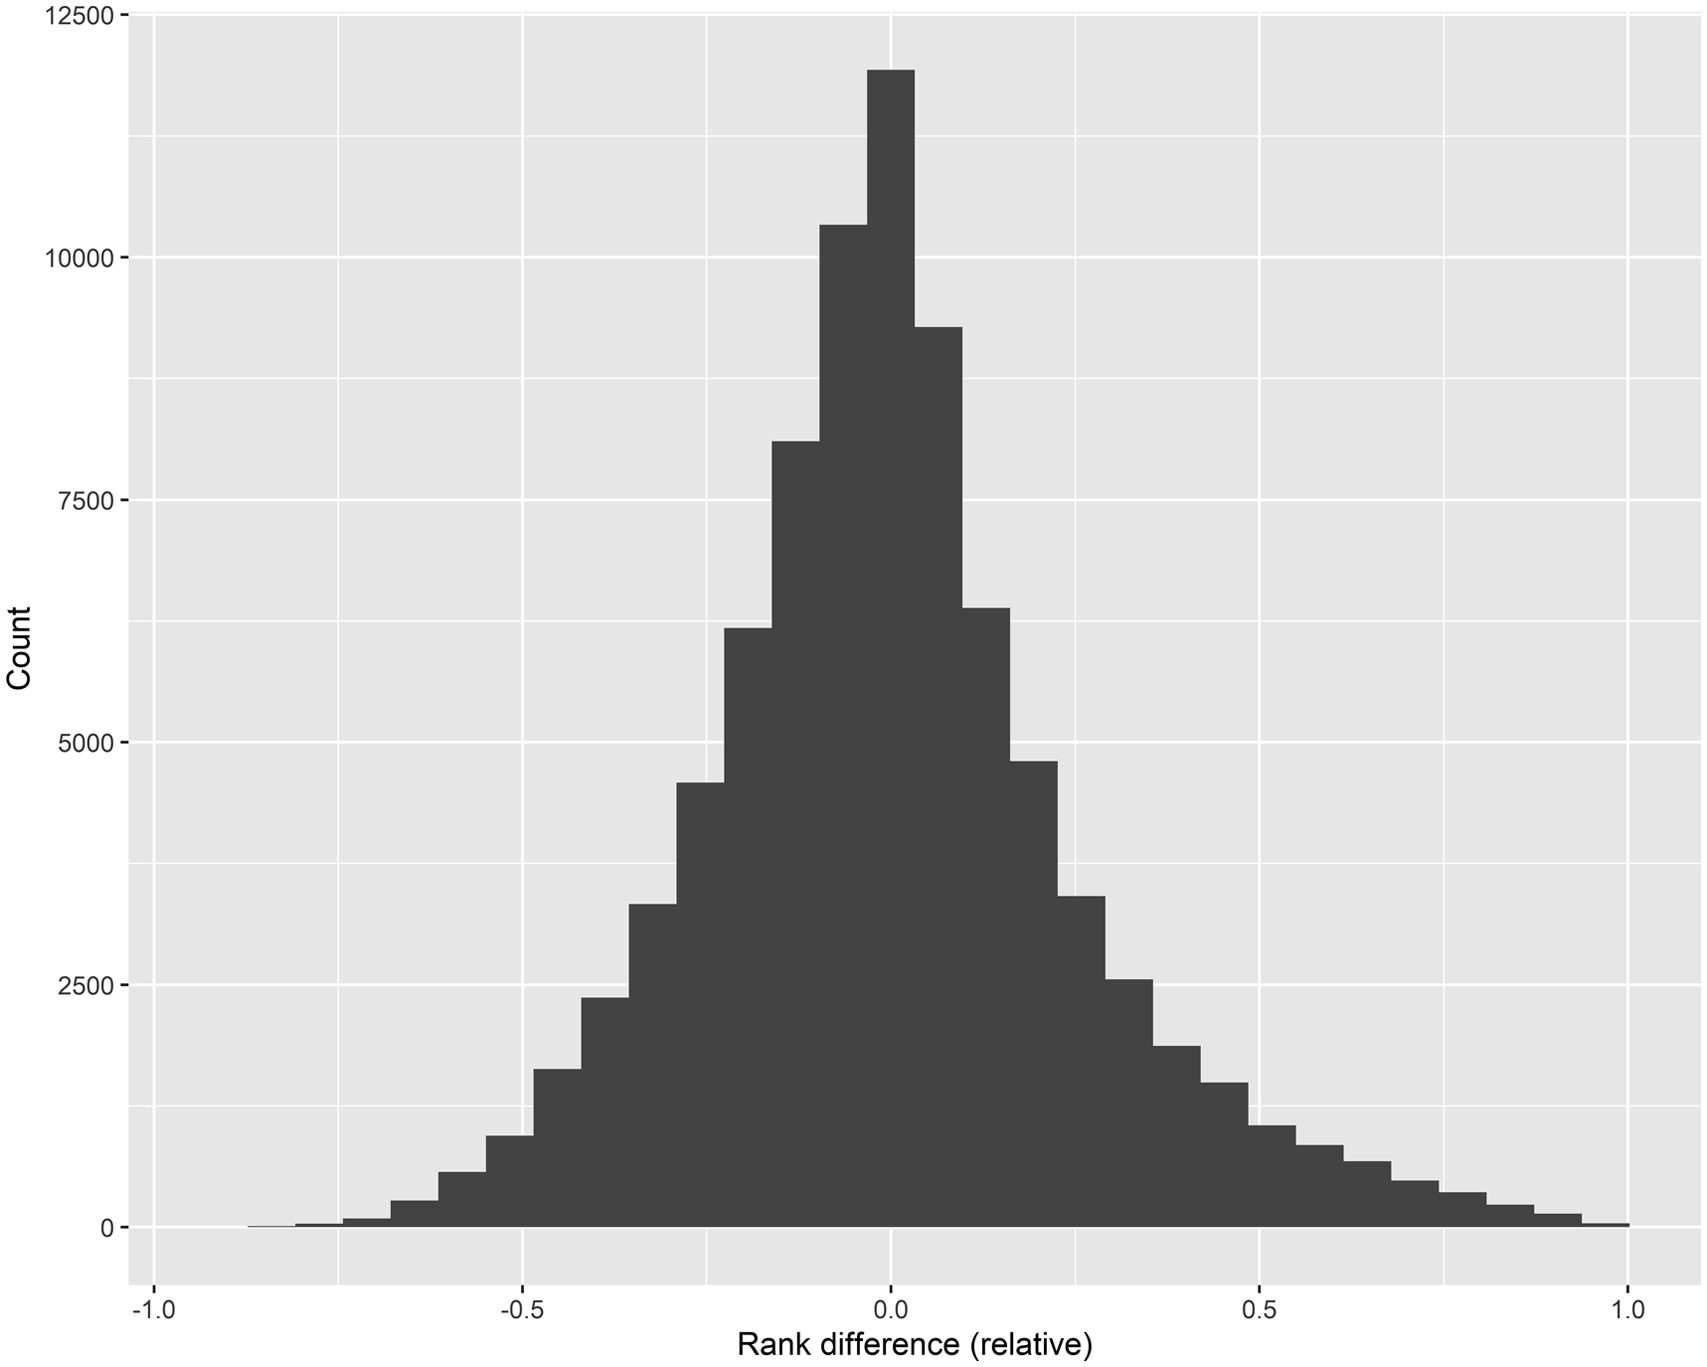
Other independent variables
To test the independent local party hypothesis, we add a binary variable whether a candidate is on a local or a national list and to test the independent local party hypothesis. We derive the assignment to national and independent local party from Otjes (2024).
We know from observational and experimental research that experience plays an important role for the candidate selection process (Berz and Jankowski 2022; Ceyhan 2018; Chiru and Popescu 2017; Gherghina and Chiru 2010; Grahn and Thisell 2024; Jankowski and Rehmert, 2022; Nagtzaam 2019; Put et al., 2021; Rehmert 2022; Slegten and Heyndels 2021). We use data collected by De Natris (2024) on whether candidates in 2018 and 2022 were members of the municipal council shortly before the election.
Second, we include list position at t = −1 as a control variable. List position at t = −1 is added to be able to estimate the difference between the list position at t = −1 and at t = 0 (the dependent variable). We use the normalized list position (ranging between zero and one). If one does not include one cannot get an unbiased estimate of the bivariate relationship between relative rank difference at t = −1 and relative list position at t = 0. In addition, list position at t = −1 serves as an indicator for other candidates’ personal characteristics that makes them a more attractive candidate which are not directly added to the model.
Third, we include the number of council seats. The number of council seats likely reflects the number of seats the party expects to win. The more seats a party has, the more candidates are likely to apply for the list. This makes competition harder, and therefore the average candidate is likely to get a worse position than if there are a few candidates running.
Model specification
As our candidates are organized by party and the observations are not independent between parties, we run multilevel models that include party-level random intercepts. To test the independent local party hypothesis, we add an interaction between rank difference and being an independent local party.
In our analyses, we exclude the first candidate on the list (top candidate or list puller), for conceptual and analytical reasons. Our first reason is conceptual: in the Netherlands, all votes are cast for candidates. However, for many voters only the party matters. Most of these voters vote for the first candidate (the party leader). We are interested in the effect of preference votes on list position at the next election. Since votes for the first candidate on the list are not truly considered preference votes in the Netherlands, it would not make sense to include them in the analysis. Our second reason is analytical: the first candidate normally receives most votes. Since they cannot be promoted to a better list position, this would bias our results negatively as their result at best can be maintaining their position. This is further complicated by the fact that there are quite a few instances where a former first ranked candidate serves as a symbolic last ranked candidate in subsequent elections (list pusher). This is often done not as a sanction for bad performance, but as a result of the (former) party leader stepping down, having no intention to be elected again but only a sign of showing support for the party. In our analysis this would result in a very high negative rank difference. All in all, adding them to the analysis would add more noise to the analysis instead of improving it. Therefore, we exclude them from the main analysis but include them in Appendix D.
Results
Predicting list position for election t = 0.
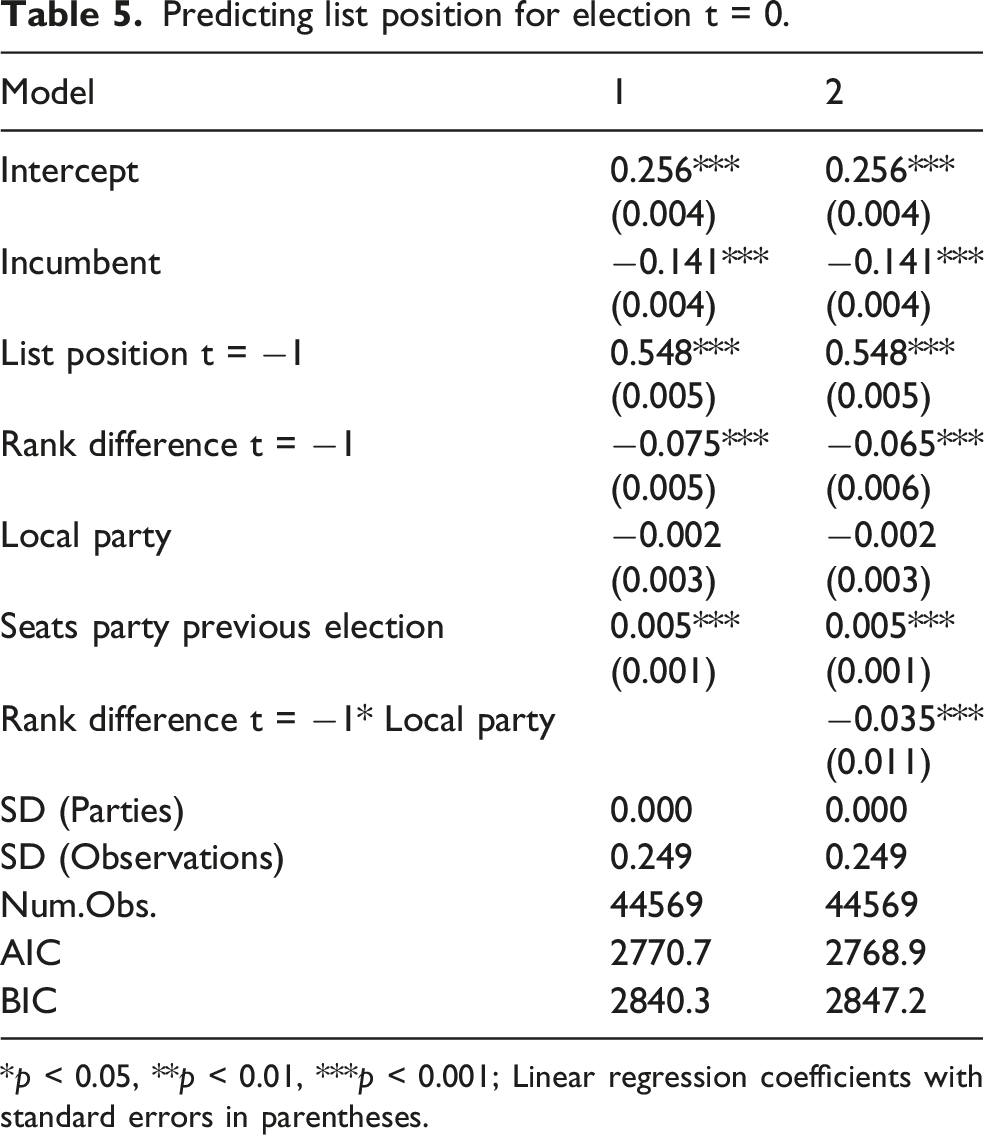
*p < 0.05, **p < 0.01, ***p < 0.001; Linear regression coefficients with standard errors in parentheses.

Party Type and Relative Rank Difference and List Position (based on model 2).
Our central expectation is that candidates with more preference votes than expected get a better list position afterwards. Model 1 in Table 5 supports for this notion. Rank difference is significant and has a substantive impact: if we move from the most underperforming candidate to the least underperforming candidate, the list position improves by just less than a tenth of the length of the entire candidate list. Thus, if the list has 30 positions, the candidate is placed two places closer to the top of the list: e.g., from 16 to 14. These are relatively small effects.
Next, we turn to the difference between branches of national parties and independent local parties. We find that there is a small but significant effect. For candidates on lists of local parties their electoral performance matters more than for other candidates: the effect is relatively small. If we return to our list of 30 candidates: on a list of a national party, the shift from the best to the worst performing candidate is below two places: e.g., from 16 to 14. On a list of local party, the shift is around 3 seats: e.g., from place 16 to 13.
We controlled for earlier list position, incumbency and the number of council seats the party obtained in the previous election. List position matters strongly. If a candidate was placed at the top of the list in the previous election, they can expect a position on the first half of the list. Incumbency improves position by more than 10% of the list: on a 30-person list, incumbents are placed four seats closer to the best position than a candidate who is not an incumbent. The number of seats the party obtained in the previous election as a significant, but substantially small effect. Candidates from larger parties on average receive a slightly lower list position.
Robustness tests
In appendices we look at the robustness the findings above. In Appendix A, we look at alternative operationalizations of the dependent variable. In Model A1, we look at a logarithmic transformation of seat position. The underlying idea is that it is more difficult to move up higher on the list than it would be to move up on lower positions. In this model, we find that rank difference is related to a better (lower) list position and that this relationship is stronger for independent local parties. This conforms to our expectations. In Model A2, we look at absolute list position. We find here that rank difference affects list placement, with candidates who performed best compared to their list placement moving up two positions in branches national parties in comparison to the candidates who performed worst. For candidates of independent local parties, this shift is four seats. In Model A3, A4 and A5, we look at the difference between the previous and current list position. Model A3 looks at the relative list position. In that case we find as expect that for branches of national parties and for independent local parties, candidates with more preference votes than one would expect on the basis of their list position are placed higher on the list and this effect is stronger for independent local parties. In model A4 and A5, we use the absolute difference in list position, so we do not take into account changes in list position. There is a logic behind looking absolute list position: consider a situation where someone was on the second spot on a candidate list with 10 positions. They would get the relative position 0.11. Now the number of candidates is halved (from 10 to 5). They would get relative position 0.25. So, their position would appear to have weakened markedly without them actually changing position. If we look at shifts in absolute list position, the person who stays on place 2 does not shift. Both our expectations are confirmed when we look at absolute list position, when include relative and absolute rank difference. In terms of effect size, we find similar small but significant changes in these robustness tests. In the case of list position, these are instantly understandable: getting the best preference vote result (compared to the lowest expectation), moves one six positions up the list for national parties and nine for independent local parties. The logarithmic transformation was used in previous research. That allows for a direct comparison of effect sizes. Here we can look effect sizes in comparable studies as well (Nagtzaam 2019; André et al., 2017; Put et al., 2021). Our effect sizes are of comparable size of these studies, and relatively high. When focusing on the Dutch data the difference is more particularly striking: Nagtzaam’s (2019) national-level analyses indicated that rank difference did not have a significant effect on the placement of candidates.
In Appendix B, we look at different measures of electoral performance. Model A6 uses the absolute rank difference: that is not taking into account list length. In that case, candidates who did better than their list position suggest get worse position than those who did better, although this relationship (that goes against our expectations) is weaker for local parties. However, we believe that the absolute rank difference is not a good indicator for electoral performance. For example, if the absolute rank difference is 5, this has a very different meaning for a list with only 7 candidates compared to a list with 40 candidates. Therefore, we do not believe that this result undermines our main conclusions. Model A7 looks at the relative rank order of preference votes (so the candidate with the most votes get position 0, the candidate with the least votes gets position 1). It shows a positive relationship: candidates with a lower rank order get a lower place and this relationship is stronger for independent local parties. Model A8 looks instead at the share of votes of all candidates that a candidate got. We can see that the more votes a candidate got the lower their placement on the candidate list. This relationship is stronger for independent local parties.
In Appendix C, we provide two additional specifications with other control variables: the longevity of the party and the proportion of returning candidates. The inclusion of these control variables does not substantially alter the effect of rank difference, nor the interaction effect of rank difference and party family. We do find in Model A9 and A10 that returning candidates of parties that have participated in more elections tend to have a higher (worse) position (indicating that there may be more potential candidates in these parties). We find in Model A11 that the higher the share of returning candidates is, the better the position of returning candidates is. Model A12 however indicates that within parties with more returning candidates the effect of rank difference for returning is weaker than within parties with fewer candidates. That is: if a lot of candidates are returning the votes they got matter less than if a few candidates return.
In Appendix D, we include top candidates in our analyses, as we noted above, we expect this to muddle our results. Indeed, we find the same patterns as presented in Table 5 but slightly less strong. Instead of shifting just more than two seats on thirty-person national list and just more than three seats on thirty-persons independent local list, candidates now shift just below two and three seats.
Conclusion
This paper explored how political parties make decisions about candidates. Using the information of more than 80,000 candidates running on more than 5000 lists in over 600 elections across more than 300 municipalities in the Netherlands, we find that parties value the votes candidates got in previous elections and reward and sanction candidates based on this indicator. Preference votes alone have a relatively small effect on list position. On a list with 20 candidates, the candidate who most overperformed compared to their list position is placed two positions higher than the candidate who performed worst. Although the effect is small, it is comparable in size to those reported in existing studies.
We find that list position matters more for independent local parties. Independent local parties are parties without ties to national parties. Where many national parties need to weigh a candidate’s popularity against their willingness to subscribe to the national ideology of the party, independent local parties lack this constraint. Moreover, these parties — at least rhetorically —value responsiveness highly. We find, as expected, that independent local parties are more responsive to the local support a candidate has received when evaluating their list position: on a hypothetical thirty-person independent local party list the difference between the most overperforming and the least overperforming candidate is three seats.
What does this result say beyond the borders of local politics in the Netherlands? The open list proportional electoral system that we study is quite common, particularly in Europe. The results here likely travel to countries using these systems. The fact that we find similar patterns at the local level as found earlier in Flanders and Zurich reinforces the generalizability of our results (Auer et al., 2025; Slegten and Heyndels 2021). The fact that the Netherlands has a quasi-open electoral system, where preference votes matter less for the election outcome then elsewhere, make it likely that in other countries the effects of previous preference votes on list position may be stronger. The results for independent local parties speak directly to Open List-PR systems with strong independent local parties such as Belgium, Germany, Austria and Spain. Yet, this was only one variable to get at parties that have stronger or weaker party ideology. It may very well be that in general, in more pragmatic parties, popularity matters more than in more principled parties. We encourage research that uses other measures to get the difference between parties that value votes more and those that value principles more to build further on these findings.
This study also has some limitations. Most prominently, we do not make a distinction between realistic and unrealistic list positions: that is positions from which MPs are likely to be elected and positions from which MPs are unlikely to be elected. However, research in Belgium has shown that the effects of preference votes on list position (for parliamentary elections), hardly has an effect on realistic positions (Put et al., 2021). Put et al. (2021, p. 381) suggest that “party selectorates master the art of creating a perception of voter responsiveness”. Whether this also applies to the local political setting in the Netherlands might be the focus of further research.
Supplemental material
Supplemental Material - The effect of electoral performance on party renomination in national and independent local parties
Supplemental Material for The effect of electoral performance on party renomination in national and independent local parties by Hidde Van Slooten, Marijn Nagtzaam and Simon Otjes in Party Politics.
Footnotes
Acknowledgment
This article as based on Hidde van Slooten's thesis at Leiden University supervised by Simon Otjes. We thank Tom Louwerse, who acted as second supervisor, for his comments. This paper was previously presented at the 2025 Local Party Politics Conference. We are grateful to the participants at that conference and the anonymous reviewers of Party Politics for their comments and suggestions.
Funding
The authors disclosed receipt of the following financial support for the research, authorship, and/or publication of this article: This project was funded in part by funding from the Dutch Ministry of Home Affairs and Kingdom Relations and by an XS grant for Simon Otjes from the Dutch Science Council (406.XS.01.002).
Declaration of conflicting interests
The authors declared no potential conflicts of interest with respect to the research, authorship, and/or publication of this article.
Data Availability Statement
The data that support the findings of this study are openly available in dataverse at https://doi.org/10.7910/DVN/2WSPDL, ![]() .
.
Supplemental material
Supplemental material for this article is available online.
Notes
Author biographies
References
Supplementary Material
Please find the following supplemental material available below.
For Open Access articles published under a Creative Commons License, all supplemental material carries the same license as the article it is associated with.
For non-Open Access articles published, all supplemental material carries a non-exclusive license, and permission requests for re-use of supplemental material or any part of supplemental material shall be sent directly to the copyright owner as specified in the copyright notice associated with the article.