
Abstract
We address the question “can cross-country differences in ethnic diversity explain cross-country differences in tourism revenues and tourist arrivals?” Thus, using data from 141 countries, we examine the effects of ethnic diversity on tourism revenues and tourist arrivals. We measure ethnic diversity using indices of ethnic fractionalization and measure tourism revenue using total, direct and indirect tourism contributions to gross domestic product. We find detrimental effects of ethnic diversity. Our results are robust to alternative estimation approaches as well as alternative ways to measure ethnic diversity.
Introduction
The growth of the tourism industry is not homogenous across countries. The industry thrives and contributes significantly to gross domestic product (GDP) in certain countries but fails in others. Thus, a growing literature attempts to explain tourism growth and demand. This literature highlights several factors including the characteristics of the tourism destination country such as customer service satisfaction, infrastructure, culture, levels of terrorism, environmental factors as well as policy-related factors, income and price, among others (see, e.g. Crouch, 1994; Song and Li, 2008 for reviews). This study seeks to contribute to this literature by examining the role of ethnic diversity.
Conceptually, ethnic diversity could be negatively or positively related to tourism. First, several explanations are consistent with a positive relationship between ethnic diversity and tourism demand. For instance, evidence from Depetris-Chauvin and Özak (2016) suggests that, through the promotion of division of labour, ethnic diversity has a positive effect on trade, a major component that influences tourism. Due to specialization spurred by ethnic diversity, there is increased trade in the boundaries across ethnic groups. Further, when harnessed properly, the presence of diverse ethnic groups could engender the need for cultural preservation that creates or preserves a variety of historical tourist sites.
From another perspective, ethnic diversity could hinder tourism and decrease tourist arrivals as well as tourism revenue. In theory, countries that are highly fractionalized tend to suffer from low trust and social networks which hampers the accumulation of social capital. This has also been shown in the empirical literature (see, e.g. Leigh, 2006; Sturgis et al., 2011). The lack of social capital further hampers the sense of communalism needed to preserve heritage sites and thus acts as a disincentive for tourism demand. Ethnic diversity also hinders political stability and promotes corruption, thus creating an institutional environment that hinders tourism (see, e.g. Das & Dirienzo, 2010; Naudé & Saayman, 2005). Perhaps, and most importantly, as Fearon and Laitin (2003) observed, highly fractionalized countries tend to suffer civil unrests and sometimes armed conflicts – an environment that affects tourist arrivals and discourages the growth of tourism.
Thus, we explore and seek a better understanding of tourism demand and growth by examining the direct effects of ethnic diversity on the various measures of tourism revenue and tourist arrivals. Understanding this relationship is important as it adds to the literature that seeks to understand the determinants of tourism demand and growth. The findings suggest that in addition to factors discussed in the literature such as geography, climate and infrastructure, among others, sociopolitical factors such as ethnic diversity also have an important role in explaining the differences in tourism revenue and demand across countries.
Data and empirical model
We adopt a cross-sectional framework consistent with the existing literature on ethnic diversity (see, e.g. Alesina et al., 2003; Awaworyi Churchill, 2017). Thus, we run regressions of the form

Here, i denotes countries, TOURISM stands for the measures of tourism revenue and tourist arrivals. Tourism revenues are measured as total, direct and indirect contributions of the tourism sector to GDP. Data on tourist arrivals are drawn from the World Bank’s World Development Indicators database, while tourism revenue data are sourced from the World Travel and Tourism Council database. F represents the indices of ethnic fractionalization taken directly from Alesina et al. (2003) and for robustness, we use the measures of diversity from Ethnologue that are based on more recent census information.
1
We take the decadal average of tourism measures and our control variables from 2001 to 2010. Our baseline regressions are estimated using ordinary least squares (OLS) adjusted for heteroscedasticity and to address endogeneity, we use two-stage least squares (2SLS) regressions with the duration of human settlement and variations in land quality as instruments.
For our main set of results, regressions with the highest number of observations cover 141 countries. Table 1 presents a description and summary statistics of the variables used in our regressions. Online Appendix Table A1 presents a list of countries included in the analysis.
Description and summary of variables.
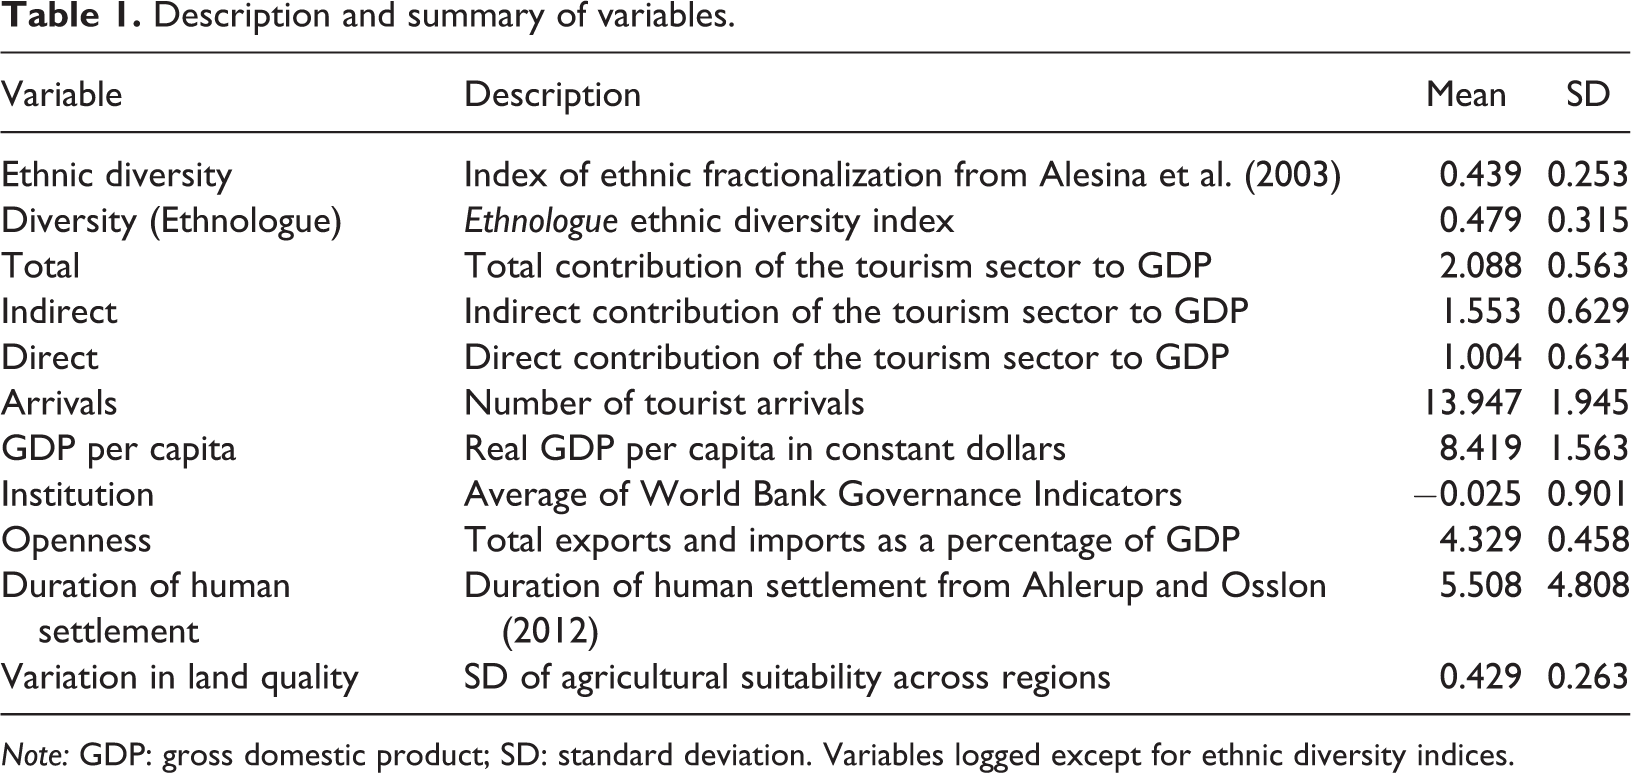
Note: GDP: gross domestic product; SD: standard deviation. Variables logged except for ethnic diversity indices.
Empirical results
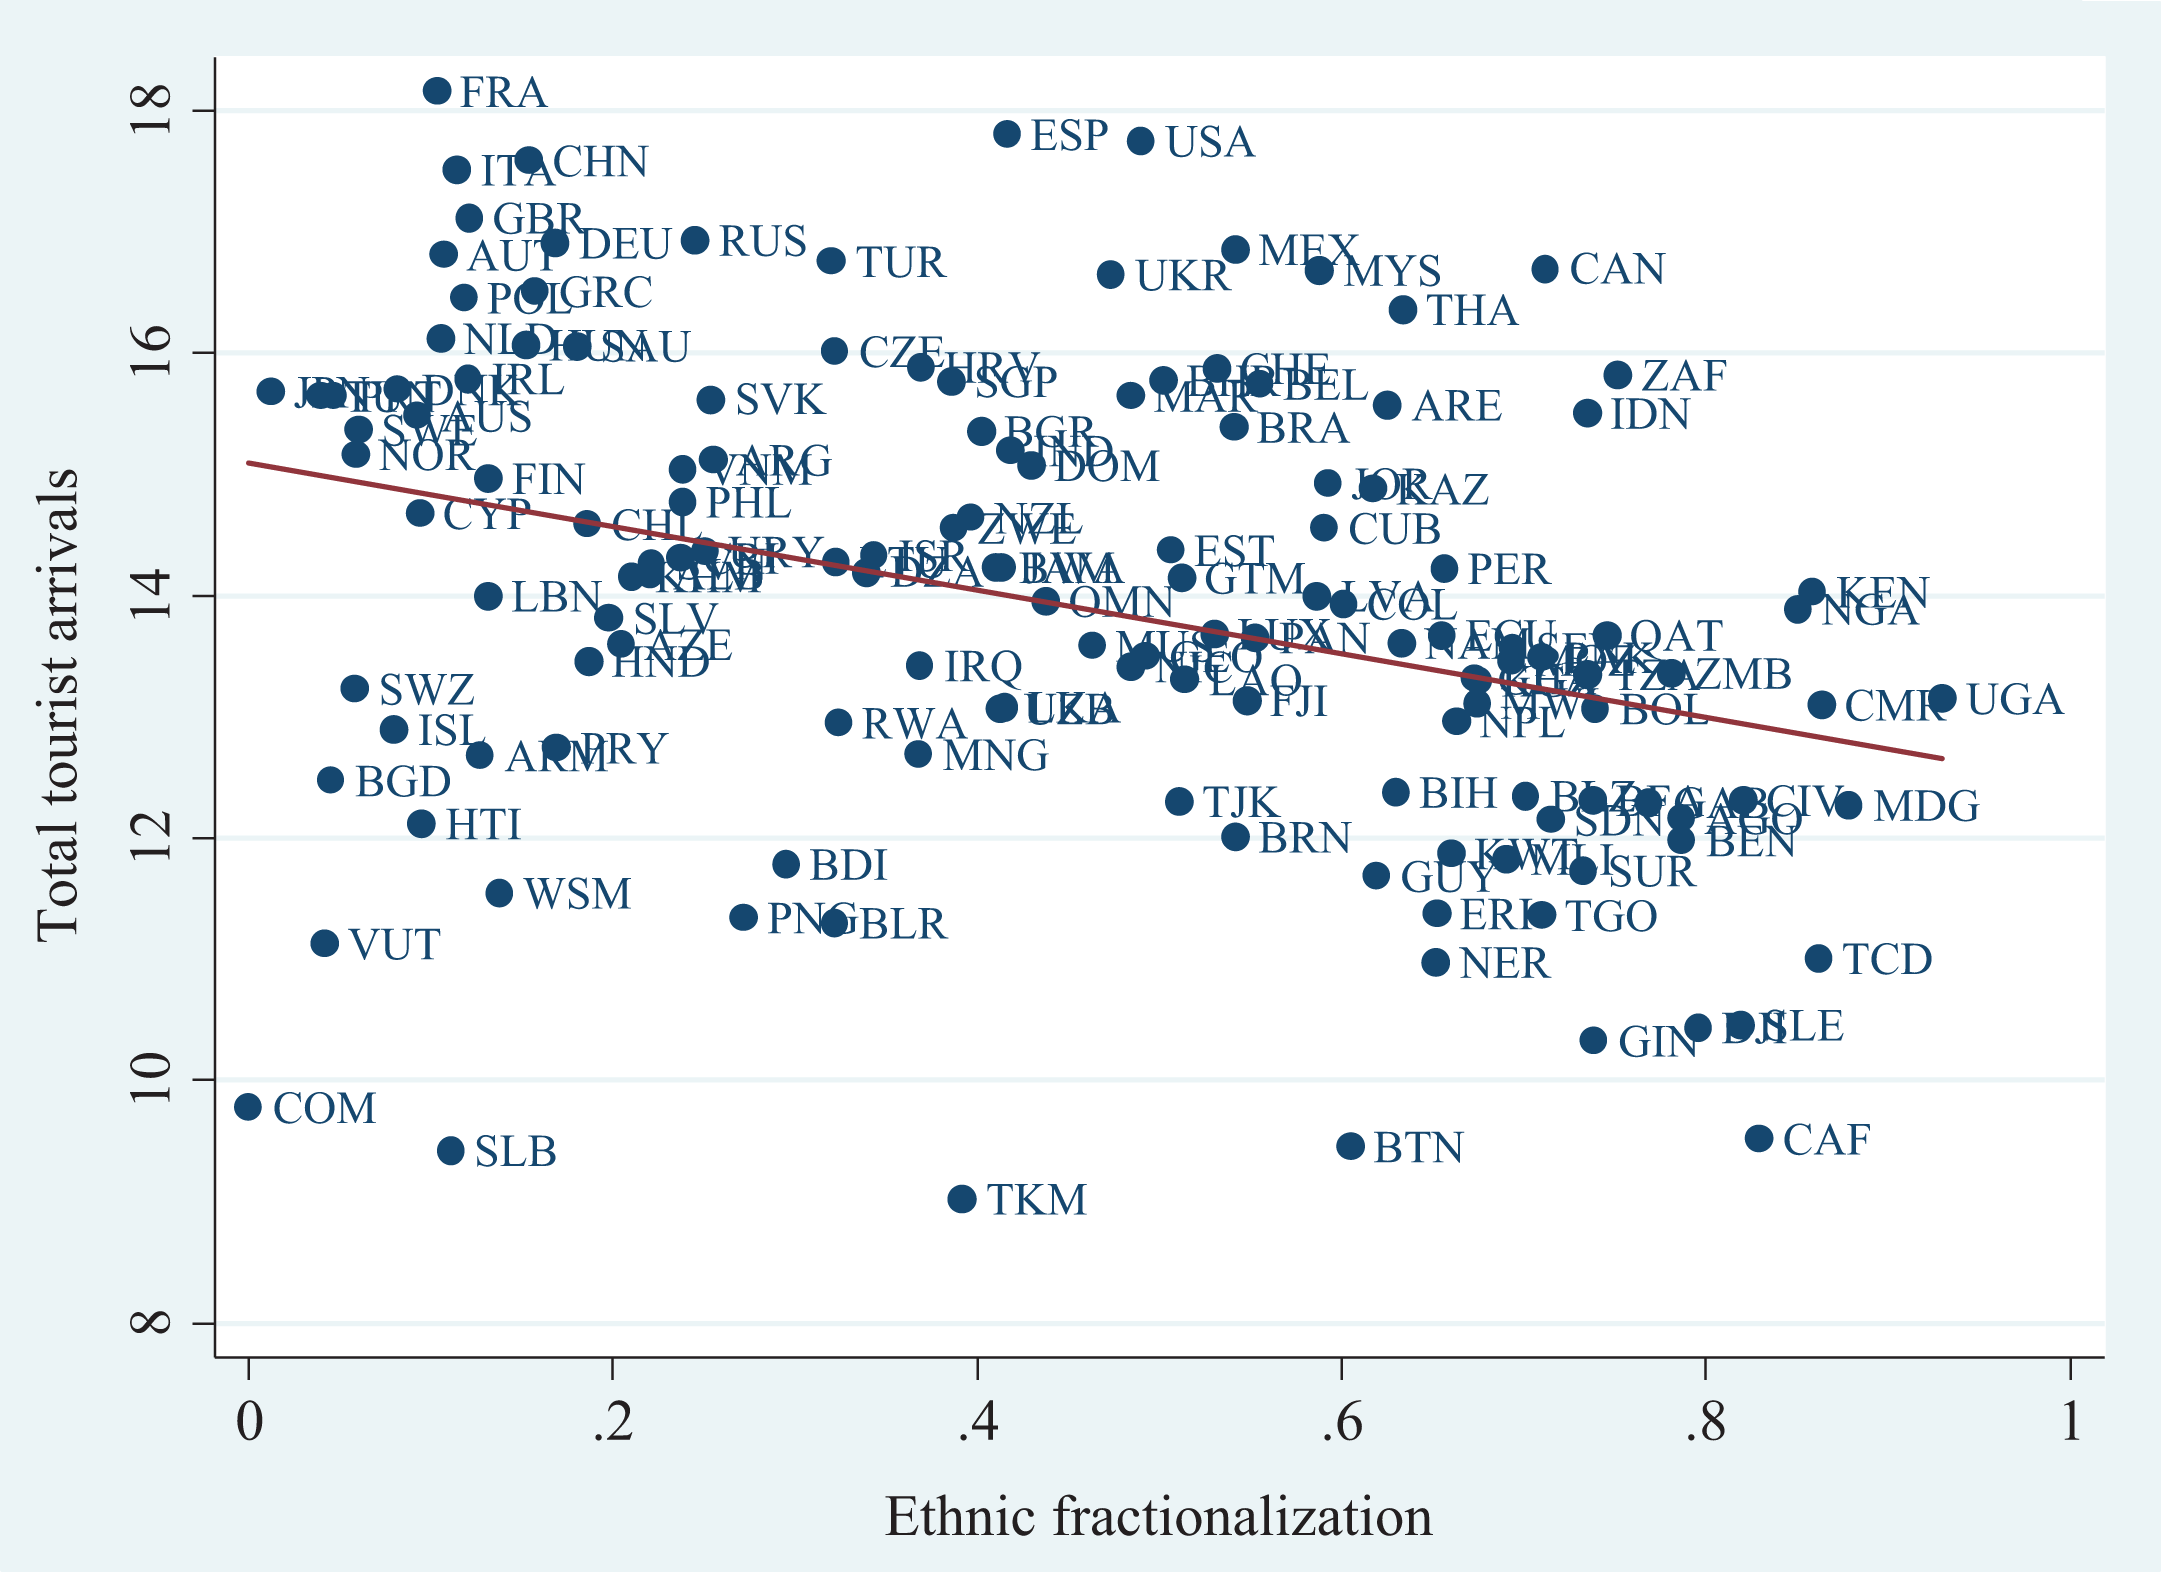
Figures 1 to 4 provide suggestive evidence of the relationship between ethnic fractionalization and our measures of tourism revenue as well as tourist arrivals. The scatterplots suggest a negative association between ethnic fractionalization and all measures of tourism revenue and tourist arrivals. While these graphs are useful as they provide suggestive evidence of our relationship of interest, it is important to control for relevant covariates in order to isolate the effects of ethnic fractionalization on our tourism measures.
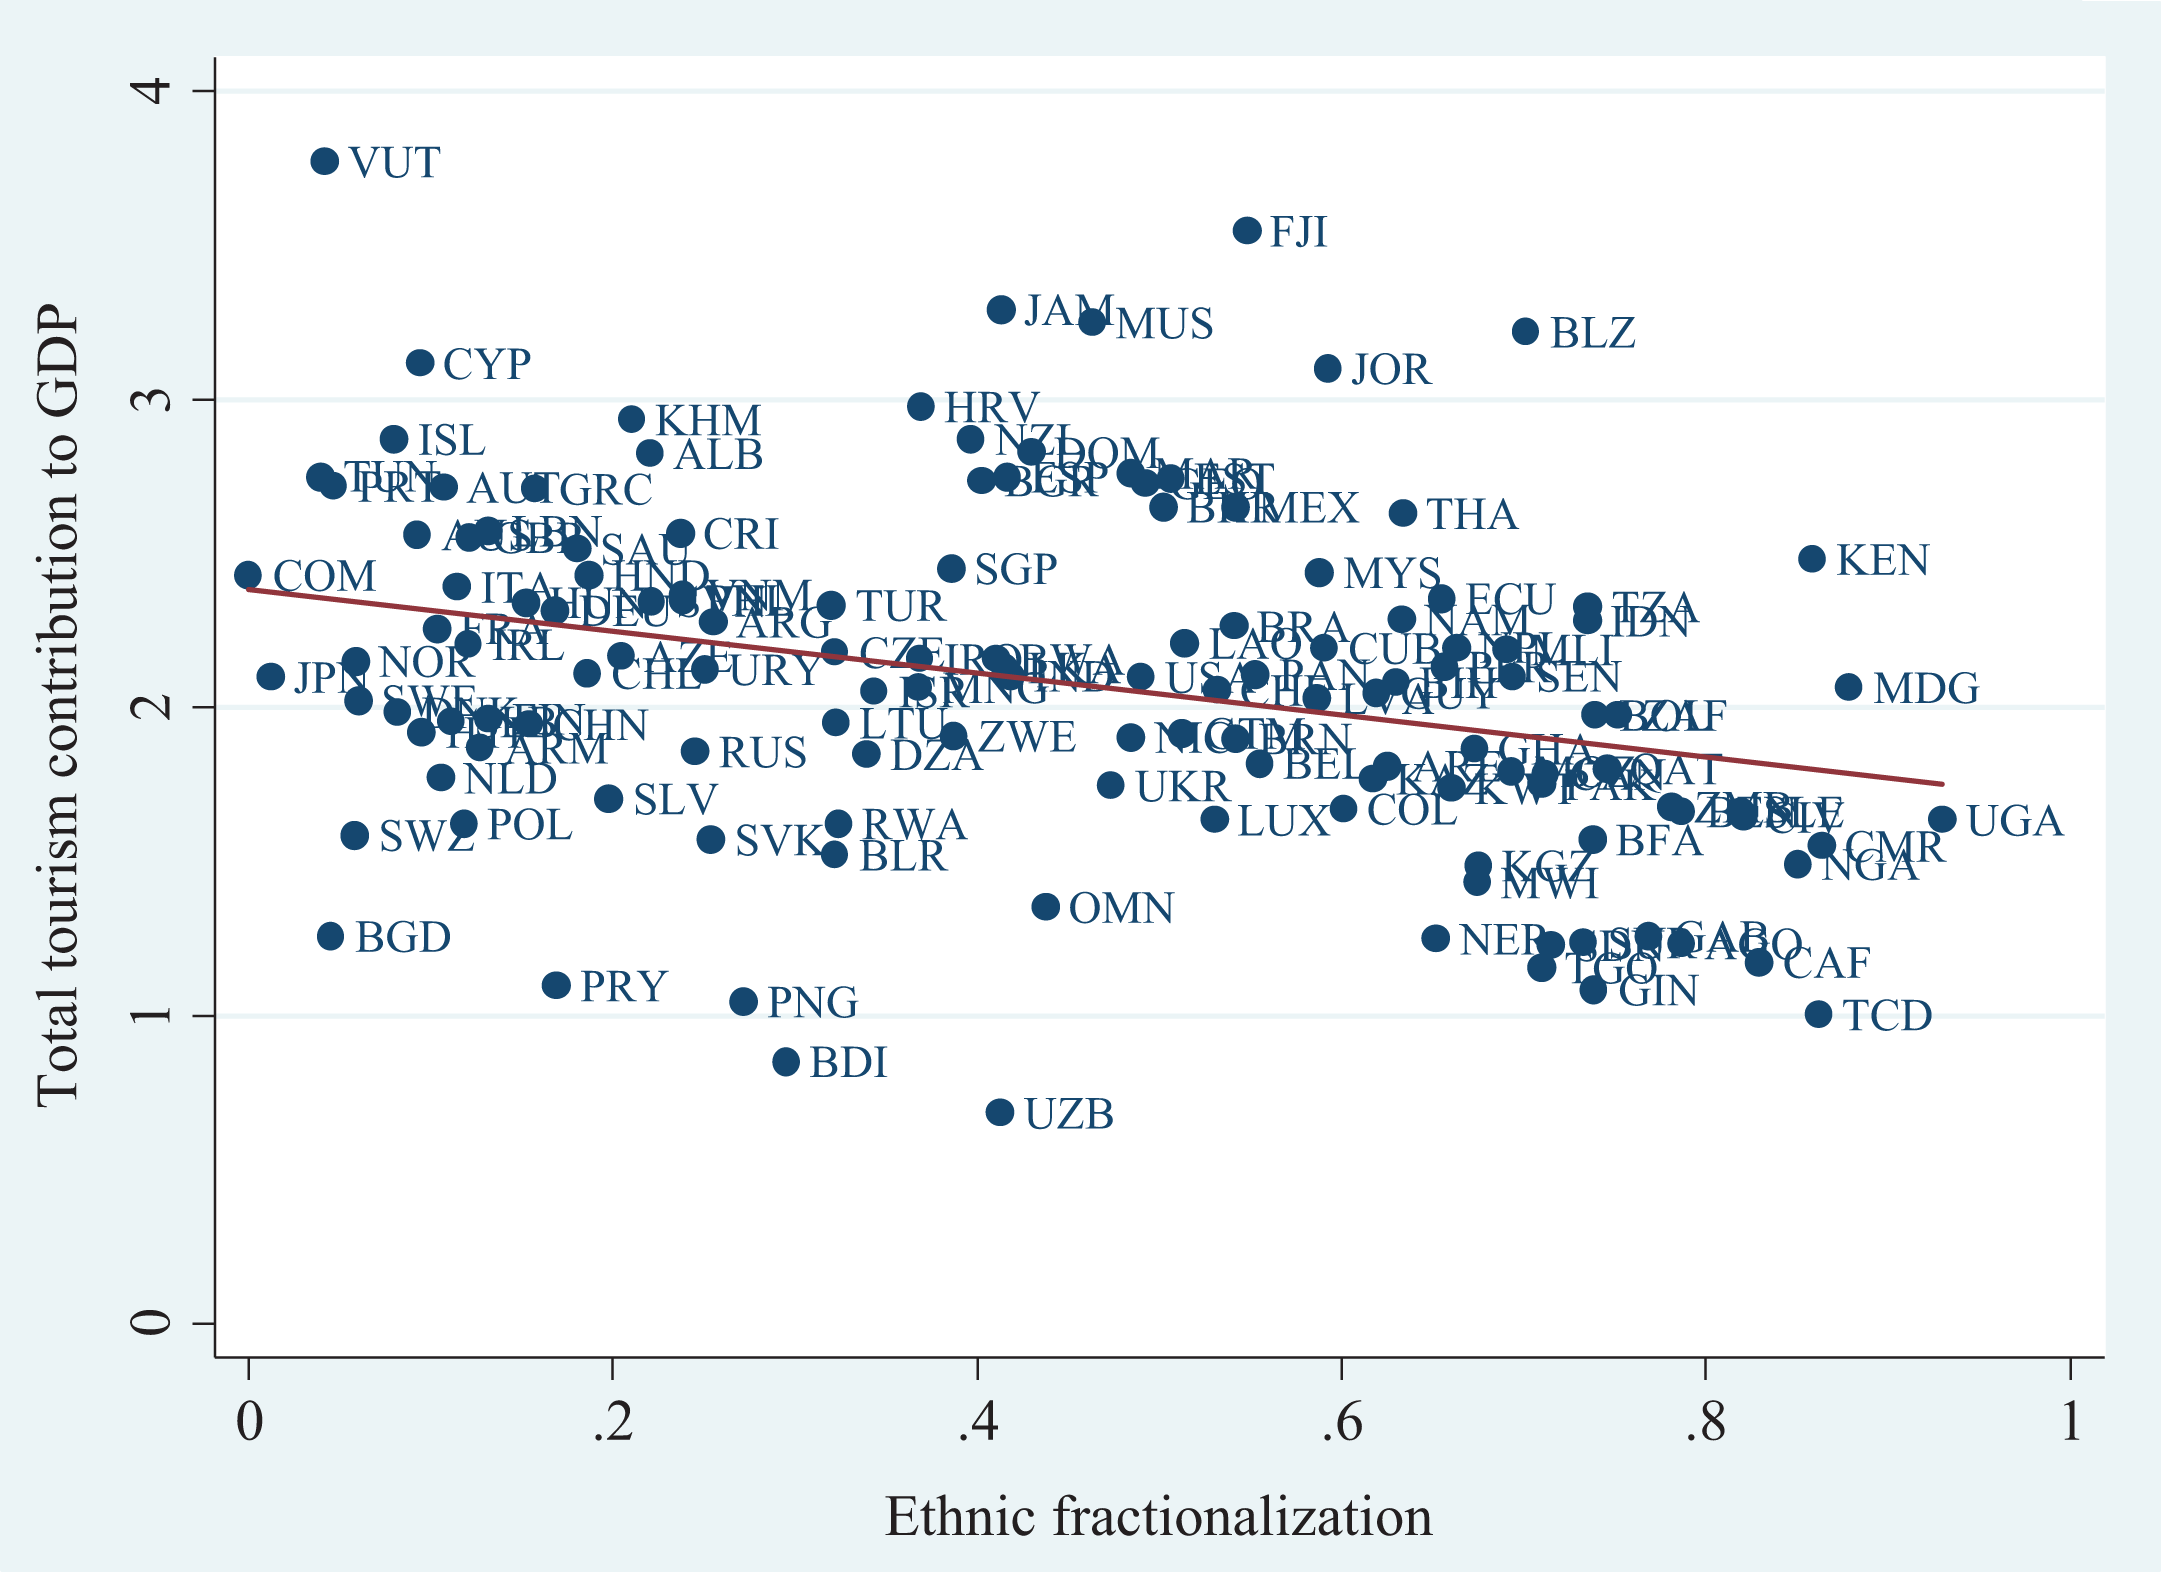
Total tourism contribution and diversity.
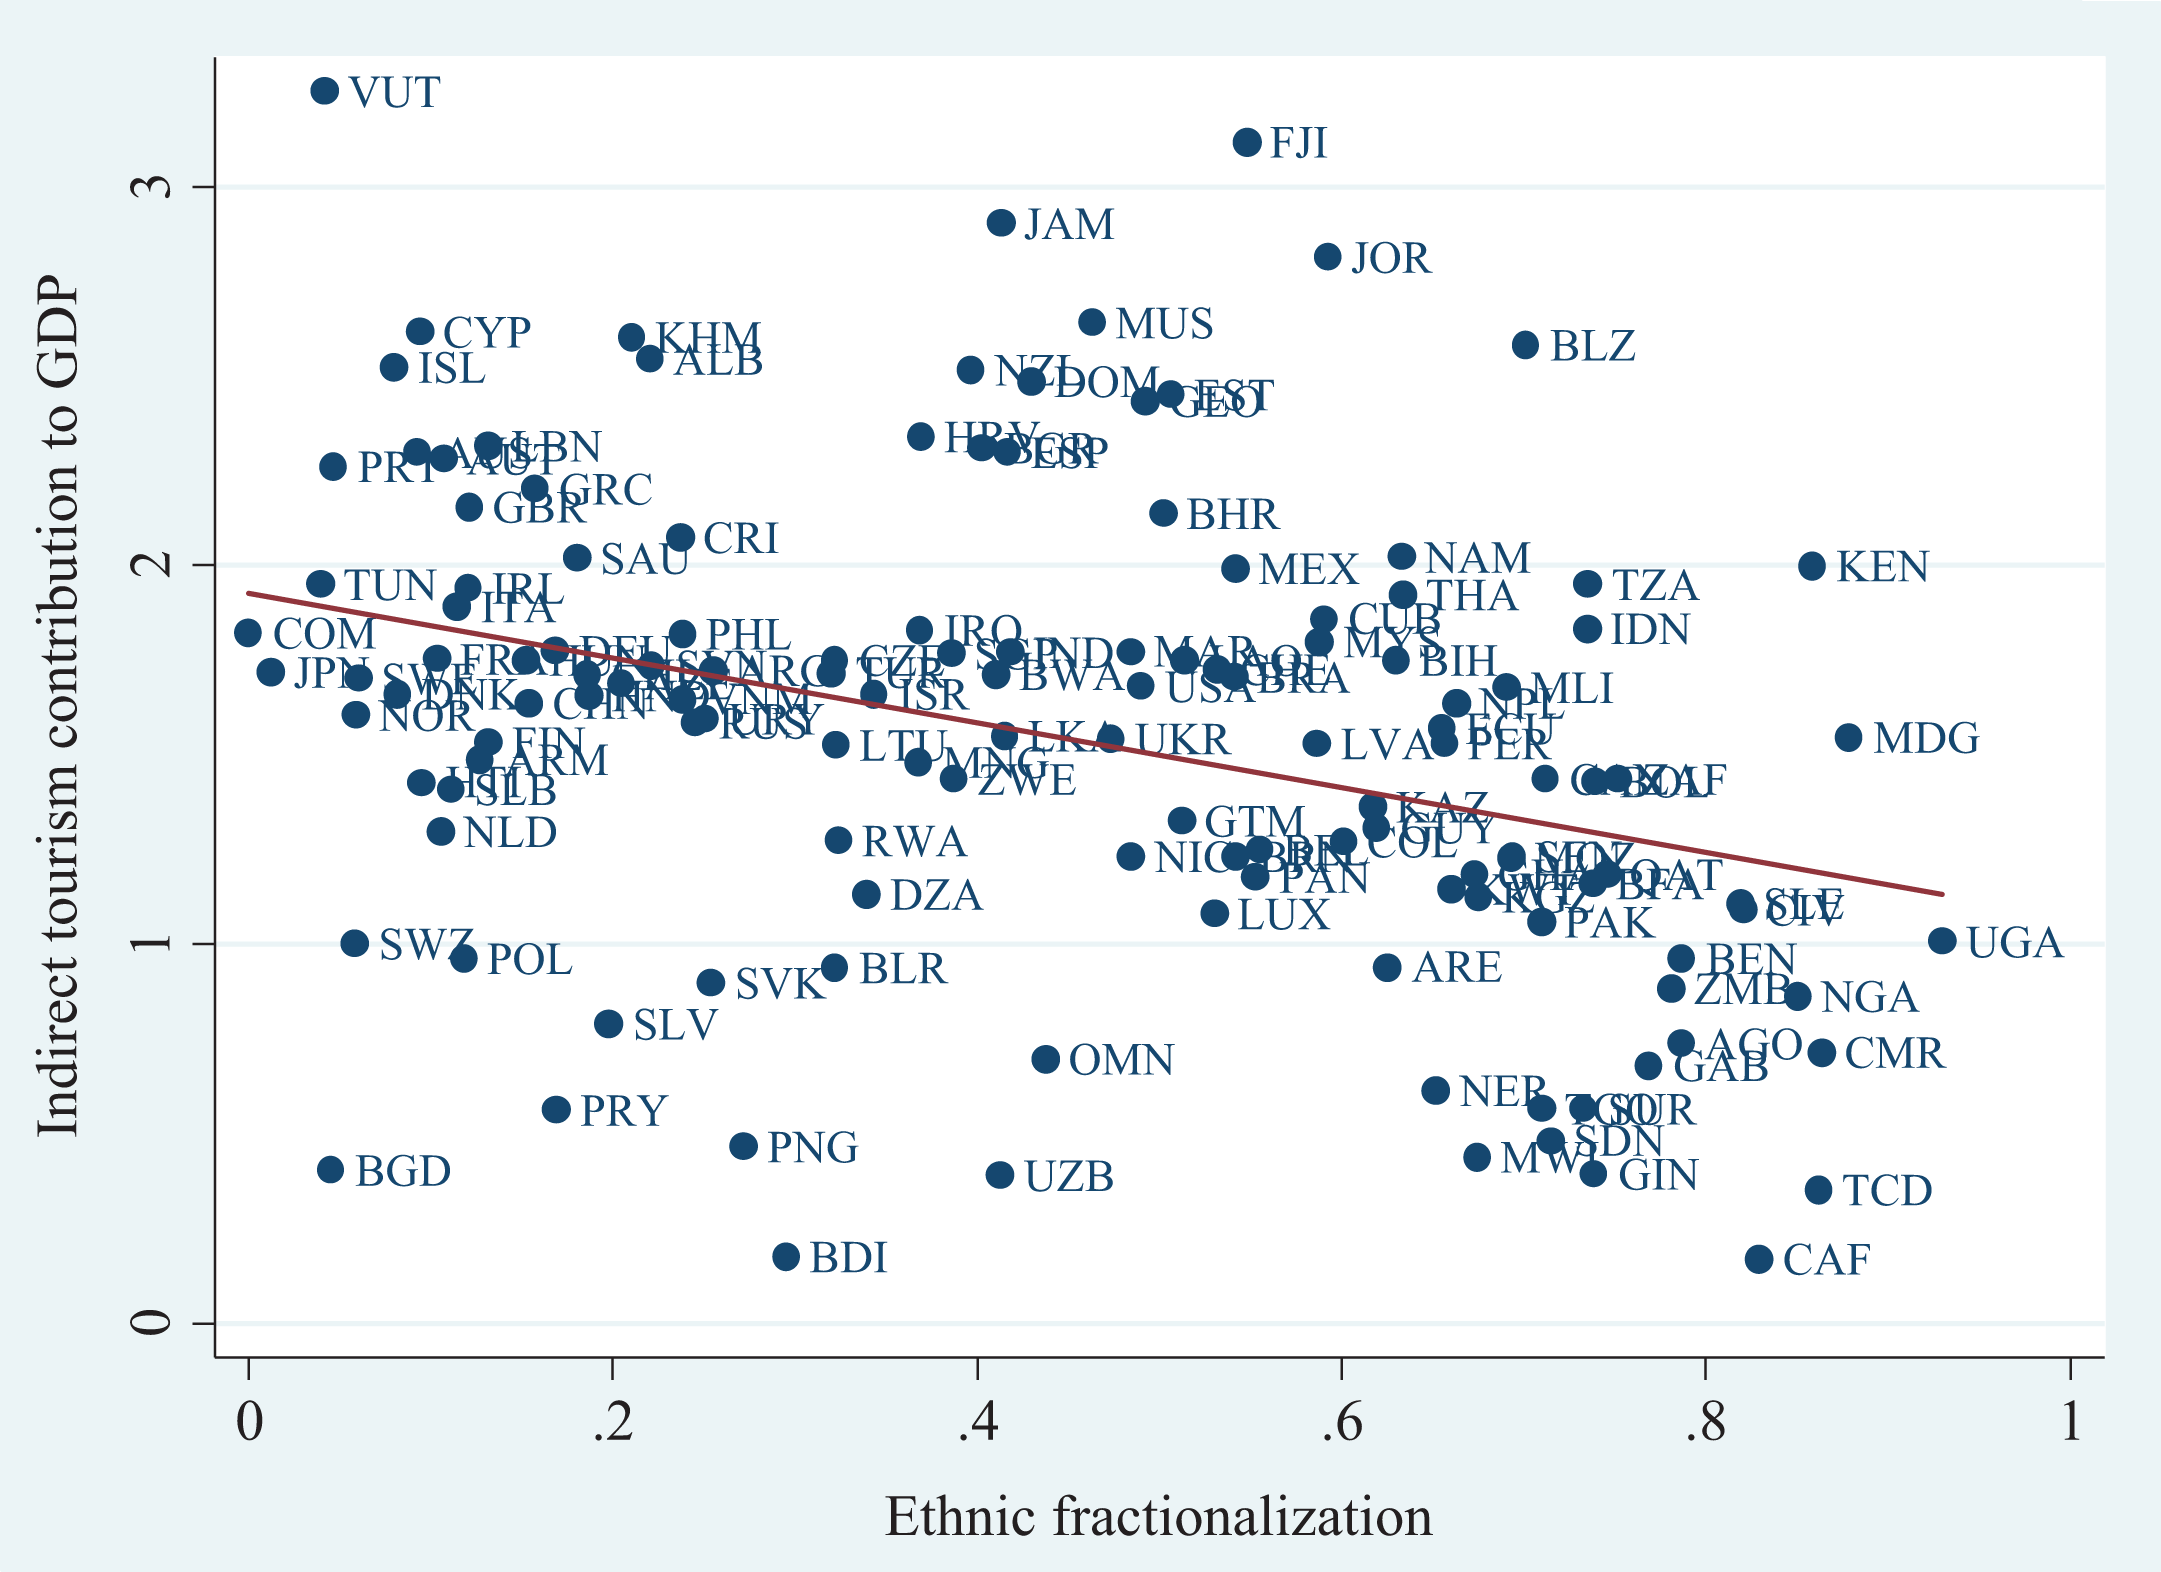
Indirect tourism contribution and diversity.
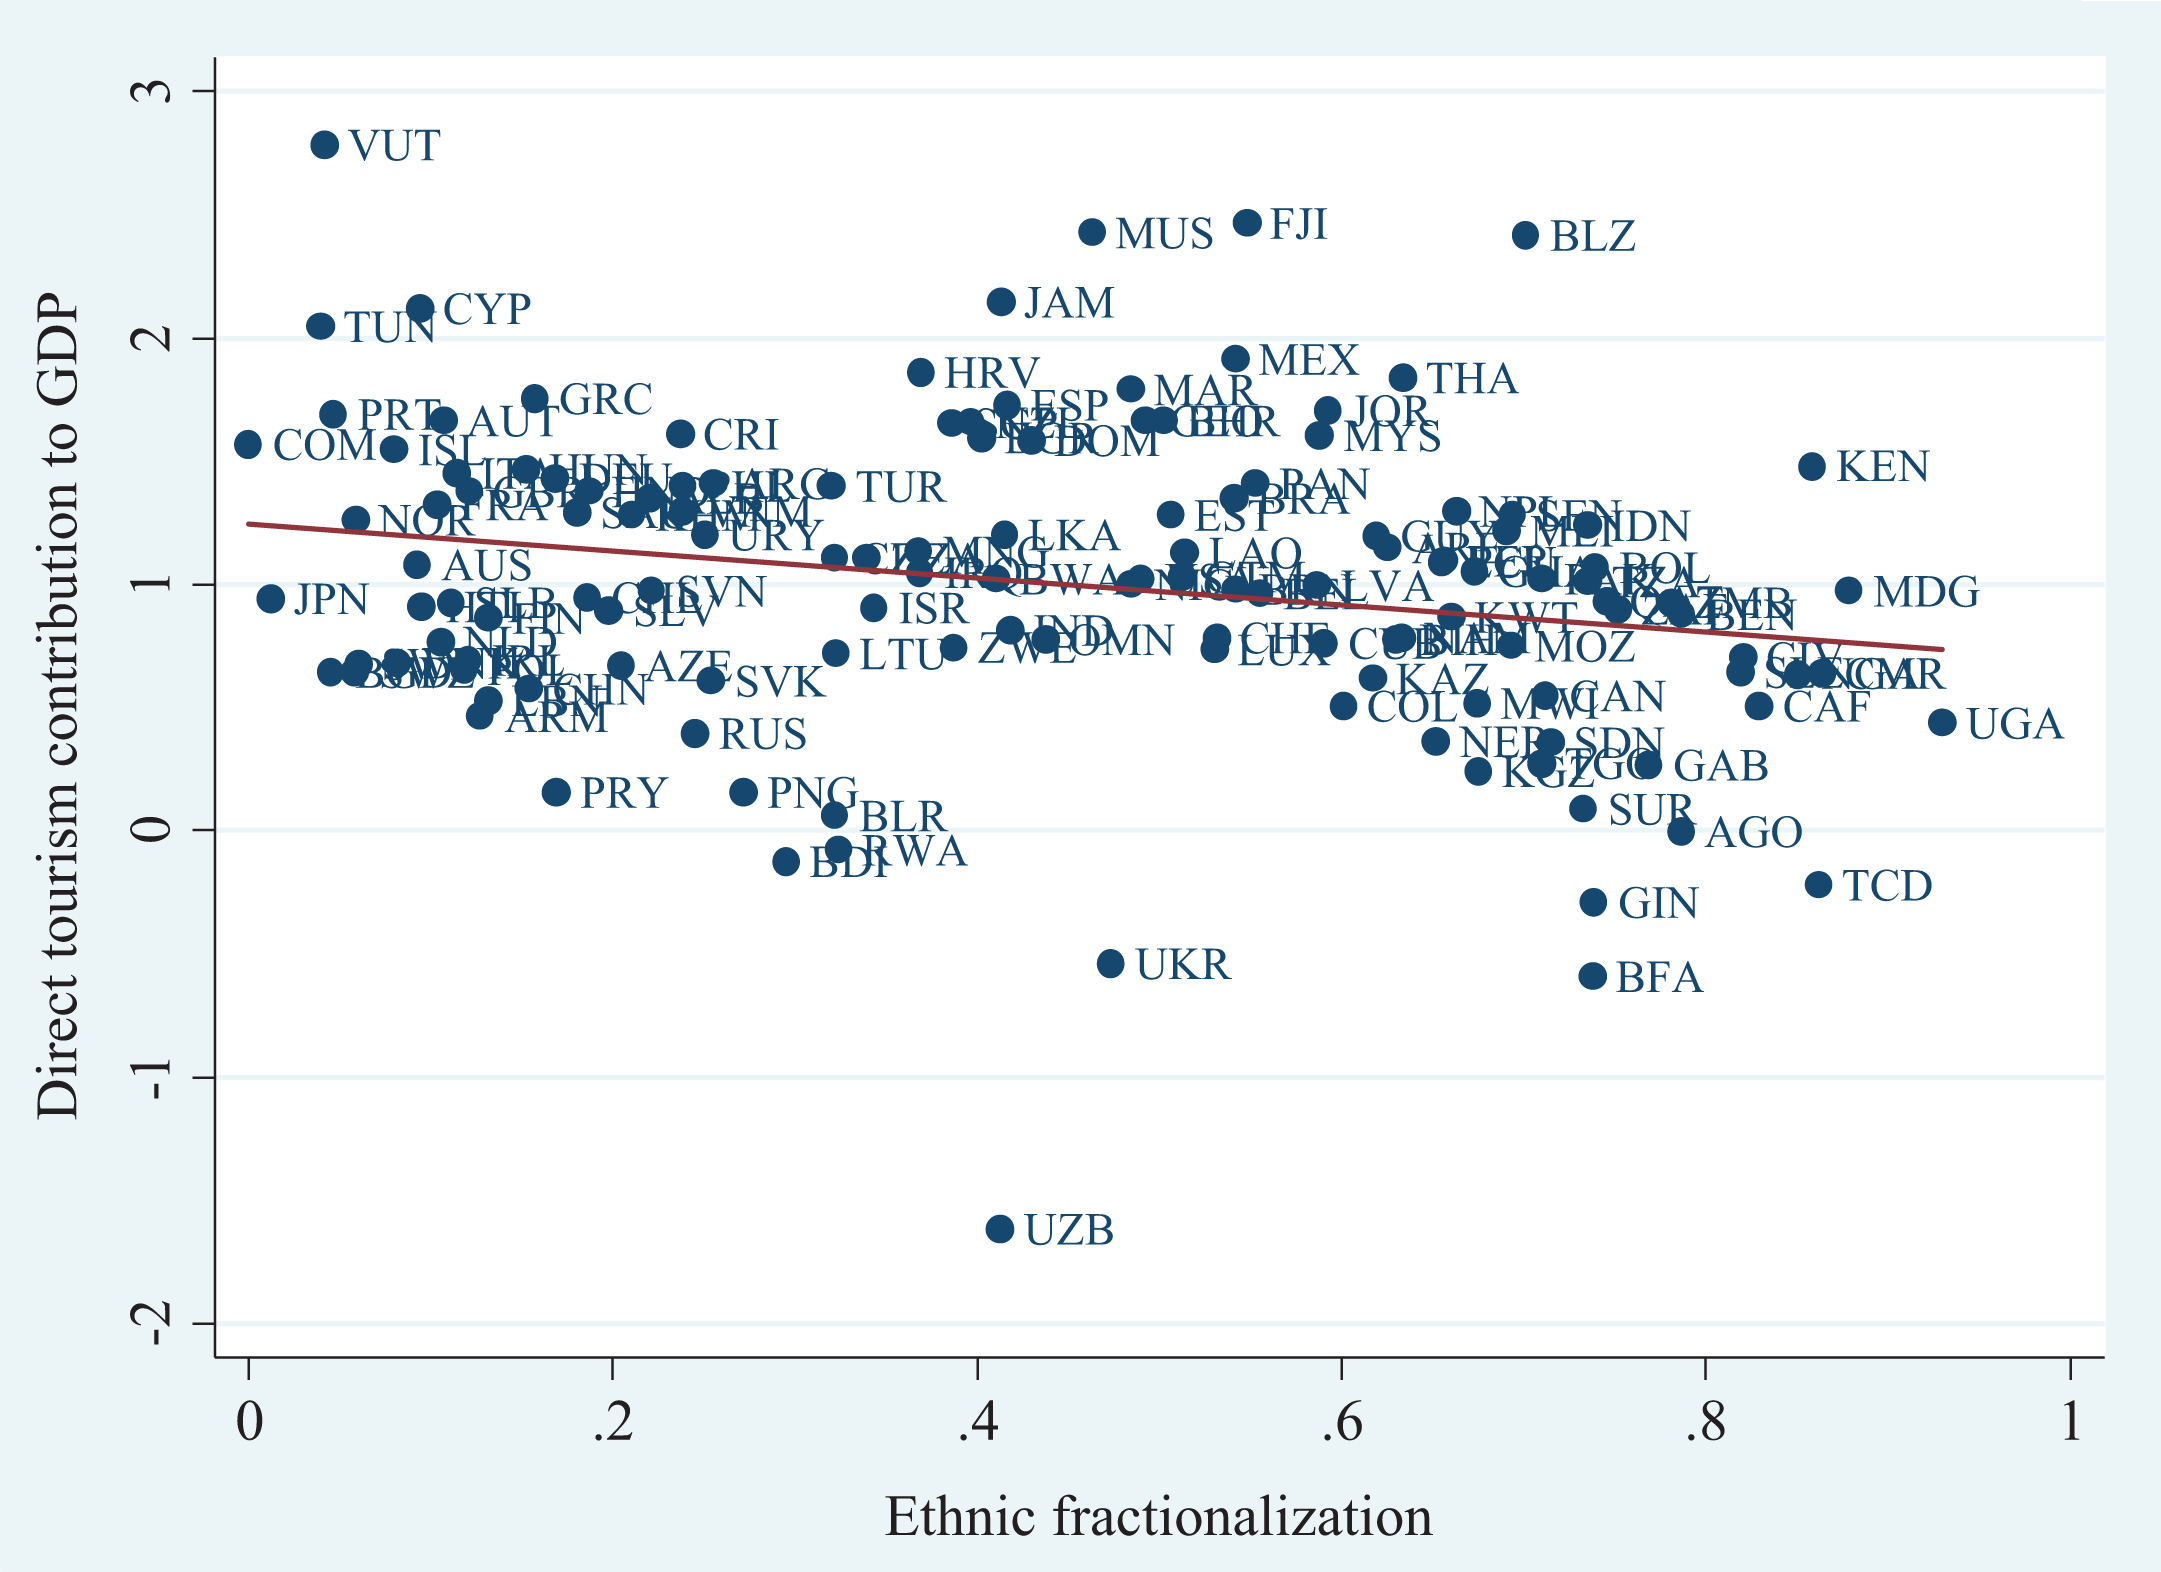
Direct tourism contribution and diversity.
Tourist arrivals and diversity.
Thus, Table 2 presents the OLS and 2SLS results for the association between ethnic fractionalization and our tourism measures. Panel 1 presents the OLS results, while panel 2 presents the 2SLS results. Columns 1 to 4 present the results for the effects of ethnic fractionalization on total tourism contribution to GDP, indirect tourism contribution to GDP, direct tourism contribution to GDP and tourist arrivals, respectively. Here, the results from these columns do not include covariates. Consistently, the results suggest a negative effect of ethnic fractionalization on all tourism measures. The inclusion of relevant covariates in the OLS model renders the effects of ethnic fractionalization in Columns 7 and 8 statistically insignificant.
Effects of ethnic diversity and tourism.
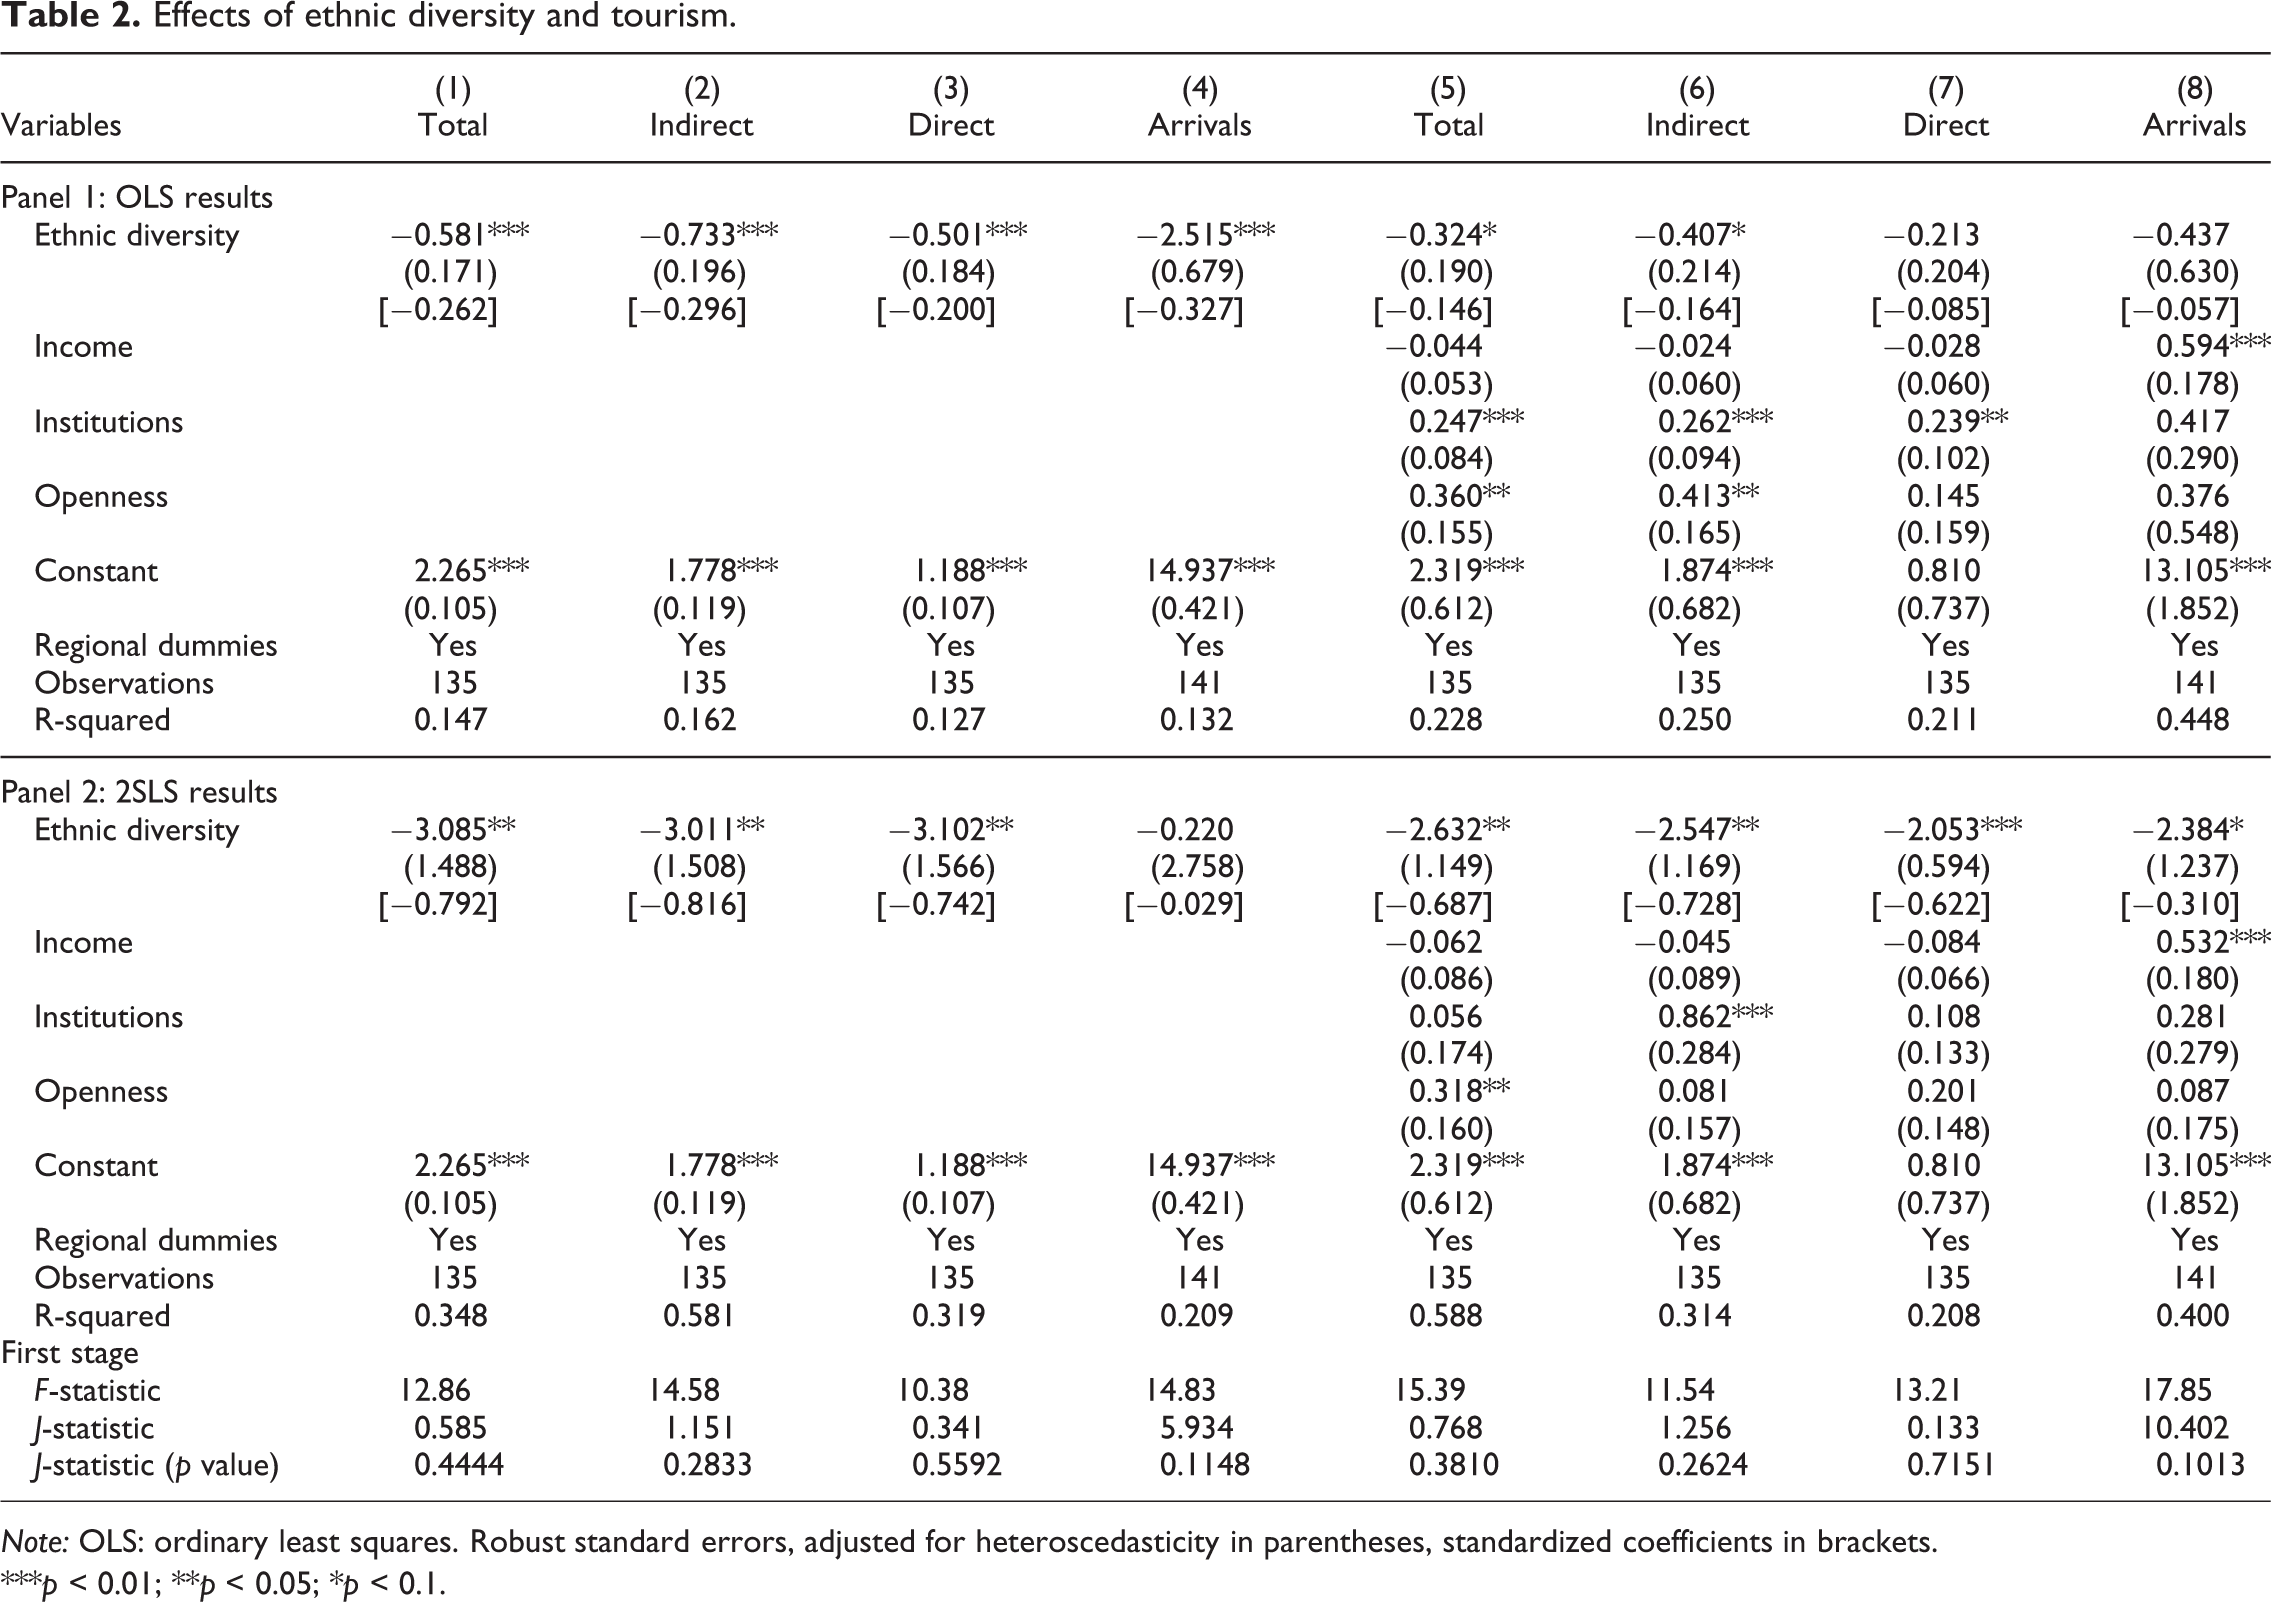
Note: OLS: ordinary least squares. Robust standard errors, adjusted for heteroscedasticity in parentheses, standardized coefficients in brackets.
***p < 0.01; **p < 0.05; *p < 0.1.
However, the OLS results are biased. The 2SLS results using land quality and the duration of human settlement as instruments are reported in panel 2 of Table 2. Comparing regressions with the most complete models (Columns 5 to 8), we find that the magnitude of the 2SLS results is considerably higher than the OLS results. Specifically, from panel 2, the 2SLS results suggest that a standard deviation increase in ethnic fractionalization is associated with a decrease of 0.687, 0.728, 0.622 and 0.310 standard deviations in total tourism contribution to GDP, indirect tourism contribution to GDP, direct tourism contribution to GDP and tourist arrivals, respectively. This compares with a standard deviation decrease of 0.146 and 0.164 in total tourism contribution to GDP and indirect tourism contribution, respectively, from OLS regressions. Further, the statistically insignificant effects of ethnic fractionalization on direct tourism contribution to GDP and tourist arrivals are now significant in 2SLS regressions. Thus, the results suggest that endogeneity causes a considerable downward bias in OLS estimates as the resulting estimates from 2SLS regressions are considerably higher and significant than those from OLS.
In Table 3, we examine if our results are robust using the alternative measures of ethnic diversity and estimation methods. Panels 1 and 2 of Table 3 present the results for the alternative measures of ethnic diversity. Specifically, panel 1 presents the results using the Ethnologue diversity index. The Ethnologue ethnic diversity index, which was compiled by anthropologists, linguists and geologists, is argued to be a comprehensive index that takes into account the different languages spoken in the world and is also based on more recent census information for countries.
Robustness checks.
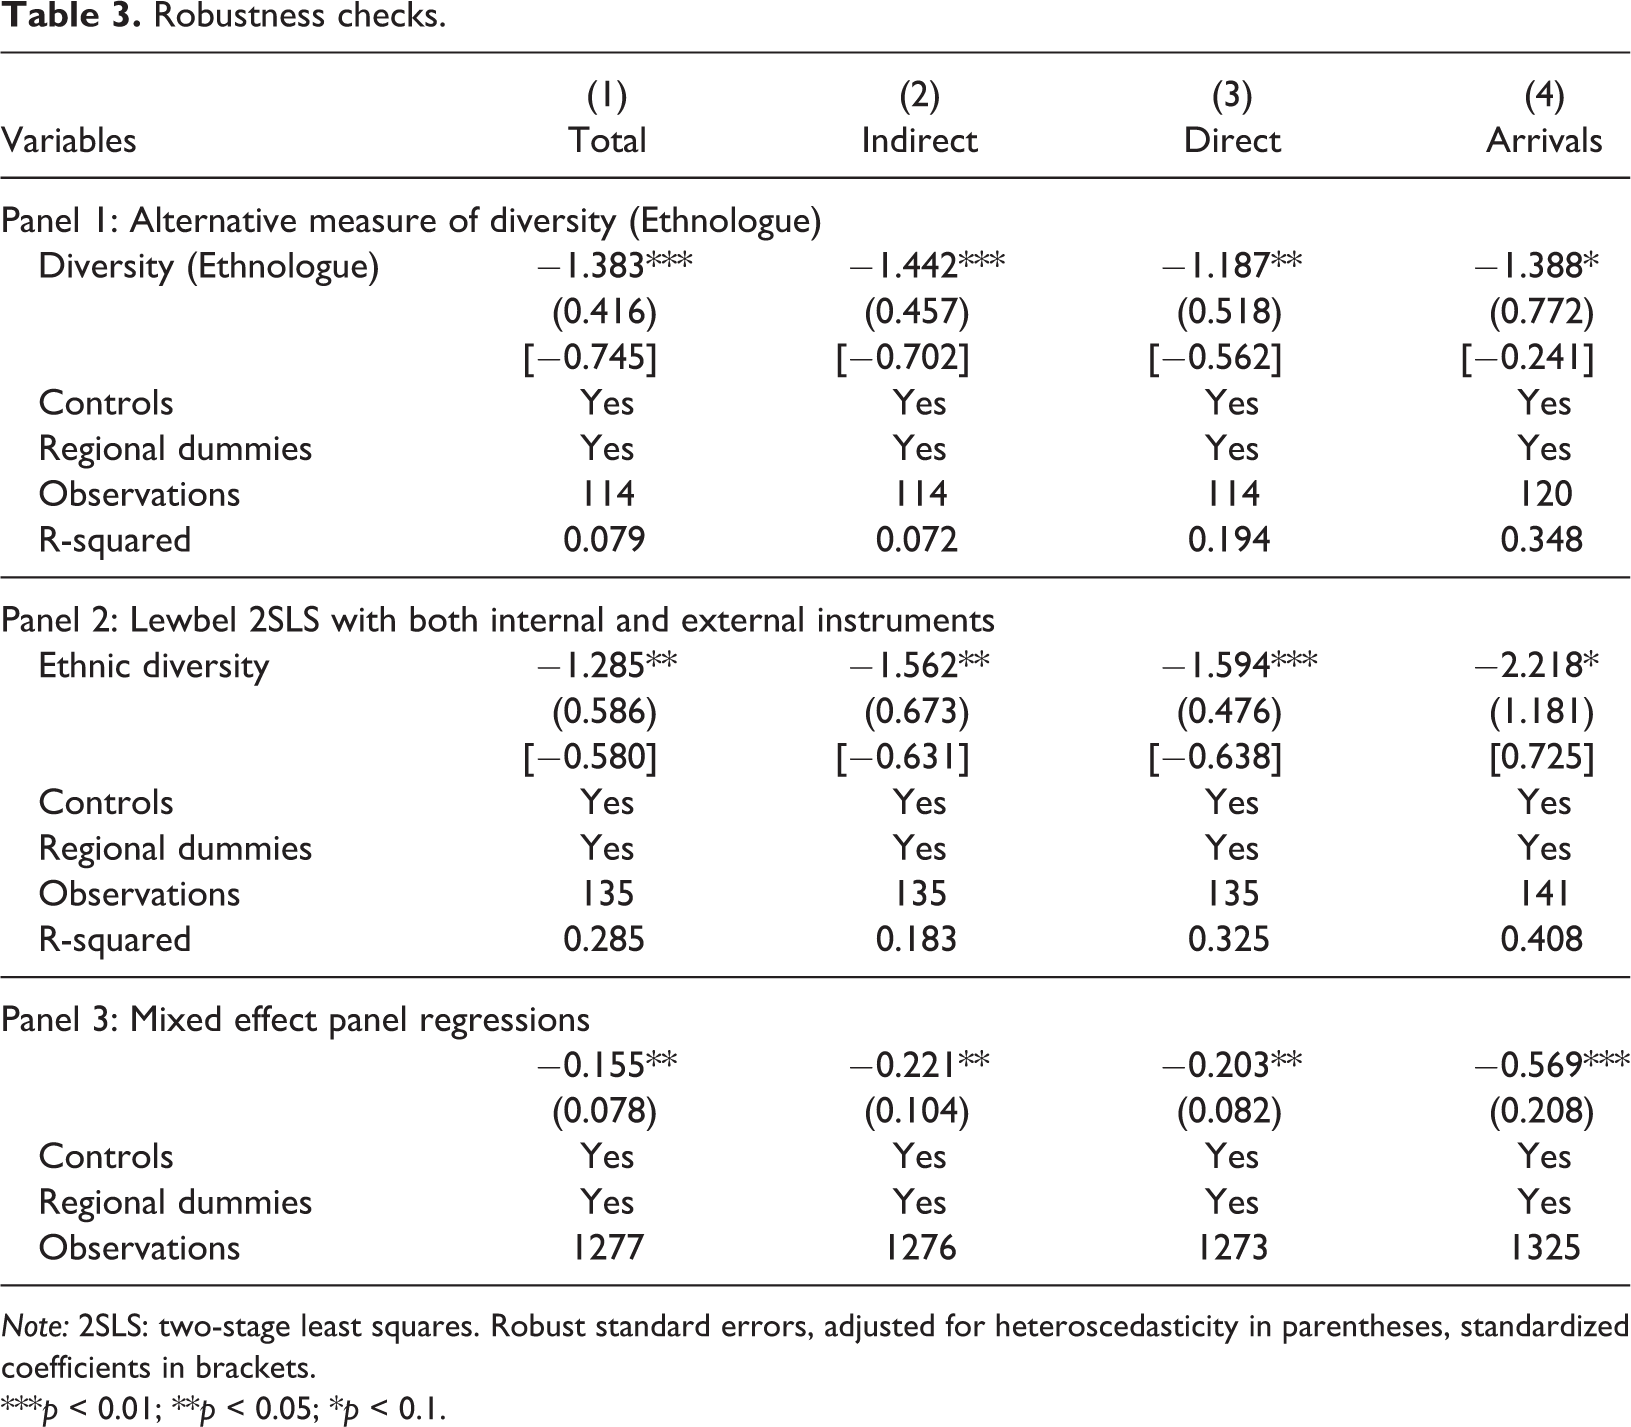
Note: 2SLS: two-stage least squares. Robust standard errors, adjusted for heteroscedasticity in parentheses, standardized coefficients in brackets.
***p < 0.01; **p < 0.05; *p < 0.1.
Panels 2 and 3 present the results for alternative estimation methods. Panel 2 presents the results for the effects of ethnic fractionalization using the Lewbel (2012) 2SLS approach that adopts heteroscedasticity-based internal instruments, while panel 3 presents the results for a mixed effect model. For the Lewbel 2SLS estimations, we combine our external instruments (i.e. duration of human settlement and variations in land quality) with internally generated instruments to further ensure robustness to endogeneity. With the mixed effect model, we exploit the time dimension of our data set as the model allows us to use panel data techniques in situations where some covariates are time-invariant (e.g. indices of fractionalization).
Overall, quite consistently, the results here suggest that the effects of ethnic diversity on tourism revenue and tourist arrivals are not sensitive but are robust to the alternative measures of ethnic diversity and also alternative estimation approaches.
Summary and conclusion
This study has sought to address the question “can cross-country differences in ethnic diversity explain cross-country differences in tourism revenues and tourist arrivals?” Based on the data collected from 141 countries, we answer this question using the different measures of tourism revenue and tourist arrivals, and a wide range of ethnic diversity indices. Our results suggest detrimental effects of ethnic diversity on both tourism revenues and tourist arrivals.
The finding of a negative effect of ethnic diversity on tourist arrivals and revenues provides some important implications for policy. Ethnic diversity is associated with both positive and negative effects, and thus unless the benefits of ethnic diversity are properly harnessed, tourism growth will suffer consequentially in the future given the persistent increase in diversity across the world. We therefore argue in favour of policies that can help mitigate the negative effects of diversity given that policy cannot alter the level of fractionalization within a country. For instance, Miguel (2006) suggests that increased interaction among leaders of distinct ethnic groups can facilitate intergroup cooperative norms that promote social capital. This can help address the negative effects of diversity associated with lack of social capital. Specifically, the facilitation of intergroup cooperation can help deal with the issue of low public goods provision. Similarly, evidence from the sociology literature suggests that the use of superordinate goals can help promote trust and reduce tensions among heterogeneous groups (Sherif, 1958).
Overall, we believe that understanding the impact of ethnic diversity on tourist arrivals and tourism revenues can help policymakers understand the context within which tourism thrives. Our findings suggest that ethnic diversity plays a significant role in shaping the tourism industry and therefore needs to be considered when formulating policies to enhance tourism growth.
Supplemental Material
Supplemental Material, Supplemental_material - The impact of ethnic diversity on tourism revenue and tourist arrivals
Supplemental Material, Supplemental_material for The impact of ethnic diversity on tourism revenue and tourist arrivals by Sefa Awaworyi Churchill, and Ahmed Salim Nuhu in Tourism Economics
Footnotes
Declaration of conflicting interests
The author(s) declared no potential conflicts of interest with respect to the research, authorship, and/or publication of this article.
Funding
The author(s) received no financial support for the research, authorship, and/or publication of this article.
Note
Supplemental Material
Supplemental Material for this article is available online.
References
Supplementary Material
Please find the following supplemental material available below.
For Open Access articles published under a Creative Commons License, all supplemental material carries the same license as the article it is associated with.
For non-Open Access articles published, all supplemental material carries a non-exclusive license, and permission requests for re-use of supplemental material or any part of supplemental material shall be sent directly to the copyright owner as specified in the copyright notice associated with the article.