



Abstract
We examine whether tourism sector development measured by visitor arrivals per capita has asymmetric growth effects in the Cook Islands using quarterly data from 2010Q1 to 2016Q3. Asymmetric cointegration, long-run elasticities, and dynamic multipliers are estimated using the nonlinear autoregressive distributed lag model developed by Shin et al. Asymmetric causality testing is done using the asymmetric vector autoregression approach with insights from Hatemi-J. We identify structural breaks using the Lee and Strazicich multiple endogenous structural break unit root test. The results indicate that a 1% increase in visitor arrivals would increase gross domestic product (GDP) per capita by 0.92%, whereas a 1% decrease in visitor arrivals would decrease GDP per capita by 0.34%. The identified breaks, 2013Q2 and 2015Q3, are positive and significant in the short run only. The causality result confirms a bidirectional association, thus mutually reinforcing the asymmetric relationship between visitor arrivals and economic growth.
Keywords
Introduction
Tourism is a key economic sector for many small and developing island countries. In the Pacific and specifically in Oceania, some countries heavily depend on tourism activities to generate income and employment. In 2017, the tourism sector provided employment to some 2.5 million people in Oceania, which is about 12.7% of total employment. In terms of income, the sector contributed about US$200 billion toward the gross domestic product (GDP), which is around 12.6% of total GDP. The sector generated US$43.7 billion in export earnings (11.5% of total exports) and US$21.8 billion of investments (5.8% of total investment) (World Travel & Tourism Council, 2018).
This study focuses on the Cook Islands—a country where tourism is growing amid other developments. Recent developments indicate that the Cook Island will graduate from upper-middle income to high-income country between 2018 and 2020. This transition will reduce the inflow of official development assistance and hence the country’s reliance on the tourism sector to generate income for development will become more pressing. In an interview by Radio New Zealand—Dateline Pacific, the Minister for Finance, Mr Mark Brown highlighted that So for us, it means that there may be some forms of ODA that we will not be eligible for in the future…with the Cook Islands economy where it is now, based around tourism [and] primarily driven by tourism, we are at a state where we have to be able to accept that and learn how to do business with our growing prosperity in different ways [emphasis added].
1
The key findings are as follows: we note a bidirectional causality between tourism sector development and economic growth, thus confirming the feedback hypothesis of tourism development. The interpretation is that Cook Islanders have the opportunity to invest in tourism facilities, which in fact makes the Cook Islands more attractive for tourists and consequently increases the number of tourists. Thus, it seems to be that optimistic expectation about the development of tourism causes investments and thus increases growth; and the improved and extended tourism facilities, in turn, attract additional tourists. This interpretation is supported by the second result, which is the asymmetry occurring in the relationship between the number of tourists and economic growth. We find that an increase in tourism is associated with a stronger positive effect on growth than the absolute (negative) effect on growth, which is associated with a comparable decline in tourism. Particularly, we show that a 1% increase in visitor arrivals is associated with an increase of real per capita income of 0.92%, while a 1% decrease of visitors is associated with a real GDP per capita decline of 0.34%. We also find that the structural breaks, 2013Q2 and 2015Q3, are positive and significant in the short run.
The rest of the article is organized as follows: the second section is on the literature review, third section presents an overview of the tourism sector in the Cook Islands, fourth section presents the model and methods, fifth section on data and results and discussions, and, finally, sixth section provides the conclusion and recommendations for policy.
Literature review
The relationships between tourism and economic growth have been widely examined in many countries and many regions (Balaguer and Cantavella-Jorda, 2002; Chatziantoniou et al., 2013; Lanza and Pigliaru, 2000; Lanza et al., 2003; Nowak et al., 2007; Pablo-Romero and Molina, 2013; Shahzad et al., 2017b) 2 . There is a general consensus that tourism positively influences growth, but the contention that causality is not always monodirectional. Isik et al. (2018) highlight four plausible outcomes on causality, namely the tourism-led growth hypothesis or tourism causing economic growth, the growth-led tourism hypothesis or economic growth causing tourism, the feedback hypothesis or tourism and growth are mutually reinforcing, and the neutrality hypothesis or absence of any clear association between tourism and economic growth. Tourism activities support growth if the tourism-led growth and/or feedback hypotheses are identified. The outcome of causality depends on the method employed for analysis, the tourism sector development metric, the sample size in the analysis, and the inclusion of additional variables (Shahzad et al., 2017b), and arguably a country’s level of dependence on the sector which can be measured by the share of the sector relative to other sectors in the economy.
Numerous articles document a positive association between tourism and economic growth, such as Balaguer and Cantavella-Jorda (2002) in Spain, Durbarry (2004) in Mauritius, Eugenio-Martin et al. (2004) in low- to medium-income Latin-American countries, Brida et al. (2008) in Mexico, Lee and Chang (2008) for the Organisation for Economic Co-operation and Development OECD and nonOECD countries, Brida et al. (2009) in Colombia, Brida et al. (2010) in Uruguay, Kumar and Kumar (2012) in Fiji, Vanegas (2012) in El-Salvador, Jaforullah (2015) in New Zealand, and Gunter et al, (2017) for countries in Central America and the Caribbean islands. Notably, income increases due to positive externalities (Romer, 1986, 1990) from tourism, such as infrastructural development, foreign direct investments, and the proliferation of the Internet and mobile connectivity (Jayaraman et al., 2014; Kumar and Kumar, 2012; Kumar et al., 2016).
Some studies argue that the growth in income is necessary to develop the tourism sector, thus the emphasis is on the growth-led tourism hypothesis (Kumar and Kumar, 2012; Kumar et al., 2018) for Fiji. Moreover, bidirectional causality is observed for Taiwan (Kim and Chen, 2006) and the Cook Islands (Kumar et al., 2016). The neutrality hypothesis is observed in Venezuela and Uruguay by Eugenio-Martin et al. (2004), in Turkey by Katircioglu (2009), in the Bahamas, Barbados, and Jamaica by Singh et al. (2010), and in Malaysia by Kumar et al. (2015). The neutral effect of tourism is supported by the beach disease hypothesis (Chao et al., 2006; Copeland, 1991). A booming tourism sector generates rents similar to the Dutch disease models, but the unpriced natural amenities consumed by tourists lead to rents becoming an important source of income in the destination (Copeland, 1991). Without market failures and taxation, currency appreciation is the only factor that extracts rents for the destination in the absence of factor mobility (Chao et al., 2006). Holzner’s (2011) results show no evidence of beach disease effect, and that tourism-specialist countries on average grow faster than the rest of the world (Lanza and Pigliaru, 2000).
Ascertaining the magnitude of tourism on the growth is important for tourism sector policy discussions and is useful as an input for forecasting visitor arrivals and tourism earnings (Cortés-Jiménez and Pulina, 2006; Nowak et al., 2007; Pablo-Romero and Molina, 2013; Tang and Tan, 2015). To drive unbiased estimates, recent studies emphasize the inclusion of structural breaks and exchange rates (Stauvermann et al., 2018), remittances (Kumar, 2014), information and communication technology (Kumar and Kumar, 2012), foreign direct investment (Yazdi et al., 2017), carbon emissions (Lee and Brahmasrene, 2013), trade openness and financial development (Shahbaz et al., 2017), and energy consumption (Dogan and Aslan, 2017; Isik et al., 2018). These variables underscore the different channels that link tourism to economic growth.
Country-specific evidence is numerous in developed countries. However, the tourism–growth relationship in small Pacific island countries is generally scant. In Fiji, the tourism–growth relationship has been examined by Narayan (2004), Kumar and Kumar (2012), and Kumar et al. (2018). Narayan (2004) uses a computable general equilibrium model and finds that the output elasticity with respect to tourism expenditures is 0.05%. Kumar and Kumar’s (2012) study uses tourism receipts, telecommunication lines, capital, and labor stock and find that the long-run and short-run contributions to tourism are about 0.23% and 0.19%, respectively. Kumar et al. (2018) use a similar specification, but they control for the effects of structural breaks. Their results indicate that the long-run tourism elasticity is in the range of 0.12–0.15. Narayan et al. (2010) in a panel study consider Fiji, Tonga, Solomon Islands, and Papua New Guinea and find that the average long-run tourism elasticity of about 0.72%. All four studies support the growth-led tourism hypothesis. For the Cook Islands, Kumar et al. (2016) use quarterly data over the period 2009Q1–2014Q2 and find that the long-run elasticity is 0.83, and short-run elasticity is 0.73. They confirm a bidirectional causality between tourism and economic growth.
As noted, research on the economic growth effects of tourism focuses on magnitude effects and causality nexus. However, insights gained from these studies are based on symmetric models and do not consider plausible asymmetric effects. The asymmetric effects literature, for example, Balke and Fomby (1997), Kapetanios et al. (2006), and Psaradakis et al. (2004), emphasizes that the information conveyed by linear models is insufficient to permit a strong inference or to yield reliable forecasts (Shin et al., 2014). Anoruo and Elike (2015) highlight that the key economic variables, such as prices and real GDP, exhibit nonlinear properties. Hence, examining the asymmetric effects of the tourism elasticities offers better tourism policy guidelines compared to assuming simple linear relationships. To the best of our knowledge, there is currently no study in the tourism–growth literature that examines the asymmetric effects and asymmetric causality in the tourism–growth nexus. 3 The study, therefore, contributes to the extensive tourism–growth literature by presenting country-specific evidence on asymmetric growth effects of tourism using the nonlinear autoregressive distributed lag (NARDL) approach (Shin et al., 2014). The study also extends the causality analysis to the asymmetric domain with insights from Hatemi-J (2012).
Tourism sector in the Cook Islands
International arrivals in the Cook Islands (Table 1) are dominated by short-haul tourists from New Zealand (53% of arrivals) and Australia (15% of arrivals). Longer distance source markets comprise all of Europe (18%), United States (7%), and Canada (4%) (Figure 1). The key source markets from Europe is the United Kingdom (6%) and Germany (4%) (Ministry of Finance and Economic Management 2018a, b).The key purpose of the visit is generally holiday and vacation (74% of arrivals), followed by wedding and honeymoon (11%) and visiting family and friends (9%) (Figure 2).
Key source markets for international tourism in the Cook Islands: (1987–2017).
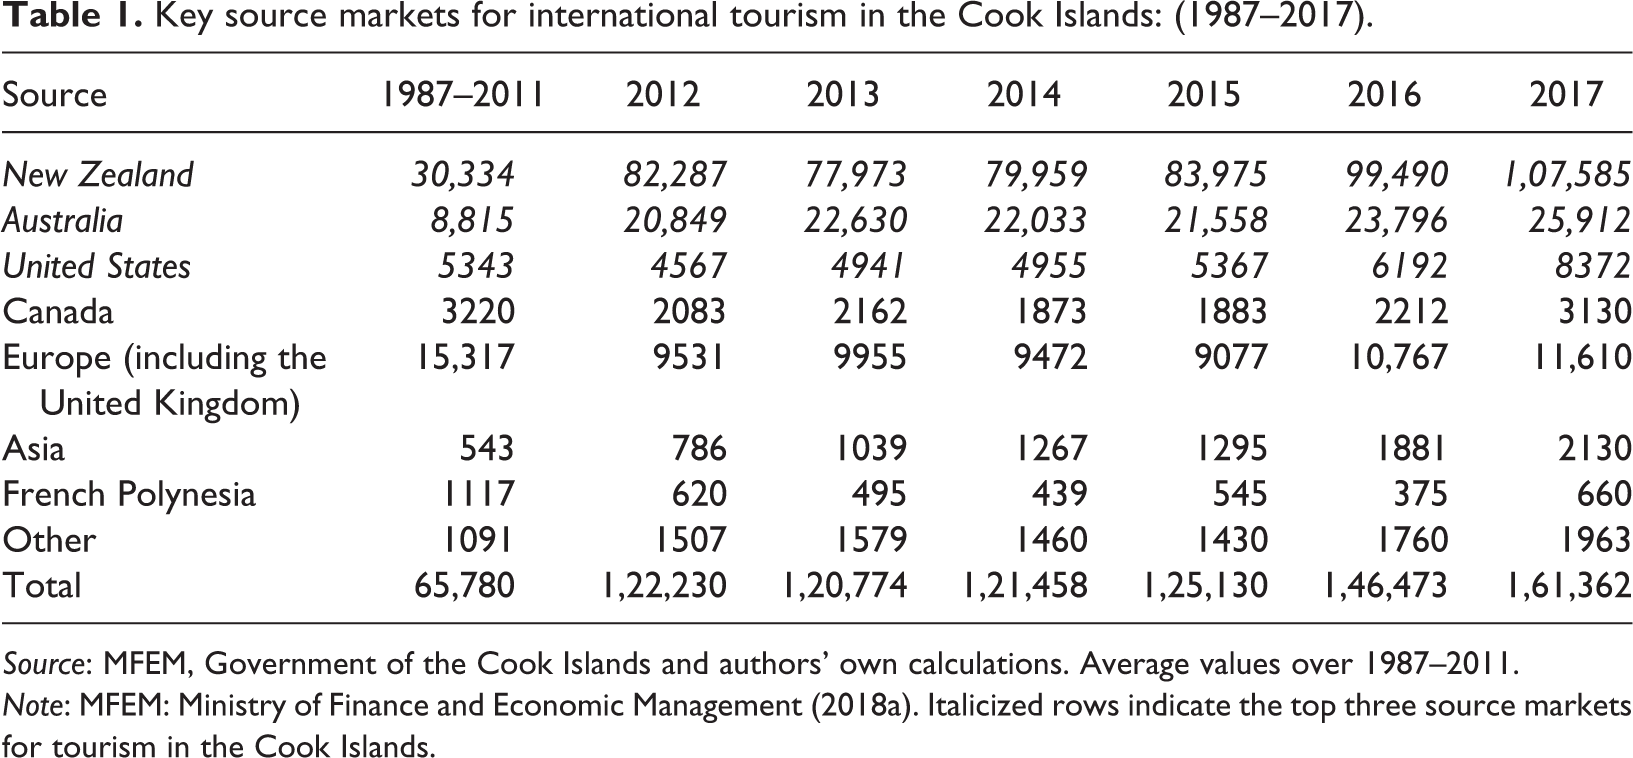
Source: MFEM, Government of the Cook Islands and authors’ own calculations. Average values over 1987–2011.
Note: MFEM: Ministry of Finance and Economic Management (2018a). Italicized rows indicate the top three source markets for tourism in the Cook Islands.
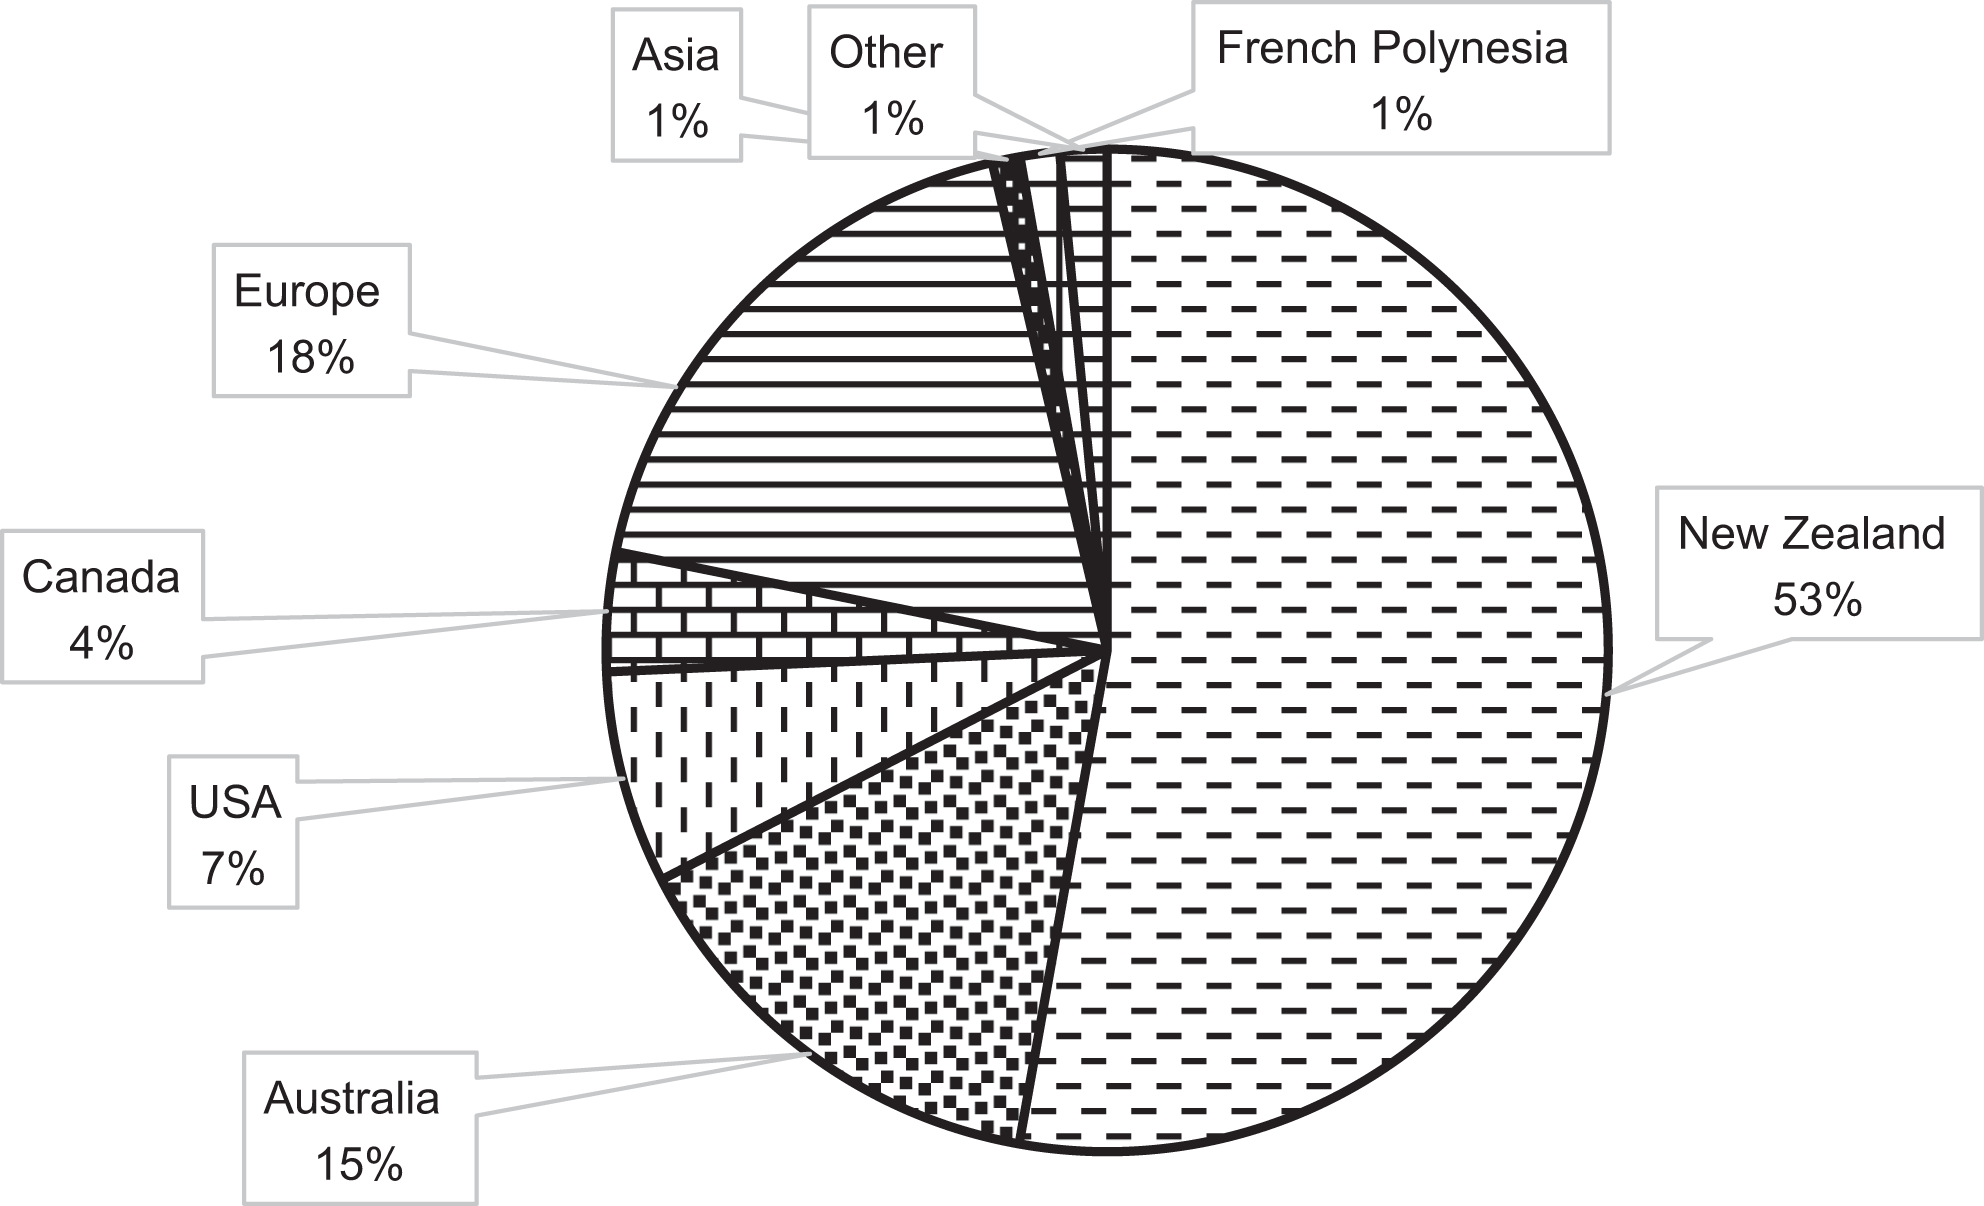
Key source markets, international tourism in the Cook Islands (1987–2017).
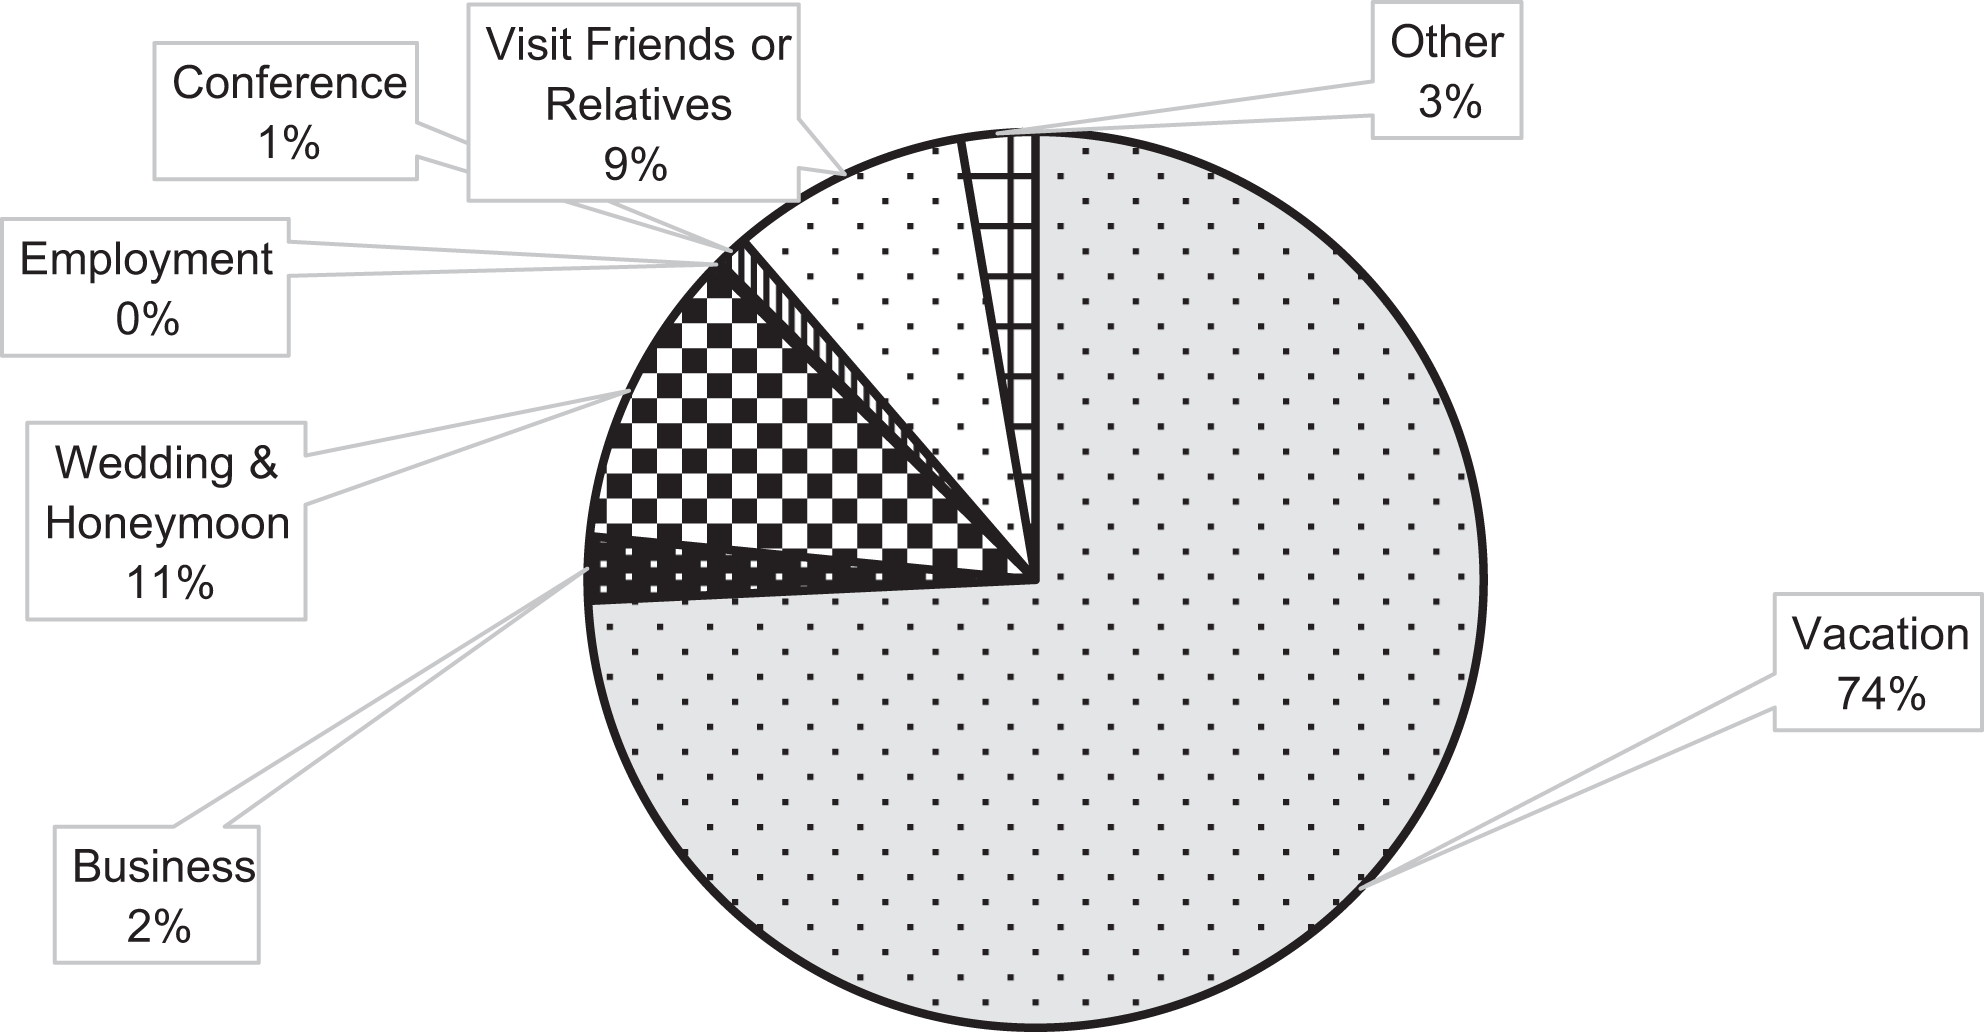
Purpose of visit, international tourism in the Cook Islands (1987–2017).
Generally, on average, about 48% of the tourists prefer to lodge in hotels, about 25% in motels, and about 15% prefer private accommodation when traveling to the Cook Islands (Ministry of Finance and Economic Management Government of the Cook Islands, 2019). The Cook Islands generally attracts tourists at the age between 45 and 59 years (Table 2). The average length of stay is about 9–11 days (Figure 3).
Age of international tourists in the Cook Islands: (1987–2017).

Source: MFEM, Government of the Cook Islands and authors’ own calculations. Average values over 1987–2011.
Note: MFEM: Ministry of Finance and Economic Management (2018a). Italicized rows indicate the top three age range for tourism in the Cook Islands.
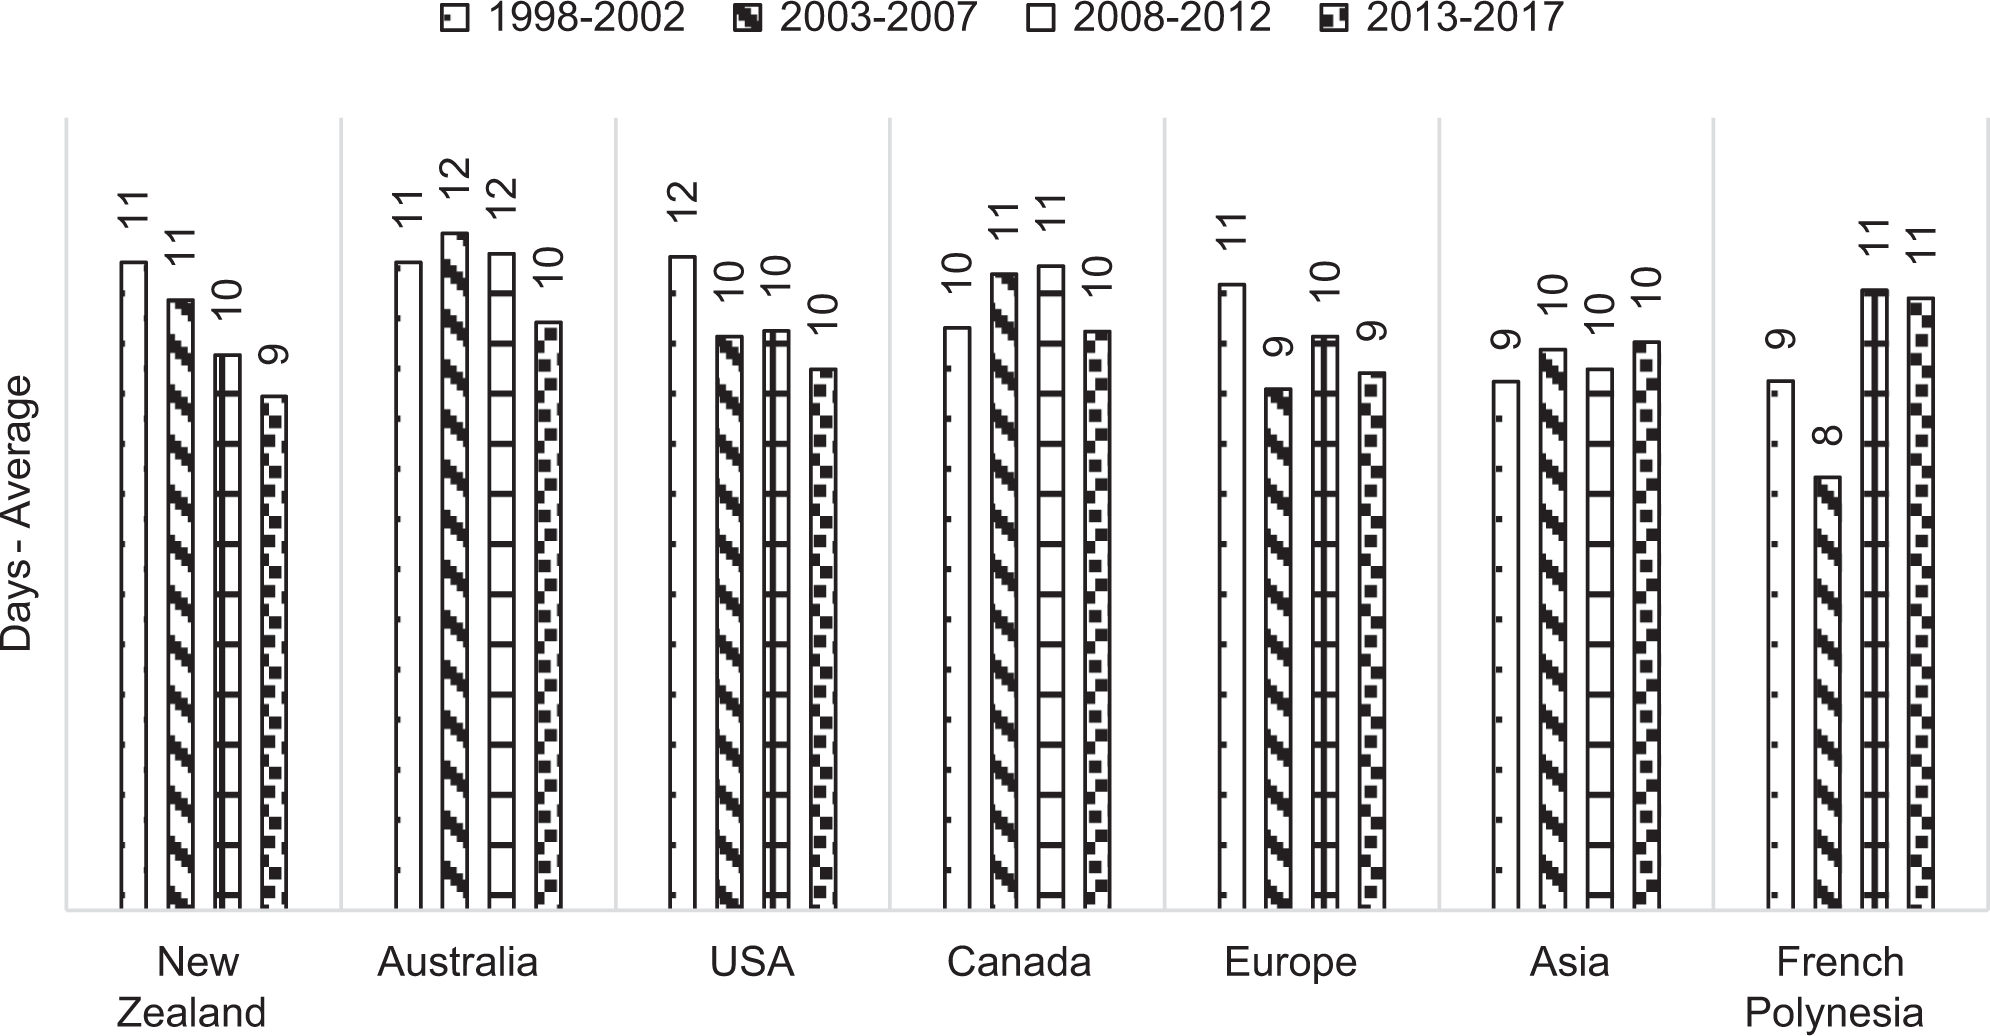
Average length of stay, international tourism in the Cook Islands (1998–2017).
Model and methods
Asymmetric cointegration, long run and short run, and dynamic multipliers
We use a model, which follows Kumar et al.’s (2016) study on the Cook Islands where they specify the following symmetric linear equation:

where yt
is the real GDP per capita,
We apply the Lee and Strazicich’s (2003) endogenously determined structural break unit root test to identify structural breaks in the dependent variable and test for the unit root hypothesis. The unit root test tests the null hypothesis that a series has a unit root with a break in the intercept. Rejection of the null hypothesis implies that a series does not have a unit root or structural breaks. After identifying the breaks, the structural break dummy in equation (1) is set to 1 for the location of the break, and 0 otherwise (Kumar et al., 2017).
To model the nonlinear association, we specify the asymmetric long-run model based on partial sum decompositions following Shin et al. (2014):

where

where

and

Shin et al. (2014) extend the symmetric autoregressive distributed lag (ARDL) bounds procedure developed by Pesaran et al. (2001) to analyze the joint issues of nonlinearity and asymmetric effects using the partial sum decompositions specified in equations (3.1) and (3.2) (Shahzad et al., 2017a).The NARDL method has several advantages. Using NARDL approach, assessment of multivariate cointegration in the presence of level stationary, first difference stationary, or fractionally integrated series can be done. The method provides estimates of long-run and short-run models in a single step. It avoids the small sample bias and the endogeneity bias conditional on the absence of residual autocorrelation. Additionally, it allows for the examination of hidden cointegration and provides asymmetric dynamic multipliers that trace the asymmetric intertemporal response of the dependent variable due to positive–negative changes in the explanatory variables (Fousekis et al., 2016; Nusair, 2016; Shahzad et al., 2017a).
For the purpose of estimating the asymmetric long-run and short-run elasticities, we specify the following NARDL model:
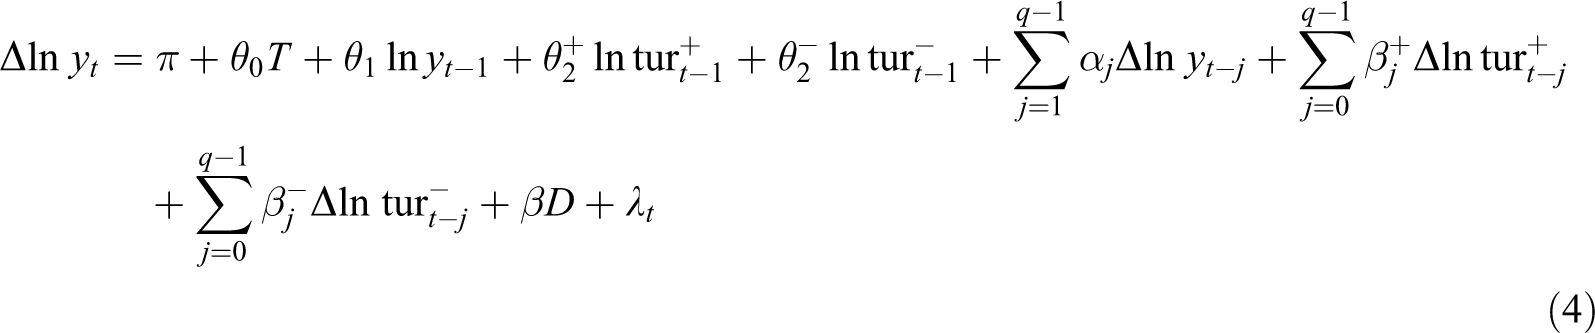
where
To examine the long-run asymmetry in equation (4), we test the null hypothesis of long-run symmetry of
To examine cointegration in equation (4), the null hypothesis of no cointegration
In the final step, we extract the asymmetric cumulative dynamic multiplier on

If
Asymmetric causality
With insights from Alper and Oguz (2016) and Hatemi-J (2012), we examine the asymmetric causality between tourism and per capita GDP in the Cook Islands by incorporating the partial sum decompositions specified in equation (3) in the augmented vector autoregression (VAR) approach developed by Toda and Yamamoto (1995). The Toda–Yamamoto approach can examine causality with level, first and second difference variables, and variables that are cointegrated, not cointegrated, or cointegrated of arbitrary order, unlike the vector error correction model approach which requires that all variables are first difference stationary and cointegrated (Kumar et al., 2016). We extend the single equation asymmetric model specified in equation (2) in the following asymmetric VAR model to examine the asymmetric causality:



where
The approach uses the information on the optimum lag length of the NARDL procedure (q) and the maximum order of integration derived from the unit root tests (d) to determine the maximum lag length, which is used in the VAR specification (l
Data and results
Data
The data used in this study are from the Cook Islands Statistics Office available at the Cook Islands Ministry of Finance and Economic Management (http://www.mfem.gov.ck/statistics). Quarterly data for GDP are in constant 2006 New Zealand dollars, which is Cook Islands’ official currency, and the data are available from 2010Q1 to 2016Q4. The data on visitor arrivals are from 1993Q1 to 2018Q2. The data on the population are over the periods 1963Q1 to 2016Q3. For consistency, we use a sample of 2010Q1 to 2016Q3, that is, 27 quarterly observations.
Descriptive statistics and correlation matrix
Table 3 provides descriptive statistics and correlation matrix. As noted, the correlation between visitor arrivals and GDP (in per capita terms) is positive and statistically significant at the 1% level.
Descriptive statistics and correlation matrix.

Note: GDP: gross domestic product.
***Significant at 1%; p-values in [ ].
Unit root and structural break tests
The unit root test results (Table 4) based on the augmented Dickey–Fuller test (Dickey and Fuller, 1979; Said and Dickey, 1984), the Phillips–Perron test (Phillips and Perron, 1988), the Kwiatkowski–Phillips–Schmidt–Shin test (Kwiatkowski et al., 1992), and the Ng–Perron test (Ng and Perron, 2001) generally indicate that the data are integrated of a maximum order of 1.
Unit root tests.
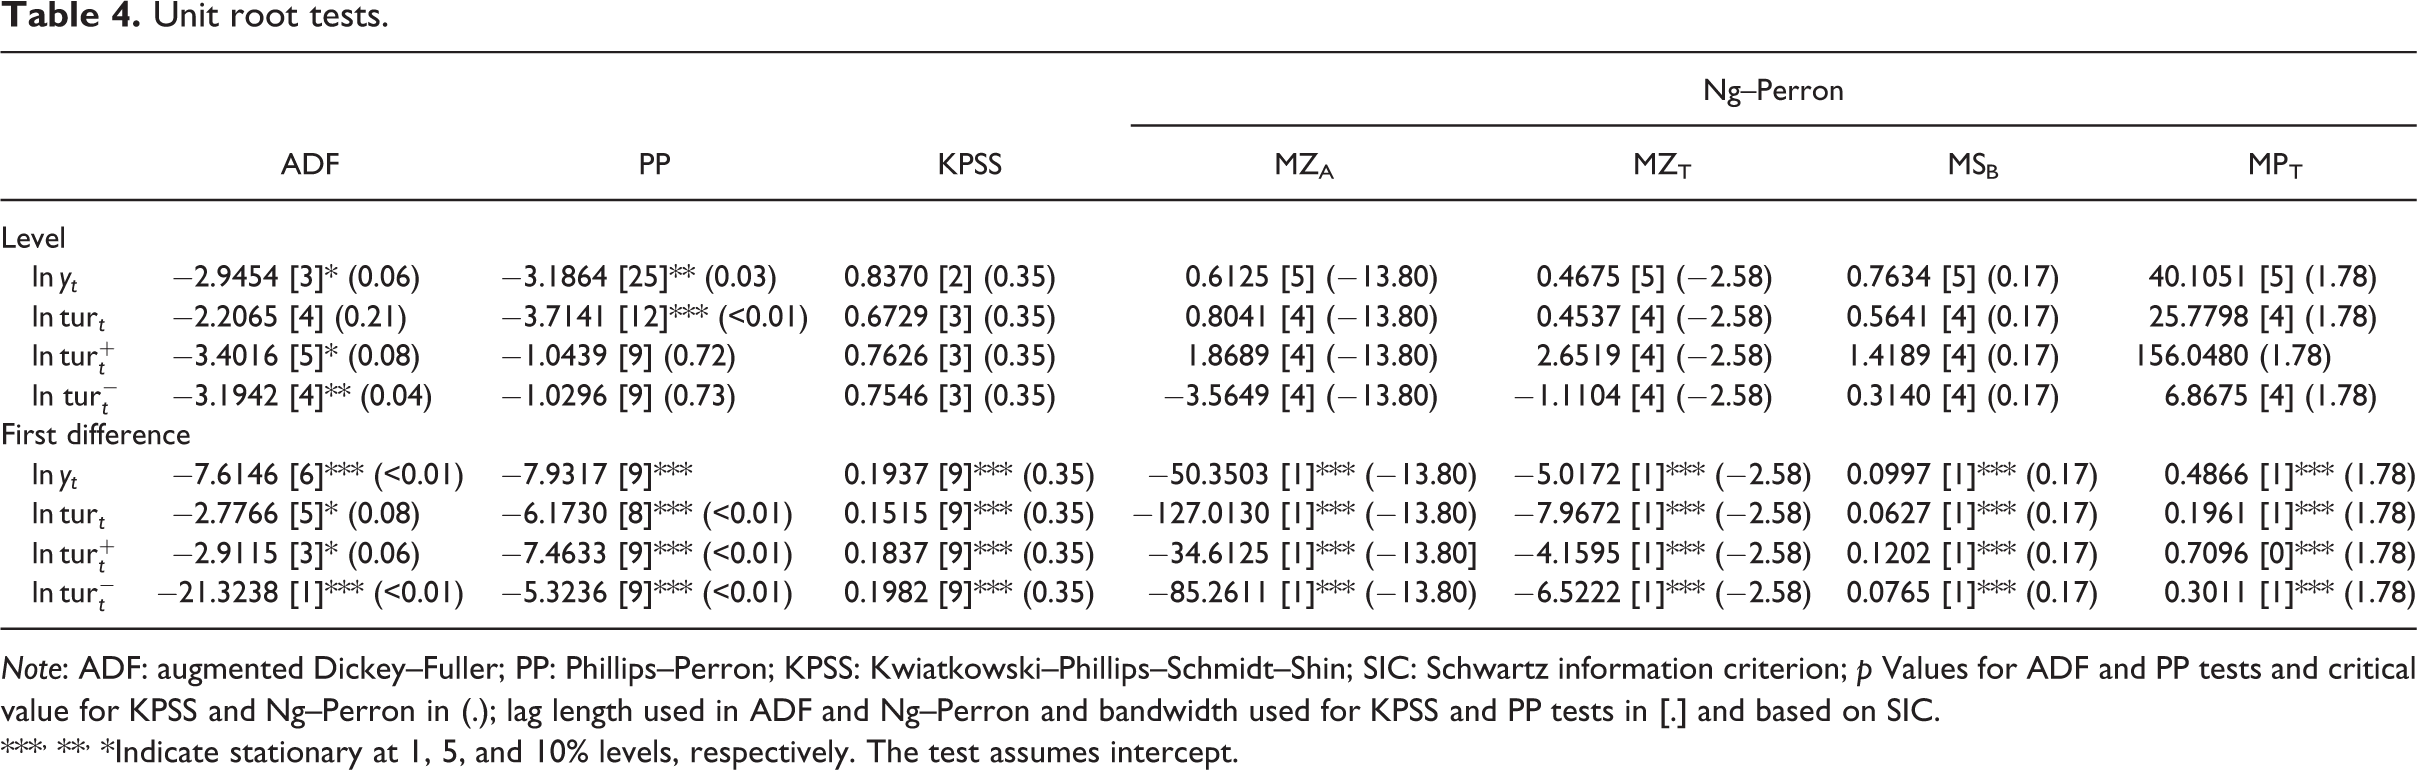
Note: ADF: augmented Dickey–Fuller; PP: Phillips–Perron; KPSS: Kwiatkowski–Phillips–Schmidt–Shin; SIC: Schwartz information criterion; p Values for ADF and PP tests and critical value for KPSS and Ng–Perron in (.); lag length used in ADF and Ng–Perron and bandwidth used for KPSS and PP tests in [.] and based on SIC.
***, **, *Indicate stationary at 1, 5, and 10% levels, respectively. The test assumes intercept.
We examine the structural breaks using four different tests: Narayan and Popp’s (2010) test, the Lee and Strazicich’s (2003) test, the Zivot and Andrews’ (1992) test, the Perron’s (1997) test and the innovational and additive outlier tests (Table 5). The Zivot–Andrews, Perron, and innovational and additive outlier tests do not give any evidence of structural breaks. The breaks from the Narayan–Popp test are insignificant both in the long run and in the short run. However, the breaks identified by the Lee–Strazicich test are significant in the short run only and thus retained in the analysis. Also, we note that there were no major differences in the NARDL results by including the breaks from either the Narayan–Popp test or the Lee–Strazicich test.
Structural break unit root tests.
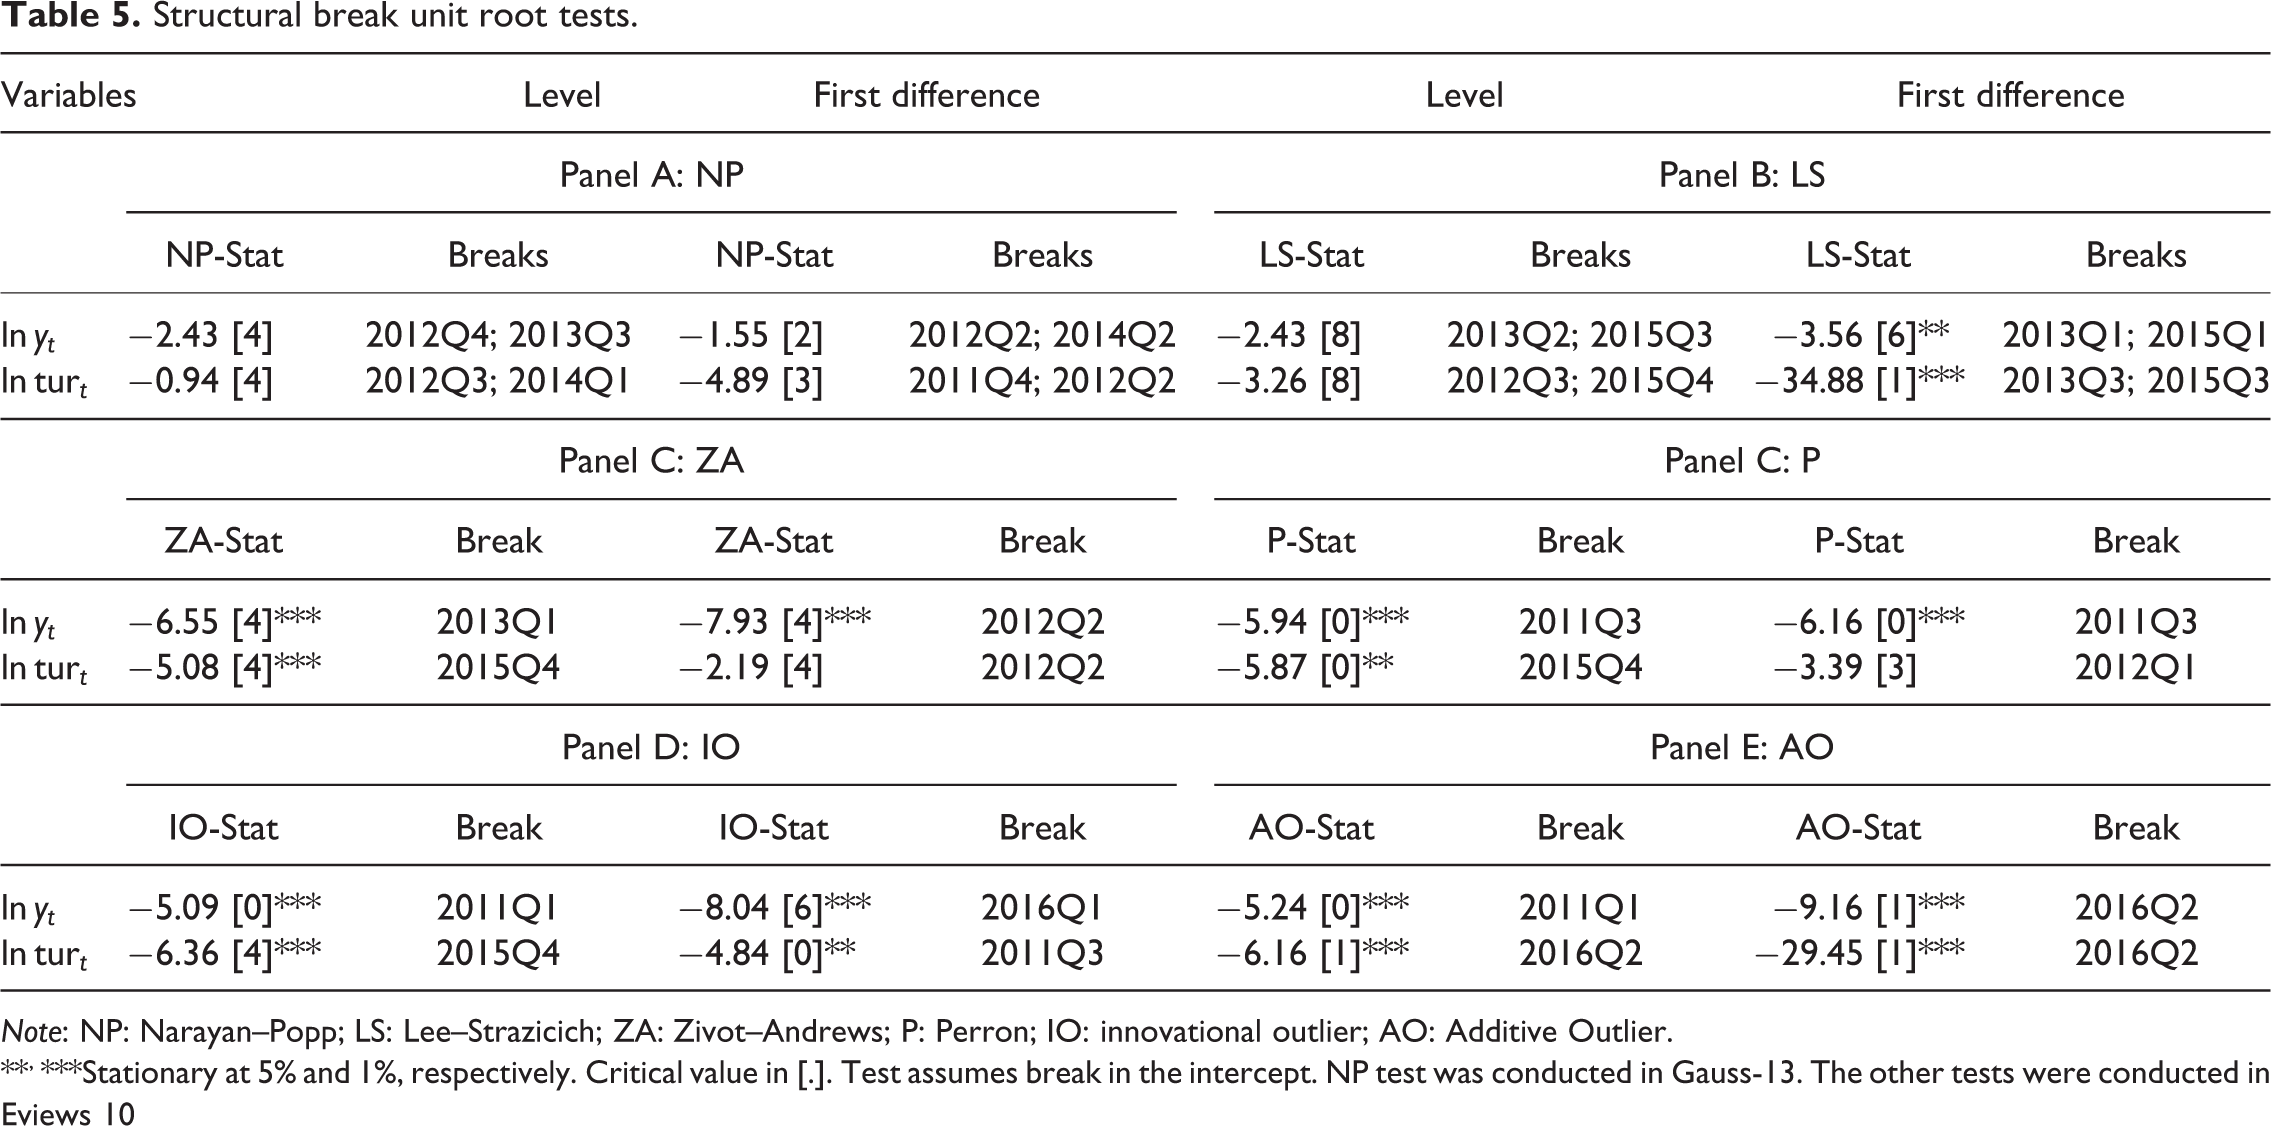
Note: NP: Narayan–Popp; LS: Lee–Strazicich; ZA: Zivot–Andrews; P: Perron; IO: innovational outlier; AO: Additive Outlier.
**, ***Stationary at 5% and 1%, respectively. Critical value in [.]. Test assumes break in the intercept. NP test was conducted in Gauss-13. The other tests were conducted in Eviews 10
We obtained the break periods 2012Q4 and 2013Q3 for the levels-GDP series, and 2012Q2 and 2014Q2 for the first differenced-GDP series (Table 5). However, because the breaks were insignificant in the final NARDL estimation, we excluded them from the analysis. 4 The Lee and Strazicich’s (2003) test find the significant breaks as 2013Q2 and 2015Q3 for the per capita GDP series, and 2012Q3 and 2015Q4 for the visitor arrivals series. The breaks generally represent the positive short-run effects of favorable events such as stable outcomes in the 2015 general elections or sporting events in the Cook Islands in 2013. We include these breaks in the NARDL lag estimate model (Kumar et al., 2017).
Lag length and specification tests
We examine the appropriate lag lengths for the (nonlinear) ARDL model based on a number of criteria (Table 6).
Lag length test.
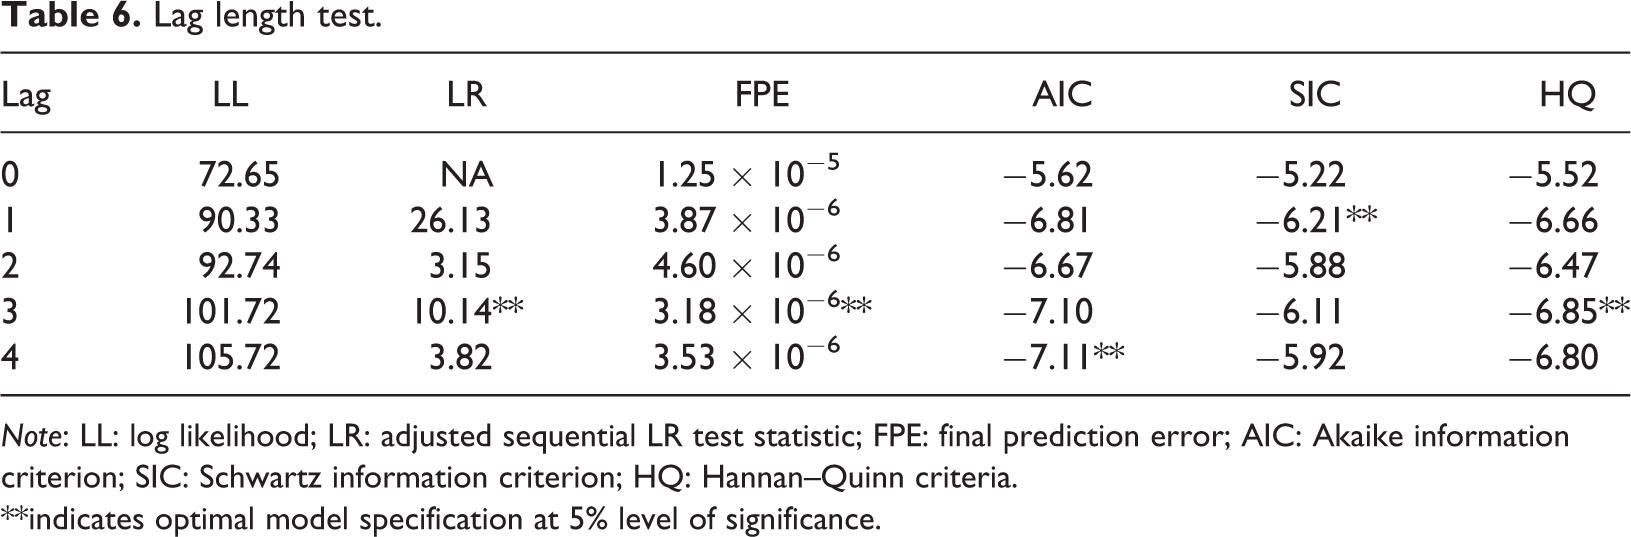
Note: LL: log likelihood; LR: adjusted sequential LR test statistic; FPE: final prediction error; AIC: Akaike information criterion; SIC: Schwartz information criterion; HQ: Hannan–Quinn criteria.
**indicates optimal model specification at 5% level of significance.
To identify the optimum results on the relationship between GDP and visitor arrivals, we estimate using all the lag lengths suggested by the five criteria (serial correlation (SC) = 1, adjusted sequential LR test statistic, final prediction error, and Hannan–Quinn criteria = 3, and Akaike information criterion = 4). We note stable results with the lag length of 1. Additionally, given the small sample size (n = 27), a lag length of 1 is justified. In terms of optimal combination (Table 7), the NARDL (1,1,1) specification is selected based on the Schwartz information criterion.
Model specification test.

Note: LL: log likelihood; AIC: Akaike information criterion; SIC: Schwartz information criterion; HQ: Hannan–Quinn criteria; NARDL: nonlinear autoregressive distributed lag.
**indicates optimal model specification at 5% level of significance.
Cointegration and asymmetric effects test
Table 8 presents the results of the bounds test of cointegration. We confirm cointegration in the NARDL (1,1,1) model. Notably, linear and nonlinear cointegrations are present in the models which are suggestive of hidden cointegration and necessitate the nonlinear estimation (Granger and Yoon, 2002).
Bounds test.
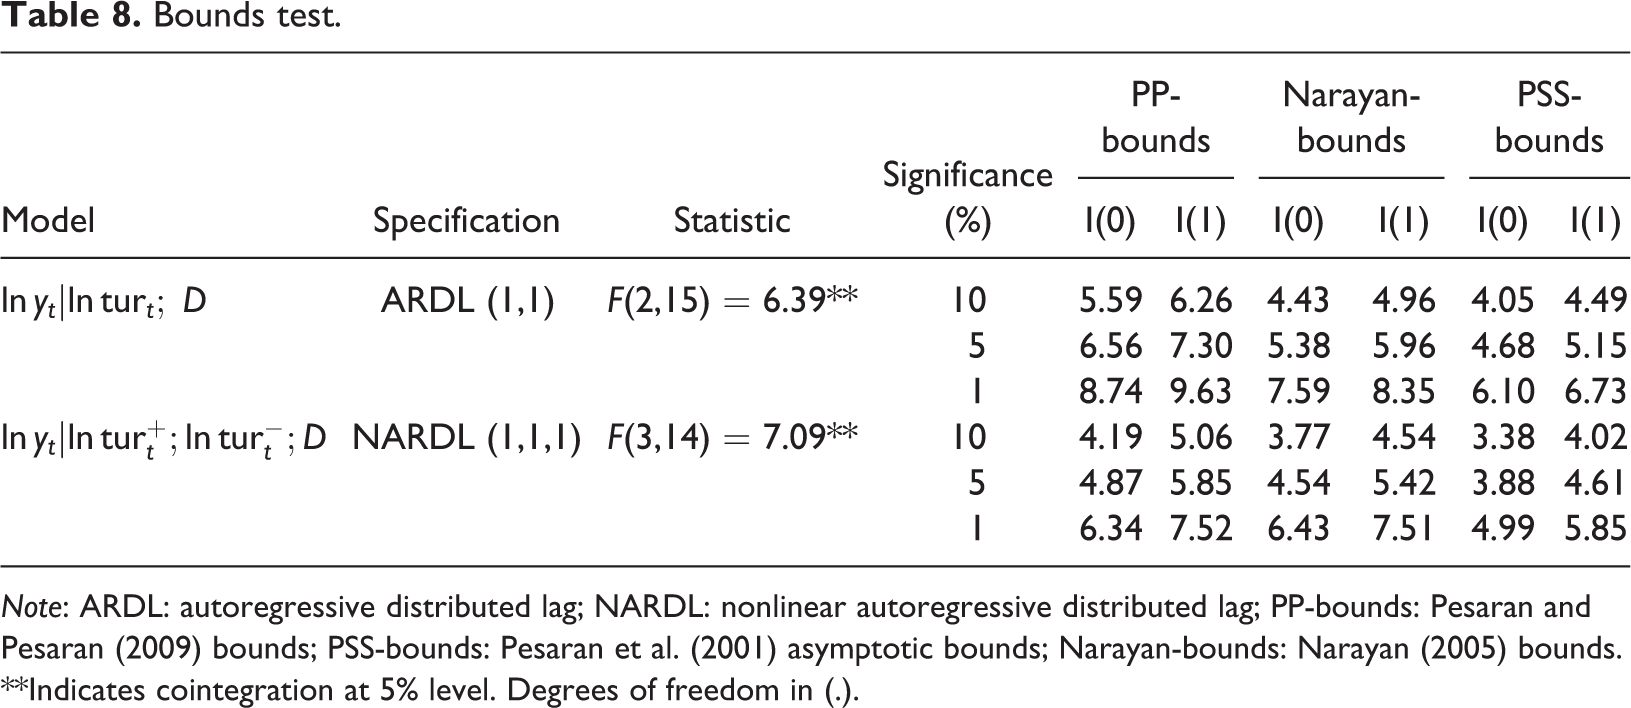
Note: ARDL: autoregressive distributed lag; NARDL: nonlinear autoregressive distributed lag; PP-bounds: Pesaran and Pesaran (2009) bounds; PSS-bounds: Pesaran et al. (2001) asymptotic bounds; Narayan-bounds: Narayan (2005) bounds.
**Indicates cointegration at 5% level. Degrees of freedom in (.).
Table 9 presents the results of the NARDL asymmetric effects. We note statistically significant asymmetric effects of tourism on real per capita GDP, both in the long run and in the short run.
Asymmetric effects test.

Note: GDP: gross domestic product.
**, ***Indicate asymmetric effects at 5% and 10%, respectively. Degrees of freedom in () and p value in [].
Long run, short run, dynamic asymmetric multiplier, and dynamic stability
Based on the asymmetric long-run results, an increase of tourism activity by 1% results in an increase of real GDP per capita by 0.92%
Regarding the short-run results, we note that a 1% increase in visitor arrivals increases the per capita real GDP by 1.37%
It can be derived from the black solid line of the dynamic multiplier plots (Figure 1) that a 1% increase in visitor arrivals increases the short-run GDP by more than 1% and this converges to about 1% in the long run. Similarly, looking at the black-dashed line, it is clear that a 1% decline in visitor arrivals decreases short-run economic growth by more than 1% and this converges to around −0.3% in the long run (Ahad and Dar, 2017). Interestingly, the net effect of tourism (thick red-dashed line) is positive both in the short run and in the long run, increases in the short run, and finally converges around 0.6% (Figure 4).
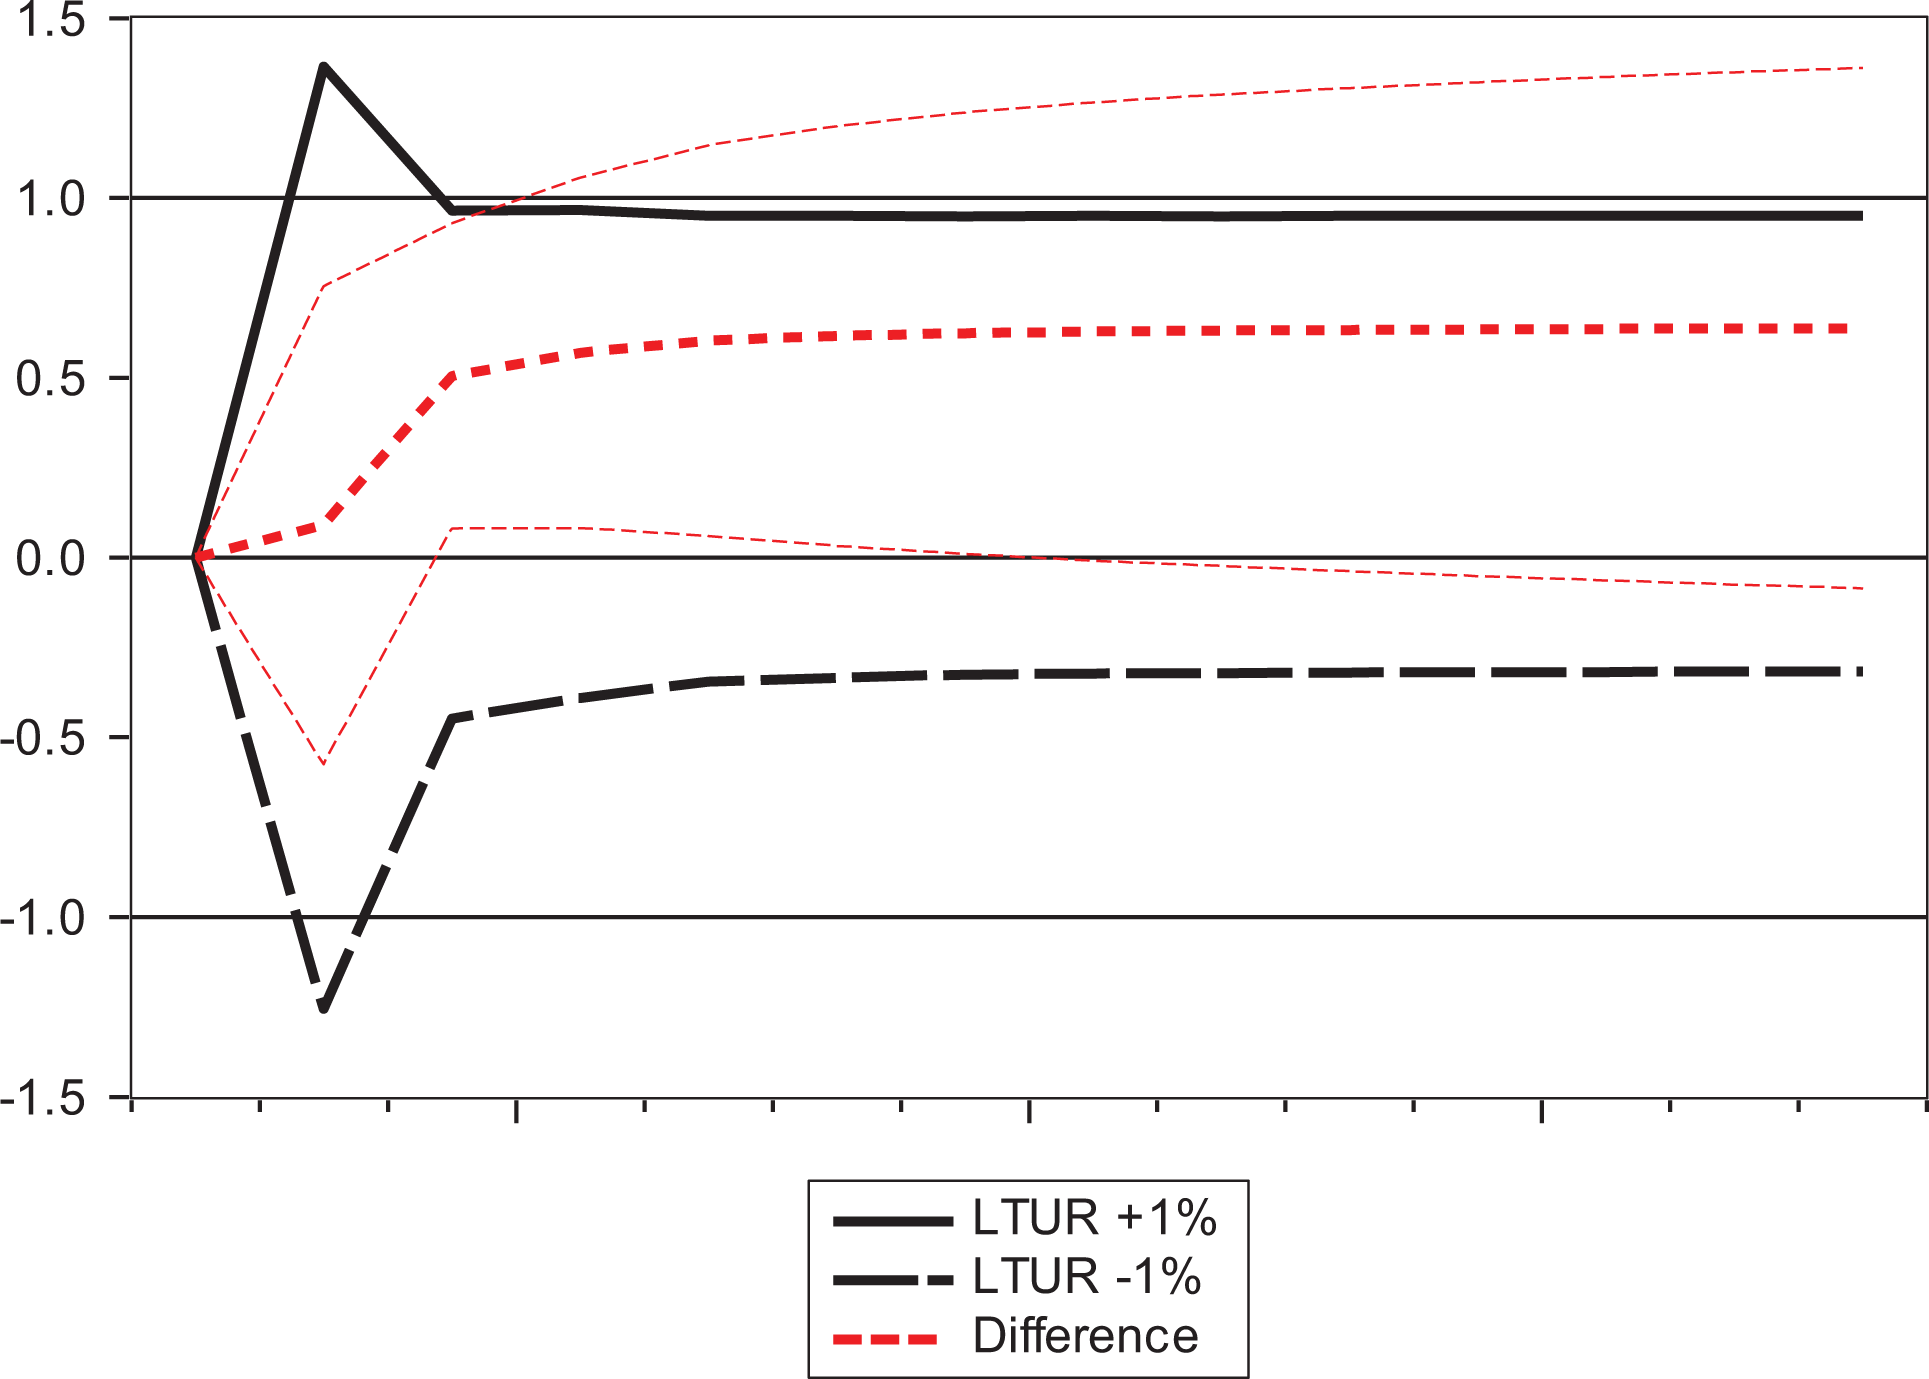
NARDL (1,1,1) dynamic asymmetric multiplier. NARDL: nonlinear autoregressive distributed lag.
We conduct the following tests for the estimated NARDL (1,1,1) model: the Breusch–Godfrey Lagrange multiplier (LM) test of residual SC; the Ramsey Regression Equation Specification Error test using the square of fitted values for the correct functional form; the Jarque–Bera’s normality test based on the skewness and kurtosis of residuals; and the Breusch–Pagan–Godfrey’s heteroscedasticity test based on the regression of the squared residual on the squared fitted values. Further, we examine the stability of the results from the cumulative sum of recursive residuals and the cumulative sum of squares of recursive residuals. As indicated by Table 10, panel C and Figure 5, the estimated model satisfies these diagnostic tests.
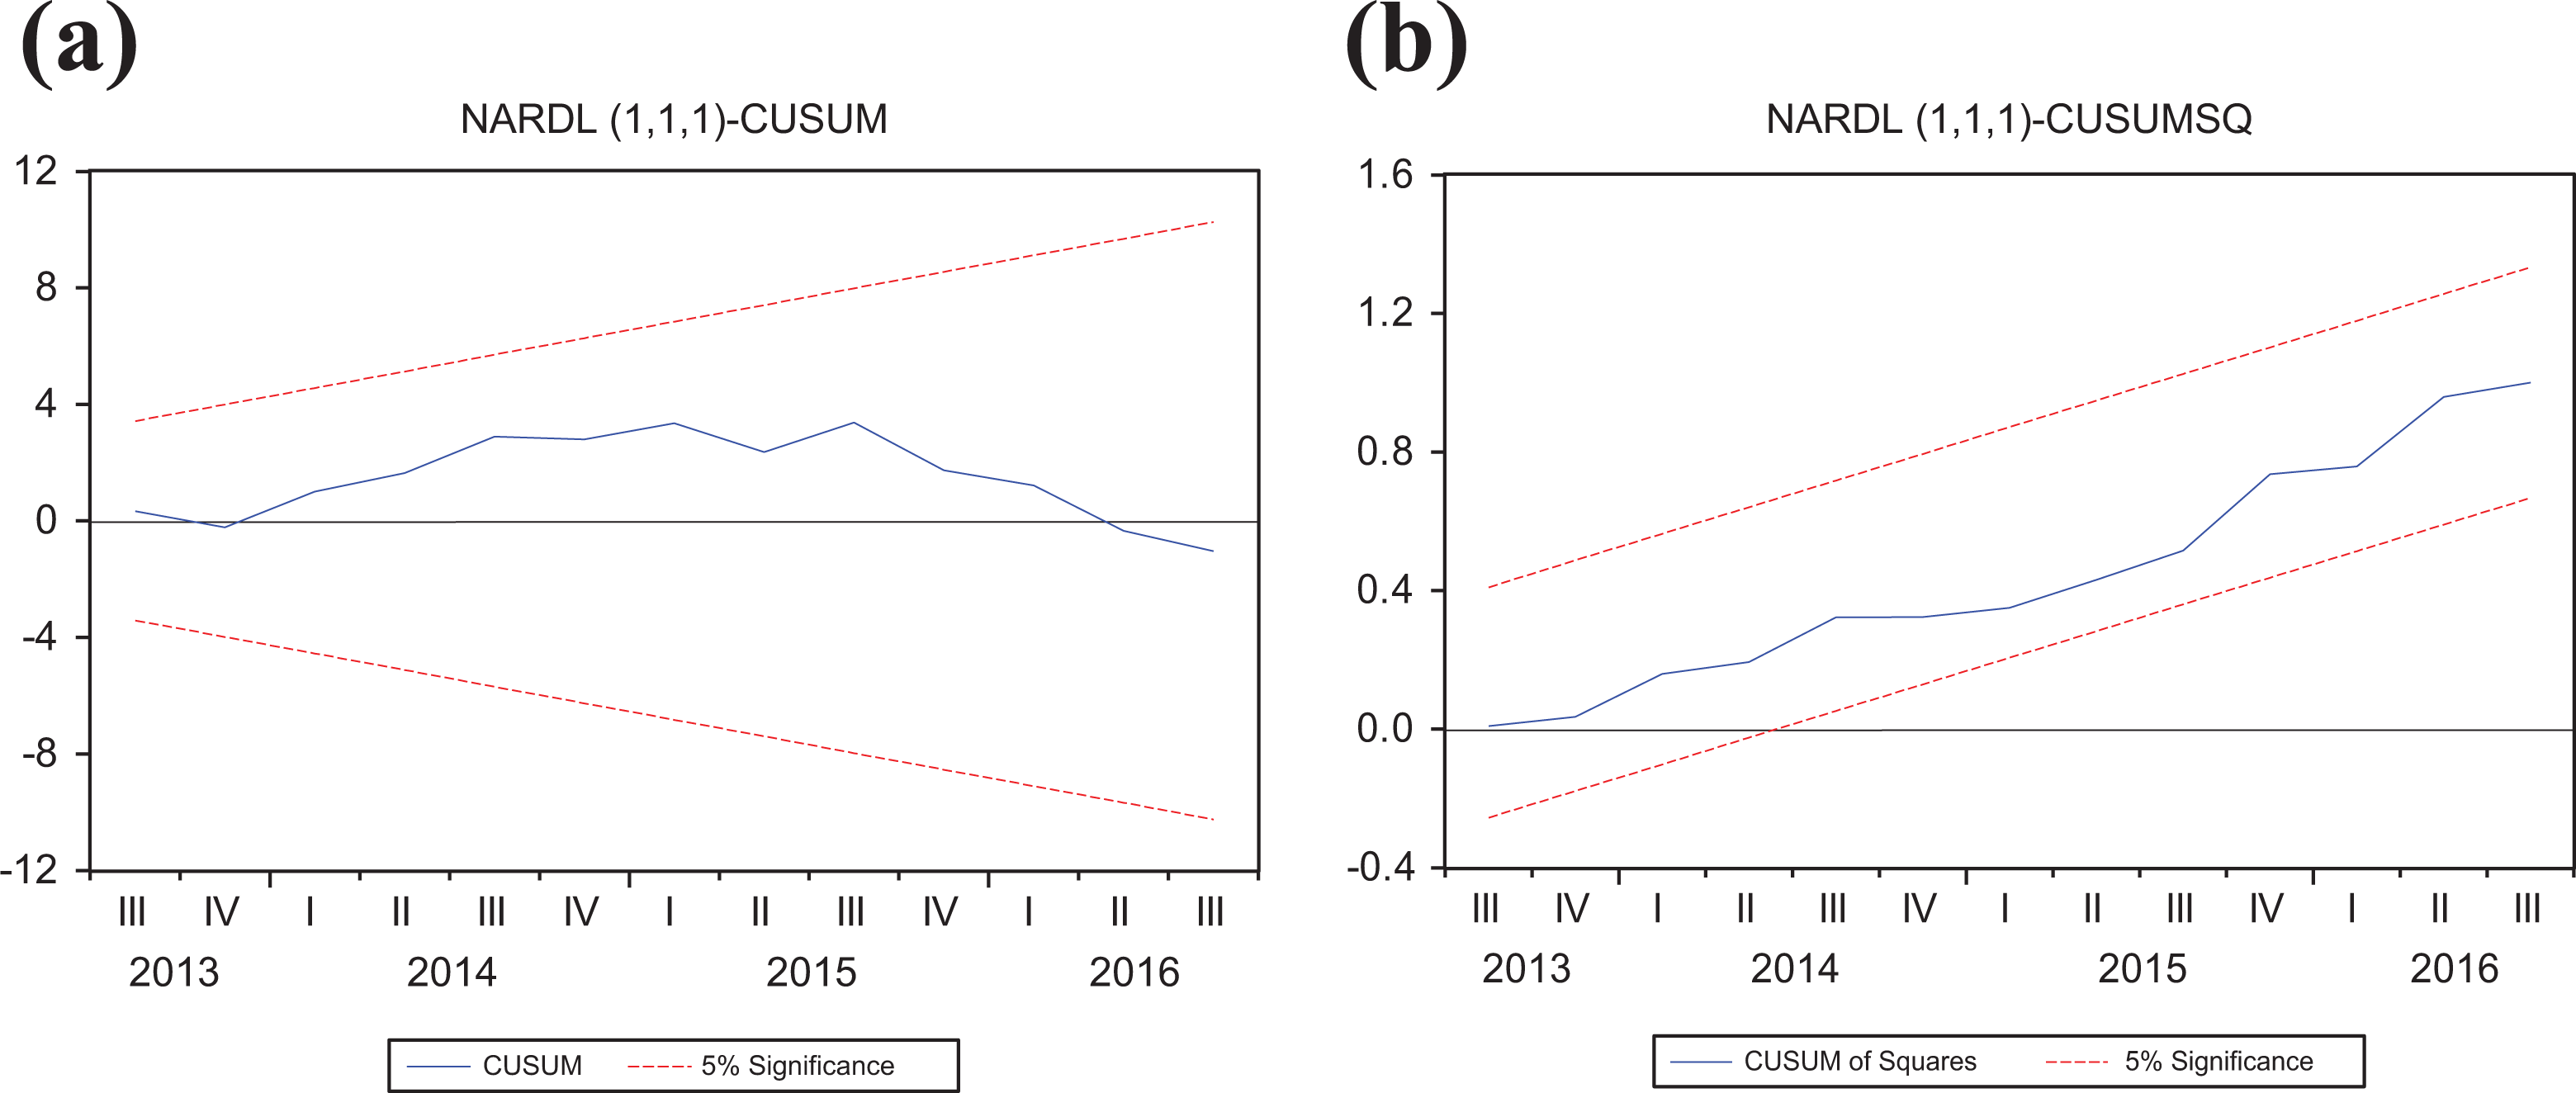
NARDL (a) CUSUM and (b) CUSUMSQ stability plots.
Long run and short run, NARDL (1,1,1).
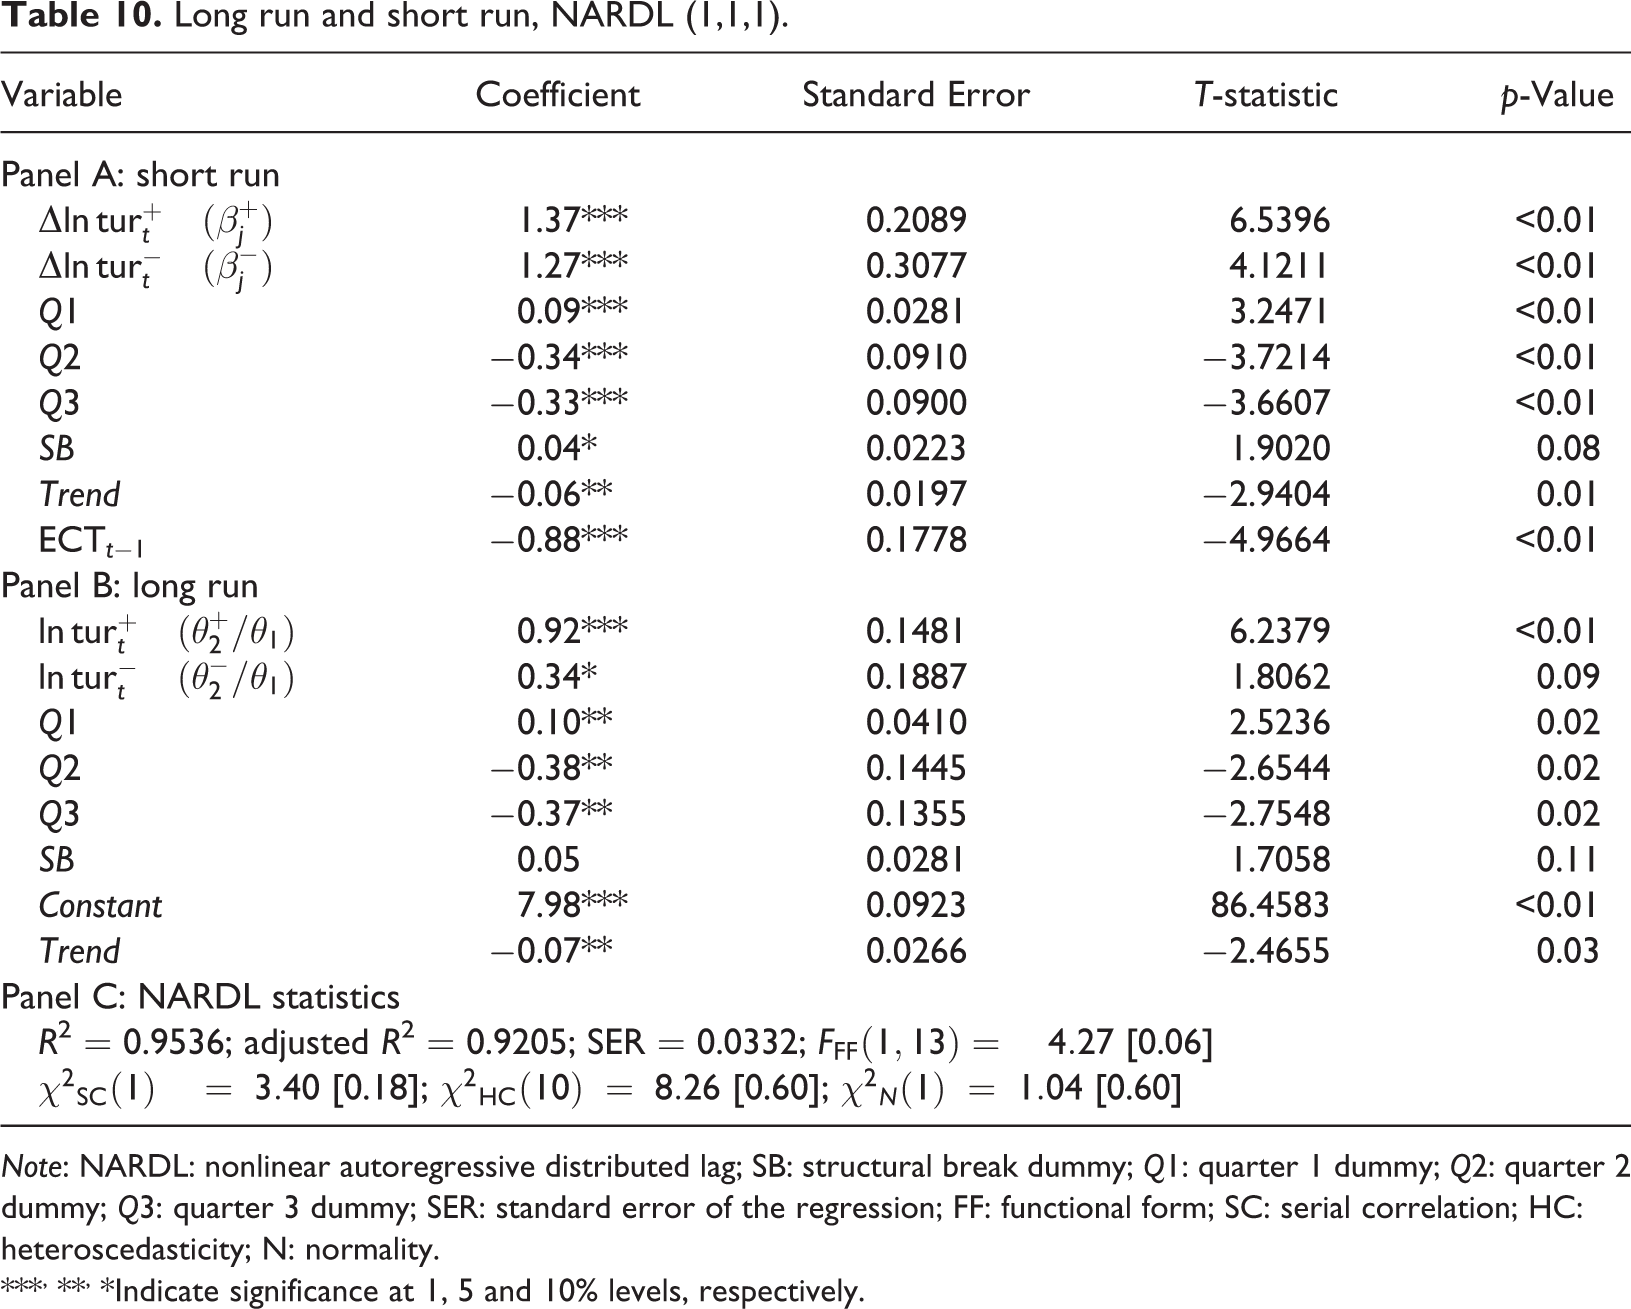
Note: NARDL: nonlinear autoregressive distributed lag; SB: structural break dummy; Q1: quarter 1 dummy; Q2: quarter 2 dummy; Q3: quarter 3 dummy; SER: standard error of the regression; FF: functional form; SC: serial correlation; HC: heteroscedasticity; N: normality.
***, **, *Indicate significance at 1, 5 and 10% levels, respectively.
Causality test
Based on the unit root results, which is noted to be integrated of a maximum of order 1 (Table 3) and the maximum lag used in the NARDL specification which is also noted at 1 (Table 6), we note that a maximum lag length of up to 2 is appropriate in the assessment of causality (Kumar et al., 2016; Toda and Yamamoto, 1995). We, therefore, set the optimum lag of 1 in the VAR models to test for linear and nonlinear causality (Kumar and Stauvermann, 2016). We report the symmetric and asymmetric causality results in Tables 11 and 12.
The symmetric and asymmetric causality results indicate a bidirectional or mutually reinforcing causality between visitor arrivals and per capita GDP. Table 11 supports the earlier results derived by Kumar et al. (2016) in the Cook Islands; however, the results tend to diverge from other studies in the Pacific such as on Fiji (Kumar et al., 2018). Interestingly, the positive and negative decompositions have a mutual causality between them which suggests that periods of tourism sector expansions and contractions predict each other. 6,7
We assess the diagnostics of the VAR model using the SC LM test, the Breusch–Pagan–Godfrey test for heteroscedasticity and the Jarque–Bera test for residual normality. The stability of the VAR models is assessed using the inverse roots of the autoregressive characteristic polynomial graph. As indicated in panel B of Tables 11(a) and 11(b), and by Figure 6, the estimated VAR models satisfy these diagnostic tests.
Symmetric causality.
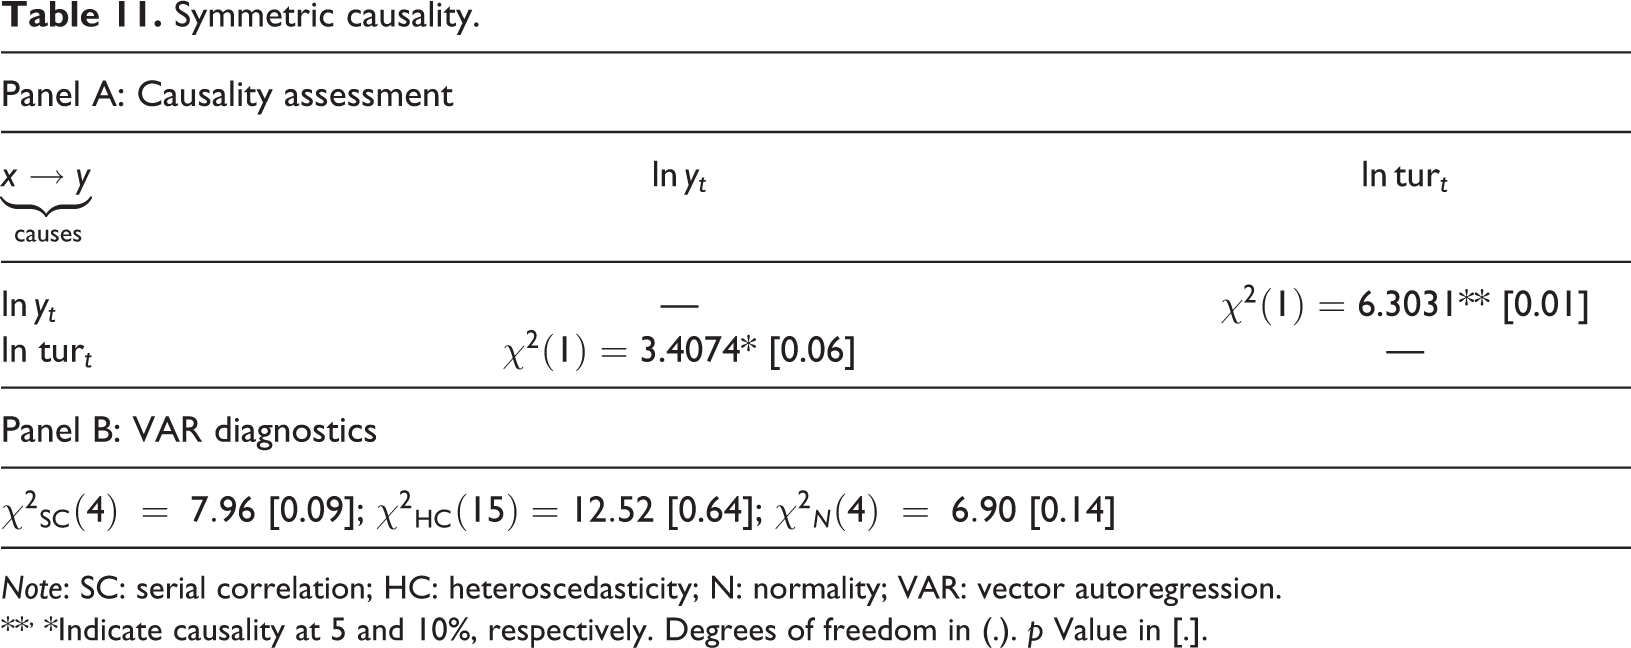
Note: SC: serial correlation; HC: heteroscedasticity; N: normality; VAR: vector autoregression.
**, *Indicate causality at 5 and 10%, respectively. Degrees of freedom in (.). p Value in [.].
Asymmetric causality.

Note: VAR: vector autoregression.
***, **, *Indicate causality at 1, 5, and 10%, respectively. Degrees of freedom in (.). p Value in [.]

Inverse roots of AR characteristic polynomial: (a) symmetric VAR (1,1) and (b) asymmetric VAR (1,1,1).
Discussion and conclusion
In this study, using the nonlinear setting, we examine the relationship between tourism and economic growth in the Cook Islands using quarterly data from 2010Q1 to 2016Q3. The NARDL approach is used while controlling for structural breaks to examine the asymmetric cointegration, asymmetric elasticities, and the dynamic effect. To examine causality, we apply the asymmetric VAR causality procedure of Hatemi-J (2012).
Before proceeding to the policy discussion, we highlight some limitations in our study. While we study the tourism–growth relationship, we use a reduced form model similar to Kumar et al. (2016) because of the unavailability of data on capital stock and investment. Although the nonlinear ARDL model has been shown to avoid the bias with endogenous regressors and omitted variables (Nusair, 2016), the method generally requires a larger dataset. Additionally, one can apply other structural break tests, such as Bai and Perron (2003) or Carrion-i-Silvestre et al. (2009), which can provide alternative break points in the sample that can strengthen the analysis. Moreover, our study provides a macro picture, that is, the impact of visitor arrivals on the economic growth of the Cook Islands. However, a microlevel analysis to investigate demand and utility of tourists traveling to the country, the challenges in developing tourism activities (Stumpf and Swanger, 2017) and the productivity in the sector will definitely provide additional insights. On the same note, estimating a tourism demand model to examine price and income elasticities will indicate the sensitiveness and the type of tourists traveling to the Cook Islands. Future research can revisit this relationship in the Cook Islands after controlling for additional variables, such as capital stock and official development assistance. Due to data constraints, we have used only 27 years of data for asymmetry analysis. Future research can examine the asymmetric relationship with a longer period of data and subsequently compare the consistency of the results presented here.
Against these limitations, our study majorly contributes to the tourism–growth literature by examining the nonlinear effects and measuring the relative strength of the impact of the tourism sector when visitor arrivals are increasing or decreasing. Most of the previous studies consider linear estimations, which cannot report such outcomes. If nothing else, studies such as this one provide the relative importance of the sector to an economy and feed into policy planning. In summary, our findings show that visitor arrivals and per capita real GDP exhibit asymmetric cointegration. The gains namely economic growth from visitor arrivals moving in the positive direction outweighs the losses when the visitor arrivals are falling. Therefore, increasing visitor arrivals through greater marketing and tourism infrastructure developments, such as roads, technology, and hotel services, are highly recommended. To interpret our results carefully, it can be argued that investments in the tourism sector itself create growth and attract more tourists. Moreover, even if the number of tourist’s decline from time to time, the subsequent increases will overcompensate the possible losses of the declines. Therefore, government investments in infrastructure and improvement of the quality of the tourism sector bear a low risk of default and ensure a healthy return on investment. We believe that this is a relevant and important insight that provides useful information for policymaking.
Therefore, more investment in the tourism sector is called for, which can come in the form of better services, maintaining a balance between high-end value-added products and reasonably priced or affordable products. Consequently, the success and sustainability of the tourism sector will require an investigation of the types and preferences of tourists to better target tourism products and services. Of course, promoting culture, history, and natural attractions of the Cook Islands are useful in terms of policy. Investments in improving basic infrastructure, such as road and transportation services, information and communication technology services, and financial services, should remain an ongoing priority. Alternative strategies should consider destination marketing and targeting additional markets, the possibility of relaxing visa requirements, better coordination with travel and booking agents, accommodation providers, and airline services to ensure overall improvements in the experience of tourists traveling from their home country to the Cook Islands.
On the search for new markets for the tourism sector, the possibility of trade in services liberalization with respect to tourism sector can be considered. Although the Cook Islands is not a member of the World Trade Organization and therefore not party to the General Agreement on Trade in Services, it can integrate its tourism sector at the regional level and consider liberalization of the sector under the four modes of supply which include inter alia cross border, consumption abroad, commercial presence, and movement of natural persons. Initially, the Cook Islands can explore the possibility of tourism sector liberalization within the Pacific region under the existing Pacific Island Countries Trade Agreement Trade in Services and the Pacific Agreement on Closer Economic Relations (PACER Plus). It can also explore Trade in Services Agreement deals with Asia, Europe, and other countries bilaterally. A legally binding trade in services agreement in the tourism sector will provide investor confidence and attract foreign direct investment, thus further boost economic growth.
Footnotes
Acknowledgements
The authors sincerely thank the Editor of Tourism Economics, Prof. Raffaele Scuderi, and the anonymous reviewers for their comments and suggestions. Peter J. Stauvermann acknowledges thankfully the financial support of the Changwon National University Research Fund in 2018-2019 for his ongoing research participations. This research per se did not receive any form of financial support. The usual disclaimer applies.
Declaration of conflicting interests
The author(s) declared no potential conflicts of interest with respect to the research, authorship, and/or publication of this article.
Funding
The author(s) received no financial support for the research, authorship, and/or publication of this article.
