
Abstract
While hotel revenue managers utilize tools such as pricing, market segmentation, rate fences, and forecasting to maximize revenue, hosts in peer-to-peer (P2P) accommodations often have limited knowledge and lack the sophisticated pricing tools. Despite online resources for revenue management available, there has yet to be an examination regarding how widely spread these practices are in the P2P accommodation segment. Based on daily best available rates and booking restrictions information for P2P accommodations listed on Airbnb from top 10 cities with highest room inventories in the United States, this study aims to shed light on the current state of revenue management adoption on Airbnb. Utilizing a total of 307,955 Airbnb property’s daily data for 32 months, this study found that there are significant differences in revenue management practices by host characteristics (multi-unit hosts vs. single-unit hosts: Superhosts vs. non-Superhosts) for three revenue management tactics: dynamic pricing, minimum night’s stay, and restricted cancellation, and the hosts practices changes as their experience accumulates.
Introduction
Since Airbnb began operations in 2008 (Airbnb, 2019), peer-to-peer (P2P) accommodations have begun to emerge as a micro-entrepreneurial pursuit for renters, homeowners, and investors who are seeking to monetize their living space (Kusisto, 2015). The term peer-to-peer accommodation is widely used in academic to refer to any lodging option which (a) was originally built as long-term housing, (b) can only be booked as a short-term vacation rental via a website exchange like Airbnb or HomeAway, and (c) is not subjection to taxation as a hotel property, regardless of whether the host is an individual homeowner or an investor (Sundararajan, 2016). Owner-hosts, the hosts who live in the P2P accommodations, often use this income to help with increased cost of living as well as pay for monthly bills like rent or mortgage (Airbnb, 2017); meanwhile, goals of investor-hosts, the hosts who do not live in the space and purchase it for P2P business, are typically maximizing return on investment.
While hotels utilize computerized revenue management systems and employ revenue managers with previous hospitality experience and analytics expertise (Kimes, 2011), P2P accommodation owners do not have the same types of resources (Peltier, 2015). Some resources are available provided by the platform site (e.g. Airbnb) or advice from websites like Guesty or Simple Dollar, yet it is unclear to what extent P2P hosts adopt revenue management practices and how the practices differ by host characteristics. P2P accommodations have the characteristics needed for successful revenue management adoption, namely perishable assets which are rented for a certain length of time. Just as previous researchers have investigated the nuances involved in adopting revenue management techniques to the golf (Kimes, 2000) and restaurant segments (Thompson, 2010), this article contributes to the broader understanding of revenue management adoption in emerging segments of the hospitality industry, P2P accommodations.
Prior studies on P2P accommodations’ pricing have identified factors influencing P2P accommodations’ prices; factors such as host attributes, property attributes, rental rules, online reviews are found to affect (Chen and Xie, 2017; Wang and Nicolau, 2017). These studies captured the relationship based on data at a certain time, and it is more recent that literature started documenting P2P accommodations’ pricing strategies over a period of time. Gibbs et al. (2018) examined Airbnb hosts’ adoption of dynamic pricing—adjusting prices in response to fluctuations in demand—in comparison to hotels’ pricing and demands over 12 months of data from April 2015 to March 2016. Kwok and Xie (2019) explored different pricing behaviors of two groups of P2P hosts (multi-unit vs. single-unit) with an extended periods of time from October 2014 to July 2017. However, these studies limit their focus to dynamic pricing out of many other revenue management strategies. This article aims to extend the literature by broadening the scope to revenue management practices, which include minimum night’s stay and strict cancellation as well as dynamic pricing. The current study explored observable revenue management practices using 307,955 Airbnb property’s daily data from October 2014 to May 2017 for the top 10 Airbnb destinations in the United States.
The purpose of the current research is to identify which types of revenue management strategies are used in P2P accommodations and what types of owners are more likely to use revenue management strategies. Specifically, this study examined three different revenue management practices—dynamic pricing, minimum night’s stay, and strict cancellation—and interactions of the three for two different sets of hosts—single-unit hosts vs. multi-unit hosts, and Superhosts vs. non-Superhosts. In addition, this study investigated moderating effect of hosts’ years of experience in P2P business in the relationship between host characteristics and adoption of revenue management practices as experience in the business is likely to impact hosts’ revenue management practices.
Relevant literature and proposed model
Revenue management strategies
Since the introduction of revenue management into the hotel industry, a variety of tools and strategies have developed. Common practices include dynamic pricing by day of the week based on demand (Kimes, 2016), length of stay restrictions, non-refundable reservations, and enforced cancellation policies (Tranter et al., 2009). These types of revenue management strategies are typically apparent when the guest attempts to book reservations; for example, if a guest attempts to book a one-night reservation when there is a two-night length of stay restriction, a message will appear to tell the guest that there is a restriction on that day. Enforced cancellation policies include having a 7-day cancellation policy for special events. These types of strategies have been successful because they are easily understood and communicated to the guest (Tranter et al., 2009).
In the P2P accommodation segment, there is some evidence that revenue management strategies have emerged. Researchers have already found that dynamic pricing is prevalent and effective for riding sharing platforms like Lyft and Uber (Banerjee et al., 2016). Anecdotal evidence from 121 sample properties show that between 3.9% and 23.5% of hosts practiced recognizable revenue management strategies; they tend to lower the prices closer to the date of arrival. Based on the evidences and hotel’s traditional revenue management practices, this study identified three revenue management practices that matter to P2P accommodations: (1) dynamic pricing, (2) minimum nights’ stay, and (3) strict cancellation.
As new segments of the hospitality industry have adopted revenue management techniques, researchers have endeavored to understand how these new segments adopt revenue management and how their customers respond to those methods. In the golf industry, dynamic pricing has been applied by day of week, time of day, walk-in versus reservation, and guaranteed reservations while minimum group size is similar to minimum nights’ stay and charging for cancelled reservations is common (Kimes, 2000). Golf players perceive most of the practices (e.g. cancellation fees, time of day pricing) as fair while demand-based increases are perceived an unfair, unless lower prices during times of low demand are framed as discounts or coupons (Kimes and Wirtz, 2003). Likewise, the application of revenue management techniques in restaurants has required modifications. Dynamic pricing in restaurants has been successfully adopted and perceived as fair in the form of early bird specials, happy hour menus, restricted coupons, and premium pricing for special events or large parties (Thompson, 2010). Restaurants with a flexible table layout (several smaller tables that can be combined into larger tables) were able to maximize their revenue better than restaurants with less flexibility because they were not using up large tables with smaller parties without impacting customer perception (Kimes and Thompson, 2004). Research regarding no-shows and cancellations has found that most restaurants overbook reservations to prevent loss of revenue due to no-shows and cancellations (Tse and Poon, 2017), and fine dining restaurants have successfully implemented charging for cancelled reservations while a similar application in other styles of restaurants is perceived as unfair (Tang et al., 2019). Clearly, the adoption of revenue management techniques varies by segment, and there is a need to understand its adoption in P2P accommodations.
Different types of P2P owners
Motivations for participating in the P2P accommodation sector are both economic and social. Due to the high level of involvement with the consumers in the sharing economy (large quantity of time and emotional labor), most people are motivated by economic considerations and prefer to rent out high ticket items, like accommodations, to maximize the returns (Philip et al., 2015). Some hosts are struggling to pay rent and buy food, some to pay off student loans, and others use it to supplement their income (Schor, 2017). Other individual owners want to make their accommodations available to a wider array of guests and intentionally price their properties lower than the prevailing market price (Ikkala and Lampinen, 2014).
This traditional image of hosts is evolving as the P2P is changing. The next wave of adopters is not home owners but renters subletting their space on Airbnb (Quattrone et al., 2016). This has caused serious concerns for landlords due to the nature of leasing contracts as well as the potential to decrease the already short supply of living space in overcrowded cities like New York (Kusisto, 2015).
The third wave of hosts has been investors who purchase properties and rent them out not as living space but as P2P accommodations (Karmin, 2015). Indeed, hosts with multiple listings are more likely to identify as entrepreneurs with a sense of ownership in the business than single-property owners (Ravenelle, 2017). Li et al. (2015) compared the financial performance of hosts with one property and hosts with two or more properties. They found that hosts with multiple accommodations had 15.5% higher occupancy and 16.9% higher daily revenue than the single-unit hosts. The study argues that the performance discrepancies are due to single-unit hosts not being adopting dynamic pricing. The current study expands the horizon of the examination by comparing propensity to practice revenue management strategies between single-unit hosts and multi-unit hosts. Specifically, this study argues that multi-unit hosts tend to adopt revenue management strategies significantly more than single-unit hosts.
Similar pattern of more active adoption of revenue management strategies is expected for super hosts. Superhosts are those owners on Airbnb who have received a combination of high star ratings and high number of reviews (Liang et al., 2017). Indeed, the presence of a Superhost badge on a listing can increase the number of reviews, the star ratings, and the total revenue (Liang et al., 2017), however while the badge itself can have an impact, the effort and talent needed to earn the badge may be reflective of the experience, professionalism, and business acumen acquired through their time on Airbnb. Adoption of revenue management strategies is not a prerequisite of the Superhost recognition, and there are differences among Superhosts—between those who actively adopt revenue management strategies and those who do not. One of those can be the amount of time in the P2P market.
The role of experience in revenue management
Revenue management is a relatively new addition to the Airbnb website which launched its pricing tool in 2015 (May, 2015). Previously, pricing recommendations had been simplistic and based on basic accommodation information (Gibbs et al., 2018). Their smart pricing tool accounts for booking trends and looks at maximizing revenue, not just room rate (May, 2015), and it allows the hosts to override the recommendation as well (Gibbs et al., 2018). Despite the ease and accessibility of this tool, not all hosts utilize the tool to change their rates based on demand (Gibbs et al., 2018). Gibbs et al. (2018) concluded that this may be a result of different motivations for hosts, lack of experience, and the inability of the tool to make adjustments based on changes in the market. A study of accommodations on Vacation Rental by Owner (VRBO, a subsidiary of Homeaway) compared accommodations in Hilton Head, South Carolina and Orlando, Florida and found more length of stay restrictions for Orlando, a seasoned P2P accommodation market, than Hilton Head (Kreeger and Smith, 2017). It indicates that experienced owners are more likely to make dynamic pricing decisions than less experienced owners.
Hypotheses development
The study so far has documented some evidences of P2P accommodation owners’ revenue management adoption, different types of P2P accommodation hosts, and the role of experience in the adoption of revenue management strategies. Based on it, the hypotheses are developed as below. This study focuses on three revenue management strategies—(1) dynamic pricing, (2) minimum night’s stay, and (3) restricted cancellation—due to the relevancy to the P2P business. Then moderating effect of years of experience is examined. First three hypotheses compare multi-unit hosts to sing-unit hosts and the next three hypotheses compare Superhosts to non-Superhosts for each of the three revenue management strategies.
Methodology
Data
This study investigated revenue management strategies of top 10 P2P markets by number of properties in the United States as of June 2017: New York, Los Angeles, San Francisco, Chicago, Austin, Washington DC, Kissimmee, San Diego, Houston and Philadelphia. A total of 137,846,412 daily pricing data over 32 months (from October 2014 to May 2017) were used. The 138 million daily pricing data over 32 months becomes 307,955 per-property-level data across top 10 US markets after deleting missing data and extreme outliers for cancellation policy (Table 1). It overcomes prior research’s common limitation—limited data points.
Top 10 cities and data used.
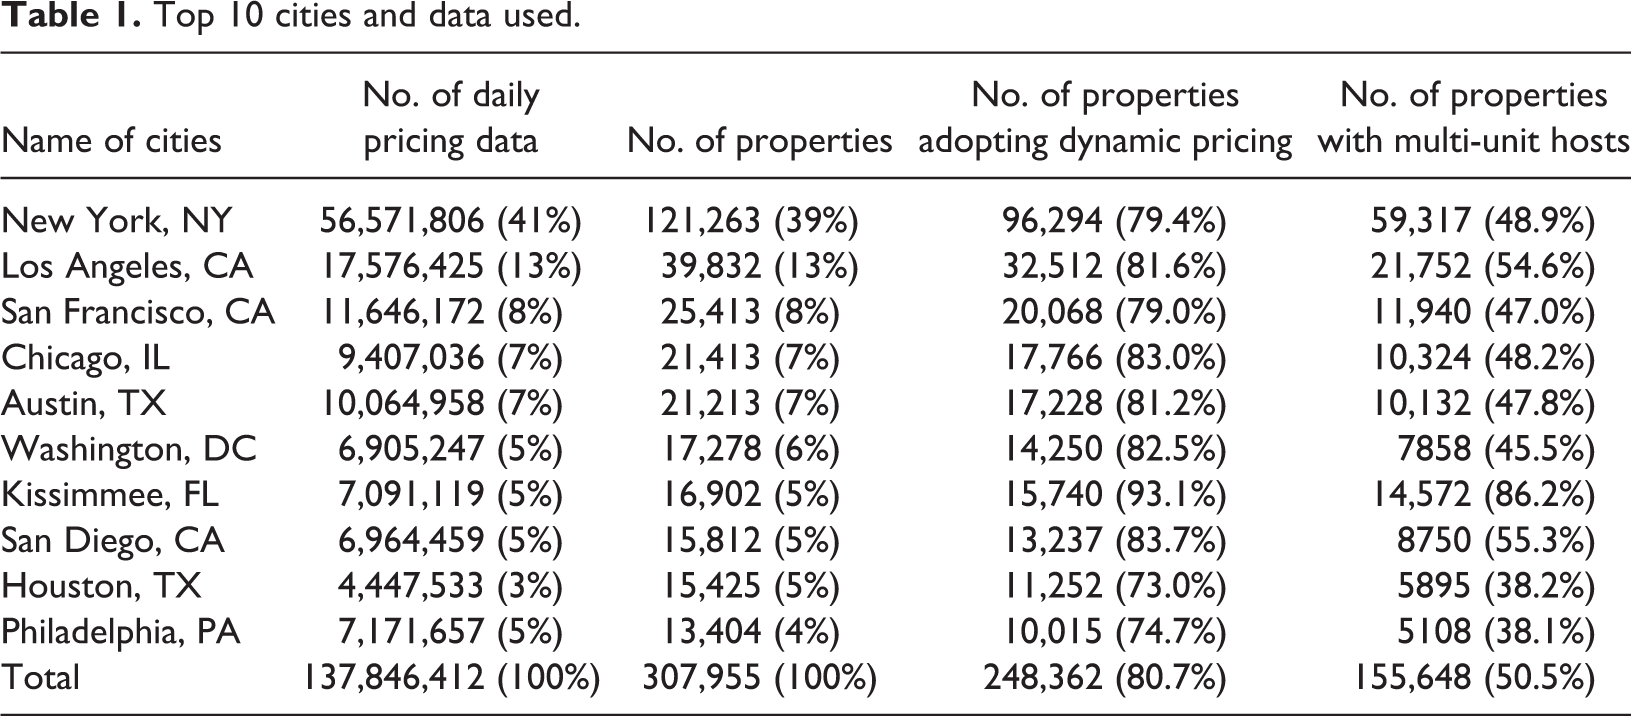
Magnitude of New York market is significant; it represents about 40% of top10 market in terms of daily pricing data and number of properties. Second biggest market is Los Angeles, CA, which represents 13% of top 10 market. Size differences of the markets after the second biggest market are much smaller, which ranges 3–8% compared to 40% and 13%.
This study obtained daily pricing data and property-level data such as cancellation policy, Superhost designation on the properties listed in Airbnb.com from AirDNA. AirDNA is a company which scraps P2P accommodation websites on a daily basis and provides market data regarding P2P accommodations around the world (AirDNA, 2019), and has used in other P2P literature (e.g. Kwok and Xie, 2019).
Dependent variables
Dependent variable of the study is adoption of revenue management strategies, namely dynamic pricing, minimum night’s stay, and restricted cancellation. For dynamic pricing and minimum night’s stay, a binary variable is developed; 1 if a property adopts the strategies and 0 if not. For that 32 months of daily pricing data from October 2014 to May 2017, standard deviation of the daily price is calculated. If no pricing fluctuation is found during that period, the property was assigned with 0; if the standard deviation is greater than 0, the property was assigned with 1.
Minimum night’s stay is a numerical variable which ranges from 0 day to 10,000 days. The information is as posted on the Airbnb website by the hosts, and the most recent information during the sample period. For example, for active listings, it’s the information as of May 31, 2017. For inactive listings, information on the last day of listing was used.
Airbnb has six levels of cancellation policies: flexible, moderate, strict, super-strict 30 days, super-strict 60 days, and long term (Airbnb, 2019). Flexible cancellation policies are defined as a full refund within a limited period (up to 24 h prior to check-in). Moderate cancellation policies are defined as a full refund within a limited period (up to 5 days prior to check-in). Strict cancellation policies is defined as a full refund if cancelled within 48 h of booking. Super-strict 30 days is defined as a 50% refund up until 30 days prior to check-in. Super-strict 60 days is defined as a 50% refund up until 60 days prior to check-in. Finally, long-term cancellation is designed for long lengths of stay and the cancellation policy is that the first month is not refundable and 30-day notification required for cancellation (Airbnb, 2019). This study excluded properties with long-term cancellation since only two properties out of 307,957 properties chose that cancellation policy. Super-strict 30 days and super-strict 60 days are merged into super-strict category due to its rare adoption; merged account occupies less than 3%.
Main variables
As this study compares multi-unit hosts’ revenue management adoption to single-unit hosts’ one, identifying multi-unit hosts are imperative. In order to do that, property IDs and host IDs for the 307,955 properties are compared. If more than one property ID fall under one host ID, then the property is identified as a multi-unit host’s properties and marked 1; otherwise, marked 0. About 50.5% (155,648 properties) of the properties are managed by multi-unit hosts while 49.5% (152,307 properties) of the properties are manage by single-unit hosts, on average. This study also compares Superhosts’ revenue management adoption to non-Superhosts’ revenue management practices. The super-host variable is also a binary variable, and this study used Airbnb’s identification. Properties with Superhost badge are marked 1; otherwise, marked 0.
This study also examines the moderating role of experience in P2P business in the relationship between revenue management practices and types of hosts. The variable was measured with number of months of experiences. Months of experiences range from 0 to 109 months. About 63% of properties are with 12 or less months of experience, and 84% of properties are with 24 or less months of experience, showing rapid growth of P2P accommodation businesses. It also implies that significant properties only operate for a short period of time (e.g. for a mega event) and remain inactive for other times.
Model
Hypotheses 1 through 3 compare multi-unit hosts’ revenue management practices to single-unit hosts’ practices while hypotheses 4 through 6 compare Superhosts’ practices to non-Superhosts’ practices. Hypotheses 1 and 4 focus on dynamic pricing, hypotheses 2 and 5 on minimum night’s stay, and hypotheses 3 and 6 on restricted cancellation.
Hypotheses that discover adoption of dynamic pricing (hypotheses 1a, 1b, 1c, 4a, 4b, and 4c) use binary logistic regression with robust standard errors as the dynamic pricing (dependent variable) is measured with a binary variable: used dynamic pricing or not. Hypotheses that examine usage of minimum nights’ stay (hypotheses2a, 2b, 2c, 5a, 5b, and 5c) use linear regression model with robust standard errors as the dependent variable is measured with numerical values: days of minimum nights’ stay. Minimum night’s stay varies from 0 days to 1365 days and the distribution is skewed positive; therefore, log-transformation is made for the variable. Hypotheses that uncover restricted cancellation practices (hypotheses3a, 3b, 3c, 6a, 6b, and 6c) utilize ordinal logistic regression with robust standard errors as the dependent variable is ordinal response variable (flexible, modest, strict, and super-strict cancellation policies). The general models are as follows.


where RM represents a property’s adoption of one of the three revenue management strategies; Exp represents experience in P2P accommodation business and is estimated by number of months since first listing; Host represents a host’s characteristics measured by a binary variable (1 if multi-unit host, 0 if single-unit host; 1 if super-host, 0 if non-super-host); Host × Exp represent an interaction term between Host and Exp.
Results
Descriptive analysis
Table 2 summarizes descriptive analyses of the variables and binary relationship between the variables. For the top 10 cities with highest number of P2P properties in the United States, more than half of the properties (50.5%) are owned by multi-unit hosts. Properties managed by Superhosts are less than 10%. About 80% of the properties had been utilized dynamic pricing and required about 3.87 days of minimum nights’ stay. An average of 1.07 for cancellation policy shows that absolute majority of the properties had flexible or moderate cancellation policy (0 = flexible, 1 = moderate, 2 = strict, 3 = super-strict).
Descriptive analysis and correlations.
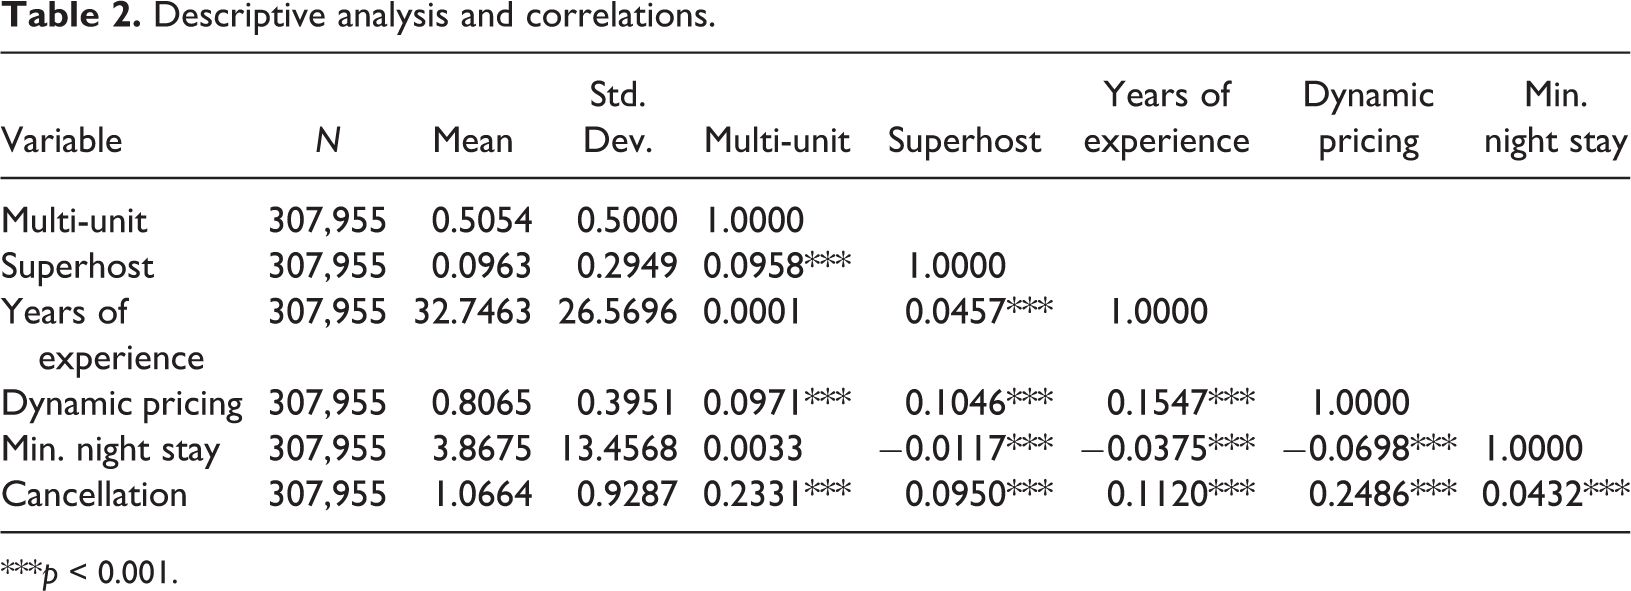
***p < 0.001.
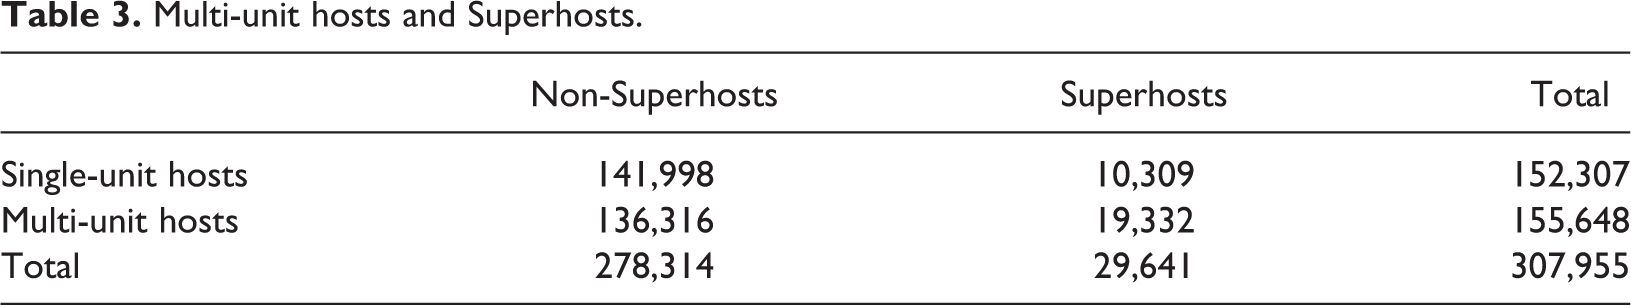
Low correlation between years of experience and multi-unit hosts (r = 0.001; p > 0.05) shows that there are significant number of new units managed by multi-unit hosts, whose main goal is to maximize return on investment. Meanwhile, to become Superhosts, it requires a certain lengths of experience to prove the hosts quality, but the correlation between Superhosts and experience (r = 0.0457; p < 0.001) shows that longer years of experience does not necessarily lead to Superhosts. Table 3 provides more detailed information about distribution of multi-unit hosts vs. single-unit hosts and their Superhost designation. About 12.4% of multi-unit hosts got the Superhost badge (19,332 out of 155,648) whereas only 6.8% of single-unit hosts got the recognition.
Multi-unit hosts and Superhosts.
The significant correlation between dynamic pricing and cancellation (r = 0.2486; p < 0.001) and dynamic pricing and minimum nights’ stay (r = −0.0698; p < 0.001) in Table 2 shows that those who utilize dynamic pricing tend to adopt other revenue management strategies; those 80% of hosts who utilize dynamic pricing policy tend to have stricter cancellation policy but required less number of minimum nights’ stay for their unit.
Table 1, 4, and 5 shows adoption of the three revenue management strategies by city. Table 1 provides information on how many properties adopt dynamic pricing by city. It shows that overall about 80% of the properties in the top 10 market used dynamic pricing strategies. Conversely, it means, on average, 20% of P2P hosts have not changed their listed price at all for the period from October 2014 to May 2017. The city that applies the dynamic pricing strategies the most is Kissimmee, FL, with 93.1%, and the city that applies the strategies the least is Houston, TX, with 73%. Kissimmee, FL, is a touristic destination where 86.2% of the total Airbnb properties are managed by hosts who manages multiple properties while Houston, TX, has the lowest rate of properties by multi-unit hosts with 38.2%. It also shows the tendency that multi-unit hosts offer units in P2P market. Although the properties that are managed by multi-unit hosts are just slightly more than those managed by single-unit hosts (50.5% vs. 49.5%), the segmentation was significantly different in some cities. Over 86% of Airbnb units in Kissimmee, FL, was managed by multi-unit hosts whereas only 38% of units in Houston, TX, and Philadelphia, PA, was managed by multi-unit hosts, who approach P2P market from the investment purpose.
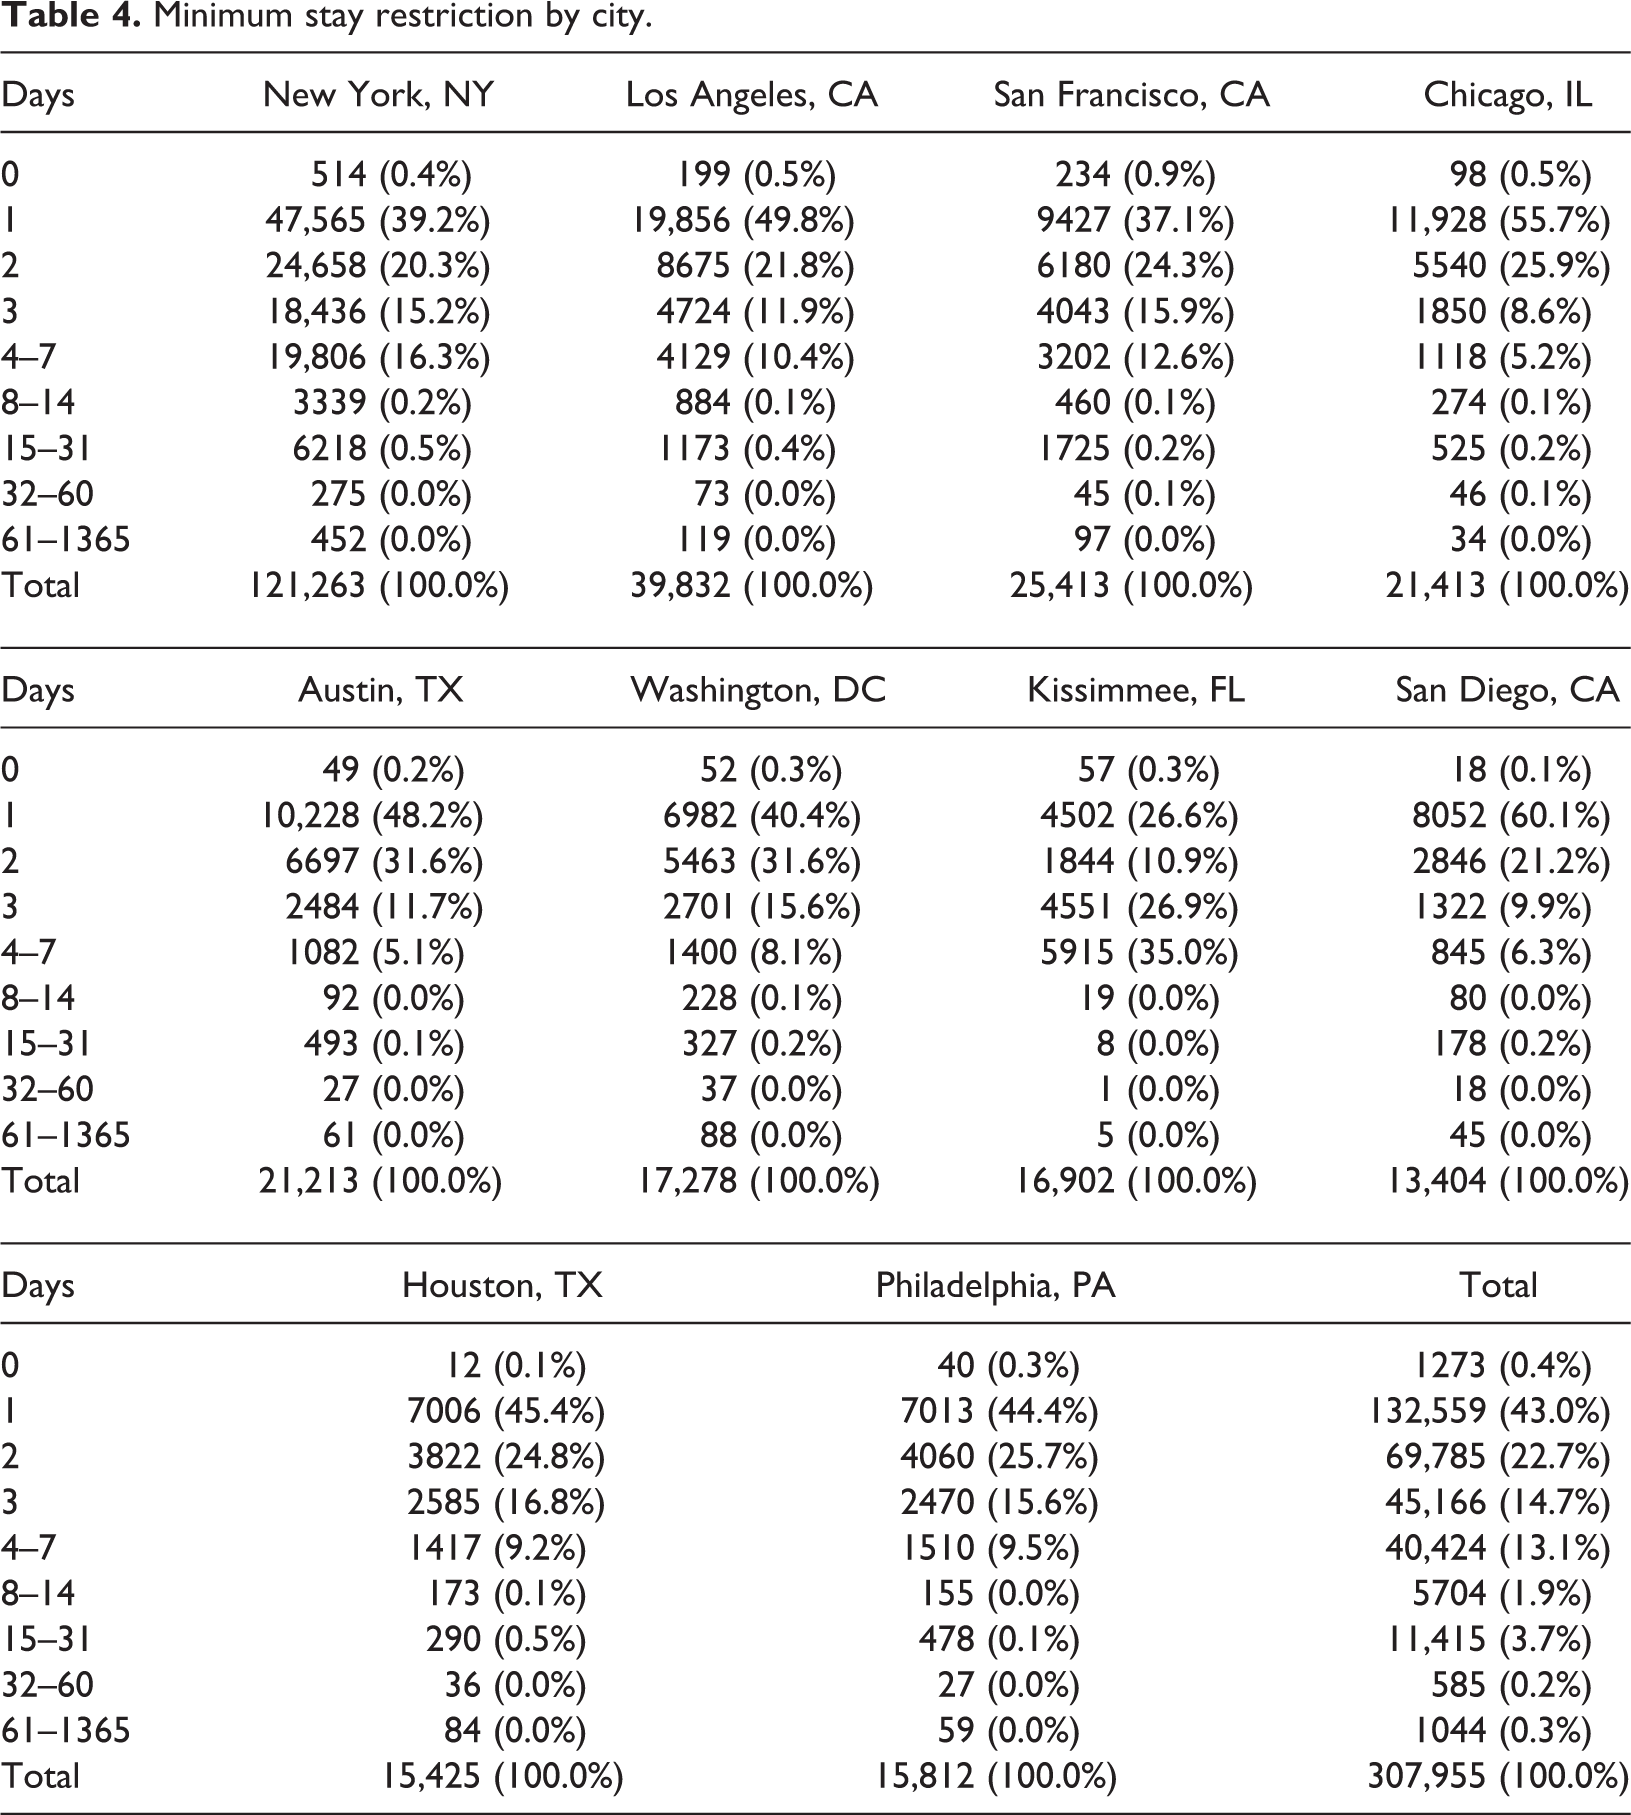
Minimum stay restriction by city.
Cancellation policy by city.

Table 4 summarizes P2P units’ adoption of minimum night’s stay by city. Minimum nights’ stay is a numerical variable which ranges from 0 day to 1365 days. About 43.0% of the properties required 1 day’s stay, 22.7% required 2 day’s stay, and 14.7% required 3 day’s stay. Properties requiring more than 7 days of stay is less than 7%. Kissimmee, FL, tends to have the longest minimum required days of stay; 35% of the properties required 4–7 days of stay and another 27% required at least 3 days of stay. New York, NY, tends to require longer days of stay, but the percentage is much lower than that of Kissimmee, FL; 16% of the properties required 4–7 days of stay and 15% required 3 days of stay. Meanwhile, San Diego, CA, requires the least days of stay among the top 10 markets with 60% properties requiring only one day of stay. Properties in Chicago, IL, shows similar pattern that 56% of the properties requires one day of stay, showing different patterns of minimum nights of stay requirement among the cities depends on characteristics of cities.
Restricted cancellation is a categorical variable which ranges from flexible, moderate, strict, and super-strict. Most top 10 markets show similar pattern for cancellation policy adoption, but Kissimmee, FL, shows clearly different pattern; absolute majority of the properties have either strict (40.5%) or super-strict (44.7%) cancellation policy. While cities like Houston, TX, and Philadelphia, PA, have most lenient cancellation policy with 51.8% of properties have flexible cancellation policy.
Main results
While various levels of adoptions are found for the three revenue management practices for different cities and different hosts, the highest variance are found in the minimum night of stay restriction. Table 4 shows that the minimum nights of stay restriction ranges from 0 days to 1365 days, only about 0.5% of the units had more than 31 days of minimum nights of stay restriction. Those units may approach P2P accommodations differently that they use P2P accommodation another way to find a longer-term tenant. Therefore, this study used observations with 0–31 days of minimum nights of stay restriction excluding those with more than 31 days of minimum nights of stay restrictions.
Table 6 reports that all of the first set of the hypotheses are supported except hypothesis 5. Figure 1 graphically represents the results. Hypothesis 1a hypothesized that multi-unit hosts are more likely to use dynamic pricing strategies compared to single-unit hosts; odds ratio of 1.661 (p < 0.001) for multi-unit shows that multi-unit hosts are 66.1% more likely to use dynamic pricing than single-unit hosts controlling for experience. Table 7 reports significant results of t-test analysis between the groups (t-value = −54.118; p < 0.001); 84.5% of multi-unit hosts had used dynamic pricing while the percentage is much lower among single-unit hosts with 77.0%. Hypothesis 1b hypothesized that experienced hosts, in general, adopts dynamic pricing more, regardless multi-unit or single-unit hosts; odds ratio of 1.017 (p < 0.001) means for every month increase in P2P experience, hosts are 1.7% more likely to use dynamic pricing. Hypothesis 1c hypothesized that the extent to which multi-unit hosts use dynamic pricing strategies as years of experience accrues is significantly more than those of single-unit hosts (hypothesis 1c); odds ratio of 1.010 (p < 0.001) confirms that the gap between multi-unit hosts and single-unit hosts’ adoption of dynamic pricing strategy is bigger as years of experience is longer.
Differences in adoption of revenue management strategies between different hosts: Min. days of stay 0–31 days (N = 306,326).
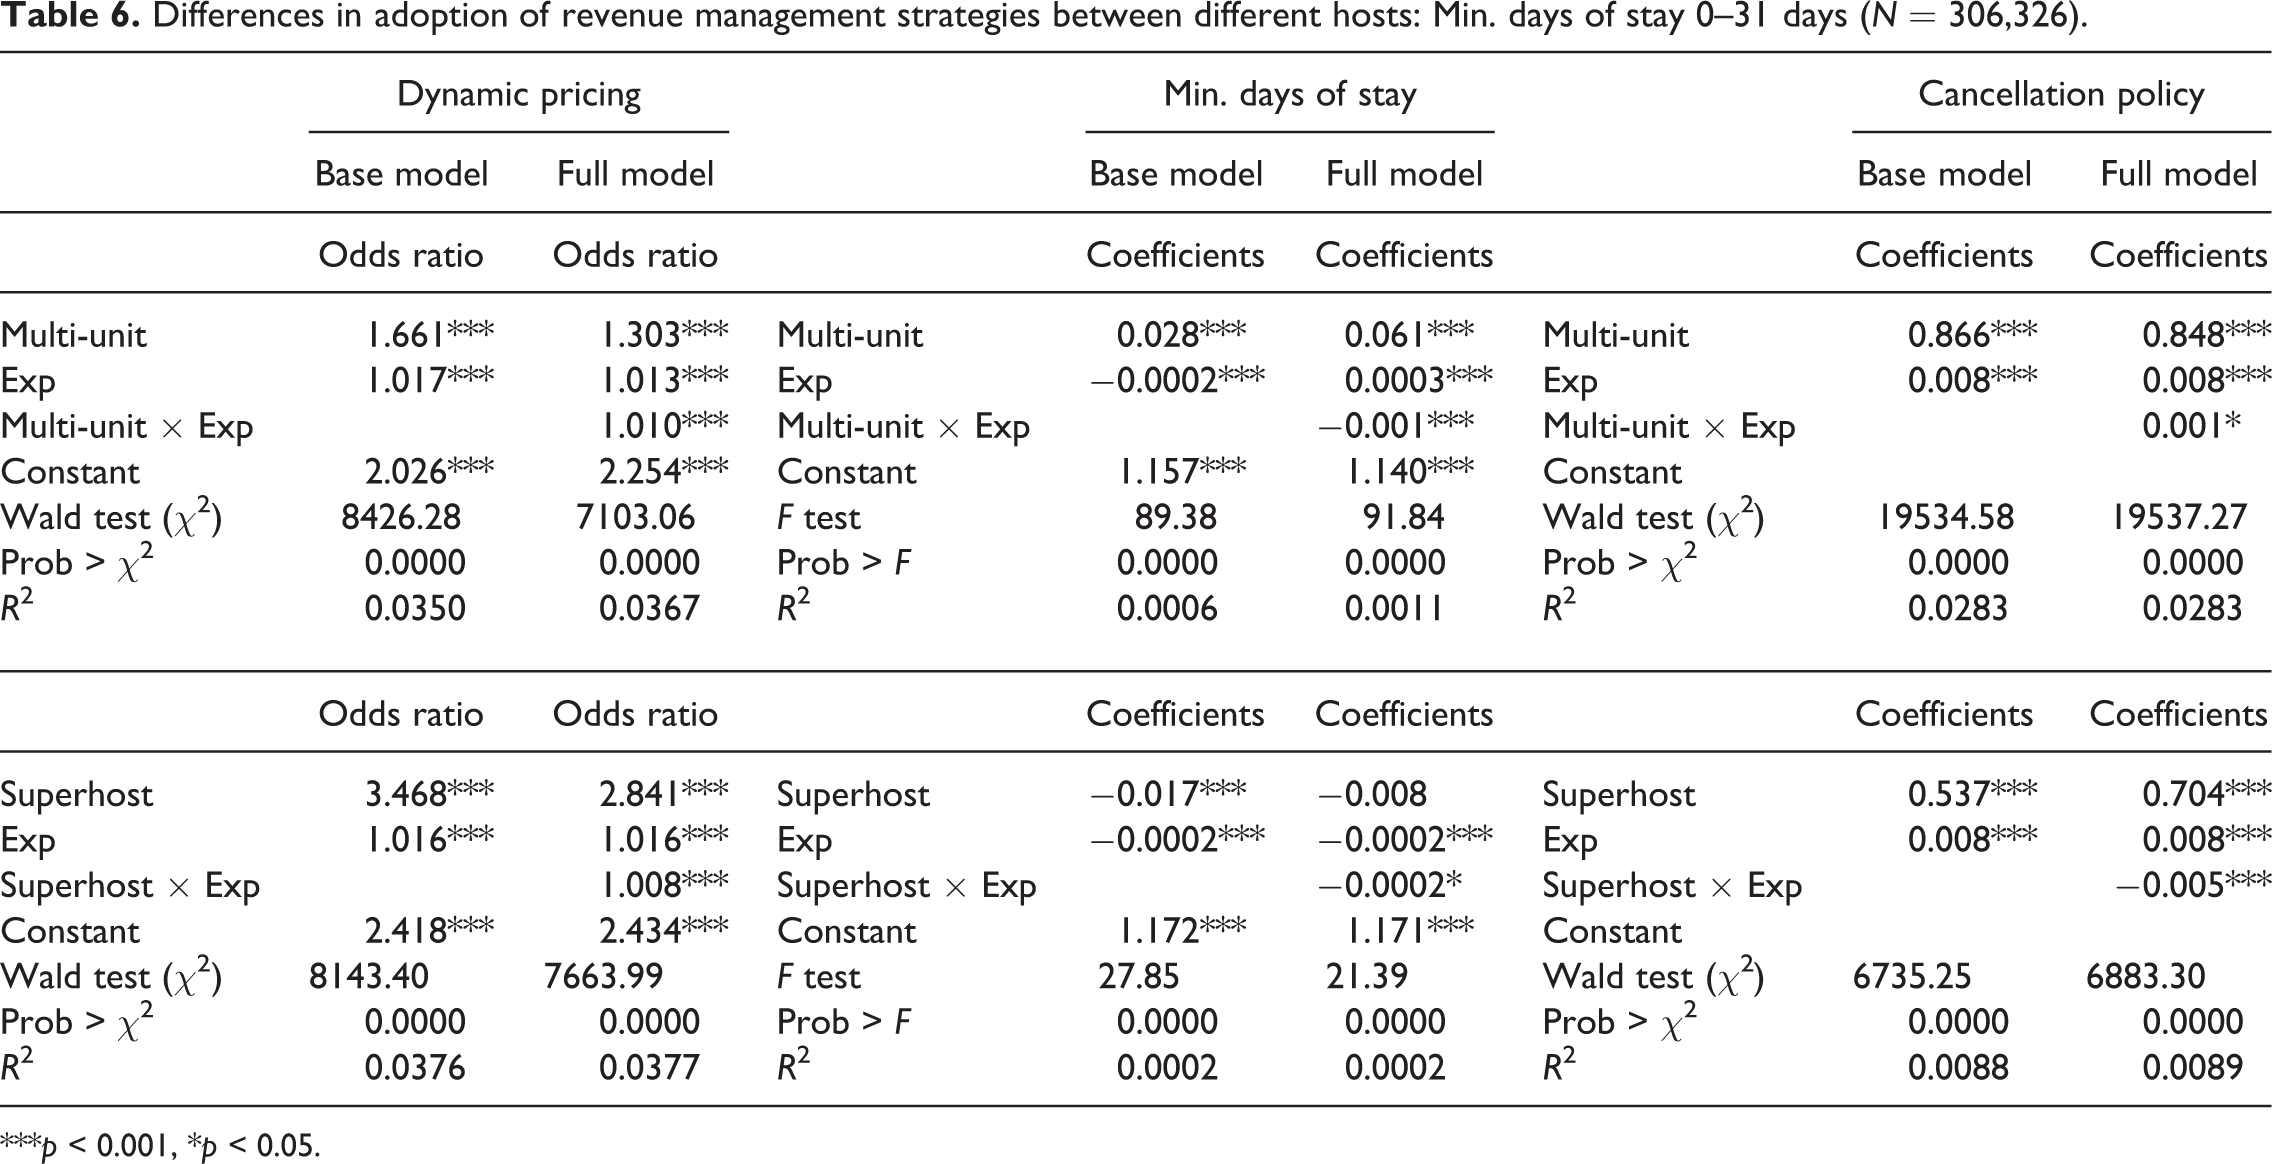
***p < 0.001, *p < 0.05.

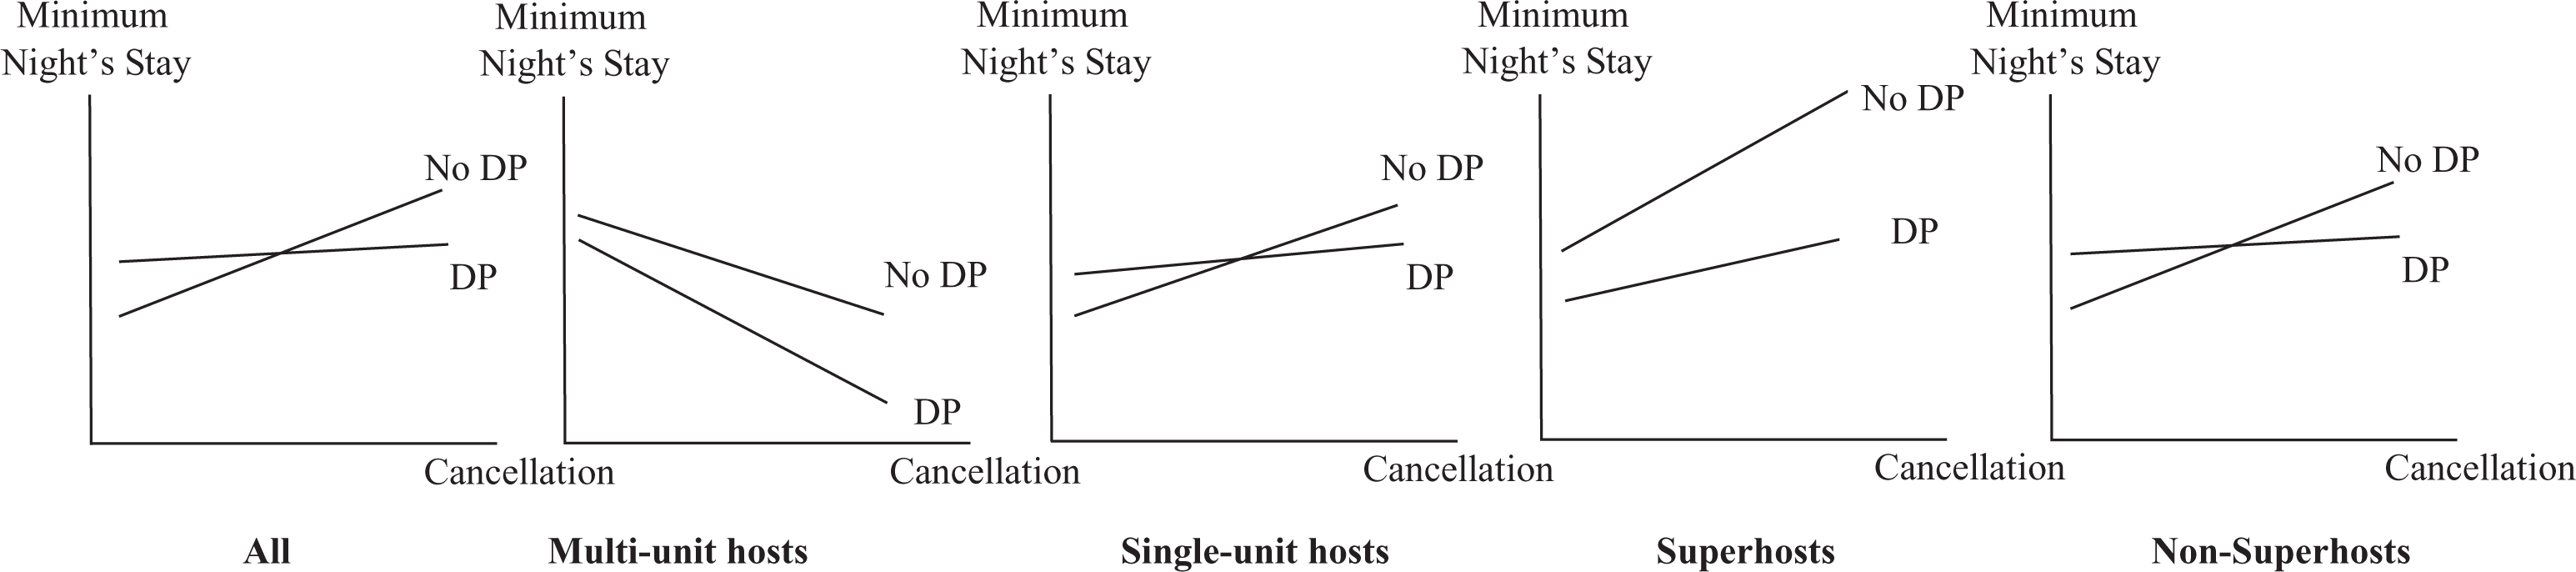
Graphical representation of the main results.
Group comparison of the revenue management strategies.a
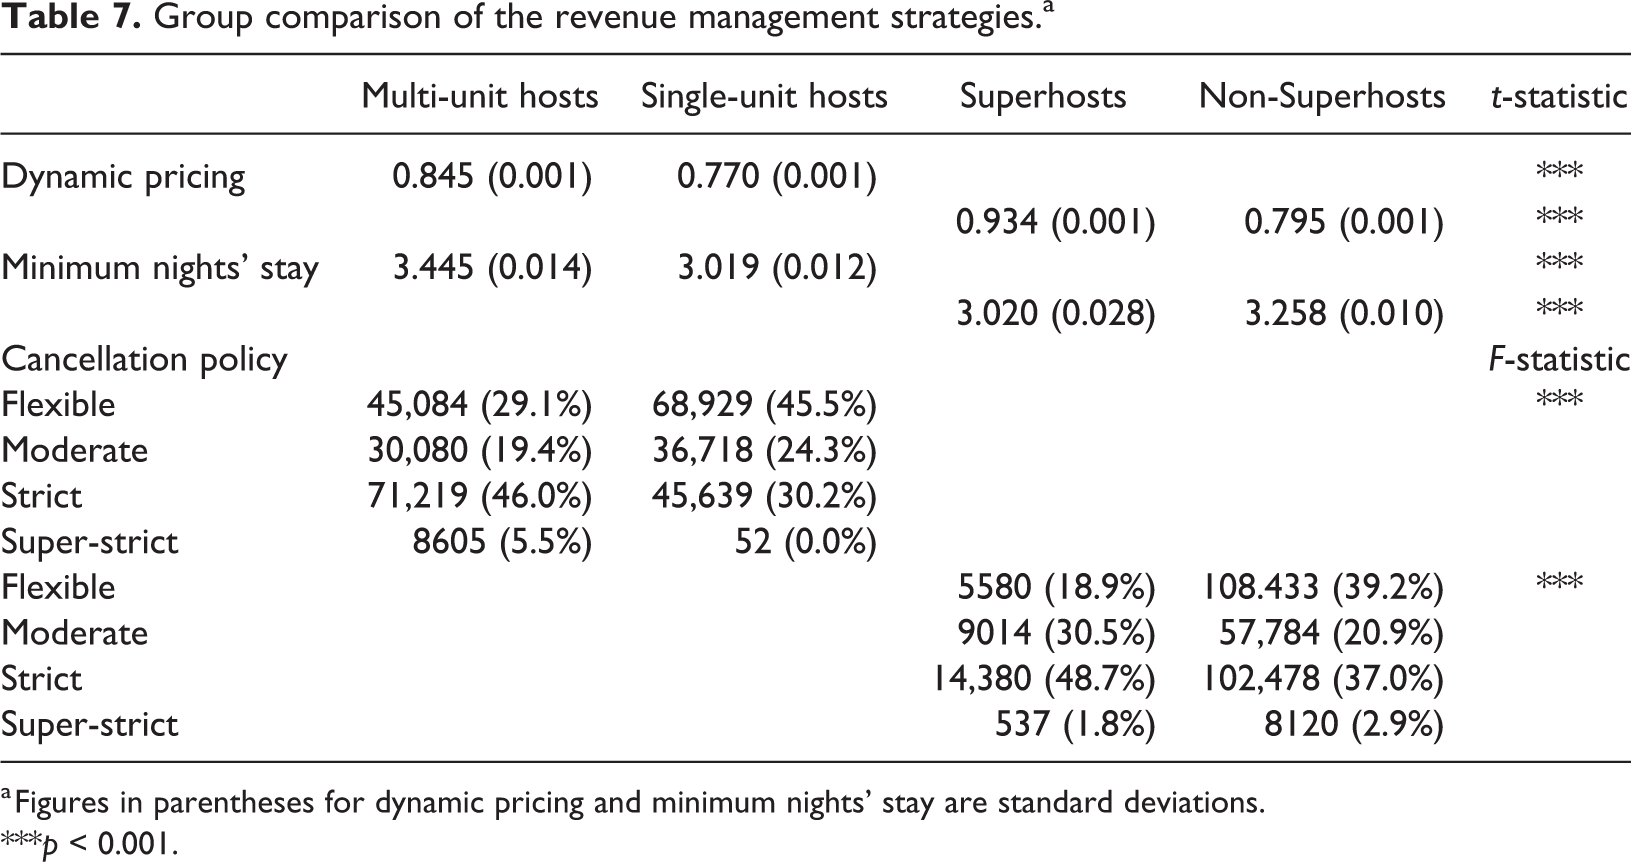
a Figures in parentheses for dynamic pricing and minimum nights’ stay are standard deviations.
***p < 0.001.
Adoption of the dynamic pricing strategies was also compared between Superhosts and non-Superhosts (hypotheses 4a, 4b, and 4c) in the same way that we examined for multi-unit hosts and single-unit hosts. The same pattern was found for the pair (Table 6). Superhosts, who are less than 10% of the total hosts for the top 10 markets, and found to use dynamic pricing strategy significantly more than non-Superhosts; odds ratio of 3.468 (p < 0.001) means that Superhosts are almost 3.5 times more likely to use the dynamic pricing strategies than non-Superhosts controlling for experience. Table 7 shows that 93.3% of Superhosts adopt dynamic pricing whereas much lower tendency was found for non-Superhosts with 79.5%. The extent to which to adopt dynamic pricing strategies was significantly more for those more experienced hosts than less experienced hosts (odds ratio = 1.008; p < 0.001 in Table 6).
The second set of the hypotheses compares multi-unit hosts to single-unit hosts on minimum night’s stay strategies. Hypothesis 2a hypothesized that multi-unit hosts are more likely to have longer minimum night’s stay than single-unit hosts; the results support the hypothesis (coef. = 0.028; p < 0.001 in Table 6). Table 7 provides average of the minimum nights’ stay required for both groups; 3.4 days for multi-unit hosts versus 3.0 days for single-unit hosts. However, the results for hypothesis 2b show the opposite findings; more experienced hosts are found to have significantly less number of days for minimum night’s stay than less experienced ones (coef. = −0.0002; p < 0.001 in Table 6). Results of the interaction effect was negative and significant as well (coef. = −0.001; p < 0.001 in Table 6); it means that the extent to which multi-unit hosts shorten their minimum night’s stay requirement is much more significant than single-unit hosts.
The same comparison was made between non-Superhosts and Superhosts (hypotheses 5a, 5b, and 5c). Table 7 shows the opposite results than that of multi-unit hosts; Superhosts has significantly shorter days of minimum night’s stay for 3.0 days than non-Superhosts of 3.3 days. The negative and significant results in Table 6 (coef. = −0.017; p < 0.001) confirms the result. More experienced hosts tend to have minimum night’s stay for significantly less number of days as well (coef. = −0.0002; p < 0.001 in Table 6). Superhosts’ tendency to have shorter minimum nights’ stay with experience was significantly more than that of non-Superhosts (coef. = −0.0002; p < 0.05 in Table 6).
The third set of the hypotheses compares multi-unit hosts to single-unit hosts on restricted cancellation. The study hypothesized that multi-unit hosts tend to have more strict cancellation policy than single-unit hosts (hypothesis 3a); positive and significant results support the hypothesis (coef. = 0.866; p < 0.001 in Table 6). Table 7 shows how the distribution of cancellation policy is different between the groups. Forty-six percent of multi-unit hosts held strict cancellation policy while 46% of single-unit hosts held flexible cancellation policy. The study also hypothesized that more experienced hosts in the P2P accommodation business tend to have more restricted cancellation policy (H3b); positive and significant result (coef. = 0.008; p < 0.001 in Table 6) supports the hypothesis. The extent to which multi-unit hosts set more restricted cancellation policy as years of experience accrues compared to single-unit hosts were hypothesized (hypothesis 3c) and found significant (coef. = 0.001; p < 0.05 in Table 6).
The same investigation was made for Superhosts and non-Superhosts (hypotheses 6a–6c). Findings support hypotheses 6a and 6b while findings of hypothesis 6c was the opposite to the study’s expectation. The extent to which Superhosts have more strict cancellation policy was more lenient than that of non-Superhosts. Table 7 shows that more than 50% of Superhosts held strict or super-strict cancellation policy, whereas 40% of non-Superhosts held such strict policies. Difference between the groups is more significant with flexible cancellation policy. While more than 39% of non-Superhosts held flexible cancellation policy only 19% of Superhosts held flexible policy. Positive and significant results in Table 6 support the finding (coef. = 0.537; p < 0.001). Table 6 also provides evidence that experienced hosts tend to have more strict cancellation policy than less experienced hosts (coef. 0.008; p < 0.001). However, the changes made for cancellation policy with experience is more significant for non-Superhosts that the changes of Superhosts (coef. = −0.005; p < 0.001).
Dynamics among the three revenue management practices
So far, this article examined the each of the three revenue management tools separately: dynamic pricing, minimum night’s stay and cancellation policy. To uncover the dynamics among the three revenue management tools practiced by different hosts, further analyses were made. Airbnb requires all their hosts to post their cancellation policy and minimum night’s stay restriction on the website while changing room rates is optional, model is developed as follows that comparison is made between those who changes room rates (i.e. those who practices dynamic pricing) and those who do not:

where MDS represents a property’s minimum night’s of stay restriction measured with log-transformed minimum night’s stay; DP represents a property’s adoption of dynamic pricing; CANCEL represents a property’s adoption of one of the cancellation policy (0 being flexible, 1 being modest, 2 being strict, and 3 being super-strict); DP × CANCEL represent an interaction term between DP and CANCEL.
First, the relationship among the three revenue management practices was investigated for all the properties with 0–31 days of minimum night’s of stay restriction to be consistent with the analysis for main results. Then, the relationship was tested separately by different hosts; Multi-unit hosts versus single-unit hosts, and Superhosts versus non-Superhosts. Table 8 provides the results and Figure 2 graphically represents the results.
Graphical representation of the relationship among the three revenue management practices.
Dynamics among the three revenue management practices (N = 306,326).
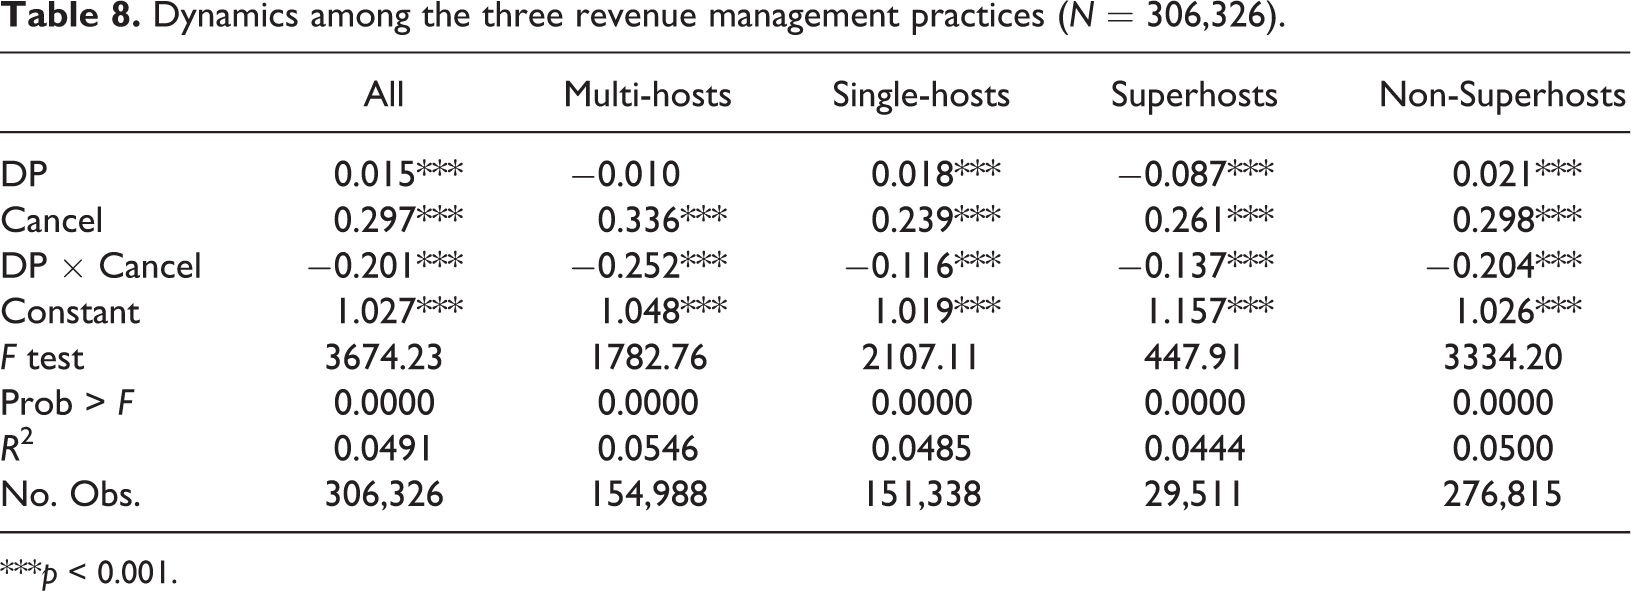
***p < 0.001.
Overall, for those who does not adopt dynamic pricing (i.e. no-DP group who does not change their room rate), the more strict cancellation policy they adopt the longer minimum night’s stay they required. These are those who set the cancelation policy and minimum night’s stay information as Airbnb requires and do not do more than it is required (i.e. changing their room rates). In the group, the degree of strictness of the policy was consistent; those who is flexible for cancellation policy required significantly less number of minimum night’s stay, and vice versa. However, those who does adopt dynamic pricing, length of the minimum night’s stay restriction varied significantly less across the levels of cancellation restriction than the no-DP group.
Further analyses were conducted to see whether the revenue management practice pattern differs by different hosts. First, multi-unit hosts’ practices are compared to single-unit hosts’ practices. The single-unit hosts follows the same pattern of the overall results. However, those multi-unit hosts showed significantly different pattern. Out of those who adopt dynamic pricing, those who has more strict cancellation policy tend to have significantly less number of night’s restriction.
Second, the comparison was made between Superhosts and non-Superhosts. Similar pattern was found for both Superhosts and non-Superhosts. Difference was found those Superhosts who have flexible cancellation policy. In that particular group, those who changes room rates had significantly less minimum night’s stay restriction than those who does not change room rates.
Discussion
This study investigated adoption of three revenue management strategies—dynamic pricing, minimum night’s stay, and restricted cancellation—among different groups of P2P accommodation hosts: multi-hosts versus single-hosts and Superhosts versus non-Superhosts. It also investigated whether the hosts tend to adopt these revenue management strategies significantly more as their experience adds. This study further examined whether the extent to which to adopt those revenue management strategies with experience accrued is significantly different between the groups.
Findings of this study provide evidences that multi-unit hosts adopt all of the three revenue management strategies significantly more than single-unit hosts. This supports previous research which indicated that multi-unit hosts tend to earn higher revenue and be more adept in making revenue management decisions (Kwok and Xie, 2019). Recent trend in P2P accommodations is an increase in real estate developers and investors entering the P2P accommodation market (Yale, 2018) and they would be more likely to manage their properties for profit than out of a sense of reciprocation as it has so often seen in the sharing economy (Sundararajan, 2016).
Superhosts’ revenue management strategy adoption was bit different from multi-unit hosts’ behavior. While Superhosts actively adopt dynamic pricing and more restricted cancellation policy like multi-unit hosts, they required significantly less minimum night’s stay than non-Superhosts. Superhosts are those who are “experienced hosts who provide a shining example for other hosts, and extraordinary experiences for their guests” (Airbnb, 2019). It shows main motivation of the Superhosts hosting guests are both economic and social. If social interaction is main reason to open their home, having less number of nights’ stay could not be a problem. On the other hand, motivation of multi-unit hosts is mainly economic. With the plethora of websites offering advice regarding managing an Airbnb, one of the most frequent suggestions is to set a minimum night stay restrictions high rather than having several one-night stays (Williamson, 2016). This lowers cleaning costs because P2P accommodations are normally only cleaned upon check-out and the hosts do not have to either contact the cleaning company or clean it themselves. Furthermore, it is more efficient to have one guest stay for two nights than two guests for one night each because the host does not need to physically inspect the property and meet with the guest if they are staying two nights (Williamson, 2016).
As experience accumulates, however, dealing with more frequent guests seems to become more comfortable to both multi-unit hosts and single-unit hosts and both groups are found to shorten minimum night’s stay restriction. The extent to which multi-unit hosts shorten the minimum night’s stay restriction along with their added experience was significantly greater than single-unit hosts. The same pattern was found for Superhosts; the magnitude of shortening the minimum night’s stay restriction was more significant for Superhosts than non-Superhosts. Multi-unit hosts and Superhosts are much faster to become more proactive dealing with frequent in-and-outs of their guests.
In addition, while the minimum days of stay is a tool to increase revenue for periods of high demand, they have been shown to lower financial outcomes when they are too restrictive and the reason for the minimum days of stay is not readily understood by the guests (Wilson et al., 2015). However, to many single-unit hosts and non-Superhosts, it is not worth the trouble of cleaning the home to turn it around for another guest after a one-night stay (AirDNA, 2015). These groups of hosts could consider lowering the minimum night’s stay to the point they feel comfortable and it could increase their financial outcome. Regardless it’s multi-hosts or Superhosts, more experienced hosts, in general, tend to agree that lowering minimum nights’ stay restriction a better deal.
With regards to dynamic pricing, no matter the host manage single-unit or multi-units, is a Superhost or non-Superhost, more experienced hosts tend to change prices of their units. The extent to which to utilize dynamic pricing strategies was significantly more when multi-unit hosts and Superhosts add their experiences in P2P business than their counterparts. Although Airbnb strongly recommends their hosts to change room rates to maximize their profit, changing prices is not a requirement and multi-unit hosts and Superhosts are the ones who actively accept the advice and make efforts.
With regards to cancellation policy, regardless of the types of hosts, all hosts tend to require stricter cancellation policy over time. More experienced multi-unit hosts tend to have significantly more strict cancellation policy than less experienced multi-unit hosts. The difference was significantly lower for single-unit hosts. Superhosts also set more strict cancellation policy than non-Superhosts. However, more significant differences are found for experienced non-Superhosts and less-experienced non-Superhosts. The result supports previous findings that moderate and strict cancellation policies have a positive impact on total revenue (Wang and Nicolau, 2017). However, caution should be made. Strict cancellation policies may deter guests before hosts gaining a positive online reputation (Williamson, 2016). That could be the reason why hosts make their cancellation policies stricter as their experience adds.
Dynamics among the three revenue management practices showed a pattern except for multi-unit hosts. Out of the three revenue management practices, dynamic pricing is the only tool that is not required by Airbnb; all hosts should set their minimum night’s stay restriction and cancellation policy and make the information available on the website while dynamic pricing is suggested but not required. Overall, for the group that does not change room rates (i.e. those who does not practice dynamic pricing), those who has stricter cancellation policy tend to have longer minimum night’s stay restriction. They are not the most sophisticated group of people who utilize revenue management tools to maximize their investment, and the level of restrictions reflects their attitude toward the P2P business; those who want to avoid short-term guests want to avoid booking cancellations whereas those who are okay with frequent guest turnovers and cleaning tend to be okay with booking cancellations. Those who practice dynamic pricing had similar minimum night’s stay restriction regardless of strictness of their cancellation policy; those who have strict cancellation policy did not require significantly longer minimum night’s stay requirement. These are hosts who make efforts to change room rates to maximize profit and find requiring longer minimum night’s stay go against achieving the goal.
The tendency to avoid longer minimum night’s stay requirement is most evident among the multi-unit hosts. The multi-unit hosts who have stricter cancellation policy had significantly lower minimum night’s stay requirement. That means multi-unit hosts are more open to have frequent in-and-outs of short-term guests as far as certain level of certainty is guaranteed for guest arrival. That tendency was consistent regardless they practice dynamic pricing or not, but the minimum night’s stay difference across different level of cancellation policy was significantly more for those who practice dynamic pricing.
Theoretically, this study adds to the growing body of literature regarding revenue management practices on P2P accommodations. The study’s findings demonstrate that different types of hosts do indeed utilize different revenue management strategies despite Airbnb’s standard revenue management software. While prior literature has identified factors affecting P2P accommodations’ prices these studies captured the relationship based on data at a certain time, and it is more recent that literature started documenting P2P accommodations’ pricing strategies over a period of time. However, those studies limit their focus to dynamic pricing. The current contributes to the literature by investigating the phenomenon in more holistic view; this study covers multiple revenue management practices and compared multiple groups. Not only the comparison was made for more traditional pair—between multi-unit hosts versus single-unit hosts—but also the comparison was made for Superhosts and non-Superhosts. Superhosts are the selected group of hosts who have demonstrated their high quality with most reviews and most positive reviews. Insights from these group of hosts’ revenue management practices deserve attention.
Practically, this study addresses pressing issues for P2P accommodation platforms and hotels. Websites like Airbnb can now understand how different hosts manage their revenue; it can give these websites guidance into how to tailor their advice based upon the experience of host, the Superhost status, and the number of units they own and/or manage. For hotels, this study suggests that the multi-unit and Superhosts are the ones who are more likely to manage their properties like a hotel. In turn, markets with large numbers of multi-unit hosts and Superhosts may be more likely to see impacts on demand and pricing than other markets.
Conclusion
This study finds evidence that different types of hosts do have different revenue management strategies. Multi-unit hosts are much more motivated to utilize revenue management strategies to maximize their return on investment than hosts who manage one unit. On average, multi-unit hosts tend to be more proactive to adopt all three revenue management strategies—dynamic pricing, longer minimum nights’ stay, and more restricted cancellation—than single-unit hosts. Multi-unit hosts’ active adoption of the revenue management strategies confirms their main motivation is economic benefits.
This study also found significantly different revenue management strategies adopted between Superhosts and non-Superhosts in the P2P accommodation setting. Superhosts are more proactive to utilize dynamic pricing and more restricted cancellation policy, but they required significantly less nights’ stay than non-Superhosts. It shows Superhosts’ main motivation is both economic and social, and they are more open to have more number of guests than non-Superhosts.
Significantly different levels of adoption of revenue management strategies with experience shows that it takes some learning curve to be comfortable enough to use the strategies. It should be noted that for minimum night’s stay, hosts tend to shorten the minimum night’s restriction over time. Also, those who have stricter cancellation policy had significantly lower minimum night’s stay restriction. That means hosts become more comfortable to have frequent in-and-outs of short-term guests over time as far as certain level of certainty is guaranteed for guest arrival.
Limitations and suggestions for future studies
Although this study adds value with its comprehensive study of three different revenue management strategies among P2P accommodation hosts, it’s not without limitation. First, this study focused on Airbnb site only. While Airbnb is the largest P2P accommodation site, the revenue management behaviors might be somewhat different for other websites with different revenue management options available and supports provided by each website. Second, this study examined top 10 P2P accommodation markets in the United States. Similar study can be conducted for the markets outside the United States. Third, future researchers may investigate consumer reaction to rate fences. As the layout of Airbnb’s website is different from most traditional hotel websites and the cancellation policies are more restrictive, future researchers can test the impact of these policies on behavioral intentions.
Footnotes
Declaration of conflicting interests
The author(s) declared no potential conflicts of interest with respect to the research, authorship, and/or publication of this article.
Funding
The author(s) disclosed receipt of the following financial support for the research, authorship, and/or publication of this article: This work was supported by the Hongik University new faculty research support fund.