
Abstract
This article establishes a multiobjective optimization model for discussing tourism development issues. Tourism direct gross value added (TDGVA), tourism employment (TE) and tourism carbon emissions (TCEs) are integrated in the model, and sets of Pareto solutions are defined. By solving multiobjective optimization model through genetic algorithm, we design three tourism industry structure optimization schemes, namely, the growth-biased scheme, low-carbon emissions-biased scheme and employment-biased scheme. Compared with the actual data for 2012, TDGVA increased by 23.8 billion yuan rising by 14.8% in the growth-biased scheme, TCE fell by 4.97 million tons decreasing by 11.3% in the low-carbon emissions-biased scheme and TE increased by 83.53 thousand jobs increasing by 2% in the employment-biased scheme. The selection of tourism policy depends on the preference of decision makers.
Introduction
In recent years, tourism has experienced rapid and diversified development, it has become the strategic pillar industry to promote national economic development. Mass tourism can bring with obvious benefits. Based on the estimation of the World Travel and Tourism Council (WTTC), tourism was a $7600 billion industry (10.2% of global GDP) and generated significant tourism employment (TE; 10% of jobs globally) in 2016. Data from the United Nations World Tourism Organization (UNWTO) show that through 2030, the tourism industry will continue growing at an average rate of 3.3%, and there will be exponential growth in tourism consumption, which will provide tourism with a large space to grow. The rapid growth of tourism will bring many negative environmental effects indirectly (especially CO2 emissions). This issue has attracted attention of the government and relevant international organizations. For tourism sector, the indirect pressures exerted on the impacts of carbon emissions stem from the extensive backward linkages required to satisfy the inputs of aspects such as transportation, accommodations and catering. If the tourism industry maintains the current development mode and growth rate, the tourism CO2 emission will increase by 152% in 2035 (compared with 2005) (UNWTO-UNEP-WMO, 2007). Therefore, tourism may not be a green industry, as thought, since the increase in the tourism volume contributes to more CO2 emissions. How to realize a reduction in tourism-related carbon emissions under the condition that tourism-related economic impacts continue to increase is an important research topic.
There are some difficulties for tourism research: First, tourism is found to be a cross-cutting demand-side phenomenon in terms of the products or services that it involves. The current economic data are classified and aggregated according to industries that engage in the same or similar kinds of activities (United Nation, 2009). Data reflecting tourism are included in the relevant departments’ data on aspects such as transportation, accommodations and catering. Second, if we know the number of tourist activities, then how to measure tourism direct gross value added (TDGVA), TE and tourism carbon emissions (TCEs) is the second difficulty. Third, from the path of future tourism development, how to achieve the maximum TDGVA, the maximum TE and the minimum TCE simultaneously is the third difficulty.
Cities are one of the most important carriers for constructing a powerful travelling nation, and they are representative windows, pivots and pillars of tourism development. As an international metropolis, Shanghai has good natural, cultural and urban features that are creating good conditions for tourism development. Just like other industries, the tourism industry competes for urban resources and energy, bears responsibility for stimulating economic growth and promotes employment as well as energy conservation and emission reductions. In order to better promote the pulling effect of tourism on economy and to form the virtuous circle for tourism development, the internal structure of the tourism industry must entail an optimal proportional relation, which is necessary to guarantee the harmony and stability of tourism development.
Previous studies have made many contributions to measuring TDGVA, TE and TCE. The studies for tourism contributions mainly focus on the innovation of their research methods and supportive statistical tools. The common method for evaluating tourism economic impacts are input–output analyses (Fletcher et al., 1989; Frechtling and Horvath, 1999; Mathouraparsad and Maurin, 2017; Ntibanyurwa, 2010; Vora-Sittha, 2016), social accounting matrices (for details, see Wagner, 1997) and computable general equilibrium model (Blake et al., 2009; Dwyer et al., 2003; Li et al., 2017; Pratt, 2011). Recently, an innovative macroeconomic model, dynamic stochastic general equilibrium, is used to estimate the tourism effect on economic growth (Liu and Wu, 2019; Liu et al., 2018; Zhang and Yang, 2018), which has a great influence on the study of tourism economic impact. As tourism statistical tools, the most commonly used in tourism economic contribution analysis are tourism satellite account (TSA), as seen in Egon Smeral (2015), Yiliang Ma (2014) and Wu et al. (2018). In addition to income and growth effects, the tourism impact on employment is also concerned by scholars, as found in studies conducted by Dwyer and Forsyth (1998) and Lundgreen (2013). The practice of measuring TE has also been carried out in various countries, for example (WTO-ILO, 2014). Finally, TCE accounting has recently become an important topic, and it can be investigated based on ‘bottom-up’ or ‘top-down’ approach. Representative ‘bottom-up’ studies include Becken et al. (2006), Becken et al. (2003), Shi and Wu (2011) and Zhao and Zhu (2013). The documented literature on the ‘top-down’ method is used in Patterson et al. (2004), Dwyer et al. (2010), Munday et al. (2013), Sun (2016) and Tang and Ge (2018). Sun (2016) lists four driving factors for TCE, namely, (1) the intensity effect, (2) the structure effect, (3) the final demand effect and (4) the Leontief effect, and calculates that, for Taiwan, the main driving factor is the final demand effect. Furthermore, the change in the tourism consumption structure impacts TCE. To date, there are still gaps in research on how to realize tourism multiobjective optimization.
The previous literature provides an important concept for the multiobjective optimization of the tourism industry structure. However, these studies also provide us with more space to consider further research and analysis. On the one hand, integrated combination studies on tourism industry structural adjustment and tourism development goals are still in the theoretical discussion stage. On the other hand, most studies have paid attention only to the single effects of tourism activities, such as the economic effect or the carbon emissions effect. Moreover, they do not take into account the comprehensive effects of tourism. There are far fewer studies on tourism multiobjective optimization. They provide us with important inspiration, and we will attempt to achieve tourism multiobjective optimization by adjusting the tourism industry structure. Specifically, under the premise of an unchanged total amount of tourism activities, we consider the maximum value of tourism added value, the maximum TE and the minimum TCE as our three goals. We pay more attention to encouraging sectors with a high value added rate, a large pulling effect on employment and a weak carbon emissions effect and gradually control sectors with a low value added rate, a small pulling effect on employment and a strong carbon emissions effect. Finally, we seek the best tourism industry structure and provide suggestions for tourism healthy development.
The rest of this article is structured as follows. The second section introduces the basic methodology for calculating TDGVA, TE and TCE. Then, the multiobjective optimization model is discussed. The third section shows a case study of Shanghai, including the related data and main empirical results. The fourth section provides the conclusions and discussion.
Analytical framework
The analysis framework defines the research boundary of this article, which helps to enhance the rationality of the research results. This framework aims to explain the scope of TCE, TDGVA and TE against the backdrop of a national framework, the computational method and the data for the multiobjective optimization model of the tourism industry structure.
System boundary
The scope of tourists in this article includes all domestic tourists and inbound tourists engaged in tourist activities at destinations. Outbound tourists do not fall within the scope of this research because outbound tourism involves many destinations and tourism activities do not bring direct economic benefits to the local country. Correspondingly, we also focus on domestic tourism consumption and inbound tourism consumption at destinations.
TDGVA is the added value of all industries (tourism and non-tourism industries) in the production process to meet the tourists’ requirement (UNWTO, 2010). TE is the amount of jobs generated by various industries in the production of tourism products. TCE is tourism direct and indirect CO2 emissions caused by various industries in their production of tourism consumption (Tang and Ge, 2018).
Tourism accounting methodology and procedure
According to carbon input–output table (CIOT) and carbon input–output model, we assess TDGVA, TE and TCE. The CIOT adopts the framework and principles proposed by Tang and Ge (2018). The specific research path is as follows (see Figure 1):
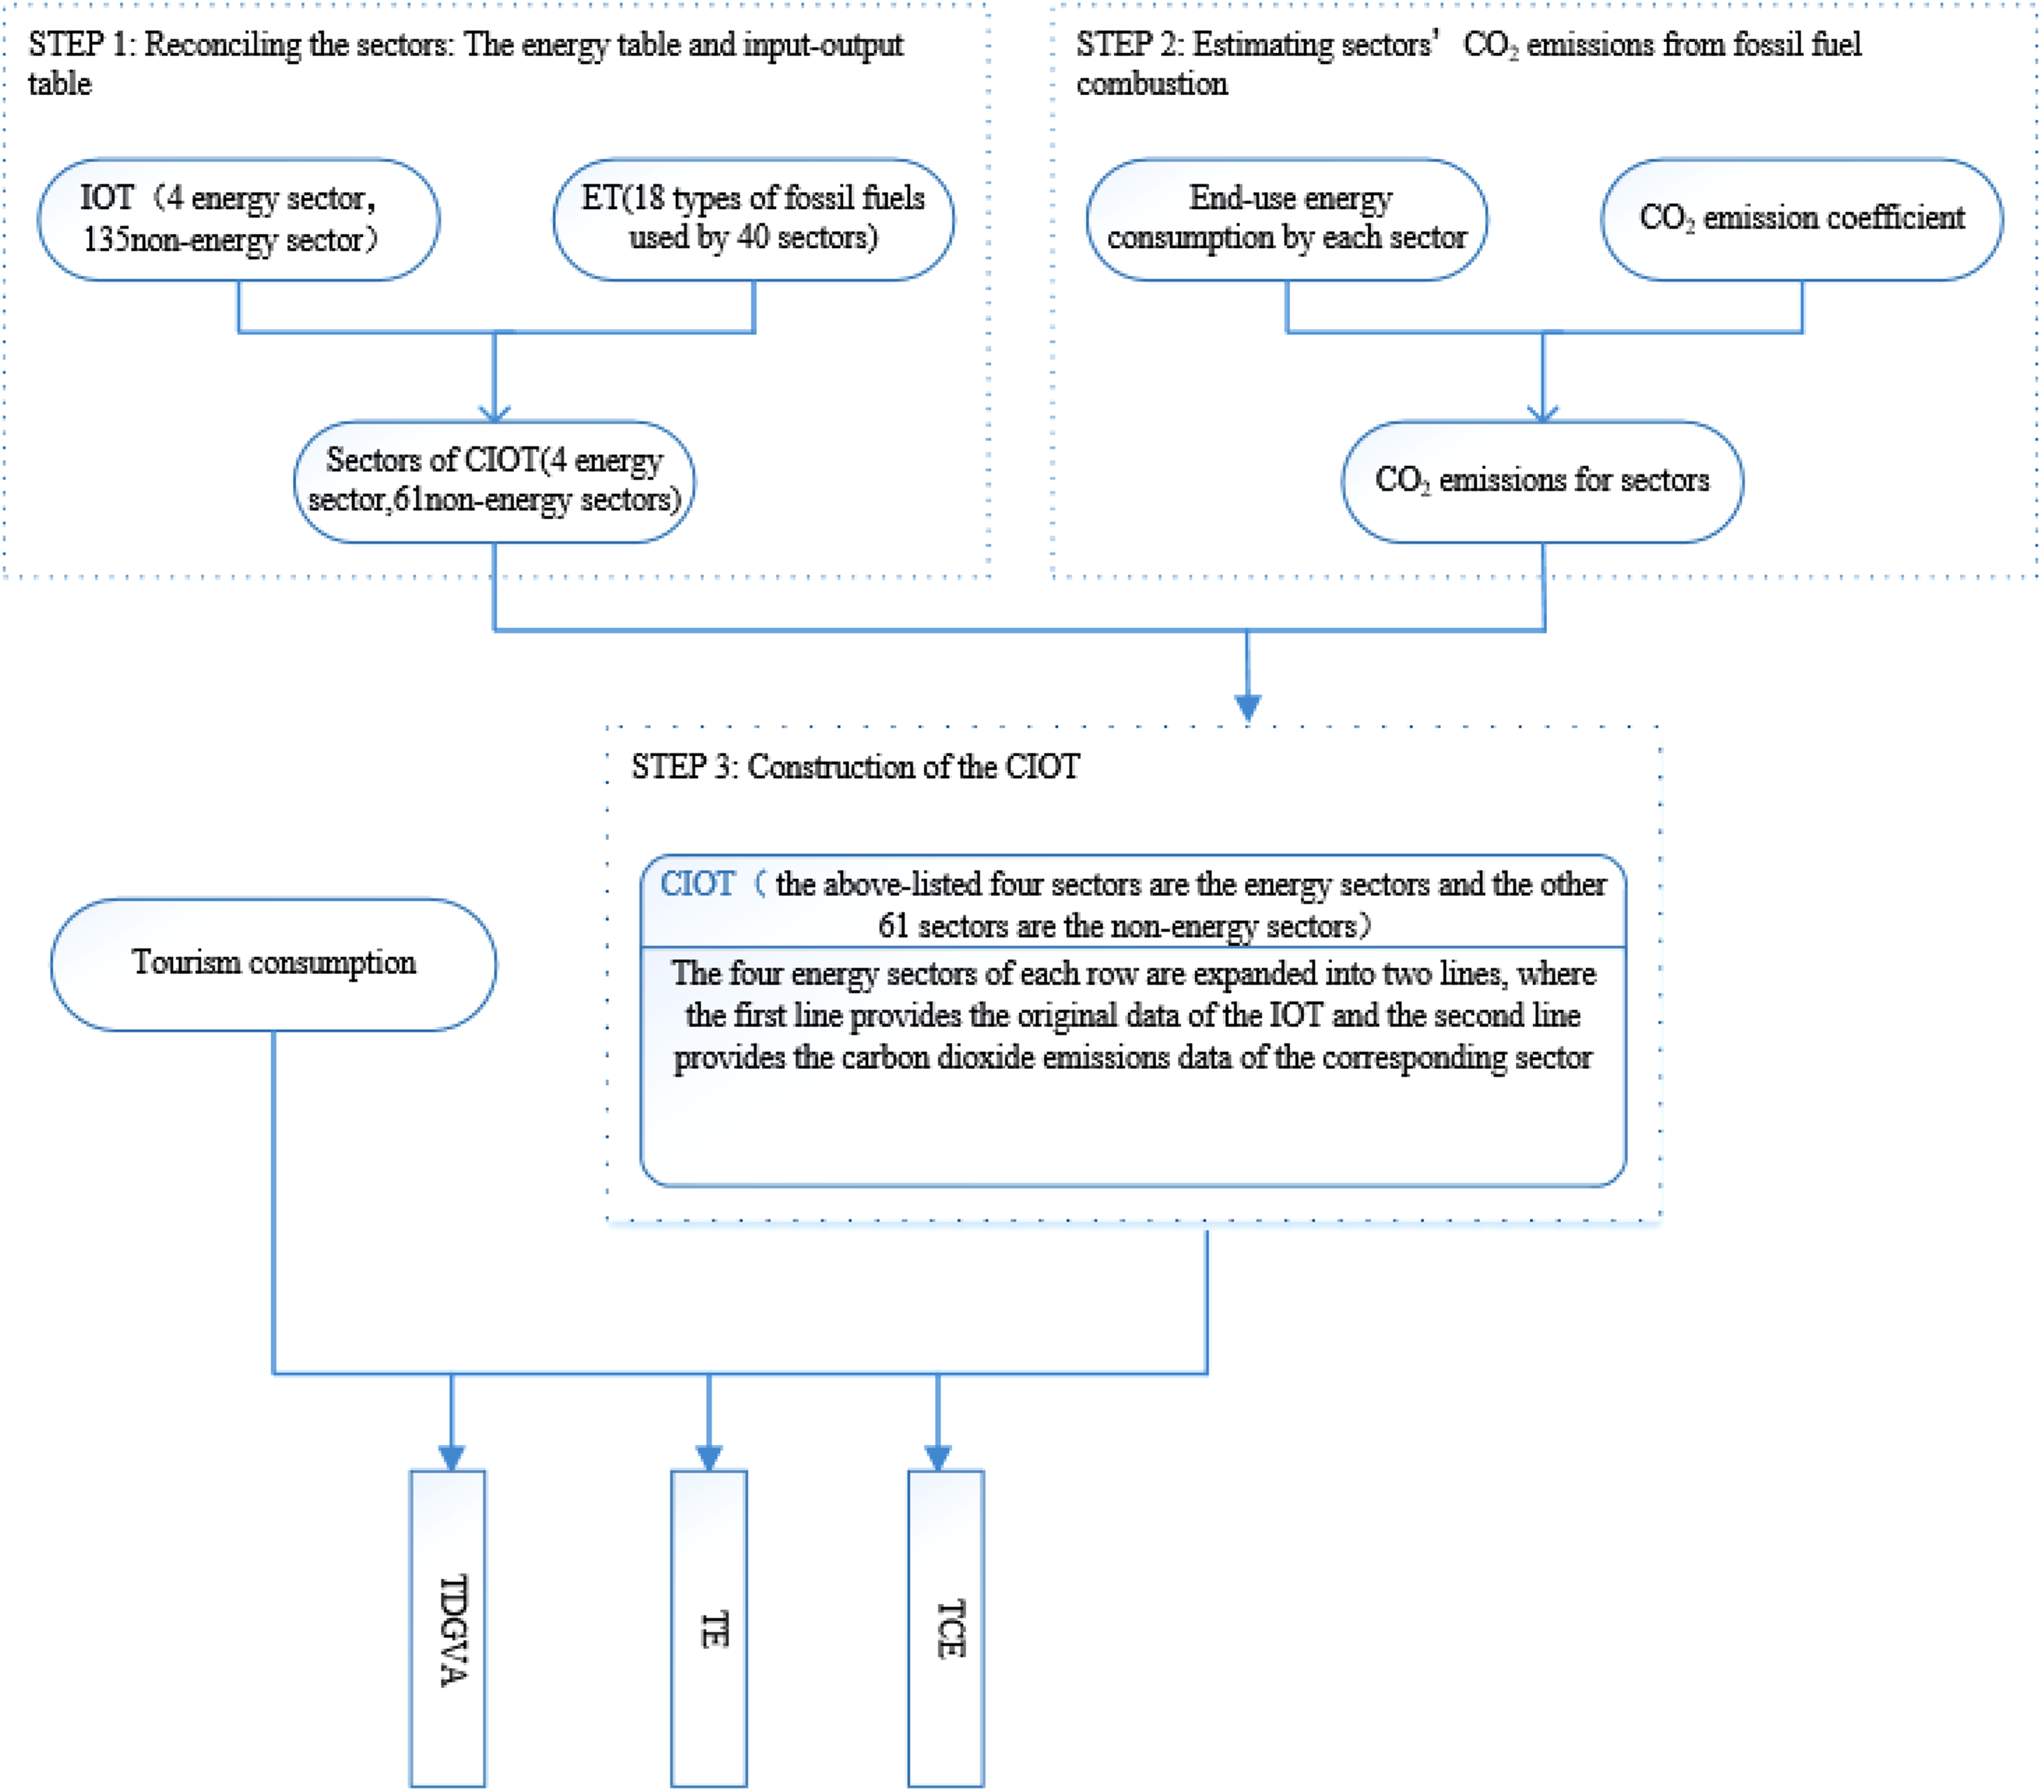
Main calculation process of the CIOT. CIOT: carbon input–output table.
Calculation method for TDGVA
Adopting the CIOT, we obtain the following

where YLC is the column vector of tourism consumption. Ac is diagonal matrix of the value-added rate.
TCE accounting
According to CIOT, TCE is calculated as follows

where TCE is the tourism carbon emission of the jth sector; YLC is the diagonalized matrix of tourism consumption;
Calculating method for TE
Using the input–output model, we investigate the number of employment driven by tourism consumption. The computation process is as follows.

Finally, the equation for calculating TE is as follows

where J denotes the number of jobs driven by tourism consumption, which represents the number people employed due to tourism consumption. A represents the direct consumption coefficient matrix in CIOT,
Multiobjective optimization model for the tourism industry structure
Introduction of the multiobjective optimization model
There are three steps to building a multiobjective optimization model. First, confirm that the objective functions are based on the research targets. Second, find the influencing factors of the objective functions and take these factors as decision variables. Third, set the constraint conditions of the model according to their economic significance.
Multiobjective optimization is applicable to many research fields where the optimal goal needs to consider multiple contradictory situations at the same time. It is a multiobjective function expressed by mathematical formula, and these functions are usually conflicting. It is difficult to make any individual object be better off without making at least one other object be worse off. Moreover, the targets cannot be directly compared with each other due to different measurement units, which make it difficult to find an optimal solution for each goal. Because of the universal existence of multiobjective problems and the difficulties in obtaining solutions, multiobjective problems face serious challenges but still develop rapidly. In recent years, applying the nondominated sorting genetic algorithm (NSGA-II) to multiobjective optimization has become a research hotspot. Compared with the conventional optimization solving method, the genetic algorithm has the advantage of fewer calculations and rapid convergence. There is no need for convexity, continuity or derivability in running the model, and the set of Pareto (nondominated) solutions 1 is obtained through an iterative process by computer technology. Specifically, the final optimal solution is obtained through iterations. In each iteration, the solution that is most suitable for the objective function will be inherited. After a series of transformation and calculation through algorithm, a new generation of solutions will be generated and continue to iterate until the final optimal solution is obtained. Compared with NSGA-I, NSGA-II improves the speed and robustness of the algorithm and ensures the uniform distribution of Pareto optimal solutions. In this article, the optimal solutions of the multiobjective optimization model for tourism industry structural adjustment originate in NSGA-II idea and are implemented through Matlab R2016a.
Determination of the objective function
In recent years, tourism has attracted substantial attention. China also attaches great importance to tourism development and has proposed a series of development goals and requirements. These goals and requirements are combined with the effects of tourism activities and make reference to some strategic planning and development visions of international organizations and national administrative departments on tourism development. We summarize the main objectives of tourism development at home and abroad 2 and find that governments and international organizations have expressed concerns about tourism’s added value, TE and tourism environmental impacts. On this foundation, and based on considerations of practicability, we propose the objective function for the multiobjective optimization model. The objective functions in this article are as follows:
The goal of maximizing TDGVA
Maximizing TDGVA is the first goal of the multiobjective optimization model for the tourism industry structure. The formula is expressed as follows

where
The goal of maximizing TE
In addition to pursuing the goal of maximizing economic efficiency, the most direct embodiment of maximizing the social benefits of tourism is the number of jobs driven by tourism

The goal of minimizing TCE
Reducing TCE is the foundation for the sustainable development of tourism. The TCE in this article focuses on the total carbon emissions driven by tourism. The formula is expressed as follows

The constraint conditions of the model
For economic reasons or due to consideration pertaining to the model itself, endogenous variables need to be discussed within a certain range. The constraint conditions are as follows.
Internal tourism consumption holds constant
Here, we illustrate the adjustment of the tourism industry structure with internal tourism consumption remaining constant.
where
Tourism transportation consumption holds constant
Transportation is an indispensable product in tourism consumption. Therefore, tourism transportation consumption is mainly concerned with internal structural adjustment, and the total amount of tourism transportation consumption remains unchanged
The total amount of tourism transportation consumption
The constraint on the rationalization of tourism consumption
From the perspective of economic significance, the consumption of tourism-related products should change within a certain range so that some tourism-related products should not present a value of zero. In this article, we provide only the lower bound of tourism-related product consumption and set no constraint on the upper limit of tourism consumption. In concrete terms, each item of tourism consumption can drop by 50% at most. The formula is expressed as follows

where
Case study: Shanghai
Tourism has the characteristics of long industrial chain and wide pulling range. It is precisely because of such characteristics that tourism has many influences on the whole national economy, promoting economic growth, stimulating employment and indirectly consuming energy and generating CO2 emissions (Tang and Ge, 2018). Shanghai is known as the ‘Magic City’, as a modern metropolis, the rich natural and cultural landscape attracts many domestic and foreign tourists. In 2018, the added value of tourism industry is 207,864 million yuan, accounting for 6.36% of GDP. 3 However, as mentioned above, tourism is not a low-carbon industry. With the rapid expansion of tourism, it is bound to cause more resource consumption and CO2 emissions. In order to further promote the healthy and sustainable development of tourism in Shanghai, it is necessary to further analyse tourism development from the perspective of sectors and find trade-off between the positive economic effects and negative environmental effects. It should be noted that, in addition to Shanghai, the research path of this article is also applicable to other cities.
Tourism accounting with regard to Shanghai
Calculation of the tourism consumption of Shanghai
Due to the slow updating frequency of input–output table at the regional level in China, which is usually compiled every 5 years, the research data in this article are still based on the Shanghai 2012 Input-Output table. Until now, the official tourism consumption mainly includes nine categories of consumption data related to food, housing, transportation, tourism, shopping and entertainment. We multiply the average tourism consumption by the number of tourists to get the internal tourism consumption (including inbound tourism consumption and domestic tourism consumption) 4 for each category.
In order to make use of the technical connection between sectors in IO table, we must match the classification of tourism consumption with the classification of departments in the CIOT. However, information on more detailed categories of tourism consumption is lacking. To solve this problem and to reconcile the sectors of tourism products and the sectors of the CIOT, we use data scraped from the Web and proportional decomposition to obtain the tourism consumption for detailed items. In addition, the consumption values for travel agencies, education and heath are from the Statistics Bureau of Shanghai. The total tourism consumption for 25 sectors of Shanghai is 415.40 billion yuan. The tourism consumption for transportation is 59.14 billion yuan (railway: 5.43; land: 23.01; water: 0.75; air: 29.95), accommodation 41.58 billion yuan, catering 40.02 billion yuan, shopping 150.34 billion yuan, tourism attractions 37.54 billion yuan, entertainment 12.24 billion yuan, telecommunications 2.64 and so on. The detailed sector items are presented in the Online Appendix.
Calculation of the TDGVA and TE of Shanghai
The tourism goods and services are produced by the above 25 industries. TDGVA is the total added value of these industries generated in their production process. We use tourism consumptions of these 25 sectors and formula (1) to calculate the TDGVA. The results demonstrate that the TDGVA created by the 25 sectors in their production processes is 160.68 billion yuan. In 2012, the tourism added value calculated by Shanghai Statistics Bureau through production method was 149.77 billion yuan. The calculation methods are different, so there are minimal errors between them, but the error is within the allowable range. All in all, the figure reflects the direct contribution of tourism to the economy. The ratio of TDGVA to Shanghai’s GDP is 7.97% (=1606.81/20,181.72). In addition, based on equation (3), we calculate that the amount of employment driven by tourism activities in Shanghai in 2012 was 4039.5 thousand jobs; the two industries with the largest pull effects are farming, forestry, animal husbandry and fishery and residential services.
Calculation of the TCE of Shanghai
According to equation (2), in 2012, the tourism consumption CO2 emissions in Shanghai were 43.88 million tons. 5 If there were no tourism activities in Shanghai, then these carbon emissions would be greatly reduced, and most of them would not be produced. According to the CIOT, the amount of CO2 emissions caused by total consumption in Shanghai is 214.51 million tons, and the ratio of tourism CO2 emission to Shanghai’s CO2 emission is 20.46% (=43.88/214.51). From the perspective of total carbon emission of the sector, tourism is the second largest sector for CO2 emissions when we see tourism as a ‘big’ sector. Therefore, from an indirect perspective, tourism may not be low-carbon sector.
Optimization result analysis
Based on NSGA-II, we obtain 30 Pareto optimal solutions for the multiobjective optimization models, and every Pareto optimal solutions has no dominance to others. That is, each solution is nondominated or noninferior. As we see in the Pareto frontier in Figure 2, every star point represents an optimal choice. Each solution is uniformly distributed in the Pareto optimal domain, and the boundary is clear. The evaluation parameters of the algorithm are also within reasonable limits, and the optimization is successful.
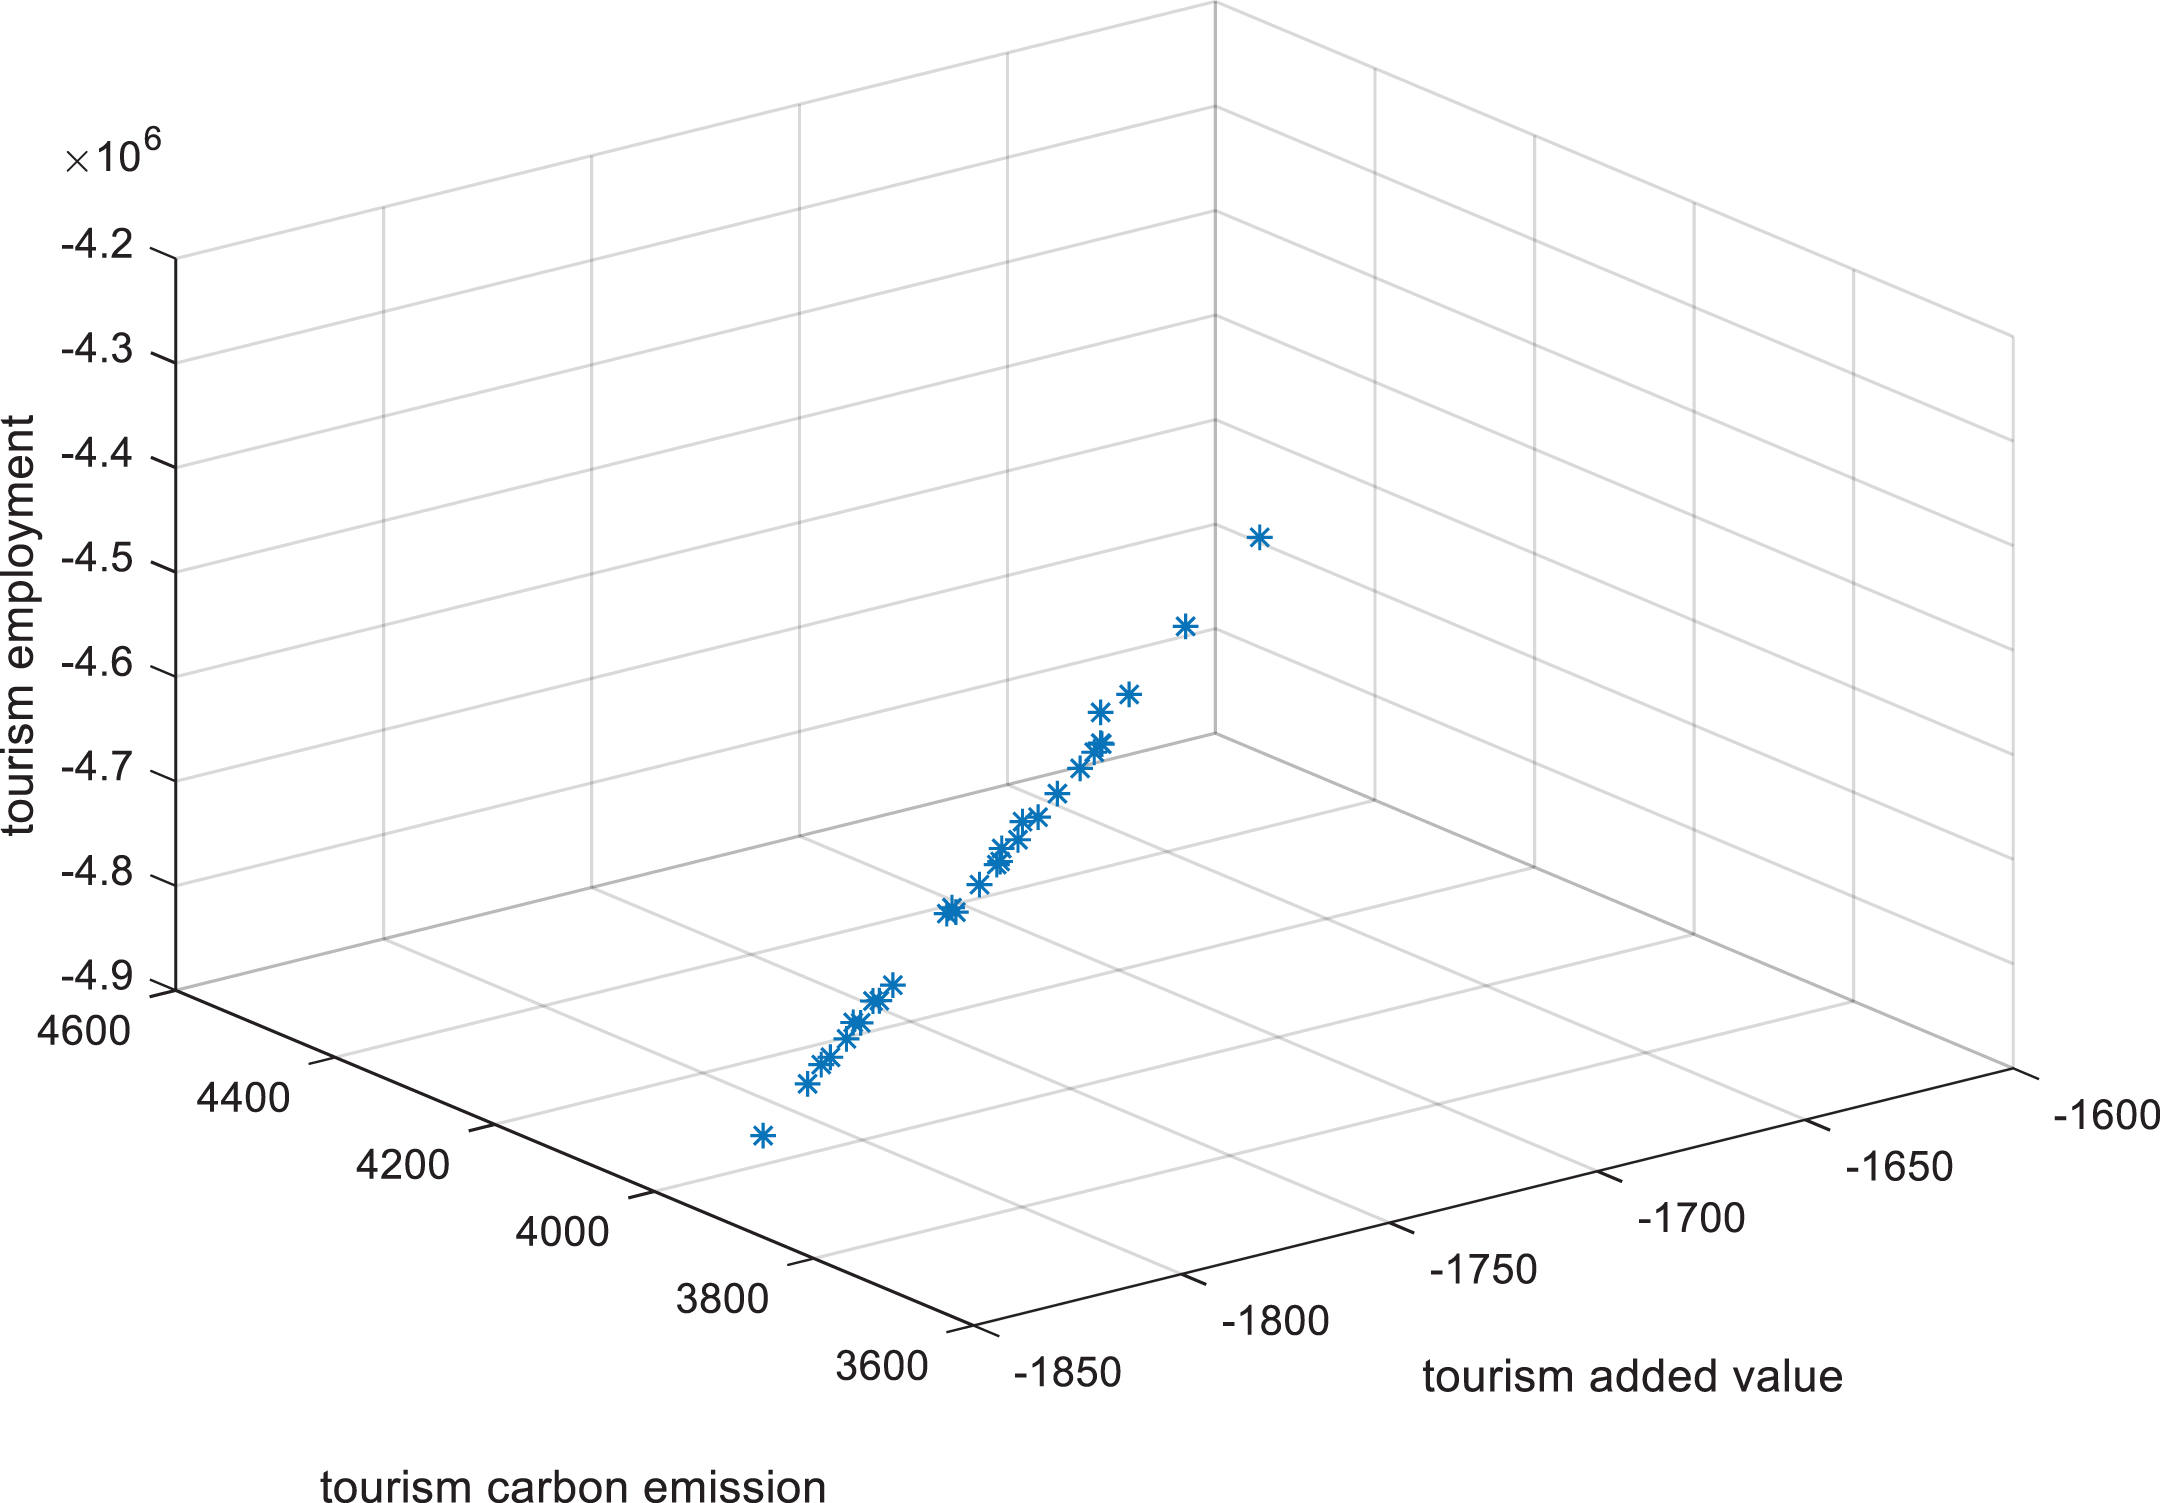
Pareto frontier.
In all Pareto solutions we have got, each solution represents one industrial structure under the condition of optimizing the above three objectives, and each industrial structure shows different emphases and priorities. Practically, in the process of policymaking, decision makers could choose the appropriate solutions according to their preferences. In line with the research goals of this article, we focus on three optimization schemes: the maximum tourism added value scheme, the minimum carbon emissions scheme and the maximum TE scheme. It is given in Table 1 for specific data.
The actual data and the simulation results of the optimization scheme for 2012.

Note: TDGVA: tourism direct gross value added; TCE: tourism carbon emission; TE: tourism employment. The underlined numbers indicate the proportion by which the industry should be reduced after optimization.
Compared with the actual tourism industry structure in 2012, there is more space for further optimizing tourism industry structure under the condition of maximizing TDGVA, TE and minimizing TCE (Table 1). As presented in the last three lines of Table 1, after optimization, the industrial structure of the three schemes is better than the original structure for TDGVA and TE. However, the amount of TCE in the employment-biased scheme (4589.32) is greater than that in 2012 (4388.19).
Starting with the analysis of the growth-biased scheme, based on the optimal structure after simulation, we find that TDGVA increased by 23.8 billion yuan compared with the actual TDGVA of 160.6 billion yuan in 2012, rising by 14.8%. In terms of the tourism transportation structure, the government should encourage tourists to choose rail transport and water transport more and reduce their air travel (decreasing by 3 percentage points). Another obvious structural change is that the proportions of residential services and agriculture, forestry, animal husbandry and fishery have increased significantly, rising by 20 percentage points and 3 percentage points, respectively. The proportions of accommodations and catering decreased significantly, falling by 7.5 percentage points and 7 percentage points, respectively.
Then, we examine the low-carbon emissions-biased scheme. Based on the optimal structure after simulation, TCE fell by 4.97 million tons compared with the actual TCE of 43.88 million tons in 2012, decreasing by 11.3 percentage points. In view of the structure, the obvious structural change is that the proportions of railway transport; agriculture, forestry, animal husbandry and fishery; and wholesale and retail sales increased by nearly 9, 3.31 and 3 percentage points, respectively. The obvious declining industries are tobacco products and air transport, which decreased by 10 percentage points and 6 percentage points, respectively; accommodations dropped by nearly 7 percentage points; and the food and beverage industry fell by 6 percentage points.
Finally, we analyse the employment-biased scheme. According to the optimal structure after simulation, TE increased by 83.53 thousand jobs compared with the actual TE of 4.04 million jobs in 2012, increasing by 2 percentage points. Compared with the 2012 real tourism industry structure, the obvious structural change is that the proportion of agriculture, forestry, animal husbandry and fishery increased by 18 percentage points, and the proportion of water transport increased by 3 percentage points. The proportions of tobacco and accommodations and catering were dramatically reduced, decreasing by 10% and 7%, respectively.
The underlined numbers in Table 1 indicate the proportion by which the industry should be reduced after optimization. The structural adjustment directions of the same industry in the three schemes are very close, especially for the growth-biased scheme and the employment-biased scheme, but the adjustment ranges are different. Overall, the three schemes make great contributions to promoting economic growth, decreasing carbon emissions and spurring TE. The direction and strength of specific industrial structure adjustment depend on the macroeconomic goals of policymakers.
Conclusion and discussion
Based on UNWTO (2010), in view of the practical Chinese situation, we calculate TDGVA, TCE and TE through CIOT for Shanghai. With the increasingly serious problems of global warming and rapid tourism development, there is a lock-in effect among tourism added value, TE and tourism CO2 emissions. For that reason, we incorporate the goals of tourism development into a multiobjective optimization model to explore decoupling the lock-in effect between tourism growth and CO2 emissions through structural adjustment from the tourism consumption perspective. The results indicate that to formulate better tourism development policies, the optimization and adjustment of tourism industrial structure will play an important role.
From the data obtained in this article, tourism makes larger contributions to economic growth and employment; however, it also creates great negative externalities for the environment. For example, this research shows that there will be a large amount of CO2 caused by tourism. In the future, tourism development should focus on multidimensional comprehensive developmental goals. First, TDGVA was 160.68 billion yuan, creating 7.97% of the value added in the national economy for Shanghai. The result shows that tourism plays an important role in promoting Shanghai’s economy. Second, TE in Shanghai accounted for 4039.5 thousand jobs in 2012, which shows the important socio-economic impact of tourism on the macroeconomy. Third, tourism produced 43.88 million tons of CO2, accounting for 20.45% of Shanghai’s total CO2 emissions in 2012. We conclude that tourism added value accounts for nearly 8% of GDP; at the same time, the proportion of TCE to total carbon emission is as high as 20%. From this point of view, tourism negative environmental effect is much higher than its positive economic effect. If we continue to expand the tourism industry blindly instead of optimizing its structure, tourism will be the culprit of greenhouse effect in the future. Therefore, under this background, the tourism sustainable development must be put on the agenda and the government cannot blindly expand tourism development and ignore the negative environmental effects of tourism development. Policymakers face a paradox between economic development and carbon emissions reduction. The multiobjective optimization model may specify a valid path to decouple the lock-in effect between economic growth and tourism CO2 emissions through structural adjustment.
The multiobjective optimization results in this article can provide important references for optimizing and adjusting the tourism industry structure for Shanghai or other cities. If governments are inclined to promote tourism economic growth, then they should encourage tourists to consume more residential, water transport, and farming, forestry, animal husbandry and fishery products and services and appropriately control the expenditures of tourists on tobacco, accommodations and food and beverages. If governments prefer to promote TE, then they should encourage tourists to consume farming, forestry, animal husbandry and fishery, water transport, and real estate products and services and appropriately control the consumption of tobacco, accommodations and catering. If governments are inclined toward the low-carbon emissions-biased scheme, then they should encourage tourists to spend more on railway transport and farming, forestry, animal husbandry and fishery products and services and appropriately control the consumption of accommodations, catering, air transport and tobacco. The choice of a specific scheme depends on the preference of the decision maker; overall, however, regardless of whether it is the growth-biased, employment-biased or low-carbon emissions-biased scheme that is adopted, the result after optimization is better than that of the original tourism industry structure. There are many shortcomings in this article. It is possible that under the current development background, the adjustment of industrial structure cannot be realized immediately. This is largely determined by main stakeholders in tourism, especially for the behaviours of industry that should be cut down, but these sectors could be move to non-fossil-fuel use or to less-fossil-fuel use to decrease the CO2 emission firstly, while keeping their supply constant.
This article has certain limitations. For example, the input–output table as a relatively slow update rate, and the most recent year was 2012. Therefore, there is a certain gap with regard to the technical and economic links among departments compared with the current economic development situation. In addition, we did not forecast the future tourism industry structure, and the optimal tourism structures recommended in this article may be difficult to realize; however, we provide a directional guideline for future tourism development. All in all, the results of this study are of great significance for correctly understanding the tourism development status from the sector level and guiding tourists to practice green consumption.
Research Data
Research Data abstract for A study on the multiobjective optimization model for tourism development – Take Shanghai as example
Research Data abstract for A study on the multiobjective optimization model for tourism development – Take Shanghai as example by Qian Li, Meiwei Tang and Chengbo Li in Tourism Economics
Footnotes
Declaration of conflicting interests
The author(s) declared no potential conflicts of interest with respect to the research, authorship, and/or publication of this article.
Funding
The author(s) disclosed receipt of the following financial support for the research, authorship, and/or publication of this article: This paper is funded by the National Office for Philosophy and Social Science “Research on Tourism Statistical Monitoring Methods and China Tourism Satellite Account in the Context of Big Data” (19CTJ011).
Supplemental material
Supplemental material for this article is available online.
Notes
References
Supplementary Material
Please find the following supplemental material available below.
For Open Access articles published under a Creative Commons License, all supplemental material carries the same license as the article it is associated with.
For non-Open Access articles published, all supplemental material carries a non-exclusive license, and permission requests for re-use of supplemental material or any part of supplemental material shall be sent directly to the copyright owner as specified in the copyright notice associated with the article.