
Abstract
This article explores the issues of carbon dioxide (CO2) emissions resulting from the production of the goods and services provided to supply tourism consumption. First, we define the scope of tourism activities and the resulting tourism consumption and tourism direct gross value added (TDGVA). Second, we calculate CO2 emissions for sectors and compile a carbon input-output table (CIOT). Third, we adjust the tourism-related products consumed according to the range of the corresponding sectors of the CIOT. Finally, we use Shanghai as an example to calculate the carbon emissions that result from tourism consumption using the input-output model. This study shows that the TDGVA accounted for 7.97% of the Gross Domestic Product (GDP) in 2012, whereas the carbon footprint of tourism accounted for 20.45% of total carbon emissions. The results demonstrate that tourism is not a low-carbon industry in Shanghai.
Introduction
Developing low-carbon industries has become the main path to realizing emission reduction targets, and the tourism industry is central to this goal. In China, tourism is regarded as a strategic industry. As early as 2009, the government decreed that ‘the tourism industry will be the strategic pillar industry by 2020’. In August 2014, the State Council issued ‘Several Opinions on Promoting the Reform and Development of the Tourism Industry’, which promotes the following specific requirements. By 2020, the total domestic tourism spending should reach 5500 billion Yuan, urban and rural residents will travel 4.5 times per year, and the proportion of tourism’s added value will account for more than 5% of the GDP. China’s tourism development also plays an important role in the world. In 2015, China was the second most popular world tourist destination with 57 million international arrivals, and it reported the second largest amount of international tourism receipts at US$114 billion (UNWTO: Tourism Highlights, 2016).
However, tourism growth will bring environmental costs along with the economic benefits. These environmental costs have become an increasing part of government and industry considerations. Tourism-related carbon emissions have been the focus of several studies. In 2000, Gössling (2000) first proposed a method to measure tourism-related carbon emissions. He found that tourism is not a low-carbon industry in developing countries, as it heavily relies on other high energy-consuming sectors, especially air transport. This article lays the foundation for subsequent quantitative research. Generally, tourism-related carbon emissions accounting can be divided into the ‘bottom-up’ approach and ‘top-down’ approach.
Becken et al. (2003) first used the ‘bottom-up’ approach to analyse tourism-related carbon emissions and their wide range of impacts. The authors showed how different travel choices within the transportation, accommodation and tourism activity subsectors demand different amounts of energy, and this energy adds up to the total ‘energy bill’ of international and domestic tourists in New Zealand. Similarly, Shi and Wu (2011) calculated the carbon emissions of China’s tourism with respect to transportation, accommodation, catering and tourism activities. They concluded that tourism is a low-carbon industry. In fact, ‘bottom-up’ analysis entails gathering a wide variety of data, and more importantly, encounters challenges in estimating the indirect environmental effects of tourism activities. Studies that use the ‘bottom-up’ method generally refer to the direct tourism-related carbon footprint for transportation, accommodations and tourism attractions, but other sectors such as retail and the food and beverage industries are excluded, leading to an underestimation of the total carbon emissions. However, the ‘bottom-up’ method has many advantages; it enables the in-depth study of different tourists’ behaviours and sheds light on the travel choices that contribute most to carbon emissions, which can allow emission reduction policies to be more targeted.
Another method of tourism-related carbon emissions accounting is a ‘top-down’ approach. This approach takes the Tourism Satellite Accounts (TSA) and System of Integrated Environment and Economic Accounting as the foundation, regards tourism as an independent sector and calculates its carbon emissions. Typical studies, such as that by Patterson et al. (2004), constructed input-output (IO) economic environment accounts of the tourism sector. The authors used life cycle assessment to assess the indirect environmental impacts of the tourism sector in New Zealand. They concluded that when indirect carbon dioxide (CO2) emissions were considered, the tourism sector ranked as the fifth largest contributor to total CO2 emissions. Other scholars have used IO models to study direct and indirect tourism-related carbon emissions (e.g. Dwyer et al., 2010; Meng et al., 2016; Munday et al., 2013; Sun, 2016). In China, based on IO analysis, Yuan (2013) calculated China’s indirect tourism-related carbon footprint to be 44.41 million tons in 2007. Based on the life cycle assessment theory, Zhong et al. (2014) calculated that in China in 2007, the direct carbon emissions of the tourism industry accounted for 73.56 million tons, and the indirect carbon emissions of the tourism industry were 96.23 million tons. Thus, studies can provide considerably different results even for the same year. The ‘top-down’ approach has been effective in certain countries, but it has been beset with difficulties in China because China has not yet established a standard TSA, its tourism consumption data classification is not sufficiently detailed and the carbon data broken down by sectors are seriously deficient. Therefore, it is necessary to alter China’s tourism and carbon accounting to meet international standards. Then, meaningful calculations of tourism-related carbon emissions can be achieved.
Overall, the ‘bottom-up’ analysis is characterized by relatively simple calculation methods. However, more detailed information on energy end use and tourist behaviours is required. The results will provide a great level of details on energy use and the carbon emissions of different transport modes, accommodation levels and tourist behaviours. The drawback is that only direct carbon emissions of a few sectors are involved. In contrast, the ‘top-down’ method considers the whole economy and takes tourism as an ‘umbrella’ sector, then scales activities down to sectors that are related to tourism (Becken and Patterson, 2006). The data requirements of ‘top-down’ method relay on governmental statistics for the total amount of tourism consumption by item and the carbon intensity of sectors. The production caused by tourism consumption is calculated with the assistance of an IO model and the subsequent indirect tourism-related carbon emissions. The key assumption of this method is homogeneity; that is, the nature of input and outputs of the sector that is scaled down is the same as the whole.
Based on previous studies, we consider the current status of Chinese data. This article uses the ‘top-down’ method to quantify the tourism-related carbon footprint using IO modes. The calculation involves two difficult problems, namely, how to calculate the number of tourism-related activities and how to calculate the carbon footprint of these activities. These difficulties arise because tourism is not a traditional sector of the national economy, whereas the current economic data are collected and classified by sector based on their relevance to similar production activities. Since the tourism data are included in multiple relevant sectors, it is not possible to obtain complete tourism data directly from the current statistical system. Moreover, China has not yet established a TSA, the classification of tourism statistics with respect to consumption expenditures is relatively rough and there is a serious lack of carbon emissions data at the sector level. In short, there are many difficulties in tourism and carbon accounting. This article performs its analyses under the guidance of authoritative documents such as TSA: RMF, 2008; UNWTO, 2008, the International Recommendation of Tourism Statistics (IRTS; UNWTO, 2008) and the 2006 Intergovernmental Panel on Climate Change (IPCC) Guidelines for National Greenhouse Gas Inventories. First, we define the scope of tourism activities, calculate tourism consumption and collect detailed visitors’ tourism activities information using big data technology to make up for the lack of a detailed classification of China’s current tourism consumption. Then, we construct the carbon IO table (CIOT) and use the IO model to compute the carbon intensity of each sector. Finally, we coordinate tourism consumption with the sectors of the CIOT and use the IO model to estimate the carbon emissions of tourism in Shanghai.
The next section focuses on the analytical framework of the system boundaries. The ‘CIOT and carbon IO model’ section introduces the method of carbon emissions accounting per sector by compiling the CIOT. The ‘Measurement of tourism activities’ section examines how to estimate the tourism activities. The ‘The results of Shanghai tourism-related carbon emissions and analysis’ section applies the proposed measures to Shanghai tourism and comments on the results. Finally, the ‘Conclusion and discussion’ section presents the conclusions and discussion.
Study area and system boundaries for tourism-related carbon emissions
Shanghai, the largest economic central city of China, is located in the Yangtze River Delta. Shanghai was once the international financial centre of the Far East. Since China’s reform and opening, Shanghai has experienced dramatic changes in its economic and social development as well as the appearance of the city. This dynamic and charming city has attracted numerous visitors from all over the world. In 2015, Shanghai has over 8 million overseas visitors and 276 million domestic visitors. Tourism is a double-edged sword in the sense that it promotes regional economic growth but it also leads to increased negative environmental impacts, especially with respect to greenhouse gas emissions. Shanghai plays a leading and exemplary role in Chinese socio-economic development and construction. Thus, to assure the sustainability of tourism in Shanghai, it is necessary to find ways to balance between reducing the carbon emissions from tourism development and the increasing cost of the emissions impacting on nature environment. The ideas, models and approaches of this study is applicable to other cities as well. The results of this study provide policy reference for other cities to reduce their tourism-related carbon emissions.
Tourism carbon accounting is the premise of sustainable development of tourism. For the purposes of this article, boundary defining must be adopted to avoid ambiguities and confusion when interpreting the results. The analysis of tourism-related carbon emissions is not straightforward. Several different interpretations can be applied to the definition and measurement of tourism-related carbon emissions. Tourism mainly refers to tourists’ activities related to several sectors. In terms of calculating energy use and concomitant CO2 emissions, it is necessary to separate direct CO2 emissions from indirect CO2 emissions, arising from tourism activities. Direct tourism-related carbon emissions are direct result of tourist activities, for direct purchases and consumption of terminal energy commodities. Indirect tourism-related carbon emissions are associated with intermediate inputs from all stages of production.
Specifically, in this article, carbon footprint of tourism consumption refers to all carbon emissions generated by tourists’ consumption, including domestic and foreign tourists who travel to Shanghai. Tourism carbon accounting should be consistent with the scope of carbon emissions. Per the IPCC (AR4), energy systems for most economies are largely driven by the combustion of fossil fuels. The consumption of fossil fuels, the largest components of greenhouse gas emissions, is typically contributing over 90% of the CO2 emissions. Here, we only focus on the CO2 emissions from the combustion of fossil fuels. Therefore, the direct tourism-related carbon emissions are driven by the combustion of fossil fuels that related to tourism activities. Our study does not include such emissions that are produced by tourists burning charcoal for barbecues and fuel purchases for a self-driving tours since there are sparse data on these activities. Other tourism activities such as consumption of transportation, accommodation and catering do not involve the direct consumption of fossil fuels because these sectors mainly supply tourism services directly, and there are no direct tourism-related carbon emissions for the consumption of services. Therefore, the number of direct tourism-related carbon emissions in this article is zero. This approach is different from that employed in other papers, such as Ya-Yen Sun (2016) and Meng (2016). The discrepancy is mainly due to the different definitions of the scope of direct and indirect tourism-related carbon emissions. For example, the previous authors attributed the carbon emissions generated by the direct burning of fossil fuels for transportation and accommodation to direct tourism carbon emissions, while in this article, we consider these sources to be indirect tourism carbon emissions because the direct relationship of these activities with tourists is service.
However, to satisfy the demand of tourists, these sectors may indirectly consume fossil fuels and produce CO2 emissions. For example, an aircraft consumes fossil fuels when operating, accounting for the first instance of indirect tourism-related CO2 emissions. Furthermore, carbon emissions are also produced through total production chains, such as the purchase of electricity by ‘accommodations’. In turn, the electricity sector will have made an intermediate purchase of coal, resulting in a second round of CO2 emissions. The sequence continues until all intermediate inputs can be directly accounted for. Measuring indirect tourism-related carbon emissions involves summing the CO2 emissions of each industry generated throughout these sequences. In China, the indirect energy consumption of households between 1987 and 2002 was two to three times as much as the direct consumption (Li and Zhang, 2008). In 2007, indirect energy consumption and carbon emissions of rural households in China accounted for more than 85% of the total energy consumption and carbon emissions (Zhang, 2010). Therefore, it is necessary to calculate indirect carbon emissions.
CIOT and carbon IO model
Tourism-related CO2 emissions are part of the total CO2 emissions. Tourism is an integrated activity that involves, among other activities, eating, living, travelling, shopping and entertainment. Therefore, it is not sufficient to analyse the carbon footprint only at the national level; detailed carbon emissions data at the sector level are also needed. To this end, this section presents a calculation of the CO2 emission coefficient, describes the CIOT and establishes the IO model to assess the carbon emissions at the sector level. The specific steps are discussed in the next section.
Method for compiling the CIOT
STEP 1: Reconciling the sectors: The energy table and IO table
The data are gathered from 2012 input-output table (IOT) of Shanghai, which including 139 sectors, and 2013 Shanghai Energy Statistics Yearbook (energy table). The IOT, which illustrates the technical and economic linkages between departments, provides us a way to identify the inputs and outputs for each sector. The energy table describes the amount of 18 different fossil fuels consumed by 40 major sectors. In the IOT, total 139 sectors are divided into two categories: fossil energy sectors (energy sectors) and non-fossil energy sectors (non-energy sectors). The energy sectors are characterized such that the direct CO2 emission is generated as long as consuming their products. Non-energy sectors are characterized by the use of their products which will not generate carbon emissions directly. Based on the descriptions of sectors in the IOT, there are four energy sectors: Mining and Washing of Coal; Extraction of Oil and Gas; Processing of Petroleum, Coking and Processing of Nuclear Fuel; and Production and Supply of Gas. The rest of 135 sectors are non-energy sectors. According to the energy table, we combine 18 fossil fuels of the energy table into the four energy sectors of the IOT. The details are listed in Table 1.
Combination of energy products.

IOT: input-output table.
The non-energy sectors in the IOT are more numerous than those in the energy table. Therefore, we merge the non-energy sectors of the IOT to adapt to the sectors in the energy table. After a series of mergers and splits, 65 sectors are obtained; 4 of them are energy sectors and the rest of 61 sectors are non-energy sectors. These sectors are taken as the sectors in the CIOT. The process is stated in Table 2.
Reconciling the sectors: The energy table and IOT.

CIOT: carbon input-output table.
STEP 2: Estimating CO2 emissions from fossil fuel combustion using the 2006 IPCC Guidelines
On the basis of fuel consumption of each sector in step 1, we multiply the fuel consumption by the CO2 emission coefficients, providing a method to transform fuel consumption into CO2 emissions.
CO2 emissions from fuel combustion using the IPCC Reference Approach are calculated as follows 1 :

Where fuel consumption is the end-use energy consumption by every sector from the energy table and summed into the four energy sectors of the IOT; Conv Factor is the conversion factor for the fuel-to-energy units (Terajoule [TJ]) on a net calorific value basis; CC is the carbon content (tonne C/TJ); COF is the fraction of oxidized carbon, which usually has the value of 1 that reflects complete oxidation; and 44/12 is the molecular weight ratio of CO2 to C.
In practice, the net Conv Factor of various fossil fuels is used in the ‘China Energy Statistical Yearbook’, and CC uses the default values of the IPCC.
For brevity, the IPCC considers the product of CC, COF and 44/12 to be an effective CO2 emissions factor. We further consider that the product of Conv Factor and the effective CO2 emissions factor denotes the CO2 emission coefficient (equation (1)).
STEP 3: Construction of the CIOT
We adjust the sector order of the CIOT such that the above-listed 4 sectors are the energy sectors and the other 61 sectors are the non-energy sectors. Then, the four energy sectors of each row are expanded into two lines, where the first line provides the original data of the IOT and the second line provides the CO2 emissions data of the corresponding sector. In this way, the direct CO2 emissions of the energy sector from the combustion of fossil fuels are embedded into the IOT to establish the CIOT. 2 Therefore, not only are the economic values and balanced relationship of the original IOT retained, but the entire table presents an understanding of carbon emissions.
Carbon IO model
After completing the CIOT, we establish the carbon IO model from three perspectives and focus on four coefficients and one balance equation.
Carbon accounting based on production
Let aij denote the direct consumption coefficients of the IOT
1. Direct carbon emission coefficient (DCEC)

where eij is the DCEC that measures CO2 emissions generated by the combustion of ith energy products required in the per monetary unit of production of industry j, 2. Integrated DCEC (IDCEC)
Because the production of an industry may directly require a variety of energy products, the DCEC reflects only the consumption of one type of energy product. Therefore, another coefficient, the IDCEC, is designed to reflect the integrated direct carbon emissions of production.

where dj is the IDCEC and measures the CO2 emissions in the per monetary unit of production of industry j. dj is obtained by adding the four items in a column of eij.
Carbon accounting based on use
1. Total carbon emission coefficient (TCEC)

where G denotes the total carbon emission matrix with elements gij quantifying the CO2 emissions of industry i when its products are directly and indirectly required by the increase in per unit final demand of industry j. 2. Integrated total carbon emissions coefficient (ITCEC)
The TCEC gij reflects only the CO2 emissions caused by the consumption of one type of product that is directly and indirectly required by the increase in the per unit final demand of industry j. We obtain the ITCEC by adding the 65 items of a column of gij. The equation is as follows:

and the matrix form is

where hj quantifies the CO2 emissions generated by increasing the per unit final demand of industry j. H is the column matrix of the integrated total carbon emissions.
Carbon balance for total carbon emissions
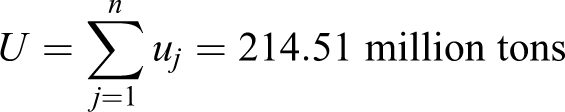
In theory, the total amount of CO2 emissions from the perspective of production (emissions-P) and use (emissions-U) should be equal:


where U is the total CO2 emission from production, and uj is the direct carbon emissions and reflects the CO2 emissions in sector j by Xj units of production. By adding all of uj(j = 1, 2,…, 65), the CO2 emissions of all sectors are obtained (denoted U); V denotes the carbon emissions from use, with its elements vi denoting the total CO2 emissions generated both directly and indirectly by increasing the per unit final demand of industry j. yi is the matrix of the final products.
Equations (7) and (8) is also a key balance to determine whether the CIOT is scientific and accurate.
Measurement of tourism activities
Calculation of the tourism consumption based on tourism sampling survey data
Based on available statistical publications from the National Bureau of Statistics, we derive the tourism information for eight main categories: Transportation, Accommodations, Catering, Shopping, Tourism attractions, Entertainment, Telecommunications and Others. However, we lack information for more detailed categories.
Specifically, we obtain the average consumption of individual tourists in 2012 for the above eight main categories from the Sampling Survey of Domestic Tourism of Shanghai. By multiplying these values by the number of domestic tourists from the 2013 Shanghai Statistical Yearbook, we can calculate the amount of domestic tourism consumption for each group.
Similarly, we derive the amount of inbound tourism consumption from the 2013 Sampling Survey Data of Inbound Tourists and the 2013 Shanghai Statistical Yearbook. We convert these data into China Yuan (CNY) based on the exchange rate with the USD.
The internal tourism consumption of each group in Shanghai is calculated by adding the domestic and inbound tourism consumption (the second column of Table 3).
Corresponding table of the tourism survey and carbon table (unit: 100 million Yuan).

CIOT: carbon input-output table.
Reconciling the sectors: The tourism products and sectors of CIOT
The key to using the IO model to analyse tourism is to link tourism consumption with the sectors of the CIOT in part 3. We must divide the eight groups (the first column in Table 3) into subgroups (the third column in Table 3) so that there is a tight correspondence between tourism consumption and the sectors of the CIOT. In 2015, the National Bureau of Statistics issued the Statistical Classification of National Tourism and Related Industries, which established a bridge between tourism activities and the sectors in the IOT. Based on this classification, the corresponding relationship between tourism and the CIOT is as shown in Table 3. In addition, the last three items in Table 3 (Travel agency, Education and Heath) are in some cases a part of tourism spending and must be included in tourism consumption. The data are from the Statistics Bureau of Shanghai.
Next, we provide a full description of shopping. Some research attributes shopping to the wholesale and retail sectors (Meng et al., 2016) because the only activity in direct relationship with tourists is retail trade activity (IRTS; UNWTO, 2008, 5.40). However, tourism expenditures include services, consumable goods and valuables purchased by visitors, and the classification of tourism by purpose recognizes that the acquisition of some of these goods (shopping) might also be the main purpose of tourism trips. Based on the principles of System of National Accounts 2008 (SNA2008), we treat the purchaser as undertaking two different transactions. The first is the purchase of the item directly from the producer, and the second is the purchase of the margins involved. Therefore, the shopping expenses of this article are also divided into two parts in which some are classified as direct producers of goods and others as retail trade activities. The purchase of tourist goods is mainly concentrated in food, beverage, tea, textiles, leather and shoes, as shown in Table 3.
Advancements in data sources and data collection methods to supplement tourism statistics
It is not sufficient to calculate the detailed tourism data only by using the current statistical system (published by the China National Bureau of Statistics and China National Tourism administration). Big data analysis provides the opportunity to solve the serious problem of the lack of basic data regarding tourism activities. In China, there is abundant information on tourist activities scattered throughout the network, such as on Qunar.co, Ctrip.com and Tuniu.com. This information includes some aspects of tourist consumption in Shanghai. First, we use Python to grab the tourists’ consumption data from the websites, providing 511 tourism records. These 511 records are mostly related to the consumption of soft drinks and refined tea and tickets (such as for the nature reserve, zoo, wild animal zoo, theme parks, national parks, historical sites and art museums). Then, we match all sorts of these tourism spending with the sectors in the CIOT (compiled in part 3). After data processing, we summarize the information as Table 4 shows. Then we multiply the average consumption (Table 4, column 1) by the number of domestic tourists to calculate the amount of domestic tourism consumption for each item.
Correspondence between tourism consumption from the web and the sectors in CIOT.

CIOT: carbon input-output table.
These 511 records contain useful consumption characteristics about the tourists in Shanghai. To make full use of these records and verify the reliability of the average consumption of tourists, we use these 511 data to perform 1000 Monte Carlo simulations on soft drinks and refined tea and various ticket consumption data in order to discover the distribution of the simulated mean. The mean and 95% confidence intervals of tourism consumption after Monte Carlo simulation are shown in Table 5. The results show that after simulation, the mean converges. Therefore, the mean in Table 3 is taken as the average consumption of tourists for each item. Then, we multiply the mean of each item by the total amount of tourists. The consumption composition of items 9 and 12–15 in Table 3 is obtained. Other subgroup data are allocated using the proportion decomposition method, and the decomposition proportion is provided by the Shanghai Bureau of Statistics or peer experts. The tourism consumptions of the main group and subgroups are presented in Table 3.
The mean and 95% confidence interval of Monte Carlo simulation (unit: Yuan).

The big data technology in this article is a complement rather than an alternative source to collect tourist data. Here, we present a putative approach to tourism analysis. If China’s ‘Tourism Internet +’ develops rapidly in the future, this method will be better utilized.
Direct gross value added of tourism
The tourism direct gross value added (TDGVA) adds the part of the gross value added generated by all industries in the economy that serve visitors in response to tourism consumption.
The 25 industries (30 products) in Table 3 produce goods and services to meet tourist consumption. The added values that they generate are called TDGVA.
Combined with the IO model, we have

where Internal tourism consumption (ITC) is the tourism consumption products (25 × 1). AC is the intermediate consumption rate matrix (25 × 25) and the diagonalized matrix for the 25 industries that produce the consumption products. The results of the TDGVA is 160.68 billion Yuan. This value was generated by tourism consumption and reflects the direct contribution of tourism to the national economy. The result is close to the official figure of 149.77 billion Yuan, which was calculated via the income approach.
The results of Shanghai tourism-related carbon emissions and analysis
Carbon balance analysis
Based on equation (7), we obtain the carbon emissions from the perspective of the production (emissions-P) of all 65 sectors as follows:
Based on equation (8), we obtain the carbon emissions from the perspective of the use (emissions-U) of all 65 sectors as follows:
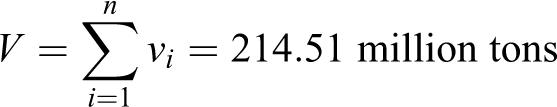
As per the above calculation, the carbon emissions-P and carbon emissions-U of all sectors are both 214.51 million tons, which reflects the carbon balance between production and use. Moreover, this finding indicates that the 2012 CIOT of Shanghai is robust and can be used to calculate and analyse carbon emissions.
Direct carbon emissions of tourism activities
According to the definition of the direct CO2 of tourism activities, only the CO2 emissions caused by the combustion of fossil fuels are counted. As presented in Table 3 and elaborated on part 2, none of the consumption of tourism activities directly involve fossil fuels. Therefore, we conclude that the direct carbon emissions related to tourism consumption in Shanghai in 2012 are zero.
Total carbon emissions of tourism activities
Though there are no direct CO2 emissions from tourism consumption, there are indirect CO2 emissions. We use the tourism consumption products ITC as the exogenous variable and use the following equation to calculate the total CO2 emissions.

where tourism carbon emissions (TCE) is the column vector (65 × 1) and
The total CO2 emissions caused by tourism consumption in Shanghai in 2012 are 43.88 million tons.
Analysis of Shanghai tourism-related carbon emissions
1. Ratio of tourism emissions to carbon emissions for all sectors in 2012
Given the preceding discussion, the proportion of the tourism-related carbon footprint to the total Shanghai CO2 emissions in 2012 is calculated as follows.

The result shows that tourism emissions make up a relatively high proportion (20.45%) of all CO2 emissions.
Combined with the result of integrated total carbon emissions, we find that tourism accounted for the second highest level of CO2 emissions among all sectors (Table 6) when treating tourism as an integrated sector. Given the conditions of China’s technological and production management levels as well as people’s lifestyles and travel habits, tourism is a high carbon emissions sector.
The top six integrated total carbon emissions sectors of Shanghai.

2. A comparative analysis of CO2 emissions per GDP and CO2 emissions per TDGVA
The relationships of CO2 emissions to added value from tourism and overall CO2 emissions are analysed, and the results are presented in Table 7.
Comparative analysis of tourism-related CO2 emissions.

GDP: Gross Domestic Product; TDGVA: tourism consumption and tourism direct gross value added.
First, the CO2 emissions per GDP unit (carbon intensity) are 0.11 kg per GDP unit, and the tourism CO2 emissions of per TDGVA unit (tourism consumption carbon intensity) are 0.27 kg per TDGVA unit. The latter is more than twice as high as the former. Thus, tourism carbon intensity is greater than the average of all sectors.
Second, TDGVA as a percentage of GDP is 7.97%. However, CO2 emissions account for 20.45%. Lower GDP accounted for higher CO2 emissions. Thus, regardless of the tourism-related carbon footprint and the tourism consumption carbon intensity, tourism does not constitute a low-carbon sector compared with the average levels of other sectors. 3. A comparative analysis of CO2 emissions for tourism-related industry
As displayed in Figure 1, air transportation was the largest component of tourism-related CO2 emissions at 22%, followed by accommodations (11%), apparel (10%), catering (10%) and business services (7%). To supply the tourism consumption, these sectors produced large amounts of CO2, and without tourism, these carbon emissions would not exist. Therefore, to reduce the carbon footprint of tourism, we may try to adjust the structure of consumer spending on these sectors or improve the sectors’ carbon intensities, especially by reducing the consumption of air transportation.

The ratio of total carbon emissions by tourism sectors in 2012.
We compare these results with the tourism carbon emissions for world tourism in 2005 (UNWTO-UNEP-WMO, 2007). Transportation generates the largest proportion of CO2 emissions (75%) from global tourism, with approximately 40% of the total being caused by air transportation alone. Accommodations are the second largest factor (20%) and are substantially lower than transportation emissions. Shanghai’s tourism carbon emissions ratio is similar to world level, but transportation and accommodations account for a smaller portion of the total carbon emissions. For China, Meng et al. (2016) estimated that in 2012, the highest three contributors to tourism-related carbon emissions in Chengdu were transportation (42.5%), accommodations and restaurants (19.2%) and shopping (14.82%).
Conclusion and discussion
The central principle of this article is that we show a broader assessment of tourism from the perspective of the environment impacts of the tourism sector. The environmental performance of the tourism sector was generally poor, including being the second largest CO2 emissions contributing sector in Shanghai. From the perspective of CO2 emissions per added value, the tourism industry is far higher than the average levels of all industries. Tourism has created 7.97% added value in the national economy, but it produced 20.45% of the CO2 emissions. These results challenge the idea that China’ tourism is ‘clean and green’ and a ‘low-carbon sector’. Studies that emphasize tourism-related carbon emissions for other regions have reported similar results, including Dwyer et al. (2010) for Australia, Sun (2016) for Taiwan, Patterson et al. (2004) for New Zealand and Yuan (2013) and Zhong et al. (2014) for China. Therefore, the vigorous development of tourism while ignoring tourism-related CO2 emissions will lead to more carbon emissions overall.
To improve integral competitive strength for tourism destination, the efforts of a large and diverse number of tourism stakeholders must be combined (Dwyer et al., 2003a). Reductions in the tourism-related carbon emissions require joint efforts of government, production sectors and individual citizens. The government has played an important role in promoting tourism growth (Dwyer et al., 2003b). It is well within the realm of government policy attempts to guide tourism consumption and production activity towards low-carbon paths. The direct combustion of fossil fuels by tourism activities is low, but the production firms that provide inputs to tourism industry produce considerable CO2 indirectly. As an empirical research in this article shows, the electricity and gas supply sector has an ITCEC of 71.0 tons/thousand Yuan. Tourism consumes substantial electricity indirectly, which generate a portion of CO2 emissions. In addition, significant differences in tourism carbon intensity (carbon emission /tourism added value of sector) lead to differing impacts, as this article shows: air transport 148 tons CO2 per thousand Yuan, rail transport 12.5 tons per thousand Yuan, road transport 57.9 tons per thousand Yuan, water transport 144.6 tons per thousand Yuan. Therefore, in terms of tourism-related production, the government should (a) restrain enterprises (especially those related to tourism) for high energy consumption and high pollution; (b) use tax credits/deductions and mutual aid funds to help production enterprises save energy and reduce emissions; and (c) construct the premium system to promote use of renewable energy, such as wind and photovoltaic energy (Cadarso et al., 2016). In terms of the end use of tourists, the government should (a) enhance the implement of the Program of Environmental Protection Education and guide tourists to choose ‘low-carbon tourism consumption’ and (b) engage all stakeholders including local communities, staff and tourists and ensure the benefits of low-carbon growth are distributed to all. Last but least, the government should improve measurement of tourism and the subsequent tourism-related CO2 for better management at global and local level.
However, there are many limitations in this article. For example, we neglect to calculate the direct CO2 emissions for tourists’ burning charcoal for barbecues and fuel purchases for self-driving tours. In addition, the application of big data is not perfect for only 511 records. These are the areas that need to be improved in the future.
Footnotes
Acknowledgement
Accounting department of Shanghai Bureau of Statistics is gratefully acknowledged.
Declaration of conflicting interests
The authors declared no potential conflicts of interest with respect to the research, authorship, and/or publication of this article.
Funding
The authors disclosed receipt of the following financial support for the research, authorship, and/or publication of this article: This work was supported by Graduate Innovation Fund of Shanghai University of Finance and Economics in 2016[CXJJ-2016-422].