



Abstract
Since entering the Chinese market in 2015, Airbnb has become a major player in the Chinese home-sharing arena. This article uses data from 8012 active Airbnb listings in Shanghai and presents three models (linear regression, geographically weighted regression, and random forest) to study the determinants of Airbnb listing prices and incorporate geographic variation in price modeling. Results show that property quality plays a key role in shaping listing prices. Due to Airbnb’s distinctions from traditional lodging in both features and business models, Airbnb pricing determinants differ accordingly. For example, location conditions were found to have a limited impact in regions with established transportation networks. Among the three models, random forest performed best in terms of prediction accuracy. Lastly, practical implications are discussed.
Introduction
The concept of the sharing economy was first proposed by Felson and Spaeth (1978). They described a “collaborative consumption” lifestyle in which individuals directly trade goods and services (peer to peer) on third-party market platforms. One of the most successful examples of this model is Airbnb; the site has become the world’s largest sharing accommodation firm since launching in 2008, with a market valuation exceeding $30 billion in 2019. Airbnb has provided more than seven million unique accommodations and 50,000 planned experiences created by local hosts across 220 countries and territories in 62 languages by 2019. The company has thus become one of the world’s largest booking platforms for specialty accommodations and travel experiences.
Since Airbnb entered China in 2015, the country has grown into a key market of this home-sharing giant. In the past 5 years, Airbnb has experienced a period of rapid development and reform. In 2019, Airbnb generated $3.6 billion in host income and guest spending in mainland China, an increase of 61% over 2018. China’s home-sharing market is part taken by three major players: Tujia, Xiaozhu, and Airbnb. Among these three, Tujia controls nearly half of China’s home-sharing market, followed by Alibaba-backed competitor Xiaozhu. Despite this, Airbnb remains optimistic with China, stating that it hopes that China will become its largest market. It expects revenue from its Chinese division to increase and will account for 4–5% of the company’s total revenue. However, because China’s Airbnb platform is still in its infancy, only a few studies discuss the Chinese market. Among these, Amaro et al. (2019) examine millennials’ determinants of intentions to book on Airbnb based on online surveys targeting millennials from China. Liang et al. (2017) use information about Airbnb accommodations in Hong Kong to observe how the “Superhost” badge affects the number of reviews and ratings of accommodations.
Price holds a significant place in the accommodation industry, as it is an essential lever by which P2P hosting can ensure profitability (Tang et al., 2019). Compared with traditional hotels, the investment in sharing spare rooms/spaces on the Airbnb platform is very low and flexible. In the sharing economy, low price is not necessarily equated with poor quality; on the contrary, it conveys a “Collaborative lifestyle” that combines the benefits of right of use with reduced personal expenses and lower environmental impact. As many studies have found, the cost-saving feature of Airbnb is a key factor in attracting certain users (e.g., young travelers, budget travelers, and families) to choose this alternative accommodation service (Guttentag, 2015; Lin et al., 2019; Tussyadiah, 2016; Zervas et al., 2017).
Scholars have investigated numerous factors influencing the price of short-term rental housing. Although Airbnb has released a pricing strategy function called “Smart Pricing,” most hosts still prefer to set their prices independently. Airbnb hosts can identify the price determinants that persuade guests’ readiness to pay, and then determine the room price based on the guest’s insights and expectations, so as to develop better practices (Chattopadhyay and Mitra, 2019). Spatial heterogeneity also plays a vital role in explaining the pricing patterns of Airbnb rentals within a city; for example, a price determinant in one location may not matter in another (Zhang et al., 2011).
The present study compares the performance of the applied three models that identify Airbnb price determinants in Shanghai, China, and their estimated results. We focus on spatial heterogeneity because Airbnb rentals in different geo-locations may involve diverse pricing determinants (Zhang et al., 2017). We found that individual heterogeneity is more prominent in the shared accommodation industry, and traditional spatial analysis methods like geographically weighted regression (GWR), which are frequently used in the traditional lodging industry, show poor performance. Now that traditional models face many challenges in solving such problems, in our applied three models we adopt an emerging machine learning algorithm (RF). By comparing and synthesizing three models with their own advantages (linear regression, geographically weighted regression, and random forest), we promote a better understanding of the methodological aspect of pricing analysis in tourism and hospitality management. Lastly, our findings offer practical implications and recommend best practices related to pricing strategies and online marketing.
Literature review
Sharing economy and accommodations
The sharing economy is also referred to as cooperative or collaborative consumption. The sharing economy boom could be attributed to several factors. First, technological innovations (e.g., digital currencies and blockchains) have made decentralized consumption easier to coordinate. Second, high debt levels and growing dissatisfaction with the neo-liberal economic paradigm are driving people toward other forms of consumerism. Third, information technology has undermined the traditional economic model by altering the traditional relationship between price and production. Whiteman (2014) argued that this move toward a “collaborative common” reflects a paradigm shift away from conventional forms of market capitalism.
Sharing accommodation platforms have developed rapidly in recent years, exemplifying a common business model in the sharing economy. Compared with traditional accommodations, shared accommodations are distinct in three ways. First, diverse listings can meet various accommodation needs. Unlike traditional hotels that provide relatively standardized floor plans and décor, shared accommodations can be tailored to suit users’ demands by providing a high degree of diversification (Zekan et al., 2019).
Second, consumers’ desire for a strong sense of social connection and novel travel experiences have led sharing accommodation platforms to be particularly popular among younger generations. Users can post travel guides and share their experiences via these platforms in addition to cultivating friendships when staying with hosts or other tenants. Airbnb also functions as an “experience-based” business in offering destination activities and local cultural experiences. Overall, the platform’s accommodation culture no longer conveys a standardized process but instead offers unique tourism experiences featuring authenticity and immersion.
Lastly, P2P accommodation platforms target user groups distinct from the traditional lodging industry. A two-sided market typically connects the supply and demand sides of hospitality (Zervas et al., 2017): suppliers offer idle space as short-term rentals to earn additional income, while users (i.e. those on the demand side) simply require short-term use rights of housing for accommodation purposes. Different from consumer groups in traditional hotels, users of online short-term rental platforms generally fall into the holiday rental market, whereas traditional hotel patrons book stays for business and vacations. Users of sharing accommodation platforms also tend to be younger and more receptive to the “sharing” concept in general, hence their willingness to participate in the sharing economy.
Determinants of sharing accommodation prices
Price is a crucial factor in hotel operations and represents enterprises’ competitive foundation (Guttentag, 2015; Vives et al., 2019; Zhang et al., 2017). Since the 1990s, many researchers have studied pricing strategies within the traditional hotel industry and identified a series of decisive pricing features: location characteristics, quality indicators, hotel facilities and services, and environmental factors (Lee, 2011; Zhang et al., 2011).
Review of the literature on Airbnb price determinants.

Property-specific factors
The type and size of the accommodation are typical listing price interpretation characteristics, including for online homestay short-term rentals. In terms of type, Airbnb defines three property classifications: entire home/apartment, private room, and shared room. As highlighted by relevant studies, property type has a significant effect on prices (Ert et al., 2016). For example, a study of Canadian Airbnb listings shows that the price of an entire apartment is 44.2% higher than that of a private room (Gibbs et al., 2018). In addition, the price is directly proportional to the size of the accommodation, as the host charges a higher price for the larger accommodation (Ert et al., 2016).
Amenities and services
In the area of hospitality and tourism, sharing rental platforms have shown the increasing trend of novelty seeking and collaborative consumption based on travel experience items (Guttentag, 2015). Unlike standard facilities in traditional hotels, Airbnb listings are related to the idle assets of non-professional hosts. Tourists and guests are becoming more and more interested in specific amenities items offered by them (Abrate and Viglia, 2019). This experience stimulates guests’ hedonic value or “utilitarian value” (Miao et al., 2014). Offerings of amenities and services like mini-bar, parking, breakfast, express checkout, safes, advance booking, gym, and hair dryers highly influence higher room price (Lee and Jang, 2012; Masiero et al., 2015; Schamel, 2012; Thrane, 2007). Airbnb customers like some of these amenities as they feel the “ambience of private accommodation” (Stors and Kagermeier, 2015).
Location-specific factors
Location is paramount to the success of hospitality businesses (Basu and Thibodeau, 1998), which has been demonstrated to influence the room price in hospitality literature (Lee and Jang, 2012; Schamel, 2012; Zhang et al., 2011). However, Wang and Nicolau (2017) reported that the role of location as a price determinant has not been determined in Airbnb. Airbnb listings are more widely distributed than hotels. Because of the importance of neighborhood infrastructure and facilities, we should consider all aspects of housing accessibility. Past empirical results show that Airbnb’s listings are geographically clustered around tourist attractions (Xu et al., 2020). Benítez-Aurioles (2017) agreed that the distance from tourist attractions is an important factor affecting Airbnb listings. This is the same result as the hotel research. Researchers also suggest that the distance to the city center represents a major location factor (Gutiérrez et al., 2017; Wegmann and Jiao, 2017). However, Hill (2015) thought that determining the location element by a simple distance from the city center would mask the heterogeneity of neighborhoods and neighborhood amenities. The accessibility to transportation services (e.g., main road, subway, airport, train station) has been mentioned by many researchers in relevant studies on hotels (Adamiak et al., 2019; Yang et al., 2014; Zhang et al., 2017). Also, Wegmann and Jiao (2017) found that Airbnb listings are more concentrated in areas closer to the major traffic line based on data from five cities of the US.
As can be seen from above, researchers have identified some location factors that may affect shared accommodation. However, there are still some being ignored. First, according to reports from Xu et al. (2020), in the accommodation sharing business of Airbnb in 2017, 42% of guest consumption is in the neighborhood where travelers live. This shows how important the catering, retail and other commercial facilities are near the shared accommodation. Second, most of the studies involving location factors have only tentatively demonstrated a positive or negative correlation between accessibility and price, with only Önder et al. (2018) further quantifying the premium effects arising from different distance radius and threshold distances. Third, the choice of model has a significant impact on location factors with spatial dependence, and traditional econometric models are likely to produce misleading results on spatial price autocorrelation (Gyódi and Nawaro, 2021), with very few studies exploring the issue under spatial econometric and machine learning frameworks (Sainaghi, 2021). We should do further research about location-specific factors based on the characteristics of shared accommodation.
Host features
With respect to service quality and value creation, the host’s interpersonal communication is an essential dimension of the guest experience (Jiang et al., 2019; Karlsson and Dolnicar, 2016). Host–guest engagement is therefore a critical element of Airbnb’s competitive differentiation (Jiang et al., 2019). Host characteristics vary widely, such as in a host’s accountability in handling a tenant’s claims before and during their stay (Johnson and Neuhofer, 2017). These characteristics, despite being covert aspects of the consumption process, can greatly affect a tenant’s experience. Airbnb grants “Superhost” status to experienced hosts who provide a sterling example for other hosts and extraordinary experiences for their guests; the site posts a badge automatically on Superhosts’ listings and profile for simple user identification. Deboosere et al. (2019) found that in New York City the “Superhost” status allows the host to charge a small premium and leads to an increase in monthly income. This difference means that Superhosts conduct more bookings per month than other hosts. The significant influence of the Superhost’s identity supports similar findings by Wang and Nicolau (2017).
Rental rules
Rental rules also differ by host. Hosts can list numerous rental rules on Airbnb, such as the capacity of their accommodation listing, cancellation policy, and whether the tenant should provide a brief introduction when booking. The optional instant booking feature allows Airbnb guests to get their booking requests immediately confirmed without a manual approval from the host. Similar to Superhost status, instant booking is popular among high-volume listings, which is attractive to prospective guests and able to generate a higher demand than those without this feature (Deboosere et al., 2019).
Some rental rules have been found to elicit discrimination concerns (e.g., on the basis of gender, race, age, religion, or nationality) in recent years (Edelman et al., 2017). Airbnb has thus introduced new policies to promote inclusion and hosts’ respect for customers, such as allowing hosts to ask for guests’ photos only after accepting a booking request.
Site attributes
The service system in the traditional hotel industry is relatively mature, leading tourists to be generally unconcerned about non-economic factors apart from price and service. Airbnb is again unique from traditional hotels in this respect, as it is a trust-based platform. The site’s social functions are the core reasons why some tourists choose to stay with Airbnb. These social service functions are mainly realized through the Web site’s information disclosure mechanism. Site attributes are therefore another common consideration among users.
Two types of disclosure are prevalent on Airbnb: the host’s active disclosure and passive disclosure. Active disclosure refers to hosts providing listing photos and personal information. Passive disclosure mainly involves previous guests’ evaluations of the host and property, measured by the scoring mechanism and average annual number of reviews.
Situation factors
The relevant literature has long focused on the relationship between the surrounding environment and Airbnb, especially the effects of external conditions, otherwise known as situation factors. As an emerging P2P platform providing accommodations, Airbnb is inevitably affected by local housing prices. Airbnb’s growing popularity and expansion have also come to threaten local housing markets and the tourism industry as a whole (Gutiérrez et al., 2017; Ioannides et al., 2019; Vinogradov et al., 2020). Scholars have explored the effects of a city’s economic and social conditions on Airbnb (e.g., employment, education, income, crime, reputation, and race distribution) (Zhang and Chen, 2019). However, race distribution and education might not be big fluctuating factors in Shanghai because China’s population is not as diverse.
Research methods
Research involving Airbnb can be roughly divided into qualitative and quantitative approaches. Qualitative methods in this context focus on the perceptual aspects of Airbnb, which can be challenging to operationalize using data (e.g., how local residents perceive the influx of strangers caused by Airbnb). Most scholars have used questionnaires and interviews to draw conclusions based on respondents’ similarities and differences (Moghavvemi et al., 2017).
Regarding quantitative methods, regression-based hedonic pricing models have been used for evaluating the willingness to pay for specific characteristics in traditional tourism and hospitality studies (Monty and Skidmore, 2003). These technologies have recently begun to be applied to short-term rents, mainly to determine the factors that predict higher prices (Deboosere et al., 2019). However, without accounting for spatial bias, regression-based associations of factors may be misleading. Methods such as quantile and spatial regression have begun to appear more often in studies due to the skewed nature of hotel prices and spatial dependence in price equations (Hung et al., 2010; Lorde et al., 2019). In addition, due to the complexity of the relationship between determinants and room price, listing variables may have a nonlinear effect on room prices in the dynamic rental market (Espinet et al., 2003). Therefore, non-parametric models are more suitable when dealing with non-linearity or multi-collinearity hidden in the dataset. Although rarely used in the field of hotel pricing, machine learning-based non-parametric data-mining models (like RF and CTree) show a broad application prospect (Janitza et al., 2016).
In summary, although there is a growing literature on the factors influencing Airbnb pricing, key research gaps can be identified. The most important contributions of our study can be summarized in three points. First, most previous studies typically used global regression models (e.g., OLS) to estimate hedonic price equations, masking the spatial dependence of the influencing factors and producing misleading results, especially in the presence of location variables. The GWR model can identify the spatial heterogeneity of the influencing effects. At the same time, we are motivated to address another underresearched issue from the previous literature using an advanced version of the GWR model. The high level of information redundancy generated by Airbnb based on the geographical proximity and overlap of available housing affects the proper functioning of the GWR model. Non-parametric models (especially machine learning algorithms) are more accurate when faced with such datasets involving complex non-linearity and hidden multi-collinearity. This study compared the performance and estimation results of three models for determining the impact of listing prices, identifying the relative importance of various influencing factors. Second, the relationship between price and its determinants undoubtedly varies across regions due to differences in city type, socio-economic level, and regional Airbnb development. In addition to traditional variables such as size, reputation, Web site information, and rental rules, this study incorporated a range of location-specific factors (e.g., proximity to landmarks, transport stops, competitor locations, and shopping malls). We analyzed the premium capacity generated by different thresholds of variables under each price range, rather than just estimating the positive or negative impact of influencing factors on prices, which further explores and extends the theory of shared accommodation pricing by revealing the characteristic of Airbnb’s price elasticity of demand under its own market segmentation. On the practical side, price anchoring with knowledge of differentiated consumer preferences and willingness to pay can help Airbnb operators maximize the value of their listings' attributes. City managers and planners can tailor image promotion and resource allocation to the competitive advantages of the lodging industry in different areas. Third, most of the case sites selected for previous studies were cities in North America or Europe. As one of Airbnb’s largest source markets, the Chinese market may demonstrate some different characteristics from their western counterparts, and our study helps improve the understanding of Airbnb’s complex pricing mechanisms in a typical Asian city.
Study area and data
Study area
As one of four municipalities in China, Shanghai is the most populous urban area and the most developed city in the country. It is also the core city of the megacity region of the Yangtze River Delta and is a global hub for finance, innovation, and transportation. The Port of Shanghai is the world’s busiest container port.
Since Airbnb entered the Chinese market in 2015, it has actively pursued innovation in many areas. Shanghai’s unique advantages have enabled Airbnb to test and implement many new policies and ideas in the city. On 26 October 2016, Airbnb and the World Expo Management Bureau of the China (Shanghai) Pilot Free Trade Zone signed a strategic cooperation memorandum to jointly explore the sharing economy model. Shanghai became one of the first 13 cities in the world to launch “Airbnb Plus” in 2018.
Data acquisition and pre-processing
We obtained listing data and related information from AirDNA for Shanghai before September 2019 and after data pre-processing and cleaning the final dataset of 8012 valid listings was created. Listing data contained information on properties’ latitude and longitude, listing prices, room facilities, hosts, photos, reviews, ratings, and rental rules. To ensure comparability between our final model results, we divided listings into a training set (63% of the original sample) and a test set (37% of the sample) according to the sampling principle (Čeh et al., 2018). The construction, operation, and interpretation of our research model were determined based on the training set. A comparative analysis of model performance was conducted using the test set.
Variable selection
Descriptions and explanations of model variables.

Research methods
Traditional linear regression analyzes the statistical association between a dependent variable and multiple independent variables; however, this method only estimates the global average of parameters and ignores the non-stationarity of space. Comparatively, GWR extends multiple regression by including observations of neighboring samples as a local parameter regression so variables are related to changes in spatial location. Model parameter estimation and statistical test results are therefore more significant than in linear regression. Geographic information systems (GIS)-based geospatial visualization facilitates further exploration of spatial characteristics and provides a basis for geographic modeling (Rodrigues et al., 2014). In this study, using the ArcGIS 10.4 platform, we conducted the spatial autocorrelation analysis. There are two main local weighting schemes in the GWR model: Bi-square and Gaussian. The Bi-square function assigns a weight of 0 to any feature outside the neighborhood specified. In the Gaussian function, all features will receive weights, but weights become exponentially smaller the farther away they are from the target feature. The Gaussian function is consistent with the associative character of spatial data in the Tobler’s First Law of Geography, which states that everything is related to everything else, but nearer things are more related to each other. We, therefore, employed the Gaussian function to determine parameter weights and referred to the Akaike information criterion with correction (AICc) to determine the optimal bandwidth. Furthermore, we ran a Monte Carlo test in MGWR 2.1 to obtain local parameter estimates for a given distribution. We then randomly redistributed the sample points multiple times to measure the variability in the parameter surface that occurred by chance. By doing so, we could test whether variability in local estimates was due to sampling change or other internal processes.
Considering GWR’s sensitivity to data anomalies and its inability to handle dummy variables, we also used a random forest (RF) algorithm. RF is a novel and highly flexible machine learning algorithm. It is particularly popular in research thanks to its high accuracy, good tolerance for the number and dimensions of samples, assessable feature importance, and insensitivity to default values. The base learner for the RF regression algorithm is the regression tree. After the number of trees in the forest is determined at error minimum, each tree grows non-pruned based on a separate training sample from the original training data, and each node in the tree performs a binary judgment on the selected predictor variable so as to minimize the squared residuals as they flow down the two branches. The terminal node contains a number of samples less than or equal to the specified maximum number of samples. To avoid the high correlation of trees in the forest, the original selection of the best split predictor at each node in the tree is replaced by selecting only among m random predictors, thus selecting a subspace in the initial n-dimensional space to make the split optimal. The regression problem is handled by default using m=n/3 in the R language random forest package (Čeh et al., 2018). RF does not require cross-validation, and predictors’ importance can be estimated by comparing growth in the mean square error after variables are replaced. Studies have shown that bagging can reduce variance in the final model and avoid overfitting compared to the basic model (Fang et al., 2011).
Empirical results
Linear regression
Linear regression results.
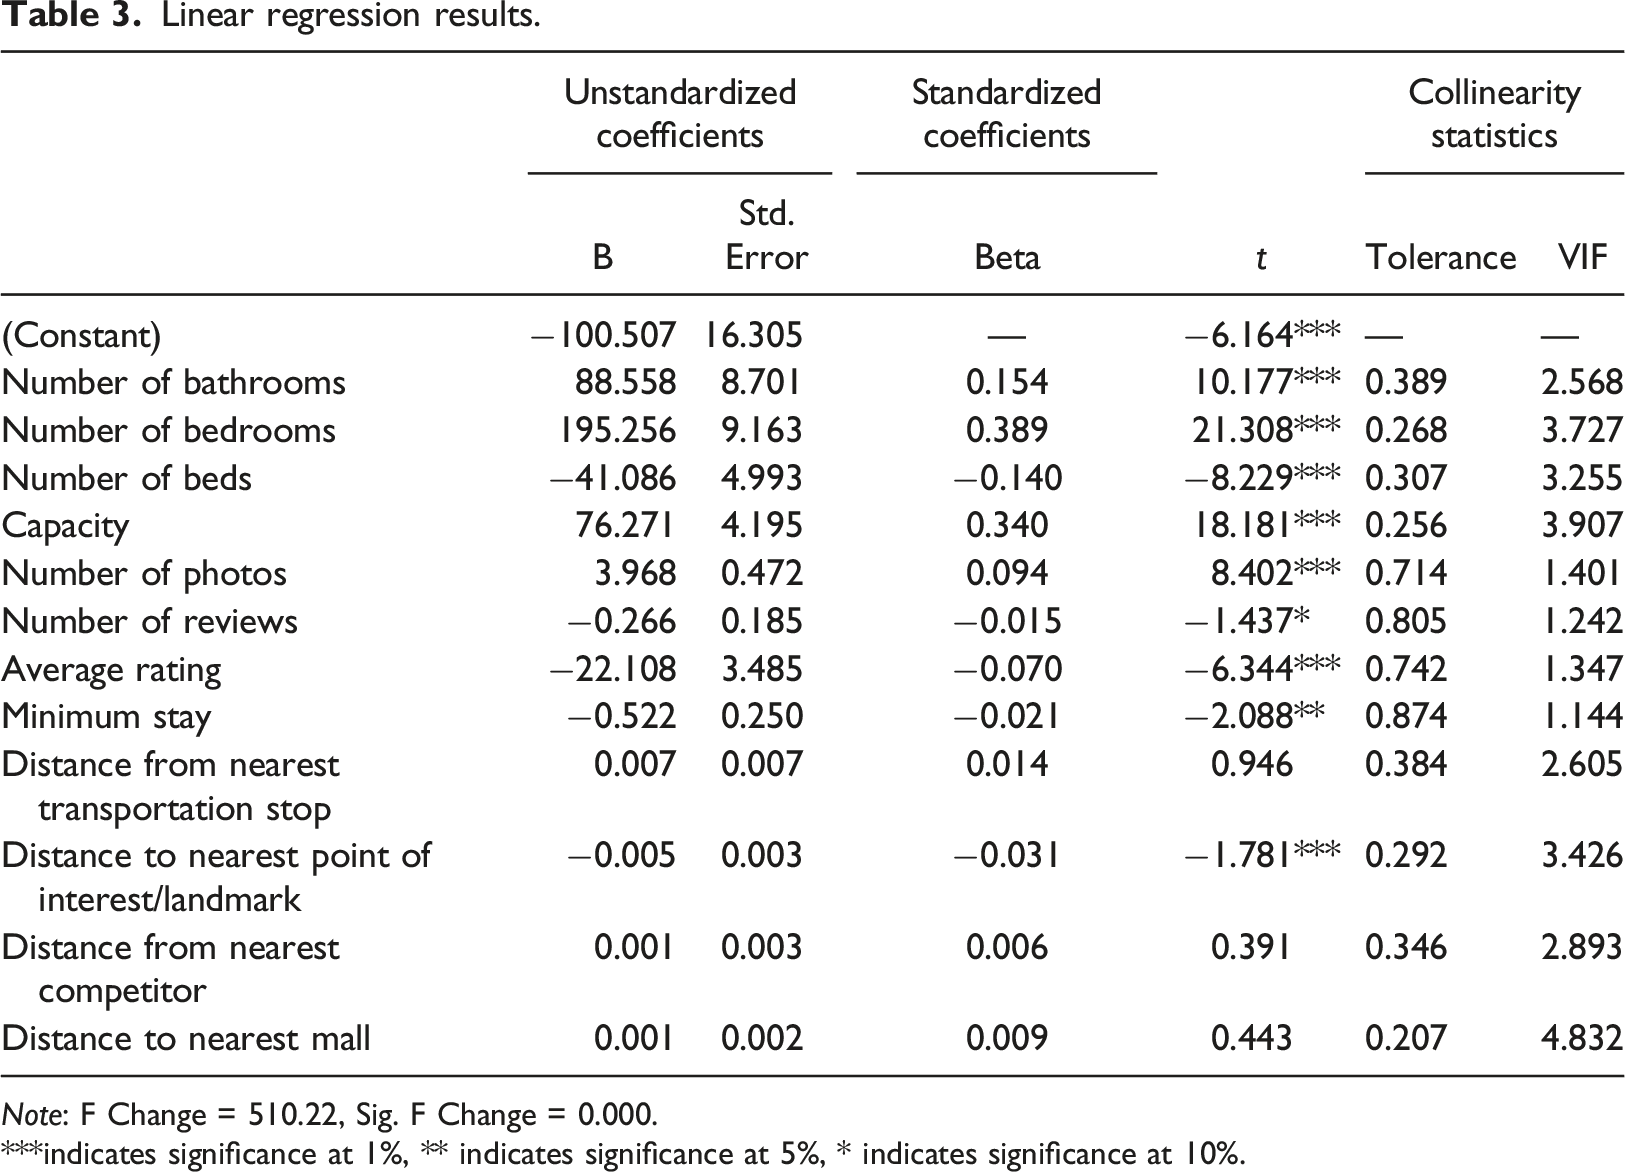
Note: F Change = 510.22, Sig. F Change = 0.000.
***indicates significance at 1%, ** indicates significance at 5%, * indicates significance at 10%.
The increase in bedrooms, bathrooms and capacity can increase the price significantly. A larger number of listing photos also had a positive effect on the listing price. The other indicators each demonstrated a significant negative correlation with listing prices, of which the number of beds was most sensitive. In general, linear regression implied that property attributes had the most significant effects on listing prices, followed by Web site attributes and rental rules. A series of distance variables tied to location conditions had the weakest influence. The results based on linear regression were similar to those of previous Airbnb studies in terms of the impact of listing features, reputation variables and geographical characteristics (Hong and Yoo, 2020).
Geographically weighted regression analysis
Spatial autocorrelation analysis
This study used Moran’s I statistic to perform global spatial autocorrelation analysis on Airbnb price data (Basu and Thibodeau, 1998). Moran’s I is in the range of [−1,1]. When the attribute value is significantly clustered in space, Moran’s I is significant and positive. When the attribute value is significantly different in space, Moran’s I value is negative. Global Moran’s Index shows the positive spatial autocorrelation of the housing price data in the study area.
Monte Carlo significance test
The Monte Carlo method was used to test model significance, and p-values were estimated for the regression coefficients of each variable. Among them, the p-values for the number of beds, number of photos, and average rating were greater than 10%, reflecting significant spatial instability.
Spatial differentiation of attributes on Airbnb property prices
Figure 1(a) highlights a significant positive correlation between listing attributes and listing prices, which is consistent with the findings of Gibbs et al. (2018) and Perez-Sanchez et al. (2018). However, the effect declined as a property’s distance from the city center increased. This phenomenon was most obvious for the number of bedrooms. The spatial pattern of the impact of the number of bathrooms on listing prices appeared similar to the number of bedrooms but was more sensitive for high-end listings. Compared to bedrooms, because one bathroom is suitable to meet most tenants’ daily needs, landlords with two or more bathrooms in their listing may target high-end consumers and group tenants. The number of bedrooms and the number of beds show a complementary effect. In areas where the number of bedrooms had a greater impact, the number of beds had a smaller impact. We thought this was a reflection of the two types of Airbnb space: entire apartment or shared room. Figures 1(e) and (f) indicate that the number of reviews and average listing rating were significantly and negatively associated with listing prices. The vast majority of the previous literature has found that the number of reviews is a demand signal rather than a quality signal (Benítez-Aurioles, 2018; Cai et al., 2019; Chica-Olmo et al., 2020). Low prices have been identified as the core value of Airbnb (Hong and Yoo, 2020). Cheaper listings have a wider audience and hosts attract more consumers by reducing prices, increasing rental opportunities and getting correspondingly more reviews. Besides, Airbnb listings are generally rated high (more than 90% of the listings have a rating ≥4.5) (Weber, 2014). Hosts have lower internal expectations for low-priced listings, so they are more likely to be satisfied after their stay, resulting in a higher rating. Rental rules are established at the host’s discretion, signaling the landlord’s authority and their consideration of a listing’s positioning. Figure 1(g) reveals a significant positive correlation between the number of occupants and listing prices, and the degree of influence appears to climb as the center spreads to the periphery. Previous studies done in the same area have typically considered occupancy numbers along with the number of bedrooms and listing type as significant positive pricing determinants (Boto-García et al., 2021; Chattopadhyay and Mitra, 2019; Lawani et al., 2019). Spatial distribution of regression coefficients of various factors in GWR model. (a) number of bedrooms, (b) number of beds, (c) number of bathrooms, (d) number of photos, (e) number of reviews, (f) average rating, (g) capacity, (h) minimum stay, (i) distance to the nearest POI/landmark, (j) distance from the nearest competitor, (k) distance from the nearest transportation stop, and (l) distance to the nearest mall.
While researchers have investigated the factors influencing Airbnb listing prices with an eye toward listings themselves and some geographical factors, there are still some location conditions ignored (Crecente et al., 2012; Yang et al., 2018). The widely used distance from the city center proved not optimal for studying the location premium (Gyódi and Nawaro, 2021). Therefore, we examined four related influential variables in this study.
The case study city has, to some extent, a touristic character especially considering the urban environment in the city center where many cultural and recreational destinations are located (e.g., the Oriental Pearl, the Bund and Disneyland). Figure 1(i) shows that a property’s distance from the nearest attraction/landmark exhibited a significant negative correlation with listing prices and was particularly sensitive in areas with dense attractions/landmarks, confirming the previous findings (Gibbs et al., 2018; Wang and Nicolau, 2017). The farther a property was from tourism resources, the more stable the impact on listing prices.
The traditional hotel industry is Airbnb’s fiercest competitor. Few scholars have previously studied the effect of hotels near Airbnb on their prices. Within a given area, hotels and Airbnb can seize the market based on their respective advantages, with price reduction the most direct and effective customer acquisition strategy. The competition between both sides of the Huangpu River in the central city is particularly intense. However, in areas where competitors are scattered (e.g., Songjiang University Town), the proximity of Airbnb and hotels can create an agglomeration advantage.
A property’s distance from the nearest transportation station and shopping mall was found to exert an inconsistent effect on listing prices. Scholars have not obtained consistent results on the impact of public transportation accessibility on Airbnb prices (Lawani et al., 2019; Voltes-Dorta and Sánchez-Medina, 2020). Based on the transportation conditions and development level of this case site, we believed one possible reason was that Shanghai was in the midst of establishing a comprehensive multilevel, multitype urban transportation system. Tourists can now reach their destinations via an array of convenient transportation modes, effectively weakening the impact of distance. Airbnb listings were more evenly distributed than hotels and many of them are outside the central locations in cities.
We conducted ArcGIS geostatistical analysis to generate a trend chart summarizing Shanghai’s Airbnb listing prices. Figure 2 illustrates a polycentric structure of listing prices in the east–west and north–south directions, reflecting the city’s “one main, two axes, four wings” urban spatial structure. The chart also depicts some of Shanghai’s gradually developing sub-centers, especially in the southeast. Airbnb listing price trends in Shanghai.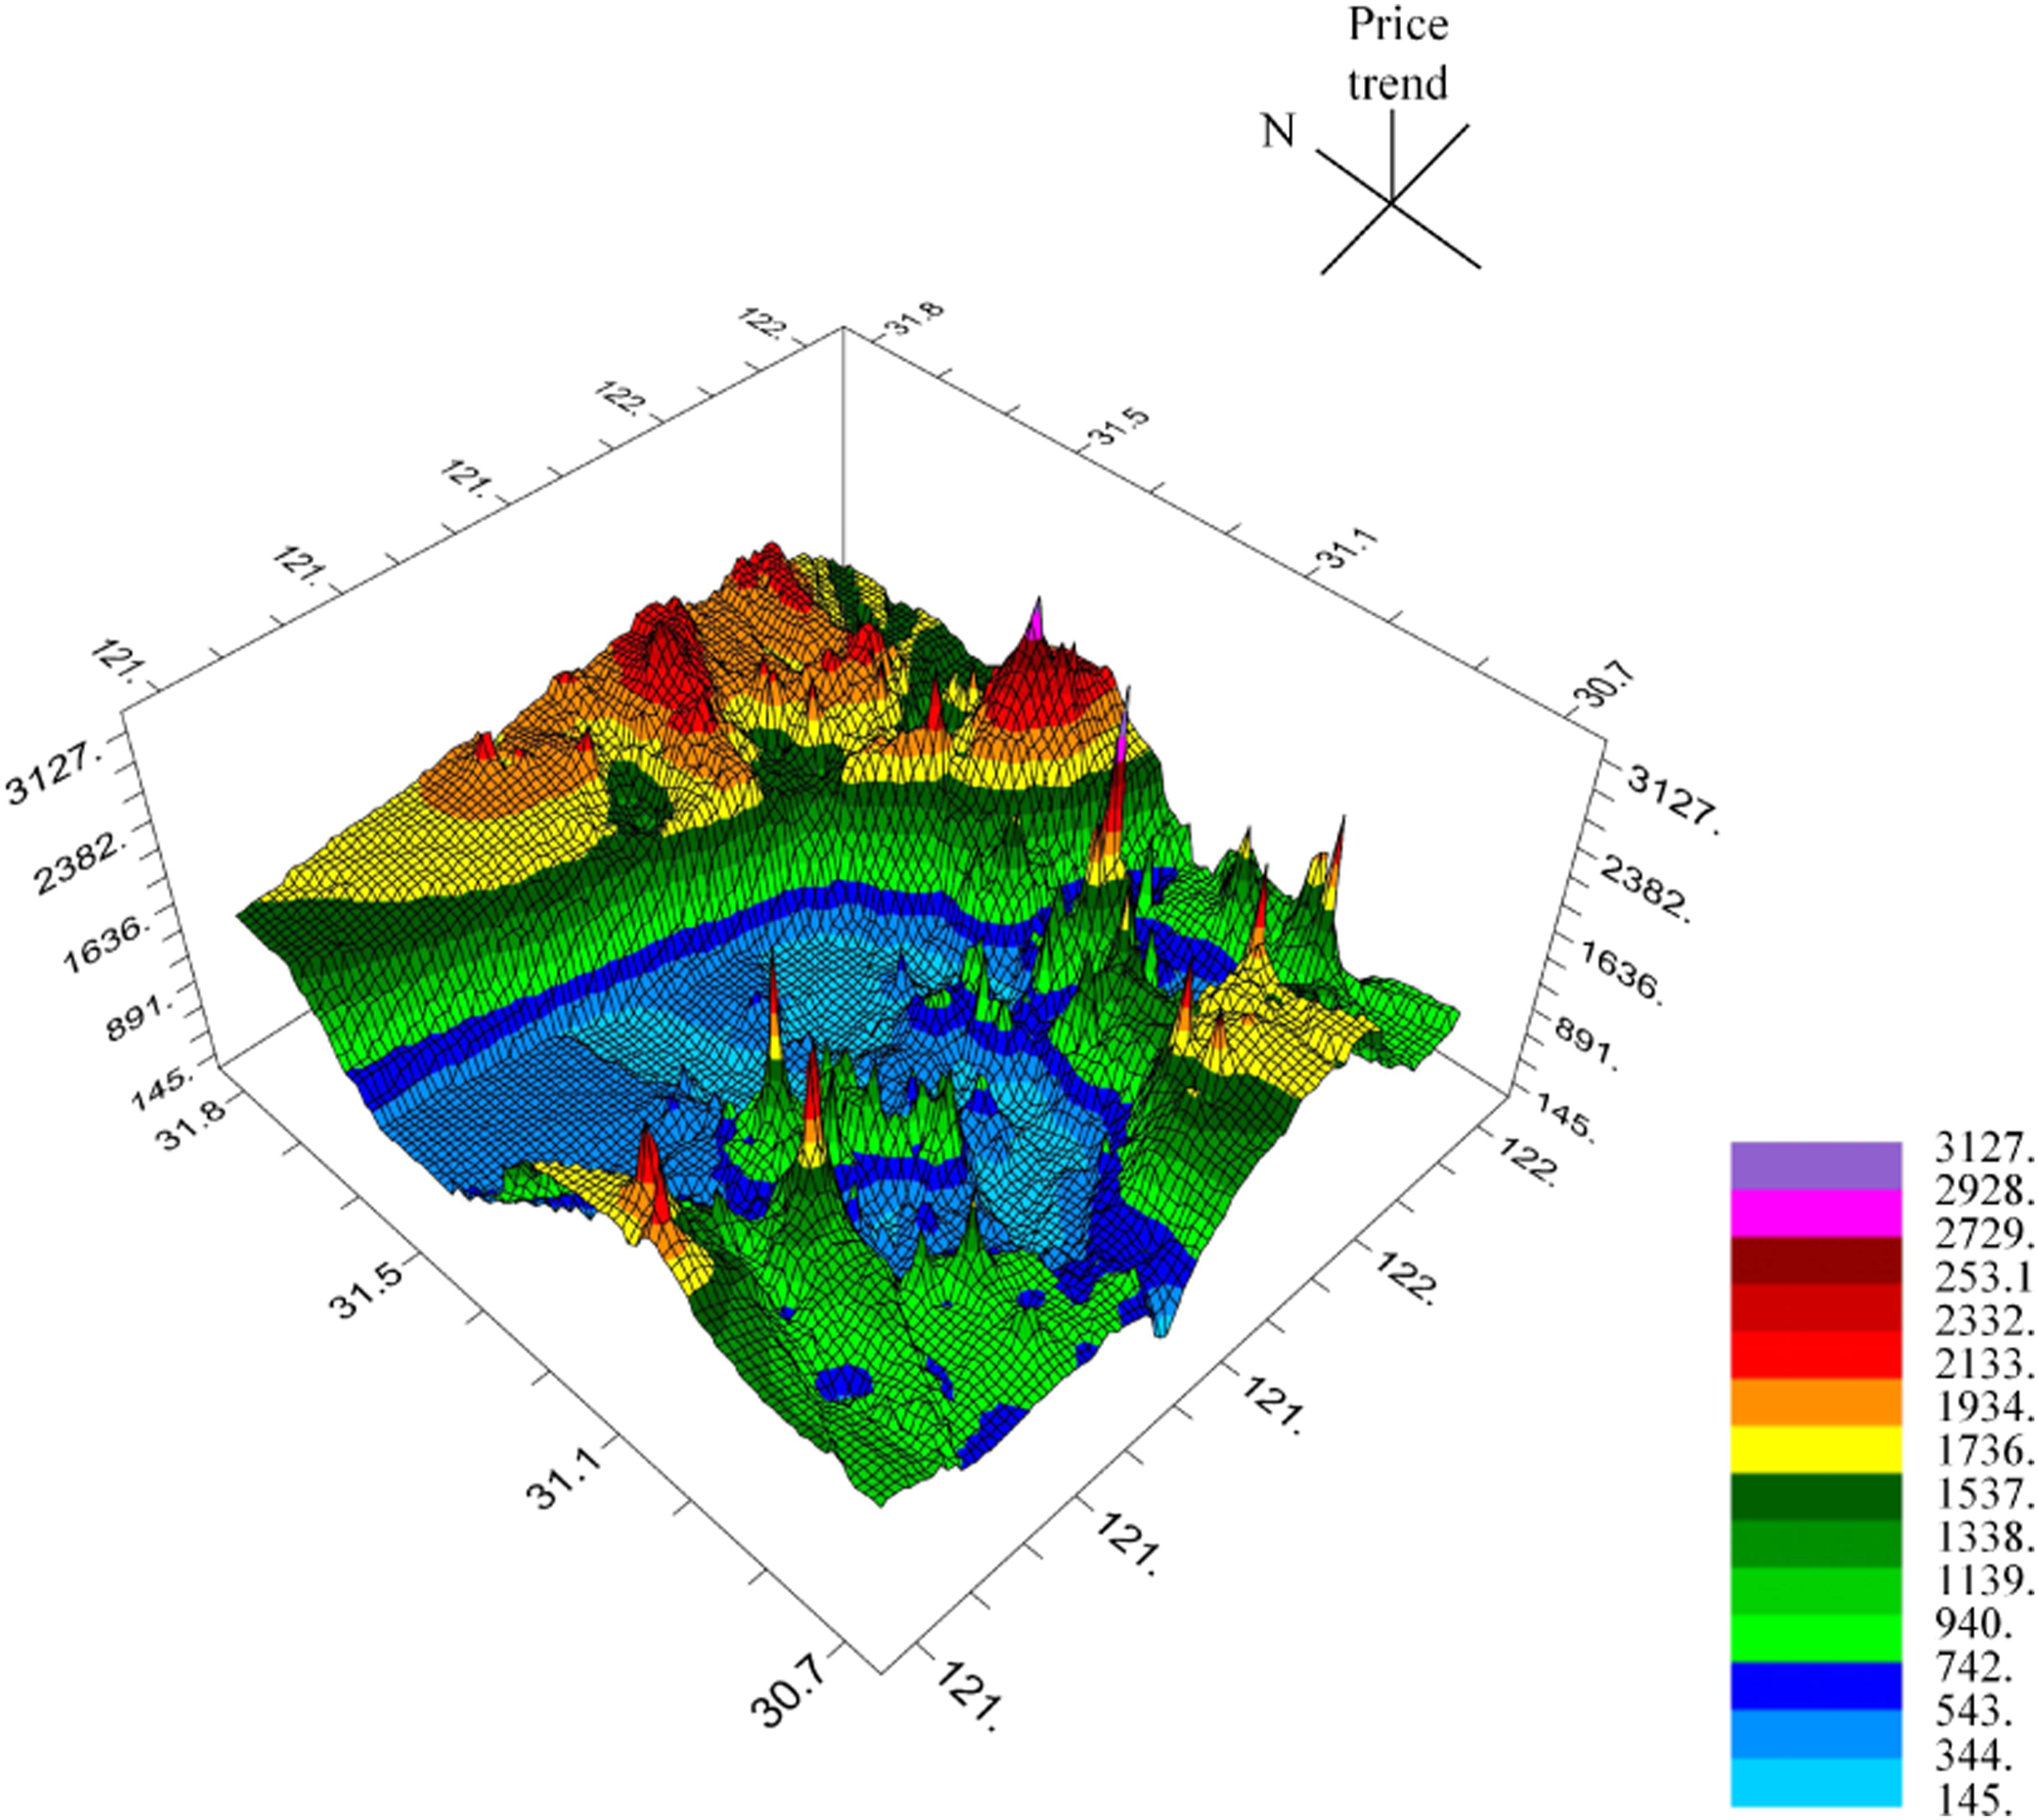
Random forest analysis
Note: %IncMSE measures the increase in the random forest prediction error after removing a variable; a larger value indicates greater importance of the variable. IncNodePurity measures the effect of a variable on the heterogeneity of observations at each node of the decision tree; a larger value indicates the variable is more important. We focused on %IncMSE.
By constructing an RF model, we obtained the fitted value of each listing price and used a scatter plot to describe the relationship between fitted listing prices and variables. Due to a large volume of data, points in the scatter plot were indistinguishable, and a smooth curve through the point cloud was fitted to visualize the premium capacity generated by different thresholds of variables at different price ranges (Figure 4). Based on the overall pulling power of the variables on house prices, we can classify the variables into three categories: high price-demand elasticity (steep and linear, e.g., variable A, C, G), medium price-demand elasticity (fluctuating, e.g., variable B, D, H, K), and low price-demand elasticity (smooth, e.g., variable E, F, I, J, L). Finally, we ranked variables in order of importance by comparing changes in %IncMSE after replacing the variables (Figure 3). Variable importance based on the RF model.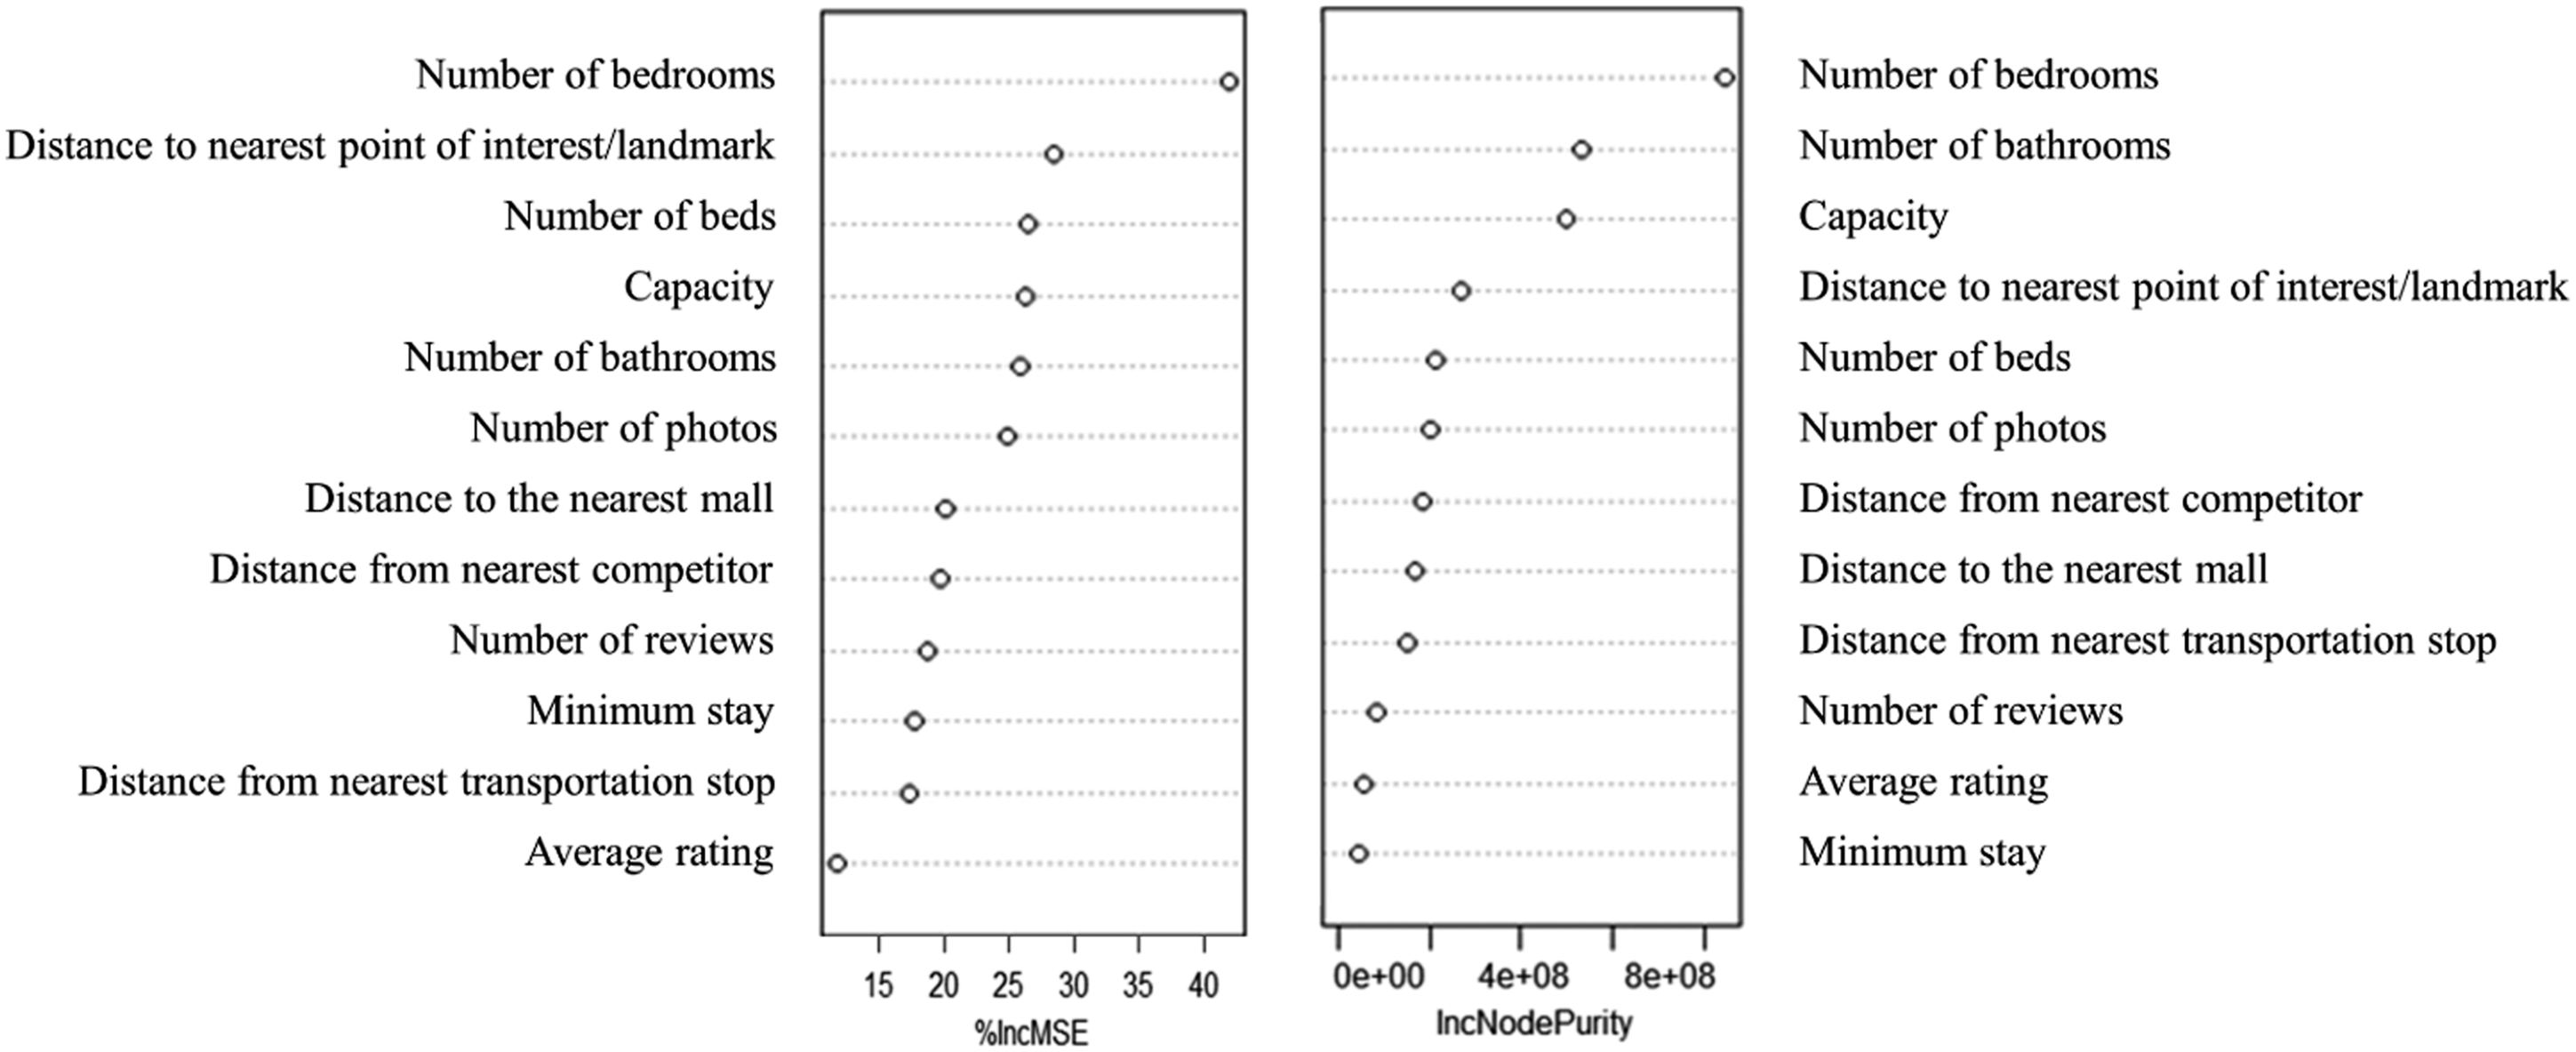
Growth in numerous variables related to housing attributes seemed to drive rising listing prices, supporting the results of previous studies in which size was the main driver of price (Chattopadhyay and Mitra, 2019; Chen and Xie, 2017; Gyódi and Nawaro, 2021). We observed a linear relationship between the number of bedrooms and listing prices, and this growth rate was relatively fixed: an additional bedroom increased listing prices by 300–400 yuan. Consequently, the number of bedrooms appears critical to local housing market positioning, target groups’ consumption, and area competitiveness. The number of bathrooms demonstrated a similar relationship; however, due to the upper threshold of daily living needs, any increase in listing prices slowed for properties with four or more bathrooms.
Because the room quality and service can hardly be experienced before the purchase, photographs offer a highly intuitive way for guests to conduct an information search to reduce the adverse effects of information asymmetry (Abrate et al., 2011; Bonsón Bonsón Ponte et al., 2015). Based on the density of scattered points in Figure 4(d), most landlords in our sample provided between 0 and 30 listing photos. More photos brought a limited premium, presumably offering potential guests more relevant information about a listing’s interior and exterior. For listings priced under 1000 yuan, listing prices increased at a rate of 100 yuan per 10 photos. Scatter plots of predictor values versus various factors. (a) number of bedrooms, (b) number of beds, (c) number of bathrooms, (d) number of photos, (e) number of reviews, (f) average rating, (g) capacity, (h) minimum stay, (i) distance to the nearest POI/landmark, (j) distance from the nearest competitor, (k) distance from the nearest transportation stop, and (l) distance to the nearest mall.
The average rating of most Airbnb listings exceeded 4. As illustrated in Figure 4(f), listings rated below 4.5 tended to cost less than 500 yuan; in these cases, listing prices were not easily influenced by the property rating. Only when the rating fell in the 4.5 to 5 range did Airbnb’s reputation system show a positive correlation with price, providing a filter for consumers to choose quality listings. Fluctuations in the number of reviews had little effect.
The impacts of the number of occupants and the minimum length of stay on listing prices were identical to the previous two models. Previous studies have yielded mixed results on moderate or strict rental rules. The result of this study was in agreement with Sainaghi et al. (2021). For short-term rental listings, the minimum length of stay constrained an increase in listing prices. Strict minimum accommodation requirements were not enough to compensate for the loss of demand from short-stay visitors. Landlords may thus wish to outline relevant preferential strategies for tenants who planned to stay for a longer period to transform potential guests’ doubts about the fairness of the transaction into actual rental demand.
The distance from surrounding attractions/landmarks was key for most tenants, especially backpackers who are particularly mobile during travel. If the distance is too far, then guests’ time and transportation costs will increase considerably and potentially detract from their overall experience. In our sample, as distance increased, the average listing price showed a downward trend at an average of 50 yuan/km.
Traffic conditions were also important to listing prices. Listing prices demonstrated an upward trend within 250 m (i.e. from 400 to 500 yuan). Compared with previous studies (Boto-García et al., 2021; Voltes-Dorta and Sánchez-Medina, 2020), we believed that the price penalty was mainly due to the nuisance effect of noise and congestion around the traffic station. Figure 4(J) shows that if a competitor is located within 1.5 km of an Airbnb listing, the property owner could reduce their price by about 100 yuan to maintain a competitive advantage. As competitors disperse and accommodation supply declines, listing prices begin to rise, reflecting the pricing power of housing.
Model comparison
Prediction accuracy of linear regression, GWR, and RF models.
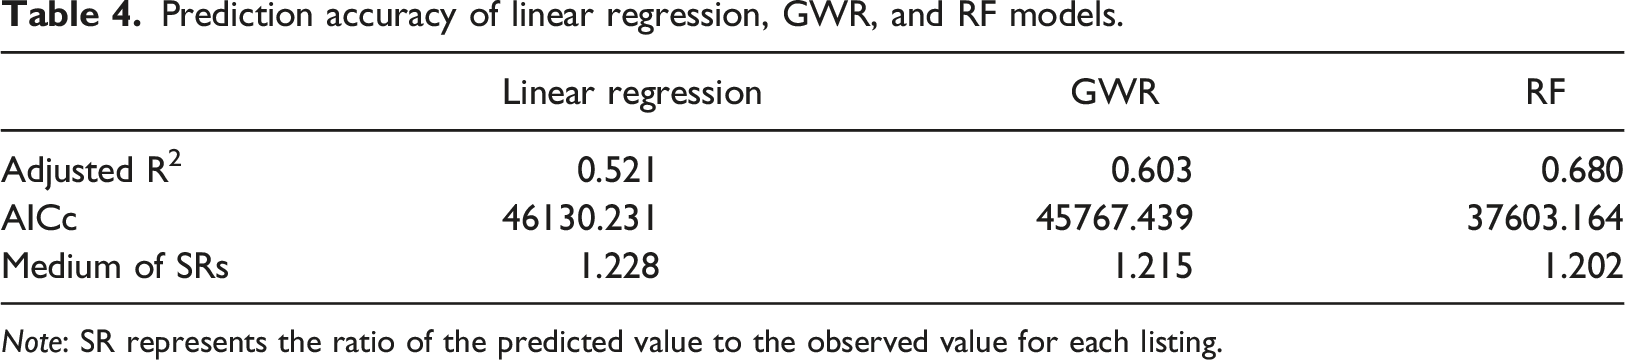
Note: SR represents the ratio of the predicted value to the observed value for each listing.
Notably, although GWR showed apparent advantages over global regression in dealing with spatial heterogeneity and nonlinearity problems, the model exhibited a poor fit in densely populated areas based on local R2. More specifically, while traditional hotels are more widely dispersed geographically, Airbnb is unique; dozens of listings may be available within one community or even within several adjacent buildings. As shown in Figure 5, listings’ prices, quality, and interior conditions (e.g., facilities) may differ drastically, but their geographical coordinates (i.e., longitude and latitude) remain nearly identical. Listings may even appear on different floors in the same building and thus share geographical coordinates, although this arrangement is more common in densely populated areas. In this case, individual heterogeneity, rather than spatial heterogeneity, is a primary factor affecting listing prices. GWR encountered problems in dealing with this scenario, which influenced the model outcome. Comparison of variable importance of linear regression, GWR, and RF.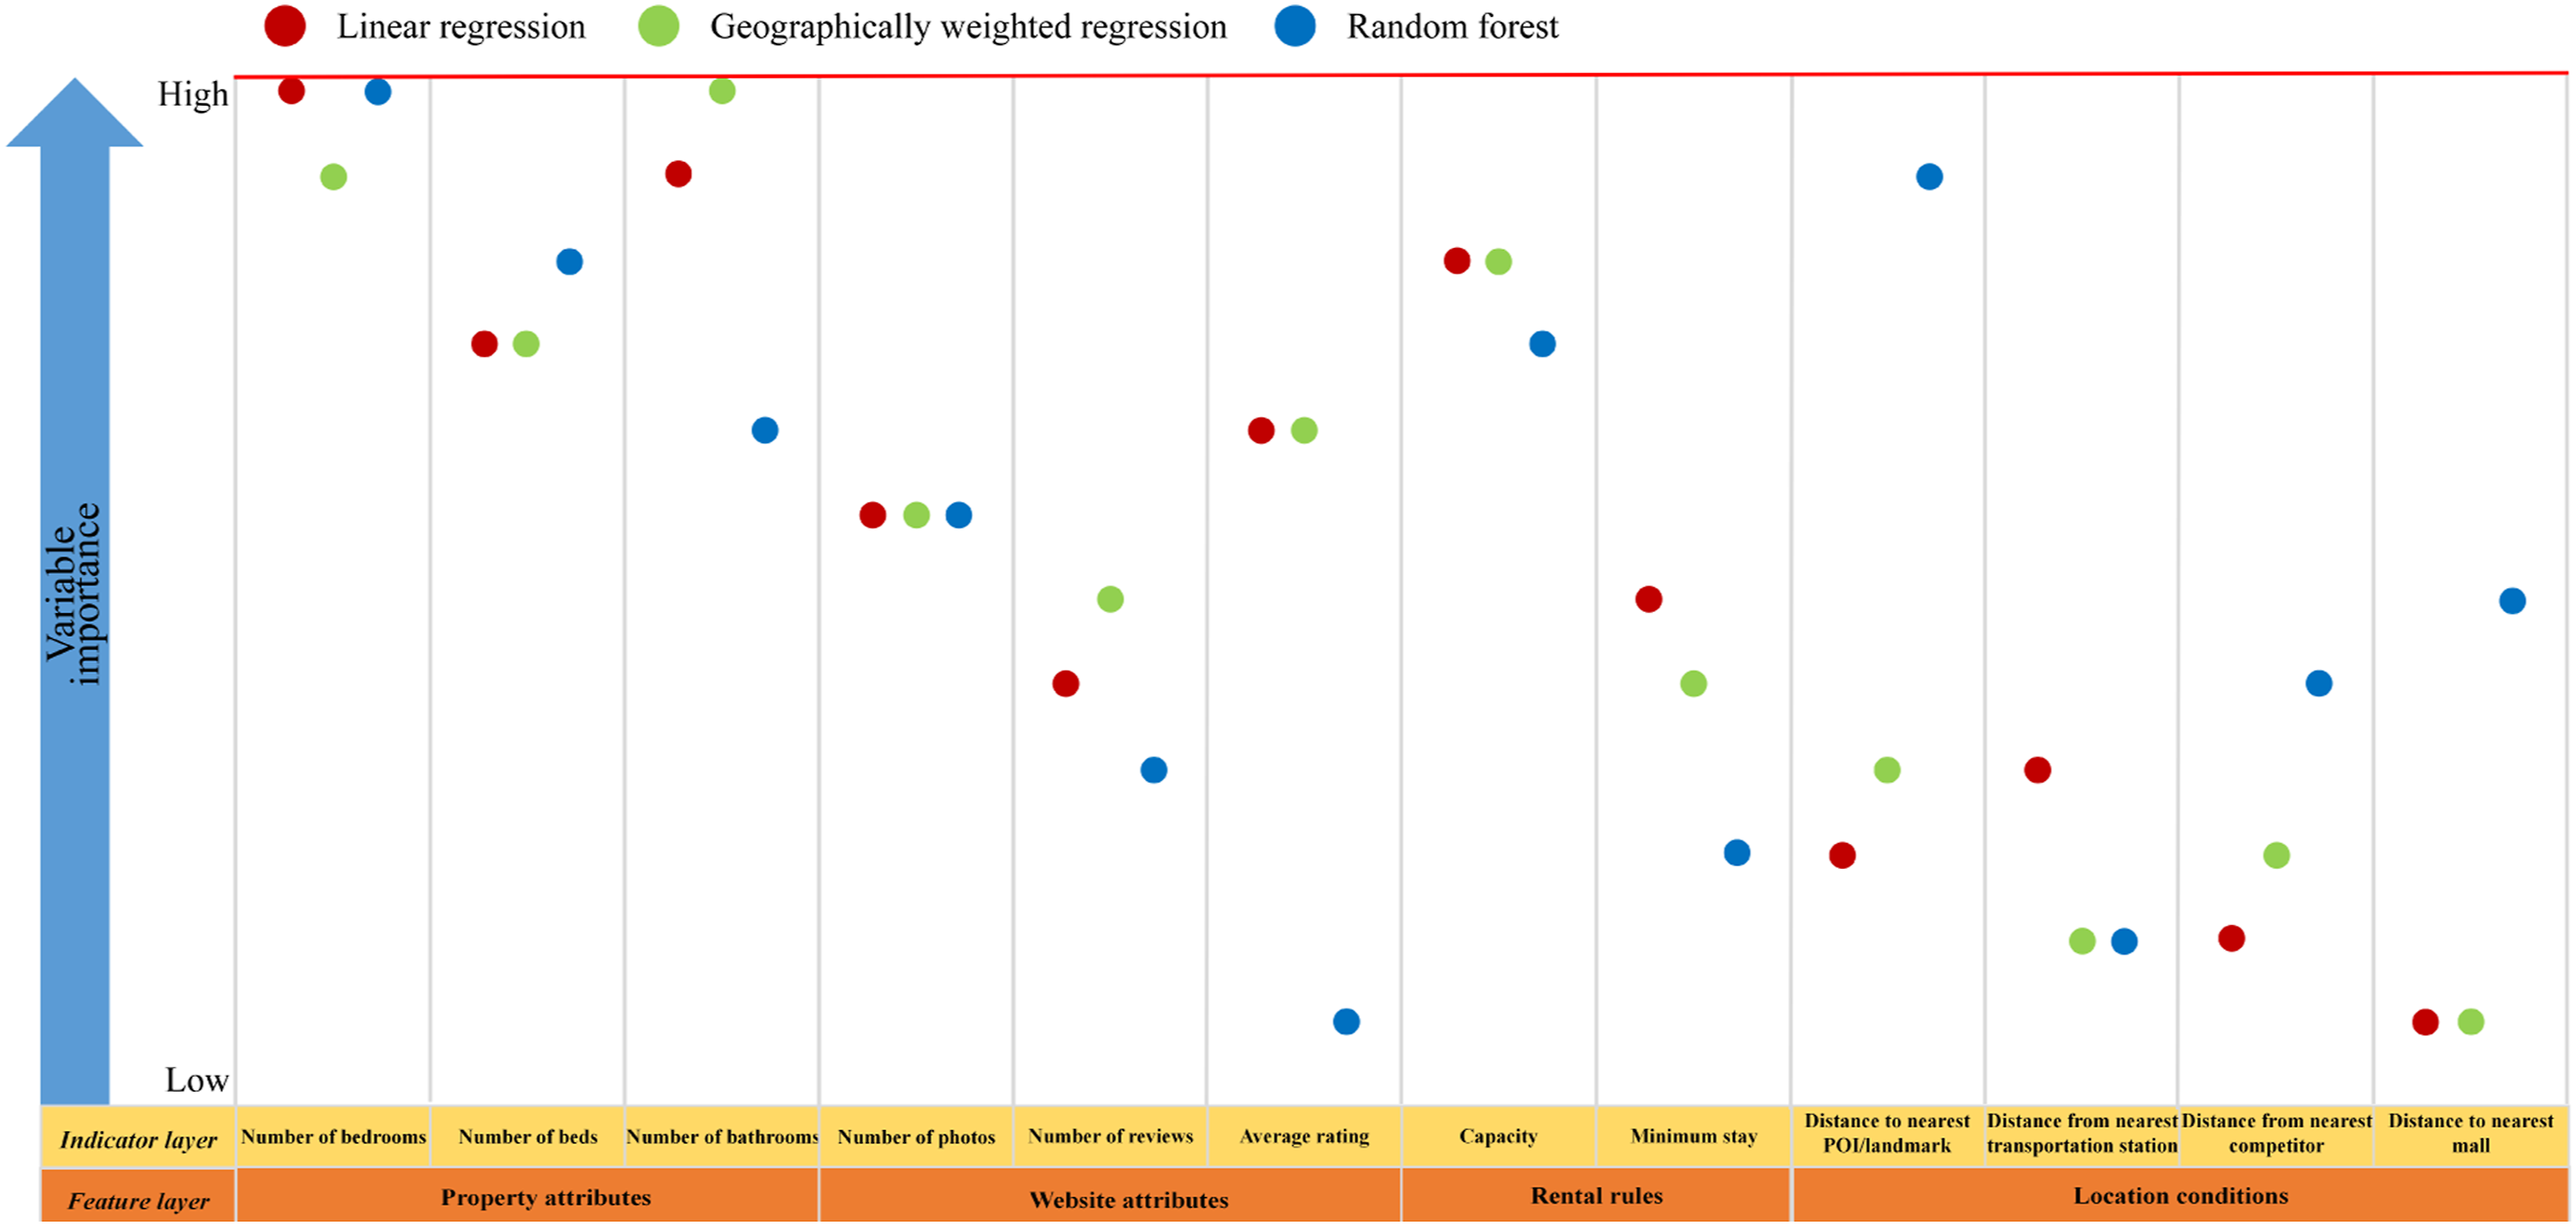
Conclusion
This study employed three models (linear regression, GWR, and RF) to examine influencing factors in Shanghai’s Airbnb listing prices. In particular, we leveraged geographic methods to quantify and analyze spatial laws and compared different models’ modeling performance. We provided an in-depth analysis of the spatial dependence of Airbnb price influencing factors and identified the premium capacity of variables within different price intervals and thresholds. We found that traditional hedonic pricing theory produced biased results when facing the problem of information redundancy due to the spatial overlap of individual heterogeneity of Airbnb, and therefore explored the integration of different methods to determine the relative importance of the influencing factors, thus enhancing the robustness of traditional pricing theory in the sharing economy context. Our findings also point to relevant implications for various stakeholders.
According to the results of our three models, although there are several differences on variable importance computed by our models, we care more about GWR and RF because of their better model performance. The relationship between property attributes and listing prices was closest, similar to the traditional hotel industry. The number of bedrooms was the main contributor to listing prices, and listing prices in Shanghai’s central urban area were most sensitive to changes in the number of bedrooms. The relationship between the number of bathrooms and prices followed a similar pattern but was subject to a ceiling of maximum demand (i.e. 4+ bathrooms).
Web site attributes and rental rules demonstrated clear disparities from the traditional hotel industry, with the number of photos and property capacity being especially significant. An appropriate number of photos can provide sufficient information for potential guests while boosting the host’s trust and social favor. Given the homogeneity of results in Airbnb’s evaluation system, tenants tend to be cautious about listing reviews and evaluations. This circumstance reflects the platform’s need and motivation to promote Airbnb Plus in recent years. Property capacity primarily reflects the host’s consideration of the possible capacity and consumption rate of their property while clearly defining boundaries between individual and group occupants. The minimum length of stay appeared to have a negligible effect on property prices, although excessively firm restrictions could diminish guests’ willingness to stay. In general, listing considerations differed by price: hosts renting high-priced listings should highlight the advantages of the listing itself, pay particular attention to enhanced service quality, and take note of tenants’ expected and actual needs. At the same time, hosts must remain cognizant of tenants’ comments and ratings. Hosts operating lower-cost properties should also establish rational rental rules to ensure a smooth check-in process and maintain high ratings and occupancy rates.
Additionally, listings’ location conditions can meet tenants’ diverse occupancy needs. The check-in process remains a key aspect of short-term Airbnb rentals, and a property’s distance from attractions or landmarks is the strongest influencing factor among distance-related variables. Distance limitations tend to be notably weak in Shanghai given the city’s compact layout, robust transportation network, and sizeable operating capacity.
In terms of modeling accuracy and interpretation ability, the RF algorithm’s unique advantages punctuate the rich application prospects of machine learning in listing price prediction: swifter calculations and greater prediction accuracy for high-dimensional and massive data, resilience to missing data and abnormalities, and lack of problems such as collinearity and overfitting. By comparison, GWR has demonstrated superior processing, backward analysis, and spatial visualization capabilities in dealing with spatial instability. Yet it is simple to produce deviations in scenarios with high individual heterogeneity when using GWR, and this approach maintains specific restrictions on the types of variables that can be incorporated.
This study has some limitations. First, the dependent variable in our study considers the listing price (Gibbs et al., 2018), not the actual price of the sale rent. Deviations between fitted and actual listing prices were relatively large, indicating that the factors driving listing prices require more in-depth research. Second, despite the robustness of our model for the factors influencing the price of Airbnb listings in Shanghai, we are cautious as to whether these findings can be generalized to other cities. Compared with previous studies (Dudás et al., 2017; Lawani et al., 2019), we do believe that our findings are at least applicable to metropolitan tourist destinations with highly developed transport infrastructure. Due to varying degrees of urban development, regional nuances, and Airbnb access, price determinants are also likely to differ by city. Therefore, scholars should evaluate the complexity of Airbnb pricing from different perspectives through different case studies to develop a more comprehensive view of the influencing factors.
Footnotes
Declaration of conflicting interests
The author(s) declared no potential conflicts of interest with respect to the research, authorship, and/or publication of this article.
Funding
The author(s) disclosed receipt of the following financial support for the research, authorship, and/or publication of this article: This work was supported by the National Natural Science Foundation of China [41771153].

Author biographies
Yifei Jiang
Honglei Zhang
Xianting Cao
Ge Wei
Yang Yang