
Abstract
This paper examines distance decay in international tourism demand for East African destinations using bilateral panel data from 86 origin countries to 14 destinations over a 15-year period. Adopting a gravity model framework, the study extends conventional specifications by jointly incorporating geographical distance and airfare to distinguish between physical and economic dimensions of accessibility. The results confirm that distance negatively affects tourist arrivals, while cultural proximity variables significantly shape tourism flows. However, airfare partially mediate the impact of distance, indicating that travel cost does not fully substitute for spatial separation. Moreover, the relationship between distance and tourism demand is nonlinear, revealing multiple peaks in distance decay curves rather than the traditional single-peak pattern. These dynamics evolve over time, reflecting market diversification and improved connectivity across the region. By focusing on an underexplored African context, the study contributes new empirical insights into the complex spatial structure of tourism flows.
Introduction
Developing economies across Africa have increasingly prioritised tourism as a pillar of economic growth and diversification; yet many remain disadvantaged by their geographic distance from major source markets and the high transport costs that accompany limited accessibility. Traditional tourism demand models have long included travel cost and destination prices as key explanatory variables (Lim, 1997). However, more recent applications of the gravity model in tourism economics have shifted the analytical focus toward distance as a proxy for spatial friction and travel effort, thereby linking tourism flows to the broader “economics of distance” framework.
There are opposing views on the influence of distance on tourism demand. Traditionally, distance has always been viewed as a disutility, increasing the cost and time of travel (Prideaux, 2000). This concept is referred to as distance decay, which hypothesises a negative relationship between tourism demand and distance. It is related to Tobler’s first law of geography, which states “everything is related to everything else, but near things are more related than distant things” (Tobler, 1970). Contrarily, Lumsdon and Page (2007) argue that distance may not always be viewed as a disutility to travelling, since the journey may be viewed as part of the tourism experience. In addition, it is argued that improved technology has also reduced the travel time and travel costs for tourists, encouraging tourists to travel over longer distances (Peeters, 2007). Furthermore, distance may be part of the attraction of the destination.
While a substantial body of literature exists on distance decay in tourism, empirical evidence from Africa remains relatively scarce. This paper firstly contributes to the literature by analysing the concept of distance decay within the African context. One of the upcoming regions in Africa in terms of tourism, economic growth and economic development, is East Africa that includes countries like Ethiopia, Kenya, Tanzania and Uganda, even though it is also home to a number of least developed countries (LDCs) in the world (Okello and Novelli, 2014). Accessibility to the region has improved with more airlines servicing the area and a number of air transport hubs in the vicinity.
However, in spite of the improved accessibility, market imperfections and issues related to connectivity continues to prevail to a large extent. The main challenges that are faced are low quality of air travel-related infrastructure (Meichsner et al., 2018) and high operation costs (Njoroge and Samunderu, 2021). The higher costs incurred are the direct result of higher charges imposed by airports, higher taxes and higher cost of operations. These causes airfare to soar, resulting in lower load factors (Njoroge and Samunderu, 2021). The situation gives rise to a methodological problem when it comes to estimating airfare elasticities of demand as discussed in Seetaram (2010a). Demand models using cross section data often use distance as a proxy for airfare with resulting estimated elasticity interpreted as air transport elasticity. Seetaram (2010a) argues that in the presence of market imperfections, this is inaccurate because monopolistic pricing implies that the correlation between distance and airfare are low. However, this proposition is yet to be verified empirically. The second contribution of this paper therefore is to assess to what extent distance can be a good proxy in a demand model and be used to estimate airfare elasticities.
This paper introduces the joint analysis of geographical distance and transport cost to distinguish between physical and economic dimensions of accessibility which has seldom been analysed in tourism demand models. The existing literature has established the negative effect of distance on demand. This paper goes further by including, both airfare data from IATA and distance in the model developed to observe the effect of monetary and non-monetary transport costs respectively, associated with air travel. By demonstrating that airfare only partially mediates the effect of distance on tourist arrivals but does not fully substitute for it, the paper makes an additional contribution by offering a nuanced perspective on how improved air connectivity reshapes spatial tourism patterns.
This paper therefore aims to (i) assess distance decay in tourism to East African countries; (ii) assess the relationship between distance and transport cost to and within East Africa; (iii) determine whether travel cost has a mediating or moderating effect on travel distance and on East Africa’s tourism arrivals, and (iv) examine the performance of these variables within a tourism model to verify whether they can be used interchangeably in tourism demand specifications i.e., validating the gravity model’s use in tourism demand studies.
The paper uses bilateral data from 86 origin countries to 14 East African destinations, spanning a 15-year period. Most existing literature on distance decay and tourism demand has focused on developed or highly internationalised destinations in Europe, North America, or Asia. By contrast, this paper applies these concepts to a region that has traditionally been underrepresented in empirical tourism research, providing new insights into how accessibility and regional integration shape tourism flows in the developing world.
The fourth contribution of the paper is that it delves deeper in the analysis of distance decay and confirms that it remains a defining feature of tourism flows to East Africa. It departs from the classical single peak, exponential decline decay observed in the literature and demonstrates the existence of two or more peaks in arrivals. This is in line with McKercher and Lew’s (2003) concept of Effective Tourism Exclusion Zones (ETEZs). This pattern indicates that tourist arrivals do not decrease uniformly with distance but instead follow a more complex spatial dynamic.
Literature review
According to Kim and Fesenmaier (2015), geographical distance and travel time are two objective measures of distance between countries. However, these objective measures do not consider subjective measures of distance, which tourists also take into account when deciding to visit a destination or not. A recent review of the literature by Shang et al. (2025) revealed that the tourist’s perception of distance is influenced not only by geographical distance, but also by other measures of distance, most notable, economic, cultural and social distance. These concepts are subsequently further explored.
Geographical distance and distance decay
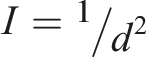
Within tourism studies, geographical distance represents the increase in time and cost associated with travel, while tourists face a budget constraint (Tan et al., 2023). This implies that the opportunity cost, both financial and non-financial, of tourists increases when the geographical distance between the origin and destination country is larger (Yang et al., 2022). In the literature, distance decay is used the describe the relationship between two objects and the effect they have on one another. The concept applies to any interaction between objects in different locations, with interaction decreasing as distance increases (Pun-Cheng, 2017). Linders (2005) confirms that this is also true in international trade, where trade between countries that are geographically further apart, is less. He attributes this to the increase in transport and intangible (or transaction) cost.
Within the context of tourism, the distance decay effect is also present. McKercher and Lew (2003) ascribe this to the trade-off tourists make between time spent travelling and time at the destination, with further travel distances associated with additional costs in terms of time and money (Wong et al., 2021). Lee et al. (2012) affirm that tourists’ travel behaviour reflects this trade-off between the perceived benefits of visiting the destination and the cost in terms of time and money.
A typical distance decay curve for tourism reaches a peak a distance quite close to the origin of the tourists and decline exponentially for farther destinations (Bull, 1991). This theoretical distance decay curve is indicated in Figure 1, and one can see that the initially an increase in distance leads to an increase in tourist arrivals, but that the peak is reached within a relative short distance (typically associated with neighbouring country origins), from where distance becomes an increasing deterrent to tourist arrivals. Theoretical distance decay curve. (Source: McKercher and Lew, 2003).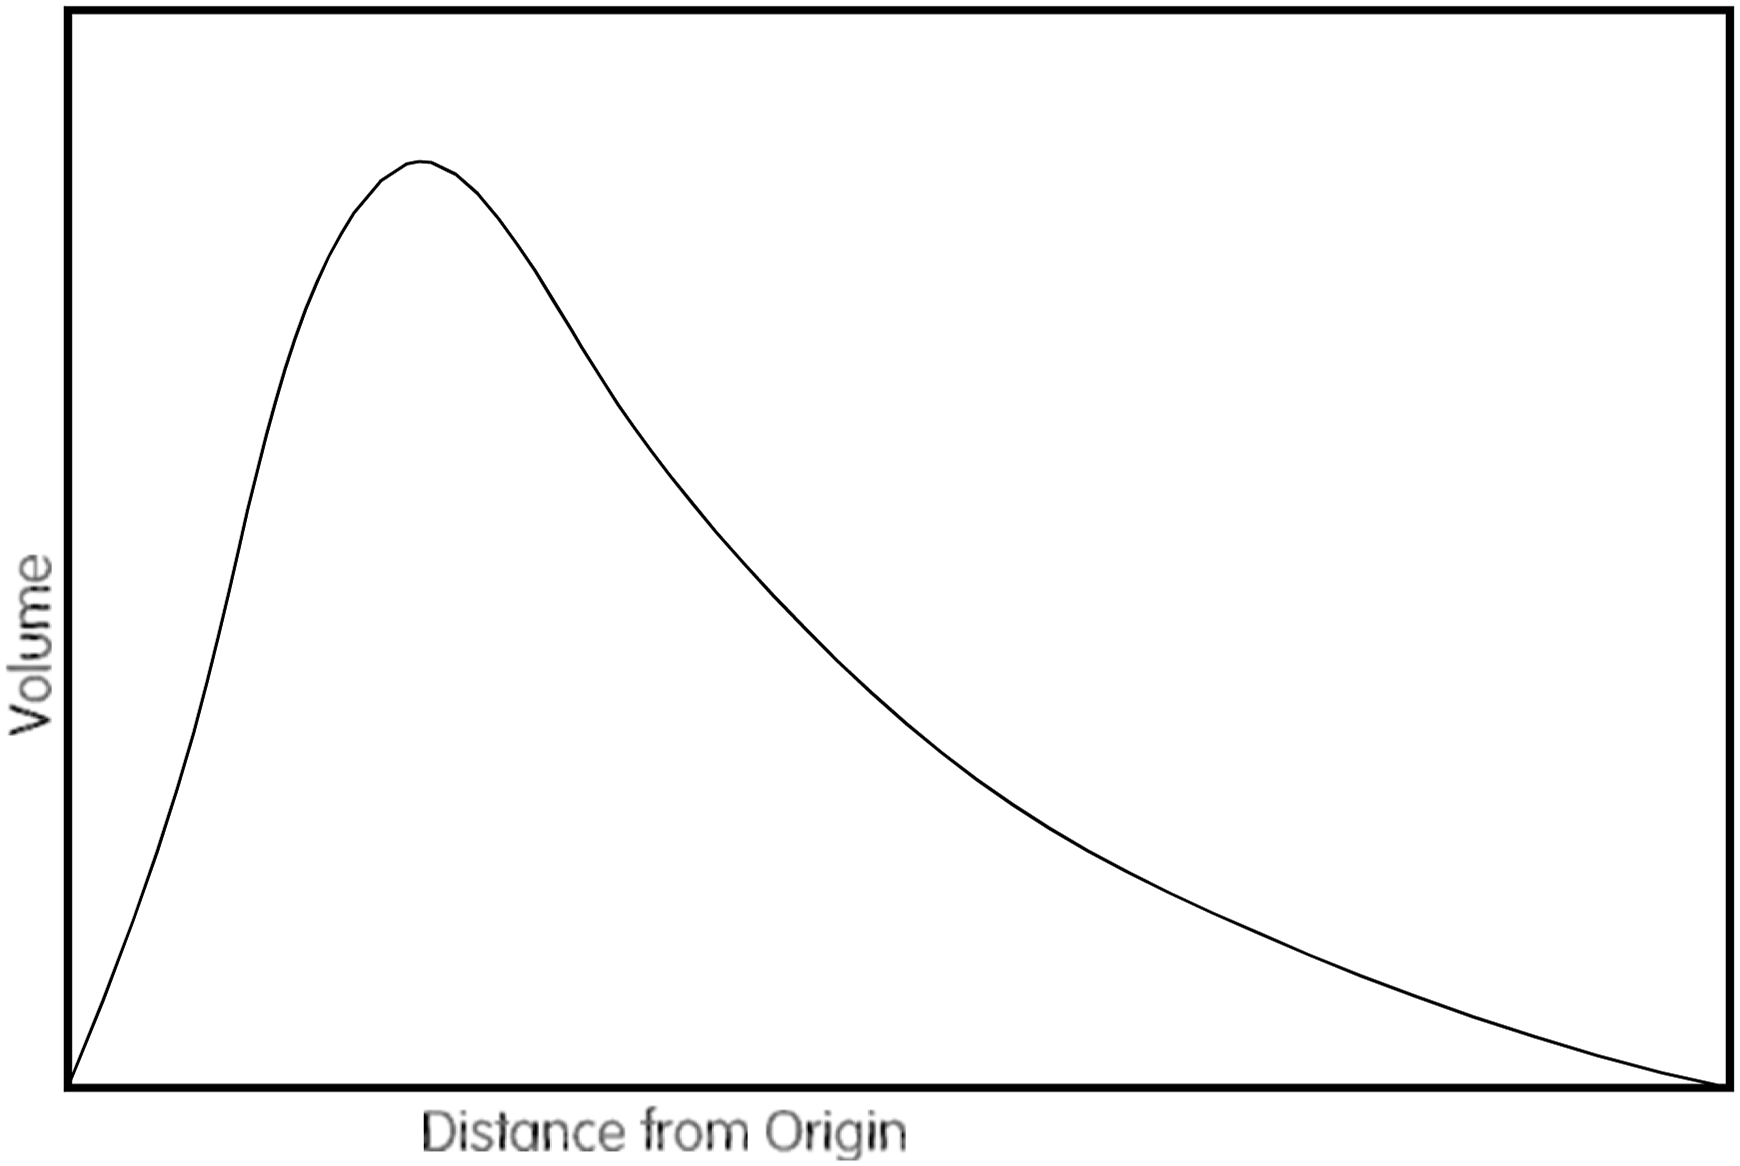
This follows a similar pattern as the mathematical expression of distance decay, given by Pun-Cheng (2017):
In tourism, the distance decay curve does not have its peak at a distance of just greater than zero (refer to Figure 1). This is because a certain distance is required before the person will decide to overnight at the destination (McKercher and Lew, 2003), which is a requirement according to the definition of tourism.
Research by McKercher (1998) and McKercher and Lew (2003) identified alternative shapes for the distance decay curve. Using Australian automobile tourists’ data, McKercher (1998) found a plateauing distance decay curve, with decay only occurring after 600 km from the tourist origin. He attributes the plateauing distance decay curve in Australia’s domestic tourism market partially to the unlimited supply of accommodation along the tourist routes. For Hong Kong travellers, McKercher and Lew (2003) showed the distance decay curve to display a secondary, albeit lower, peak. The first peak lies between 1,000 and 1,500 miles from Hong Kong, while the secondary peak is further than 6,000 miles away. This pattern in the distance decay curve led the authors to identify Effective Tourism Exclusion Zones (ETEZ), which refers to distances where no tourism activity takes place. This may be due to, among others, geographical barriers, such as mountains or oceans (McKercher, 2018).
A follow-up study for Hong Kong by Lee et al. (2012) confirmed the secondary peak and identified the destinations in the first peak as Thailand, South Korea and Japan, while the secondary peak coincides with major European destinations, including France, Spain, Italy and the UK. This may bring credence to the idea that travel has some commodity value, so that tourists are willing to spend a larger portion of their budget on the travel than in the final destination (Lumsdon and Page, 2007). Yang et al. (2022) note that this indicates that the unique pull factors of the destination outweigh the cost of travel to the tourist, with Nicolau and Mas (2006) identifying climate as one of those unique factors.
Pun-Cheng (2017) argues that the convenience of reaching a destination directly, or the ability to use more than one mode of transport to reach a destination, now alters the distance decay effect. Given the discussion above, it is therefore not surprising that research on distant decay in tourism has remained scant (Yee and Ismail, 2020).
The literature on distance decay in tourism, clearly identifies non-linear decay patterns and as demonstrate that it departs from the classic gravity model assumptions that tourist arrivals decrease as distance increases. ETEZ is an important concept explaining the shape of the distance decay to some extent, but these explanations do not incorporate changes over time due to changing markets and connectivity. One argument put forward is that better and cheaper air travel, are reducing distance decay in tourism. This has yet to be determined in the context of developing countries, such as the East African regions where improvement in connectivity continues to lag compared to the developed world. This paper, therefore, addresses this gap by identifying the ETEZ in East Africa and extending the gravity model for tourism in the region based on the nature of the relationship between transport cost, distance and tourist arrivals.
Other forms of distance that influence tourism behaviour
As indicated above, tourists’ perceptions of distance are also influenced by their perception of the cultural, economic and social distance between nations. This is echoed by Nyaupane and Andereck (2008), who refer to these differences as constraints to market access. Among these market access constraints that are inherent in the destination are visa requirements (economic distance), limited transport and accommodation options (geographic and cultural distance), and safety and security concerns. These aspects again have a cost implication for the traveller (Pun-Cheng, 2017), discouraging tourism between them.
Cultural distance
According to Liu et al. (2018), cultural distance can be defined as the extent to which the culture in the origin country differs from that in the destination country. While the concept of culture is evolving, the dictionary definition indicates that culture refers to “the customary beliefs, social forms, and material traits of a racial, religious, or social group” (Mirriam-Webster, 2025). An increase in geographical distance between two countries are usually associated with an increase in cultural distance that further impede travel, making neighbouring destinations more attractive (Lee et al., 2012). These differences include, but is not limited to, language barriers, common ancestries and other cultural dissimilarities (Petit and Seetaram, 2019). Yang et al. (2018) conclude that cultural dissimilarity may be an impediment to international travel because (i) it increases the risk of travel, (ii) travellers identify better with the products and services that they are more familiar with, and (iii) it implies an increase in information and communication costs.
Yee and Ismail (2020) find that cultural distance has attracted significant research interest in tourism studies, forming its own cluster of distance decay studies within the field. This has also led to an opposing view of the effect of cultural distance on international tourism. According to this view, travellers are increasingly searching to discover and explore new cultures, leading to an increase in travel between countries as cultural distance increase (Shang et al., 2025). Furthermore, the increase in internet penetration and improved communication technology may have arguably reduced the cost and risk faced by tourists when travelling to culturally dissimilar countries (Yang et al., 2018).
Economic distance
Economic distance refers to the strength of the economic connection between the origin and the host country. According to Shang et al. (2025), the differences in income between the two countries concerned are an indication of the size of the economic distance between the two countries. This agrees with the international trade concept that countries with similar GDPs will engage more in trade.
In many instances, economic closeness is also related to geographical closeness. For example, in the international trade literature, Linders (2005) argues that countries closer to one another are more likely to engage in regional trade agreements and currency unions, enabling a barrier-free flow of goods and services between them. Similar effects have been found in the tourism literature, especially for the euro area (Santana-Gallego et al., 2015) and even for other trading blocs, e.g. Middle East and North Africa (MENA) (Saayman et al., 2016), indicating the removing impediments to market access leads to enhanced tourism flows. Within the tourism context, bilateral visa agreements is also a measure of bilateral economic ties, with research by Rosello and Santana-Gallego (2024) showing that the removal of visa barriers leads to an increase in bilateral tourism.
Wong et al. (2021) includes the relative prices between the origin and destination as a measure of economic distance. The rationale for this is that tourists would prefer value for money destinations, where prices are lower or comparable to that in their home country. Larger differences in prices between the origin and destination country therefore signals greater economic distance and less economic similarity.
Social distance
Shang et al. (2025) define social distance as the “relationship gaps between individuals, organisations, and communities” (p.392). Yang et al. (2022) describe it as the extent to which there is a social disconnect between tourists and host communities. Hence, social distance focuses on the host-tourist relationship. Not many general measures of social distance are readily available, with Yang et al. (2022) proposing bilateral immigrant stock as a proxy, based on the work of Seetaram (2012). However, most social distance studies rather utilise primary data collection methods to measure host-tourist relationships.
Tourism demand, distance and cost
Studies on the relationship between distance from the origin and volume of tourism flows, as postulated by the distance decay theorem, has attracted more attention the past two decades; especially research by McKercher contributing to exploring the different distance decay patterns and reasons for this decay (see Tan et al. (2023) for a complete list of studies). In this regard, Shang et al. (2025) conclude that one cannot talk about distance in tourism without mentioning transport. The improvement in transport infrastructure decreased the perception of geographical distance, facilitating tourism to further-away destinations. Yang et al. (2018) also mention that the cost of international airfare has decreased, making long-haul travel more affordable. This notion that travel cost and travel distance influence tourists’ decisions has also been explored in both studies of tourism demand and tourism flows.
From a microeconomic perspective, demand for a destination is considered to behave similar to that of any other product. It is postulated that a utility maximizing (or cost minimizing) individual will choose the bundle of tourism destinations to visit based on his/her income and the relative price (or cost). Two costs are identified in tourism, namely the cost at the destination and the cost of getting to the destination (Lim, 1997). Therefore, tourism demand is modelled as a function of income (

According to Seetaram (2010a, 2010b) and Wu et al. (2017) transport cost is often measured based on the oil price due to limited access to actual passenger transport cost data. This measure does, however, not consider the relative decline in travel cost due to improved technology or low-cost airlines, which also influence the relationship between distance and cost.
Secondly, the use of the gravity model to explain tourism flows between countries have recently gained popularity. Shang et al. (2025) indicate in their review of the effect of distance on tourism, that the gravity model has become the most prevalent model to analyse the spatial interaction between two destinations, because of the model’s ability to control for various differences between the origin and destination countries.
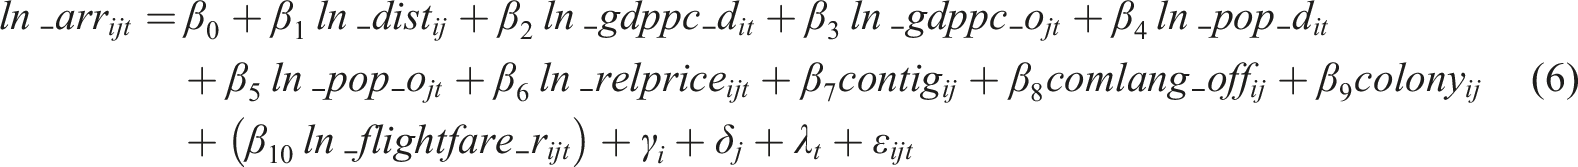
The model is based on the laws of gravity by Newton with the distance between the two countries expected to have a negative influence on tourism flows between the countries. It was first adopted in the international trade literature (Anderson and Van Wincoop, 2003; McCallum, 1995), but the application of the gravity model to study bilateral tourism flows has gained momentum over the past 2 decades. The typical gravity specification used in tourism research is (Gil-Pareja et al., 2007):

According to Linders (2005), the exclusion of variables that control for cultural differences and market access, leads to omitted variable bias in the distance parameter in gravity models. In particular, controlling common borders, language similarities and colonial ties reduces the bias in the distance parameter. While geographical distance, economic and cultural distance enters the gravity equation, it is evident that neither the demand specification, nor the gravity specification consider a non-linear relationship between tourism flow and distance as proposed by the distance decay theory.
The gravity specification does also not include both distance and transport cost as explanatory variables, because distance is viewed as a proxy for transport cost, with the cost and scarcity of data on air travel cost (airfare) additional disincentives. In the absence of actual data on transport cost, demand models traditionally use the price of crude oil or distance between origin and destination to measure the cost of travel. These proxies can give rise to measurement errors resulting in biased estimates as argued in Seetaram (2010a). In this paper, both airfare and distance are included as explanatory variables. Distance here can be argued is testing for non-monetary cost such as connectivity, ease of travel, while airfare measures monetary transportation cost. However, given that there may also be a relationship between travel cost and distance, the paper also tests the nature of this relationship and possible moderating or mediating effects of travel cost on the effect of distance on tourist arrivals.
Methodology
This paper investigates the relationship between distance, transport cost and tourism to 14 East African countries 1 . The countries included are based on the United Nations definition of East African countries. Accessibility of these countries have improved significantly over the past number of years, with Ethiopian Airlines and Kenya Airways offering regular flights to East Africa, while Emirates, Turkish Airlines and Qatar Airways are Middle Eastern hubs that also serve the region (Bofinger, 2017).
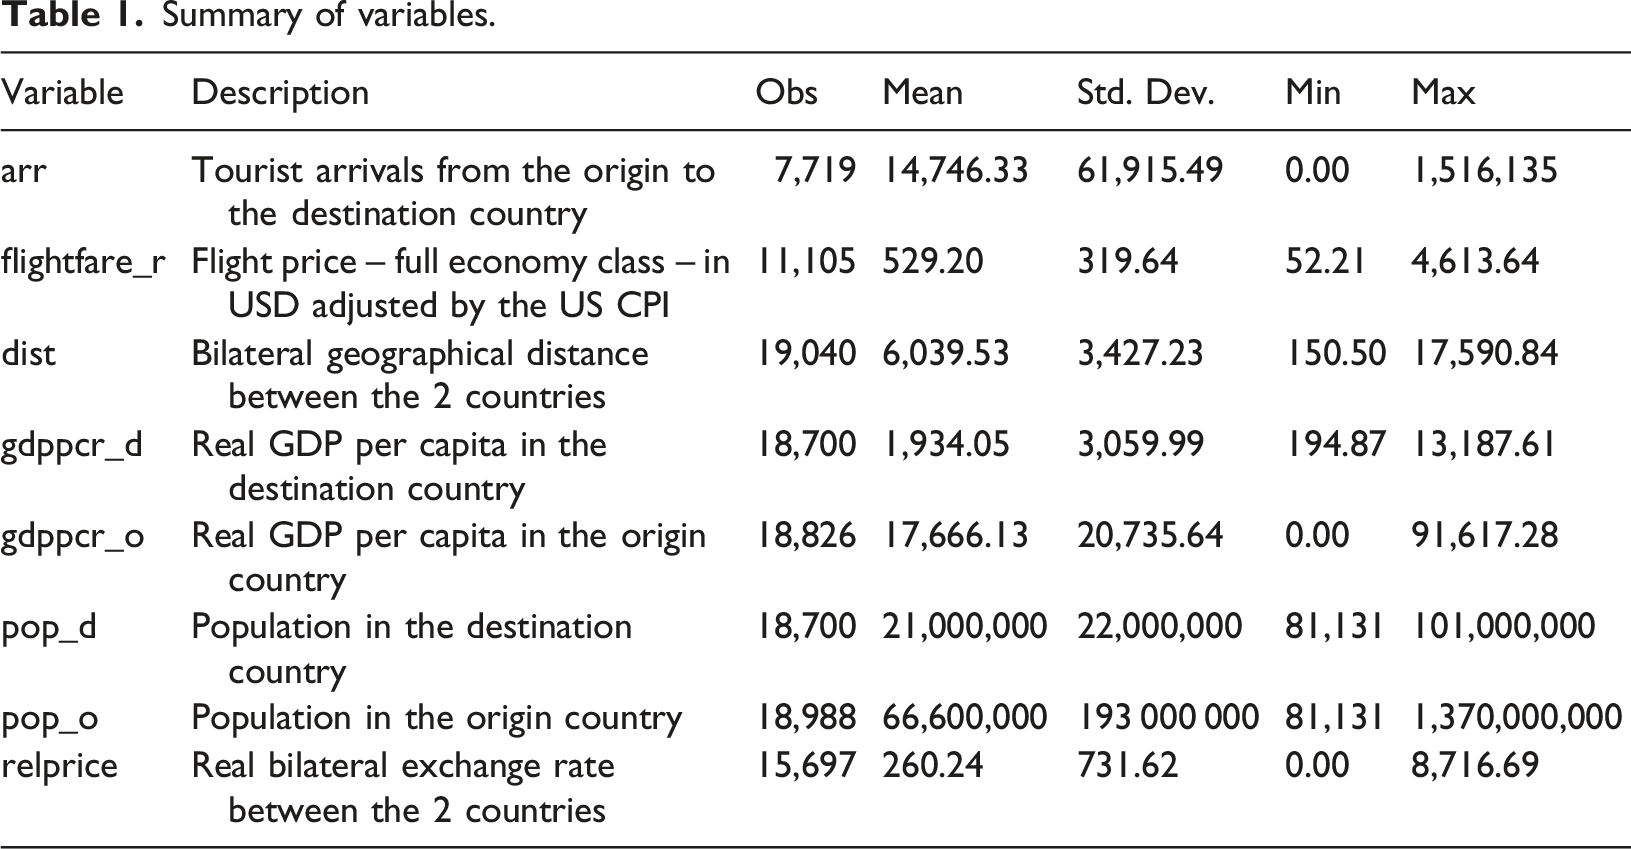
Firstly, distance decay within these countries is investigated using a graphical method to plot tourist volume against distance. A kernel density plot is used to show the probability distribution. Data from 86 origin countries are used from 2000 and 2015
2
compared. Data for distance are obtained from the CEPII (Centre for Prospective Studies and International Information) database (
Secondly, the relationship between distance and cost is further explored. This entails not only testing the nature of the relationship between travel cost and distance, but also how they interact with tourist arrivals. Travel cost data was obtained from IATA and consist of the full economy ticket price between the origin and destination country in US dollars, deflated by the US CPI to reflect the fare in constant US dollars (
The aim of this analysis is also to determine whether travel cost moderates or mediates the distance between countries. A mediating variable (real flight fare in this case) transmits the effect of the independent variable (distance in this case) on the dependent variable (tourist arrivals in this case) (Edwards and Lambert, 2007). Full mediation takes place when the mediating variable causes the effect of the independent variable (distance) on the dependent variable to become insignificant. If the effect between the independent and dependent variable is still significant, partial mediation takes place.
To test for mediation, the following four equations need to be estimated, which assist in understanding the relationship between the variables. The equations firstly establish the link between the dependent and independent variable, then the relationship between the mediator and the independent variable, thirdly the relationship between the mediator and the dependent variable and lastly the combined effect of both the mediator and independent variable on the dependent variable:


Edwards and Lambert (2007) explain that a moderator is a variable (real flight fare) that interacts with another independent variable (distance) and that alters the relationship of the independent variable on the dependent variable (tourist arrivals). Hence, the estimating equation in testing for moderation is:

We also consider possible non-linear relationships within the models by including squared variables within the testing equations (equations (1)–(5)).
Summary of variables.
The Hausman test is used to verify whether fixed effects or random effects should be used in the estimation. A rejection of the null hypothesis implies that fixed effects are consistent and efficient. The specification is also expanded to add possible non-linear relationships between that may exist due to distance decay patterns.
Results
Distance decay in tourism to East African countries
As indicated in the literature, the typical distance decay function peaks close to the origin, and decays exponentially as distance increases. One of the novelties of this study, is that it focuses on developing countries and a region of Africa which is fairly politically stable and is growing economically. Investment in infrastructure and technology in East Africa may attract more visitors such that tourism is likely to become a more prominent source of income in the future. Growing middle class in these countries may stimulate demand from within the region. Given that thus far the region has mostly relied on Europe and the USA as the sources of arrival, we expect the distance decay curves to be different from standard ones. Hence, other forms of distance decay are considered, for example the twin peaks and the plateauing distance decay curves. Using visual plots of tourist arrivals against distance for selected years and a Kernel density plot, the distance decay curves for the 14 East African countries are shown in Figure 2. Distance decay curves.
The first observation is that the plot of a few of these countries exhibit the characteristics of the traditional distance decay shape (see for example Eritrea, Rwanda, Tanzania, Uganda and Zimbabwe). The peak is relatively close to the origin and demand declines exponentially after the peak. Unlike traditional distance decay plots, destinations in our analysis can have double peak plots (arrivals rise again as distance increase) or the peak is not as close to the origin as expected.
The countries where peaks are more distant from the origin are the island destinations. The two most obvious are Mauritius and Seychelles where remoteness is part of their attractions. Similar patterns are observed for Madagascar and the Comoros Islands where the peak is only reached when distance is between 6,000 and 8,000 km, displaying an Effective Tourism Exclusion Zone because of the Indian Ocean. The plots, however, also suggest that there is more than one peak. Similarly, in their study of Hong Kong outbound travel, McKercher and Lew (2003) demonstrate the existence of an ETEZ between two peaks. The authors attribute this phenomenon to a lack of attractions for travellers from Hong Kong at 2,500 and 4,500 miles from their home.
Our analysis shows that there can be up to 3 peaks; however, the existence of an ETEZ between peaks is less evident and the range of distance for low demand is smaller. In fact, Ethiopia, Kenya, Tanzania, Uganda and Zambia seem to exhibit this three-peak pattern, with the first peak quite close to the destination, the second peak between 4,000 and 6,000 km and the third peak much further away. For most of these countries, the first peak includes arrivals from other East African countries as well as from North Africa and the Middle East. The second peak coincides with arrivals from countries such as South Africa and Europe, while arrivals from the USA, Canada and Australia fall within the last peak. For Kenya, ETEZ between the two peaks is quite well defined. Demand is closer to zero at 9,000 km (a radius which includes oceans, some of the poorer south Saharan counties where demand for international long-haul tourism may be very weak).
The last observation from the graphical analysis is that tourism distance decay did not stay constant in all the countries over the 15 years investigated. Distance decay for the Comoros, Eritrea and Zimbabwe, for example, has changed from a twin-peak to a classic distance decay curve displaying a change in market composition. For Ethiopia, the last peak is becoming more pronounced, which might be attributed to the increase in flight routes of Ethiopian Air. Uganda’s distance decay is moving closer to a twin-peak pattern from the three-peak curve. In none of the cases, however, did the peak move closer to the origin implying that East African nations continue to rely more on distant source markets instead of neighbouring countries for tourism. The absence of a linear decay necessitates a further investigation into the relationship between tourist arrivals, distance and cost.
Distance and transport cost
The tourism distance decay patterns above indicate that although the pattern does not remain static in many countries, it has not disappeared, refuting the “death of distance” hypothesis. Subsequently, he relationship between distance and transport cost is explored using (i) Pearson’s correlation coefficient to measure the strength of the linear relationship between the cost and distance, and (ii) regression analysis to also include non-linear relationships between cost, distance and tourist arrivals in East African countries.
Correlation coefficient between distance and real transport cost (as measured by flight-fare) for all countries origins in 5-year intervals a .
aCorrelation coefficients lie between −1 and 1 and measures the strength of the linear relationship between two variables, in this case, distance and real transport cost.
The relationship between cost, distance and arrivals.
Notes. standard errors in parenthesis (); *p < 0.05; **p < 0.01; ***p < 0.001.
Dependent variable named in the third row.
Firstly, as suggested by Figure 2, the non-linear relationship between distance and tourist arrivals is explored in the column marked “Equation (1)”. As expected, the relationship is significant indicating that tourist arrivals decrease with an increase in distance, but that a turning point is reached. Column (2) explores the nonlinear relationship between travel cost, measured by real flight fare, and distance. It is evident that the nonlinear relationship is significant, with cost first decreasing as distance increase, and then reaching a turning point after which it increases. The R-squared indicates that almost 58% of the variation in travel cost is explained by distance. This result also adds to the results in Table 2 (the linear relationship between transport cost and distance) and shows the relationship is in fact non-linear.
Because there is a significant relationship between travel cost (airfare) and distance, there is a possibility that travel cost may mediate the relationship between tourist arrivals and distance. Column (3) first establishes whether there is any direct relationship between travel cost and tourist arrivals, and again it is evident that the relationship is significant and non-linear. This paves the way to include both distance and travel cost together in the specification (column (4)) and from the results it is evident that both exert a significant influence of similar form on tourist arrivals. The decline in the coefficients of distance (compare the coefficients in column (4) with that in column (1)) when both travel cost and distance are included, is an indication that partial mediation takes place 3 .
To test whether transport cost moderates the relationship between distance and tourist arrivals, both variables are included as independent variables (also in nonlinear form) with an interaction variable, in Column (5). The insignificance of the interaction term is an indication that there is no moderating effect taking place. Hence, from this analysis, we conclude that transport cost partially mediates the effect of distance for tourists and that both transport cost and distance have a significant effect on tourist arrivals. These findings have serious implications for modelling the effect of distance on tourism demand.
Accounting for travel cost and non-linearities in a gravity specification
Gravity model estimates.
Notes. standard errors in parenthesis (); *p < 0.05; **p < 0.01; ***p < 0.001.
Dependent variable named in the third row.
Column (2) reports the results when non-linear distance is added, similar to the classical distance decay formula. While all the other variables remained largely unchanged, the inclusion of a non-linear distance variable renders all the distance variables insignificant. Columns (3) and (4) report the results when real airfare instead of travel distance is considered. The results of the other variables again remain quite robust, irrespective of whether real airfare or travel distance is considered. In this sense, the result provides confidence in the inclusion of travel distance in a gravity specification when travel cost is not available. However, unlike the non-linear specification of distance, adding the square of real flight fare does not cause any of the travel cost variables to become insignificant and therefore, it captures the non-linearities we know to be present, effectively.
Since we saw that there is not full mediation, both variables can also be included in the specification. This is shown in Columns (5) and (6) of Table 4. When the natural log of each variable is added, they both are significant, although the magnitude of their influence on tourist arrivals diminishes, again confirming that partial mediation takes place. Similar to the results when only travel distance is included, the inclusion of the squared variables to account for non-linearities again render the distance variables insignificant. However, the travel cost variables remain significant and can capture the nonlinearities due to distance decay.
Discussion
The findings of this paper have strong methodological and policy implications. Firstly, the graphs indicate that distance decay still exists although it often does not conform to the traditional definition or shape. Similar to McKercher and Lew (2003), the shape of the distance decay curve often exhibits 2 peaks, and in the East African case, also up to 3 peaks. The ETEZs exist for geographical and economic reasons and differ per destination. The presence of the Sahara Desert and the Indian Ocean in close proximity to several destinations generates natural Effective Tourism Exclusion Zones (ETEZs), as these vast sparsely populated or uninhabited areas suppress tourism demand over intermediate distances. This is especially obvious for the island economies, showing a first peak further away from the origin and even becoming more distant over the years, which may indicate a significant shift towards more distant origin markets, such as China.
Although East Africa is undergoing economic expansion and improving connectivity, it remains a relatively low-income region with limited intra-regional travel propensity. By contrast, in more developed regions such as Western Europe, the bilateral travel flows are dense and geographically concentrated due to countries being both major-tourism generating and popular destination countries. In such contexts, the first peak in the distance-decay function is expected to occur at substantially shorter distances, reflecting higher disposable incomes, greater mobility, and integrated transport systems. This contrast underscores the importance of economic development and connectivity in shaping the spatial structure of tourism demand.
In the case of East Africa, the emphasis is still on long distance arrivals and much less reliance on neighbouring countries. Contributing factors may be the low levels of development within the region and less accessibility due to limited transport infrastructure linking countries (Meichsner et al., 2018; Njoroge and Samunderu, 2021). However, this is changing within the East African Community, which is experiencing increased investment in infrastructure, and higher overall economic growth. Therefore, in future, this changing economic landscape may be reflected in a leftward shift of the and possibly a more pronounced first peak, to account for increasing inter-regional arrivals.
Secondly, the correlations between distance and transport cost revealed a mixed bag of results. Interestingly, the correlation coefficients mostly increased between 2005 and 2010, signifying an increase in airfare. This may be attributed to the oil prices that spiked during 2010-2011 and airlines that reduced airline capacity (BBC, 2011). The linear relationship between airfare and geographical distance mostly declined in 2015 compared to 2010, indicating a weakening of the relationship, but it still remains significant and positive. This may be attributed to the penetration and increasing market shares of low-cost airlines such as Fly540, Fastjet and Jambojet which started operation in 2011, 2012 and 2014 respectively improving the interregional accessibility.
Thirdly, our results show that airfare does not moderate geographical distance for travelling to East African countries. However, partial mediation does occur, and this holds two important implications. Firstly, the decline in travel cost brought about by transportation developments in East Africa is partially cancelling the negative effect of geographical distance of the region for tourists. This makes the region more accessible for tourists. Secondly, it implies that distance can still be used to measure the effect of travel cost on tourism demand, since airfare data are difficult and expensive to obtain.
Fourthly, the gravity model results indicate that the distance variable is significant and negative, but not the squared coefficient, implying that within the standard gravity model, the non-linear relationship between distance and tourism arrivals are insignificant for the region. However, when airfare is considered, the non-linear relationship with tourism arrivals is significant, indicating that airfare more accurately captures distance decay effects in the gravity model. Since there is not full mediation, we also include both distance and airfare within the gravity model and again the results show that airfare partially mediates the negative effects of distance. This indicates that the development of more air traffic to the region reduces the geographical distance effect for tourists and contribute towards the development of the region as a tourism destination. The significance of the squared variable is also an indication that within the region, remoteness may be viewed as attractive.
Finally, our estimations also included controls for economic and cultural distance and in all instances, we find the economic distance variables to be positive (the GDP and population variables). The cultural proximity variables are also positive and significant, confirming the positive effect of cultural proximity on tourism flows. Finally, we find strong positive effects for neighbouring countries, which indicates to inter-regional tourism effects. As indicated above, this may in future increase even more due to the East African Community and growth in regional co-operation.
Conclusion and implications
The aim of this paper was to thoroughly investigate distance decay within the East African region. It adopts a gravity model approach but departs from the standard model by including both distance and airfare as explanatory variables. The results mostly support the literature and confirm that cultural proximity control variables, such as having a common boarder, speaking a common language and having colonial ties are highly significant in explaining arrivals in East Africa. As excepted, the result also show that distance has a negative impact on arrivals. However, the novelty of the paper lies in its findings regarding distance decay and the partial mediation that takes place when both airfare and distance are included as proxies for transportation cost, validating the inclusion of both explanatory variables in demand models.
The findings also point out to the weak correlation between airfare and distance, which can be explained by market imperfections, making closer destinations more expensive to travel to due to lack of adequate transport supply and connectivity. The paper demonstrates that the relationship between distance and arrival is, however, not linear. Further increases in distance in fact increases arrival. This partially dismisses the distance decay theory, which stipulates that tourism flows from neighbouring countries should be higher yielding an exponential decline in arrivals when compared to distance. The findings here, supports McKercher and Lew (2003) and find that there are up to 3 peaks in the distance decay curves. For island destinations, the peak is further away from the origin on the graph due to their remoteness. For other destinations, lack of connectivity and lower development levels from neighbouring countries may explain their lower share of arrivals from these markets.
The pattern, however, has not remained constant over time. For countries such as Uganda and the Comoros, the shape of the distance curve has changed. Seychelles for example, has moved from 1 peak at round 8,000 kms to 14,000 kms. This is a clear indication of the rapidly transformation that these destinations have undergone resulting from market diversification. Remoteness continues to be an attraction for certain markets.
The findings suggest that tourism policy in East Africa must move beyond conventional distance-based assumptions and recognise the region’s structural constraints and evolving market dynamics. First, the persistence of distant peaks highlights continued dependence on long-haul markets, implying a need to actively stimulate intra-regional tourism demand through visa facilitation, regional marketing, and cross-border tourism products. Strengthening regional flows would improve resilience and reduce exposure to external shocks.
Second, although connectivity is improving, the limited propensity for intra-regional travel indicates that infrastructure investment alone is insufficient. Policies must also address affordability and income constraints by supporting competitive airline markets and lowering travel costs, since our results indicate that airfare lowers the distance effect. This reinforces the importance of cost reduction strategies, including route development, low-cost carriers, and pricing coordination with industry stakeholders.
Third, the results underscore the need for market segmentation strategies, as multi-peaked distance-decay patterns reflect distinct demand clusters across regional, intermediate, and long-haul markets. Tailored marketing and product differentiation are therefore essential.
Finally, the findings highlight that distance-decay patterns are context-specific and evolving, implying that tourism planning should be dynamic and evidence-based, supported by continuous monitoring of demand patterns and changes in connectivity.
Since the research focuses only on one region in Africa, future research could expand the current research in terms of both geographical coverage within Africa, as well as temporal coverage to determine the effects of the recent COVID-19 pandemic on perceptions of distance and remoteness.
Future research can attempt at further explore the concept of ETEZ by modelling the segmentation of tourism demand across neighbouring, regional, and long-haul markets, allowing for heterogeneity in both distance and cost elasticities. In addition, the role of airline hub networks and route structures merits closer scrutiny, given their influence on pricing, connectivity, and effective accessibility. Finally, future work could address the potential endogeneity of airfare, recognising that transport costs are jointly determined with demand and shaped by airline network dynamics and market conditions which is not fully captured in this study.
Footnotes
Funding
The research was not funded by any institution, although the School of Economic Sciences at the NWU purchased data for the paper.
Declaration of conflicting interests
The authors declare no conflict of interest.
Data Availability Statement
The airfare data was purchased from IATA and are subject to rules that do not allow the authors to share the data.