
Abstract
The 2015 General Election in the United Kingdom was the first to take place in the United Kingdom with Twitter as an important part of the social media landscape. This pilot project looked at 16 constituencies along England’s South Coast in order to investigate what impact, if any, Twitter had had on both the campaign and the result and to investigate the efficacy, or otherwise, of using Twitter as a tool for studying election campaigns in terms of candidate and local party activism. On the basis of an analysis of almost half a million tweets, the analysis concluded that there appeared to be a correlation between the rate at which parties and/or candidates responded to incoming tweets and their relative electoral performance but this was not demonstrable for all parties (it applied in particular to Labour and UK Independence Party candidates). In addition, high rates of reply also appeared to have a positive impact on constituency turnout figures. The findings are not yet conclusive but suggest that Twitter could be a good indicator of general levels of local party activism. The research also sought to understand how candidates used Twitter differently and established a number of candidate ‘classifiers’. It also investigated the issues agenda that was dominating Twitter conversations during the campaign and found that Twitter’s agenda was closer to the public’s than was that of the national media. The research also monitored the regional and local media in the 16 constituencies and discovered that their issues agenda was closer still to the public’s. Overall, it is difficult to conclude that Twitter had a major impact on the election campaign and result.
Introduction
This project has its origins in research undertaken by the author during the general elections in the United Kingdom in 2005 and 2010 (Gaber, 2006, 2013). In those elections, the author sought to investigate the relationships, if any, between the issue agendas of the parties, the media and the public during the campaigns. This was done by comparing the subject matter of the press releases that the parties issued during the course of the campaign and then comparing this with the priorities of the media (broadcast and print) and the public’s, as identified by the opinion polls. The same exercise was repeated in 2010, and although the data were sufficient to enable some valid comparisons to be made between the two campaigns, it proved to be somewhat problematic because, whilst in 2005, it was relatively straightforward to identify what was, and what was not, a press release, in 2010 it was not. For, in addition to sending out press releases, the parties were also blogging, posting on Facebook and Twitter and uploading on YouTube and so forth, and this made the job of identifying a press release, per se, more difficult to define with any precision.
This research project – which covered 16 constituencies on England’s South Coast – was designed to look at the role of social media in the campaign more broadly. Twitter was the main focus, because the vast majority of its data is publicly available, as opposed to Facebook, where the vast majority lies behind privacy settings. In the event, the research questions investigated were the following: Is it possible to establish any sort of relationship between Twitter activity and electoral performance at a constituency level? To what extent is it possible to establish a relationship between Twitter activity and turnout at a constituency level? To what extent does the Twitter issue agenda reflect that of other media and of the public? Did the parties use Twitter differently? Can we identify distinct typologies of candidates in terms based on their Twitter activity?
Literature review
This section looks at debates in two broad areas. The first is the impact of the Internet in general, and Twitter in particular, on election campaigning, with special reference to the UK experience. This relates to some of our findings as to how politicians and parties used Twitter in the constituencies we covered. The second part of this section looks at debates around whether individual constituency campaigns make any real difference to electoral outcomes, given that elections are now, and have been for many years, about national campaigns conducted largely through the national media. The issue of voter motivation is also investigated in terms of understanding the extent to which campaigning by individual candidates might have any sort of impact on voting behaviour. This relates to our attempts to explore whether any links can be established between candidates’ Twitter activity and their electoral performance.
The impact of the Internet on political parties has been debated for almost as long as the Internet has existed, but the arguments have crystallized around moments of political insurgency such as the ‘Green Revolution’ (that wasn’t) in Iran following the 2009 election and the Arab Spring (that rapidly turned to winter) in 2010 and 2011. Both these events led scholars and commentators to see the Internet as a powerful tool for incubating, and even facilitating, social change. Clay Shirky (2008) in Here Comes Everybody (writing before these events) was one of the most powerful voices arguing for a direct link between social media and social movements and social change, which has become, to a large extent, the conventional wisdom. But Sharkey’s work has also attracted criticism. Tara Brabazon, for example, has suggested that Shirky’s ‘everybody’ excludes ‘older citizens, the poor, and the illiterate’. She also argues that the ‘assumption that “we” can learn about technology from technology – without attention to user-generated contexts rather than content – is the gaping, stunning silence of Shirky’s argument’ (Brabazon, 2008).
Perhaps the most substantive critique of the ‘internet will solve all our problems’ school of thought has come from Evgeny Morozov (2009) who in The Net Delusion argued that the Internet has simply increased the power of repressive authorities to repress. He demonstrated how the so-called ‘Twitter Revolution’ in Tehran, when large crowds gathered to challenge the result of the presidential election, appeared at a time when the number of Twitter accounts registered in Iran was barely in three figures. As far as the relationship between social media and the Arab Spring is concerned, the consensus among scholars is that whilst Twitter and Facebook were useful mobilizing tools, the real causes of the uprisings were located deep in the current political and social reality, an argument also made by Paula Gerbaudo (2012) in Tweets and the Street.
However, on the somewhat more mundane level of the impact of social media on political campaigning in relatively stable Western democracies, it has been argued that these new technologies provide parties with the opportunity of refreshing and renewing their internal organization and their ability to mobilize members and supporters (Margetts, 2006). This has been termed the ‘normalisation’ hypothesis – Norris (2003) and Hindman (2009), for example, argue that the Internet has simply increased the power of existing elites and reinforced old political and media structures. Rachel Gibson who was one of the first UK scholars to investigate the impact of the Internet on politics has (with McAllister) recently argued that the web may be rebalancing if not equalizing party competition (Gibson and McAllister, 2015).
Turning to social media more specifically, a number of studies have sought to demonstrate the extent to which social media have become important components in the political landscapes of pluralist democracies. But most studies have found that the social media’s ability to increase the amount of interaction between politicians and voters – the particular characteristic of social media – has been relatively limited (e.g. Coleman (2001) and Lilleker and Jackson (2010)). As Stromer-Galley (2013: 187) has observed, in the context of US elections, politicians have seen ‘empowering’ the public, which is almost the sine qua non of social media, as a potentially threatening activity. Hence, politicians have tended to treat social media as just one more arrow in their campaigning quiver, rather than seeing it as a way of directly interacting with voters on a more equal footing than previously. Although it should be noted that a study of Twitter use by politicians in the United Kingdom has suggested that in the 2010 UK General Election, 19% of all candidates’ tweets in that election involved at least an element of voter interaction (Graham et al., 2016: 710).
There have been suggestions that Twitter, in particular, is little more than an ‘echo chamber’ in which users tend only to engage with other users whose political views they share, thus tending to limit its ability to act as a genuine space for political interaction – a distorted digital public sphere. But Barberá et al. (2015) in recent research suggest that this is only the case when users are discussing issues that could be seen as overtly ‘political’. But since, when discussing more general news or other items, people tended to interact with people irrespective of their political leanings, giving it some value as an electronic meeting place, they conclude ‘previous work may have overestimated the degree of ideological segregation in social-media usage’ (p. 1531).
In a recent article, Vaccari and Valeriani (2015), in an analysis of the 2014 European Elections, have taken a more nuanced view suggesting that the ‘mobilization’ versus normalization debate reduces a complex process to an oversimplified binary. Instead, they suggest Internet campaigning has led to a ‘reconfiguration of political engagement that involves both “usual suspects” and newcomers’ (p. 4). They go on to argue that whilst new technologies in themselves do not create revolutions in social activity, by suddenly making politics compelling for those who have had low levels of interest, it can increase interest among those who had previously evinced little concern with politics, converting them, if not into activists, at least into part of the engaged public.
One of the key functions of Twitter during election campaigns is as a means of involving supporters as ‘co-producers’ of the campaign or at least of its messaging (Jensen, 2015). The extent to which this is more perception than reality is debatable and varies from country to country and party to party. Most campaigns tend to be top–down affairs in which party supporters are the ones ‘mobilized’ but are, in general, not required to do more than follow a set of predetermined activities. If they chose not to accept this role, they are often viewed as not part of the formal campaign (Nielsen, 2012). This view was reflected in Jensen’s research into how party leaders and national parties used Twitter in the 2015 campaign in the United Kingdom. He found that whilst attempts had been made to utilize Twitter’s interactivity, and parties had on occasion sought to personalize the messaging, overall this had not led to ‘a transformation in campaign messaging’ (Jensen, 2015). In other words, the parties, at a national level, failed to exploit the sender/receiver duality that Castells (2009) identified as the crucial nexus in the ‘networked society’.
When considering the role of social media in election campaigns – and in particular in terms of agenda setting – Chadwick’s notion of media ‘hybridity’ is an extremely useful approach. He conceptualizes contemporary media systems as no longer consisting of ‘old’ and ‘new’ media but best viewed as an integrated system in which most, although not all, media have some form of hybridity – newspapers with video and audio feeds, Twitter and Facebook accounts and so forth (Chadwick, 2013). This means that the ‘Twittersphere’ should not be viewed as a discrete media environment as such but one which is in response to, responds to and is heavily penetrated by, all other media forms. 1 Because political campaigners remain highly attuned to conventional media systems, much of their activity on social media tends not to be a tailored response to a new form of communication but is more an adaptation of traditional ways of political campaigning, compressed to 140 characters, or whatever the social media being used requires.
On the question of voting behaviour and the potential influence of Twitter specifically, Murthy (2012: 66) points out that it is erroneous to believe that for most Twitter users, news, and during an election campaign that means political news, is at the centre of their online browsing. He characterizes individual’s Twitter timelines as being akin to having a radio playing in the background and only if the Twitter user becomes interested in a particular news story, does it move from background noise to the centre of his or her attention. In this ever-changing environment, Castells argues that those voters that are not passionately involved in politics (and that is the vast majority) do not go to great lengths to familiarize themselves with the detailed policies of the parties or candidates who they are thinking about supporting. Instead, despite the cornucopia of information at their disposal, they tend to fall back on legacy media reports of the candidates and their positions; thus their perception of political choice tends to be ‘embodied in the persons of the candidates’ (Castells, 2007: 205).
However, it is because of this very embodiment that the social media in general and Twitter in particular has been much utilized by politicians to establish their own ‘authenticity’ (Enli, 2015a, 2015b; Margaretten and Gaber, 2014). Enli talks about politicians attempting to establish their own ‘ordinariness’ by allowing voters ‘glimpses from the private sphere’ (Enli, 2015a: 137). These glimpses appeal, in particular, to those voters who are not particularly interested in politics. One candidate in the area of our research commented: ‘Tweeting about “normal” things like baking, music or running tended to be more likely to get engagement from non-politicos.’ 2
The importance of voters’ perceptions of candidates’ authenticity has been a theme of much scholarship, certainly for the past three decades. One of the most influential studies of voting behaviour in the United Kingdom (Himmelweit et al., 1985) identified that a key factor in voting decisions was how voters responded, as individuals, to candidates and campaigns. Twenty years later, Lay and Redlawsk (2006: 55), in a study of the same name, but based in the United States, found that voter cognition of the candidate and campaign environments were important, but they argued that in processing information, voters were, in a digital age, playing a significant role in shaping their own personal information environments, rather than seeing it as fixed and exogenous (55). This ability – in a digital electoral landscape – to shape individual information environments makes it much more challenging to understand and theorize voting behaviour when the number of individual media commonalities is forever shifting and shrinking.
As to the extent to which individual constituency campaigns can make a measurable difference to election outcomes, one of the popular ‘conventional wisdoms’ of electoral politics is that constituency campaigning is largely irrelevant in terms of national electoral outcomes; as Denver and Hands wrote in their study of the 1992 UK General Election, ‘Among political commentators and analysts…the dominant view is that constituency campaigns are anachronistic rituals which have little, if any, effect on election results’ (Denver and Hands, 1992: 528). However, based on their own survey of constituency activity, they demonstrated that local campaigning had made a significant difference both to the result and turnout. They calculated that local campaigning had benefited Labour in the 1992 election by two percentage points and the Liberals (as they then were) by four percentage points. They also calculated that intense local campaigns had increased turnout by an average of five percentage points.
Four elections later, Pattie and Johnson (2010) found that local campaigning in the 2010 UK General Election had still had an observable electoral effect, although they noted that campaigning by one party in a constituency can, and frequently did, stimulate campaigning by the other local parties, to some extent, nullifying each other’s efforts. The impact on turnout in 2010, according to Pattie and Johnson, was marked with constituencies that had seen an intense local campaign, experiencing turnouts roughly 5% greater than the national average.
A study from the United States appears to contain compelling evidence of the direct impact of Twitter on electoral performance. Di Grazia and colleagues (Di Grazia et al., 2013), using a database of more than half a million tweets during the campaign for the 2012 US midterm elections, found that the percentage of Republican candidate name mentions correlated with the Republican vote margin in the subsequent election; a finding that persisted even when all relevant variables, including incumbency, district partisanship, media coverage, time and demographic variables were taken into account.
Writing (somewhat presciently) in 1992, Denver and Hands suggested that the then advances in information and communications technologies (the growth of computers and the ubiquity of faxes and pagers) were tending to make local campaigning ever more important (1992). Whenever a new technology comes along that might be employed by political campaigners there is, as Enli points out, an optimistic belief that this will ‘democratize political debates and … empower the people in relation to the power elites, [but] most often with disappointment as a result and never more so than with the advent of Web 2.0 and the growth of social media’ (Enli, 2015a: 1). Was this the reality in 2015?
2015 General Election
For the 2015 UK General Election, the research focussed on the parties’ use of social media and Twitter in particular. The project followed 16 seats along the south coast of England, stretching east to west from Margate to Southampton, enabling us to investigate Twitter’s impact on a wide range of different seat typologies. These included nine seats held by the Conservatives, of which five were targeted by UK Independence Party (UKIP) and three by Labour, four seats held by the Liberal Democrats, all of which were targeted by the Conservatives and two Labour-held seats both targeted by the Conservatives. It also included Thanet South (being contested by Nigel Farage, leader of UKIP) and Brighton Pavilion (held by Caroline Lucas, Britain’s only Green Party MP). In the event, the Conservatives held all but one of their nine seats and took four seats from the Liberal Democrats and one from Labour. They successfully resisted UKIP leader Nigel Farage in Thanet South and lost just one seat – Hove – to Labour. The Greens held their one seat and Labour held on in Southampton Test.
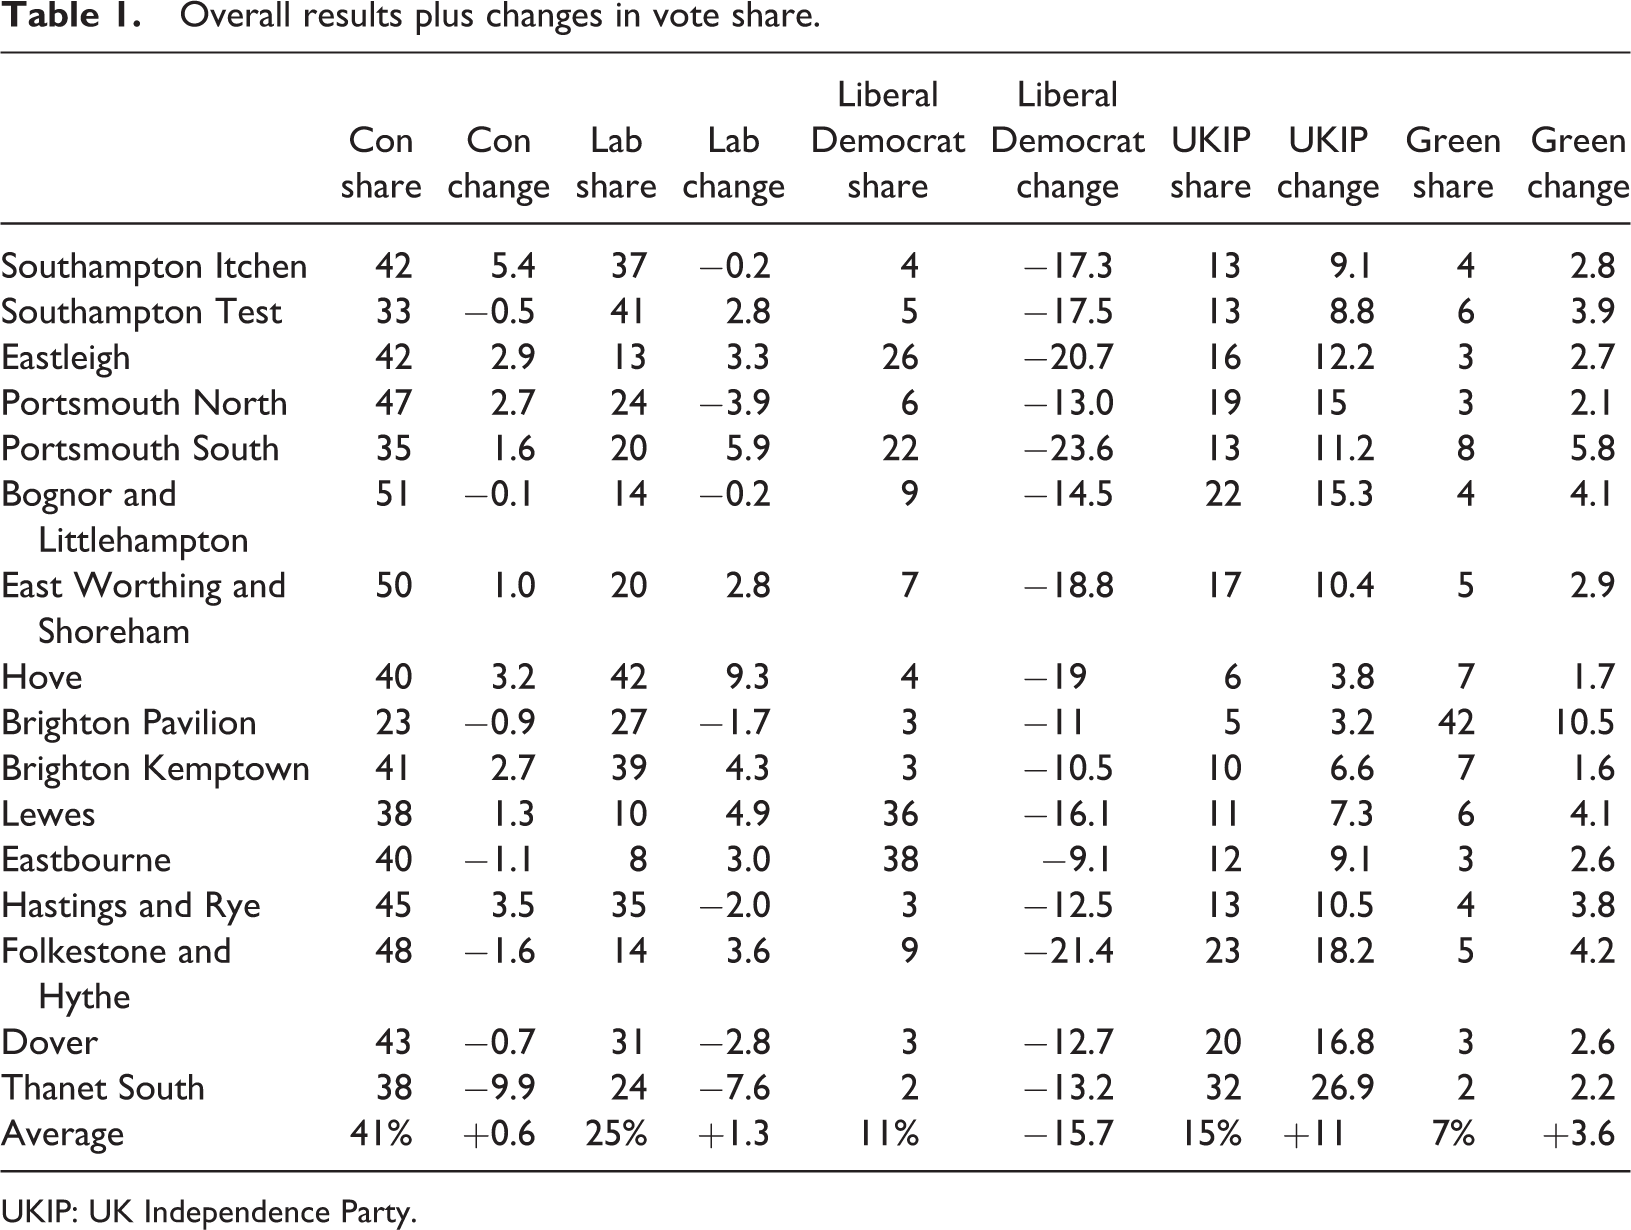
Given the increasing variety of party competition at constituency level across the South (some are primarily Conservative/Labour contests, some are Conservative/Liberal Democrat and many now incorporate significant challenges from UKIP and Green candidates), the classic two-party swing is an increasingly outmoded measure of electoral change. Hence, change in vote share between 2010 and 2015 is the preferred measure of electoral performance; this is not entirely satisfactory given that UKIP was hardly a factor in 2010 but, nonetheless, is a more useful guide than swing, which is essentially a measure of changes in support between two parties.
In our selected region, the change in the vote share is shown in Table 1. Overall, the Conservatives were up on 2010 by +0.6%, but this concealed a wide range (excluding Farage’s contest in Thanet South) from +5.4% in Southampton Itchen to –1.1% in Eastbourne. Labour’s average vote change was +1.3%, but their performance ranged from +9.3% in Hove to –3.9% in Portsmouth North. UKIP’s average vote change (excluding Thanet South) was +11% and ranged from +18.2% in Folkestone and Hythe down to +3.2% in Brighton Pavilion. The Liberal Democrats’ average vote change was −15.7% with their best, or least bad, performance being −9.1% in Eastbourne and their worst in Portsmouth South 3 of −23.6%. The Green Party averaged an increase in their vote share of +3.6%, with their best performance (excluding Brighton Pavilion) being +5.8% in Portsmouth South and their worst +1.6% in Brighton Kemptown.
Overall results plus changes in vote share.
UKIP: UK Independence Party.
Methodology
The research utilized a software tool – Method52, a Natural Language Programming (NLP) algorithm developed jointly by Informatics scholars at the University of Sussex and the Centre for the Analysis of Social Media at the think-tank Demos. It is based on NLP and analyses language and metadata for selected Twitter accounts. 4
The Twitter feeds of the five main parties and/or their candidates in our 16 constituencies – that is, all Tweets from candidates and local parties and all Tweets that mentioned (@) candidates and local parties – were collected and analysed. 5 We also monitored any mention of social media in the context of the campaign in our constituencies on local, regional and national press, radio and television (TV) and major news websites. In addition, because we wanted to focus particularly on the Brighton and Hove seats, we monitored the public Facebook pages of the respective parties and candidates in the three seats there as well as the Facebook and Twitter postings of all the main campaigning groups in the city. We also undertook email surveys of all the candidates and parties in our area and the local political journalists and editors who had been involved in reporting the campaign.
Tweets were collected between 31 March and 7 May 2015 inclusive (the ‘short campaign’). We collected just over 26,000 outgoing tweets sent by candidate and constituency party accounts and almost 460,000 incoming (@) tweets mentioning one of these accounts. Overall, tweets to these accounts greatly outnumbered tweets from them (by a ratio of 17:1). We had two obvious outliers – Nigel Farage, leader of UKIP, who received on average 8500 tweets per day over this period and Caroline Lucas, who received a daily average of 1393 tweets. The other candidates and parties received, on average, only 32 tweets per day. Excluding tweets to Farage and Lucas, the ratio of incoming to outgoing tweets was just 2:1 – a relatively meagre return on the efforts of the parties and candidates.
Politicians and journalists in the Twittersphere
Our survey of candidates suggested that Twitter was more utilized by the minor parties than the major ones. 6 A minor party candidate said his most effective use of Twitter was as a means of reaching local journalists who were among his followers: ‘it helped me get the odd quote into articles that might not otherwise have happened’. 7 Another said that Twitter had been a useful campaigning tool, ‘it showed we were “on the ball” on topical issues as they broke and had something to say – it also led to many “retweets” showing the level of support for our policies’. 8 However, as was probably the case with the national campaign, this candidate felt that Facebook had been far more useful. It was, he said, ‘more flexible than Twitter and capable of detailed policy/campaigning posts. We also found that paying for boosting Facebook posts was very effective at reaching beyond the usual Facebook suspects and supporters – we reached many hostile people that way and engaged in many debates with them over policy’. 9
Candidates from the two main parties tended to be than less enthusiastic about Twitter. ‘Moderately important’ was how one described it and went on to say: ‘We could demonstrate what activity we were doing locally, but we were also aware that we were not talking to the general public en mass – rather to a political bubble.… It was useful for re-butting inaccurate accusations by opposition candidates’. 10 Most agreed that Facebook was a more useful campaigning tool, using Twitter mainly for posting photos and to broadcast campaign activity, although this did have some positive effects: ‘Feedback from voters often said they thought I had “energy” because they saw what I was up to on Twitter [and] campaign groups liked it if I re-Tweeted them and felt supported’. 11 But Twitter was also seen as potentially problematic when it was used as a means of attack by opponents, particularly when based on a tweet from a supporter who had inaccurately represented the candidate’s views. One major party candidate was succinct – ‘It was not an effective campaigning tool’, she said. 12
The journalists we surveyed were almost equally guarded in their use of Twitter. One of the newspaper editors we surveyed said of Twitter: ‘We used it extensively to check stories but try not to use it directly. We do not simply want to become a Twitter conduit. However sometimes needs must’.
13
Another, an editor of a local news website, said that he used Twitter on most days of the campaign but tended only to quote ‘from accounts that I know and have followed’.
14
In terms of assessing Twitter as an election news source he said: Twitter has a place in the long list of useful news sources but my diary, my phone and my inbox remain much more useful. I tend to use Twitter and Facebook for supporting information and as channels to transmit headlines, links and other information about stories on our website.
15
Twitter and electoral performance
In investigating whether we could identify any relationship between Tweets received and electoral performance, we sought to replicate the Di Grazia et al. (2013) finding from the US 2012 midterm elections, which established a strong correlation between candidates’ @mentions and vote share.
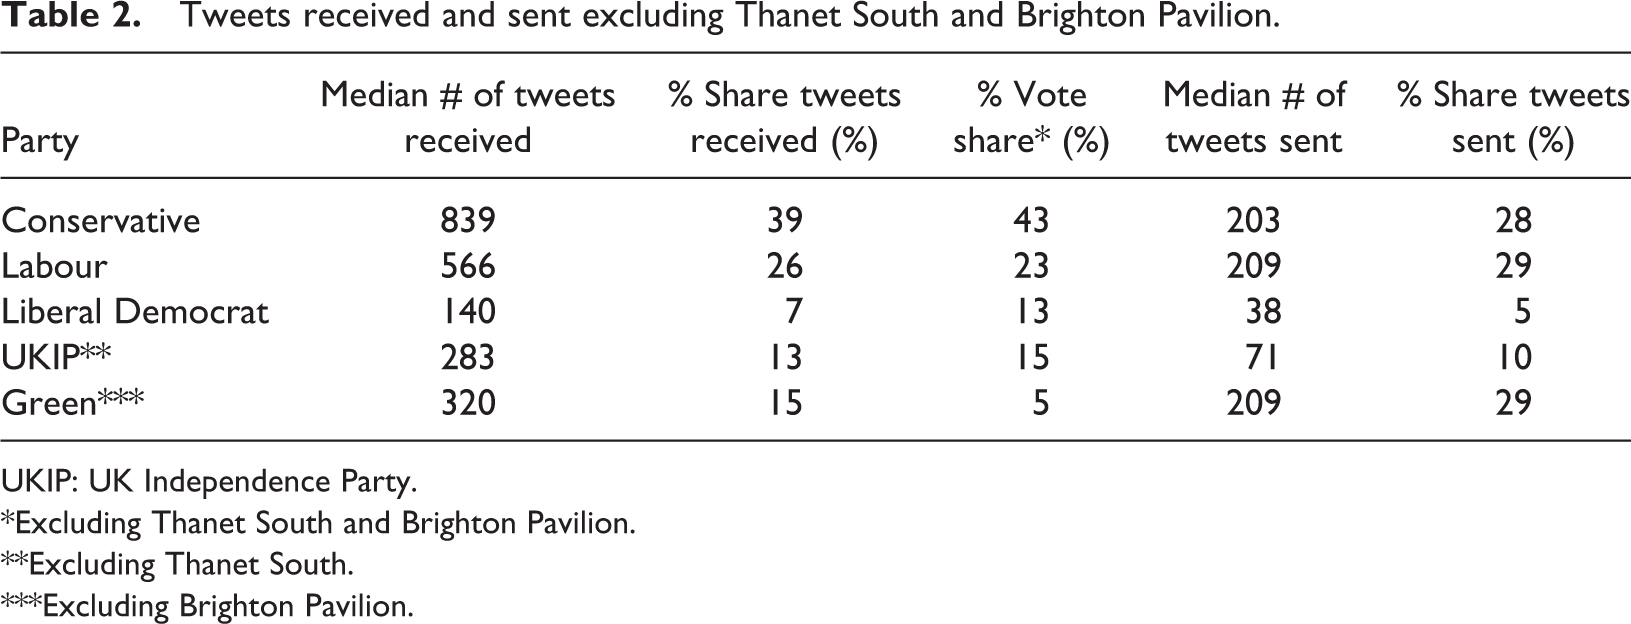
If we look at the pattern of tweets received by our parties/candidates, that is, @mentions, which we are describing as ‘tweets received’, then we see an interesting aggregate pattern. Table 2 shows the median number of tweets received, by account, for each of the parties. This is then translated into a relative received share (median sent and sent share are repeated here for comparison). The median number of tweets received by each of the parties has been translated into a relative received share. On the face of it, there is an apparent relationship, coincidental or otherwise, between Twitter mentions and vote share; particularly with regard to the Conservatives, Labour and UKIP, less so with the Liberal Democrats; and with the Green Party as something of an outlier (though this is probably explained by the high levels of activism in the Green-held seat of Brighton Pavilion). This result is potentially interesting but needs to be investigated on a constituency-by-constituency basis and/or on a broader regional/national basis to be persuasive.
Tweets received and sent excluding Thanet South and Brighton Pavilion.
UKIP: UK Independence Party.
*Excluding Thanet South and Brighton Pavilion.
**Excluding Thanet South.
***Excluding Brighton Pavilion.
All of which suggests that a more sophisticated measure of Twitter activity is required if anything meaningful is to be said about the relationship between Twitter activity and vote share, in particular, a measure that looks at how each candidate made use of the tool in their election campaigning activity. One relatively simple way of doing this is to look at the extent to which candidates, or their parties, replied to direct @mentions. Using this as our analytical tool, we find more substantive evidence that appears to partially corroborate the Di Grazia finding about impact on electoral performance and substantiates the turnout finding, although neither is conclusive.
In Table 3, we show how the parties in our region did in terms of ‘conversing’, that is, what we are calling their reply rates, in other words how often they responded to @mentions.
Tweets originating from the parties/candidates.

UKIP: UK Independence Party.
We sought to correlate the reply rate (@mentions) with final vote share and found a Pearson correlation of just 0.12 (i.e. not significant). However, it was the analysis at individual seat level that proved potentially to be the more interesting (Table 4).
Candidate/party reply rates.
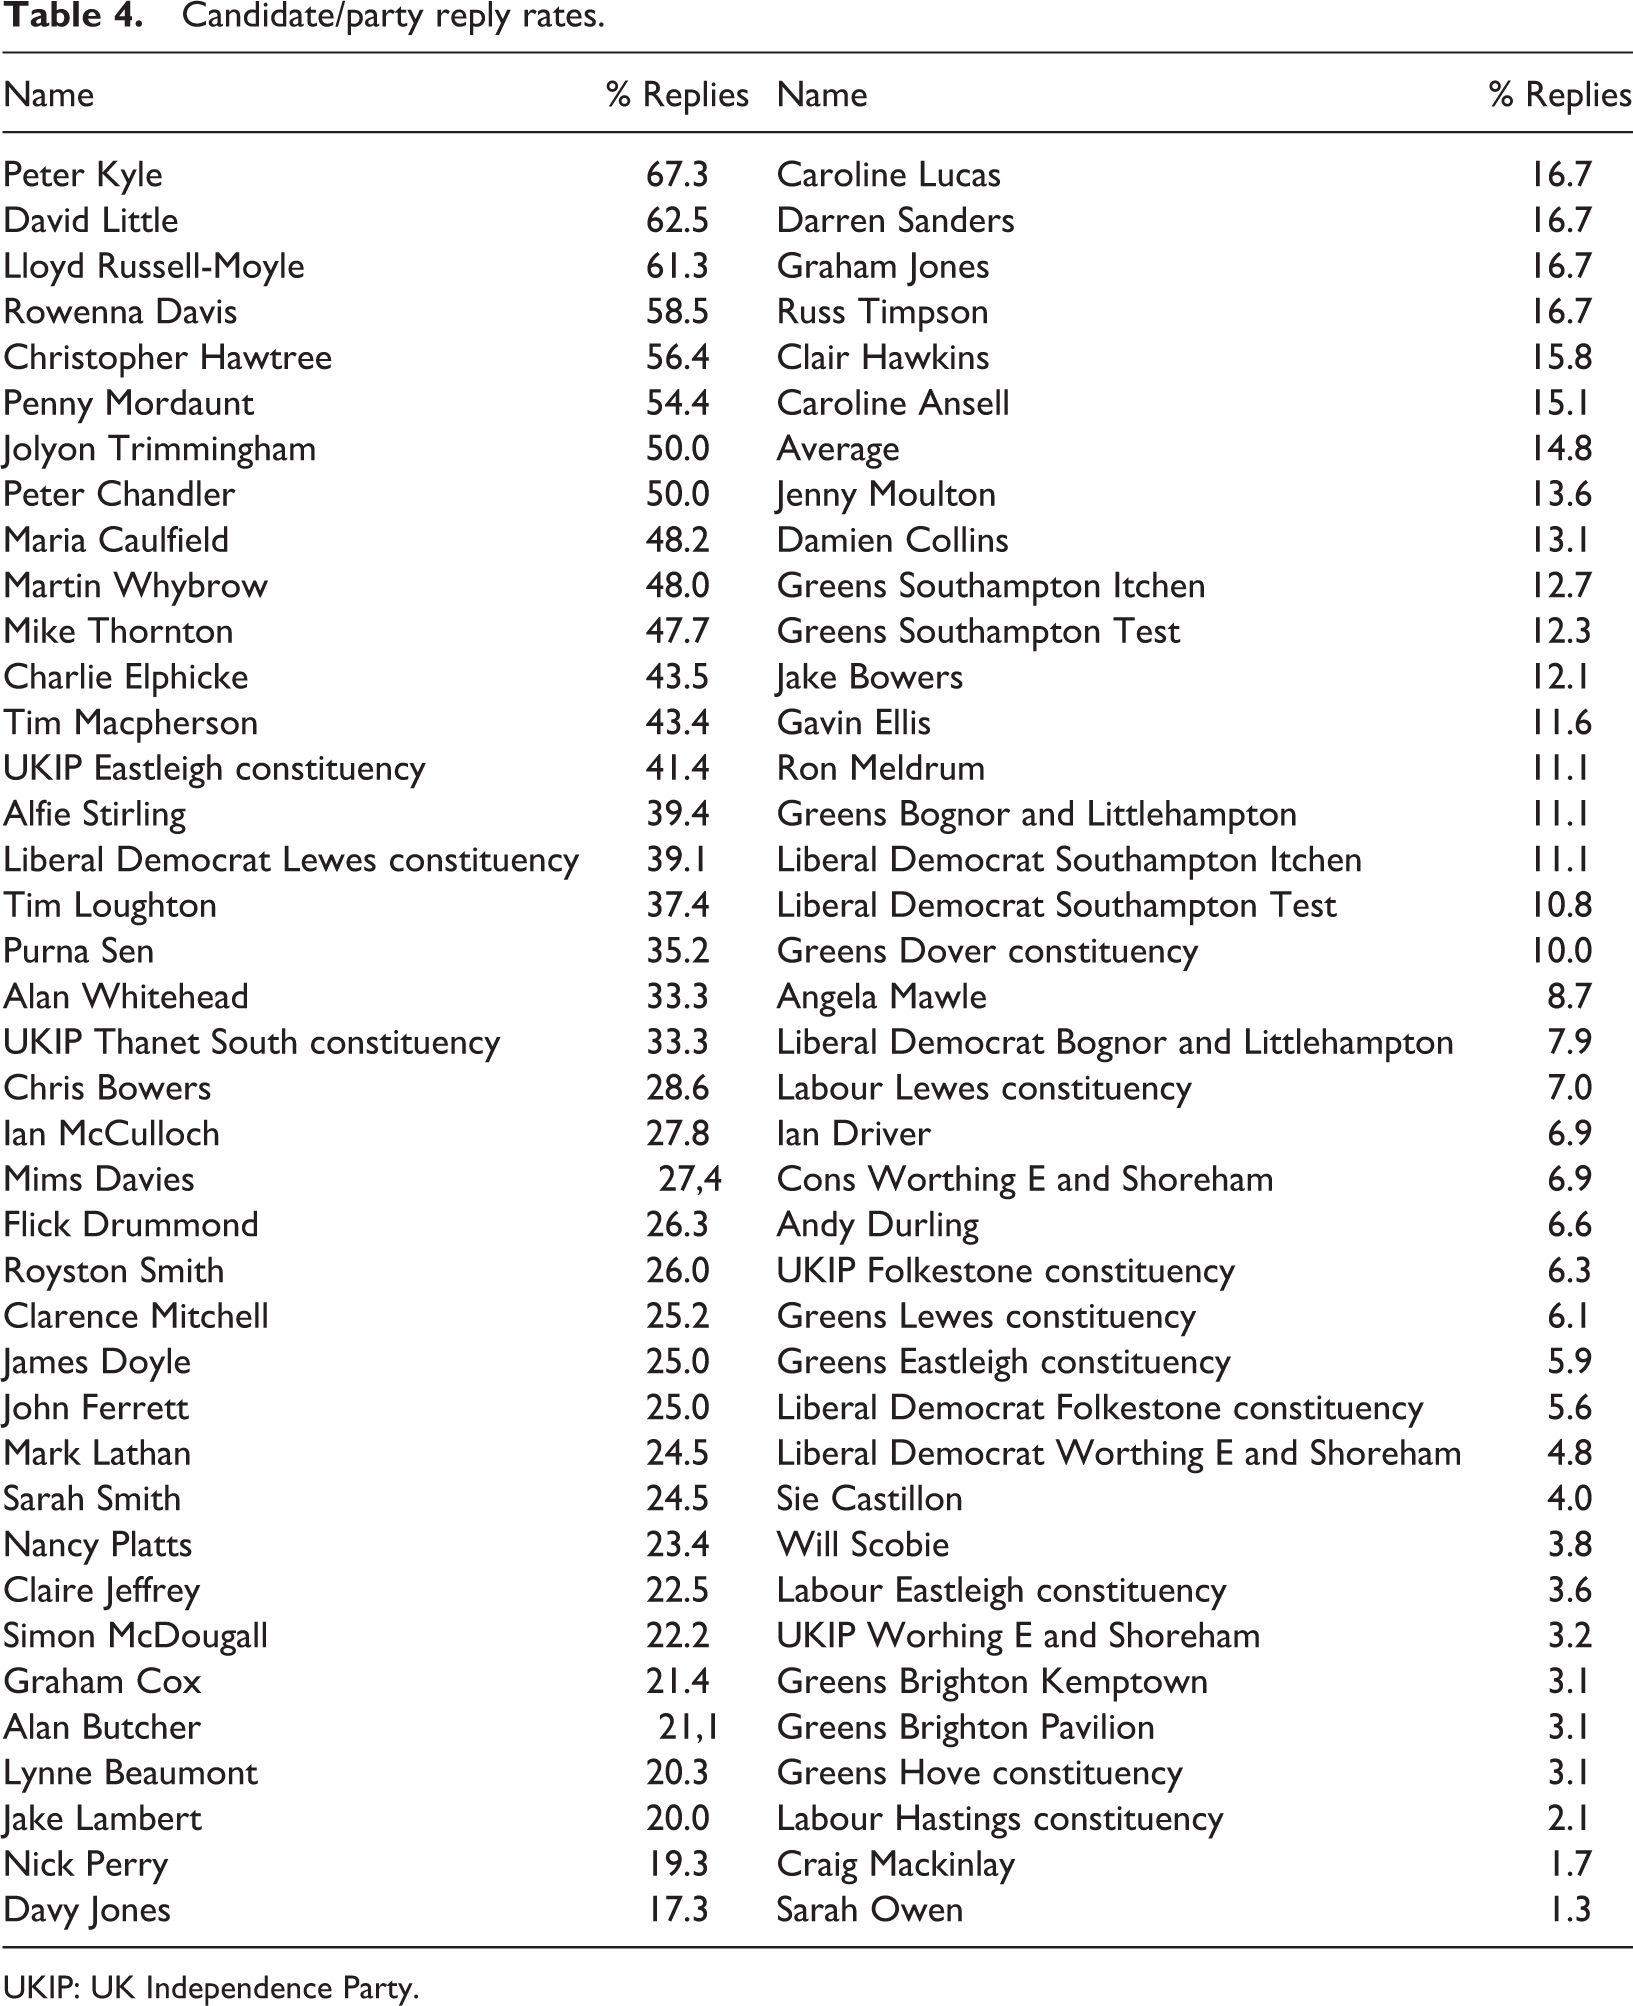
UKIP: UK Independence Party.
We looked for correlations between the ‘reply rates’ of candidates/parties at constituency level and compared them with how they fared electorally and found some potentially interesting correlations. We measured electoral performance by looking at the difference between the change in a party’s constituency vote share between 2010 and 2015 and the change in the same party’s national vote share 2010–2015. In other words, we used the party’s change in the national share of the vote as a baseline against which to see if a particular candidate fared better or worse, on the assumption that this would tell us something about the impact of local campaign factors (including social media output). The ‘reply rate’ totals both the reply rates of individual candidates and their local party organizations in each constituency (e.g. Caroline Lucas’s score aggregates the replies that came from her personal account with those of the Greens in her constituency).
Most of the correlations we discovered were either non-significant or not relevant to the substantive question at hand. There were only three relationships which proved statistically significant in the expected direction and which pertain to the Twitter–vote share relationship and these were as follows: Labour candidates did significantly better than the Labour Party nationally when the rate at which responded to @mentions (which we characterize as their Twitter reply rate) was high (or worse when it was low): r = 0.487 (p = 0.028). UKIP candidates did significantly better than UKIP nationally when their Twitter replay rate was high (or worse when it was low): r = 0.555 (p = 0.013). UKIP candidates fared significantly worse than UKIP nationally when the Twitter replay rate of their Labour opponents was high (or better when their Labour opponents’ reply rates were low): r = −0.581 (p = 0.009).
The reply rate–vote share relationships were not significant for any other parties. We can speculate as to why these relationships were only established for the Labour and UKIP candidates but without further evidence this is precisely what it would be – no more than speculation. Nonetheless, these findings are suggestive and although far from conclusive do enable us to reasonably infer that this constitutes prima facie evidence that Twitter activity can have a significant impact on electoral performance at constituency level; although it is not certain to do so, it is at least consistent with that possibility. However, before making any stronger claims more data is required: At the very least, it would be extremely useful to add in scores for Facebook activity as well which, given the private nature of most Facebook activity is just not possible. We would also have wanted to control for the candidates’ individual declared campaign expenditures but those figures were not available at the time of writing.
There is one other interesting finding that we can report about Twitter activity and constituency turnout. When we aggregated the reply rates of every candidate (i.e. Tory + Labour + LibDem + UKIP + Greens) in each constituency and then examined the relationship with turnout, we found that it was significant (r = 0.456, p = 0.038). This suggests that the overall level of social media activity (as measured by one very limited indicator at this stage) might have a positive effect in engaging and mobilizing voters.
Interestingly, the relationship holds even when we controlled for the marginality of the seat (r = 0.464, p = 0.041). This is a useful exercise because it is well established that turnout generally tends to be higher in marginal contests than in safe seats (people are more likely to vote because they figure that their vote has a better chance of actually making a difference to the outcome). This relationship holds regardless of whether the marginality measure (i.e. winning margin between first and second candidate in each constituency) is based on the 2010 or 2015 results as the relevant measure (r = 0.470, r = 0.039 for 2015 marginality). It probably makes more sense to use the 2010 marginality score, because that is what voters will have had in mind as the indicator of likelihood that their vote might ‘count’ when deciding whether to vote or not on 7 May.
Candidate segmentation and campaigning
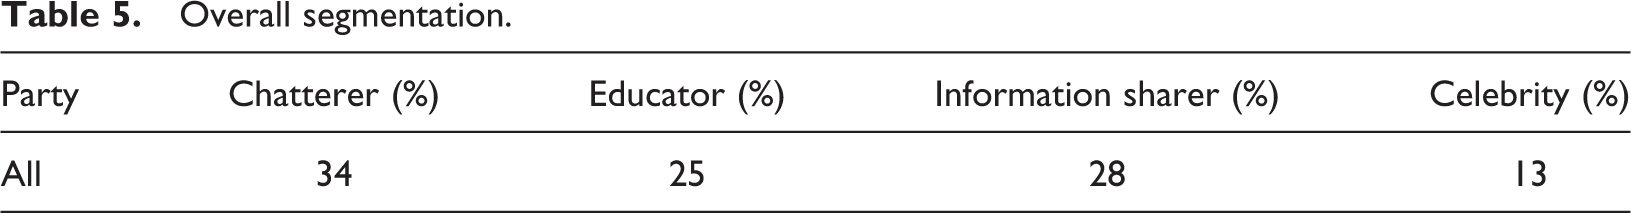
We also investigated how parties/candidates used Twitter differently during the campaign (see Table 5). We did this by creating candidate typologies for the varying ways that Twitter was used, based on the following underlying metadata: number of (#) tweets sent by the candidate (strictly, by account – see above) # replies by the candidate # URLs in tweets sent by candidate # retweets sent by candidate # @mentions in tweets sent by candidate # hashtags in tweets sent by candidate (n.b. not currently used) # @mentions of the candidate (strictly, of the account) in third party tweets
16
Overall segmentation.
For the purposes of segmentation and as a form of simplification/dimensionality reduction, we have developed a small number of indices from these statistics.
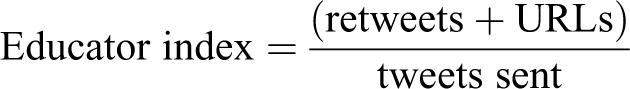
Communicator index – This measures the extent to which the candidate directs his or her communications towards individuals and thus can be perceived as engaging in a direct communication/conversation with the recipient. Tweets that are not directed in this way can either be joined to a broader topic by the use of one or more hashtags (e.g. #bbcqt – although this possibility is ignored in this analysis) or just directed to those following the account, to whom the tweet is broadcast. So a low communication index will indicate somebody who has a tendency to be what we term a ‘celebrity’. The numerator in this case is the number of tweets that are a reply to an inbound tweet (this is recorded in a tweet’s metadata – the tweet will be sent to that account) plus the number of @mentions included in tweets (the tweet will be sent to any such account). So it is a measure of the number of directed messages. The denominator is the number of tweets sent by the candidate. So the index is the average number of directed messages per tweet sent. Note that this figure can be >1, as a single tweet can be directed to multiple specified individual accounts through @mentions.
Educator index – This measures the extent to which the candidate seeks to pass on information, or other peoples’ views, and thus can be perceived as attempting to inform/educate the recipients of the tweet. A high educator index suggests a tendency to be an educator, whilst a low index is suggestive of someone who prefers just to chat/make personal opinions known.
By plotting these two indices against one another, we obtain a measure of the degree to which a candidate acted as an engager and/or as an educator. The median engager index was 1.20 (range: 0.04–2.2). The median educator index was 1.01 (range: 0.21–2.0). Many candidate accounts were scarcely used, and for these analyses, we eliminated accounts that sent fewer than 100 tweets over the 38-day period (i.e. fewer than 2.6 tweets per day). We describe those with a higher (than median) engager index and a lower educator index as ‘chatterers’. Higher in both indices are ‘educators’, lower in both indices are (act like) ‘celebrities’ and those with a higher educator index and lower communicator index are ‘information sharers’.
In summary, these are different types of users who use Twitter to do different things. This is judged by how they stand on two metrics: first, ‘engagement versus broadcast’, whether a user tended to use Twitter to talk to one or a small number of people directly, rather than to broadcast to many, and second, the ‘educator index’, whether a user tended to use Twitter to pass on other peoples’ messages and information, or to share their own.
Communicator index

Educator index
Chatterers shared mainly their own information and usually directly to a small number of people.
Celebrities also shared their own information but tended to broadcast this to a wider body of people.
Educators shared other peoples’ information but often directly to people they were talking to.
‘Info-sharers’ also shared other peoples’ information but broadcasted it to a wider group.
The split by segment shows that overall, there are relatively few celebrities and educators and significant numbers of chatterers and info-sharers.
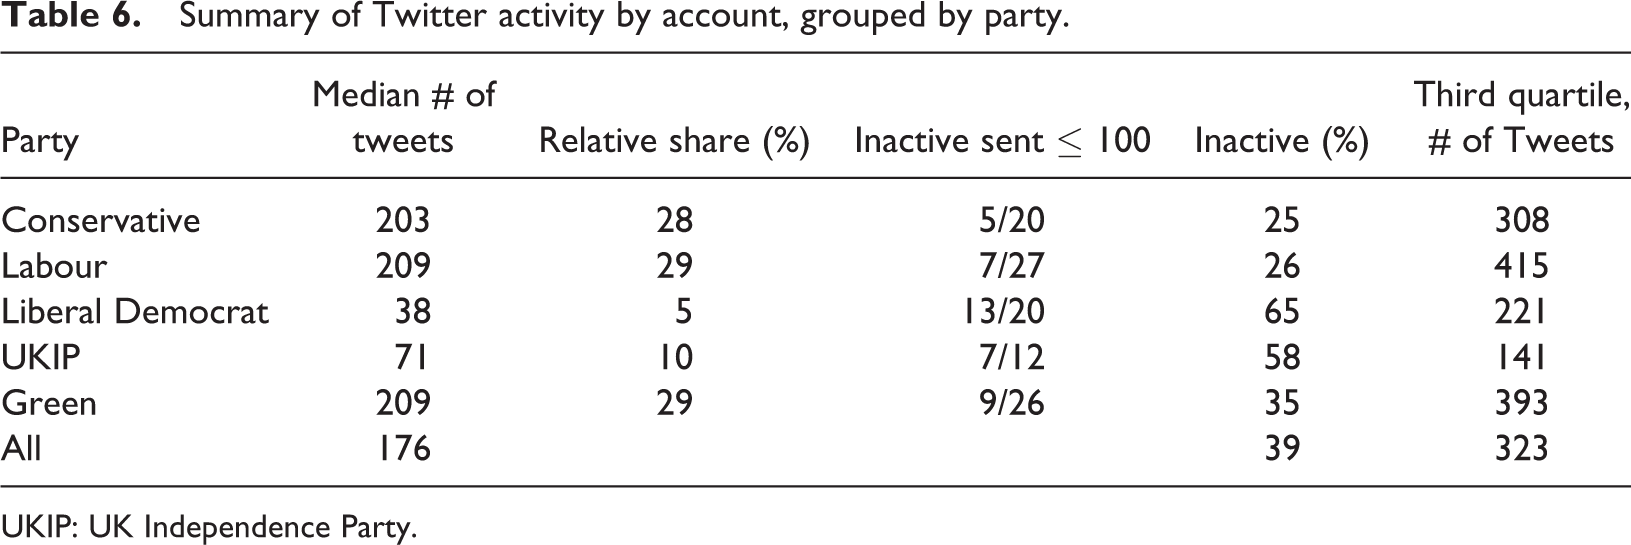
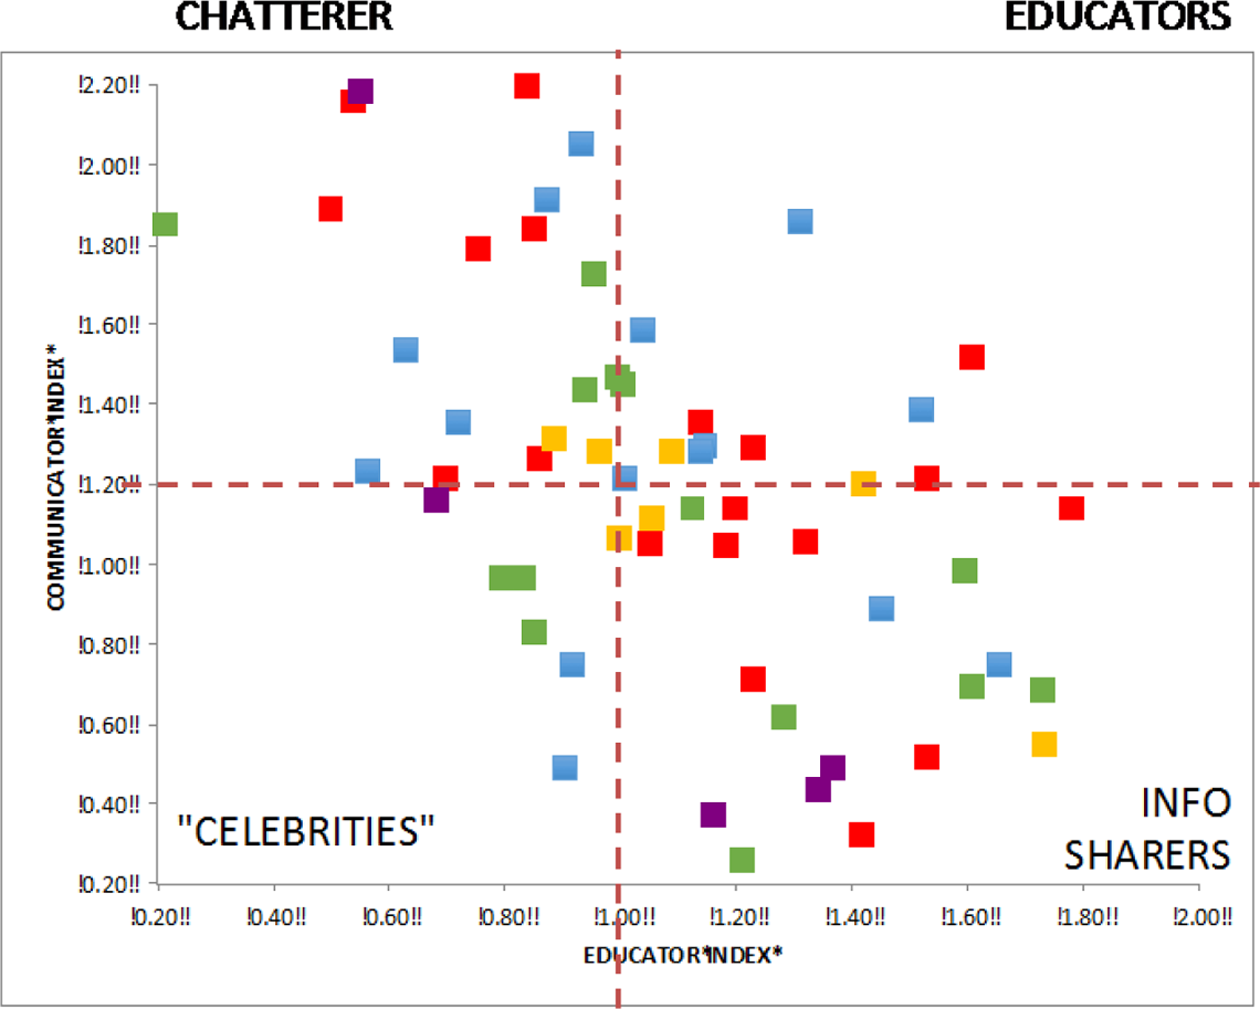
Our analysis indicates that the parties did use Twitter differently, though there is no particular evidence to suggest that this was centrally mandated. Twitter use varied by party along a couple of dimensions. Liberal Democrat and UKIP candidates were both much less active than Conservative, Labour and Green candidates, who were all equally active. Table 6 shows the median number of tweets sent by a candidate (account) across the parties and the implied relative share of tweets. Note that we use median here rather than mean to mitigate the impact of national figures such as Caroline Lucas and Nigel Farage major national politicians – who, as Figure 1 illustrates, received substantially more tweets than any of the other candidates in our sample or other outliers. It also shows the number of inactive accounts (sending ≤ 100 tweets) and as a proportion of the total for the party. This shows that a high proportion of UKIP and Liberal Democrat accounts were effectively inactive.
Summary of Twitter activity by account, grouped by party.
UKIP: UK Independence Party.
Tweets received by Farage and Luas compared to all other parties/candidates.
We also show the number of tweets sent by the third quartile account. Labour and Green accounts are higher, suggesting that highly active Green and Labour accounts were more active than the Conservatives. Putting it another way, it seems that the Conservative candidates were more consistently active, with their efforts also divided across fewer individual accounts (20 vs. 26/27 for Green/Labour). In other words, for the Conservatives, campaigning on Twitter tended to be more targeted than that of the other parties. The third quartile UKIP and Liberal Democrat accounts show much lower levels of activity than the other parties.
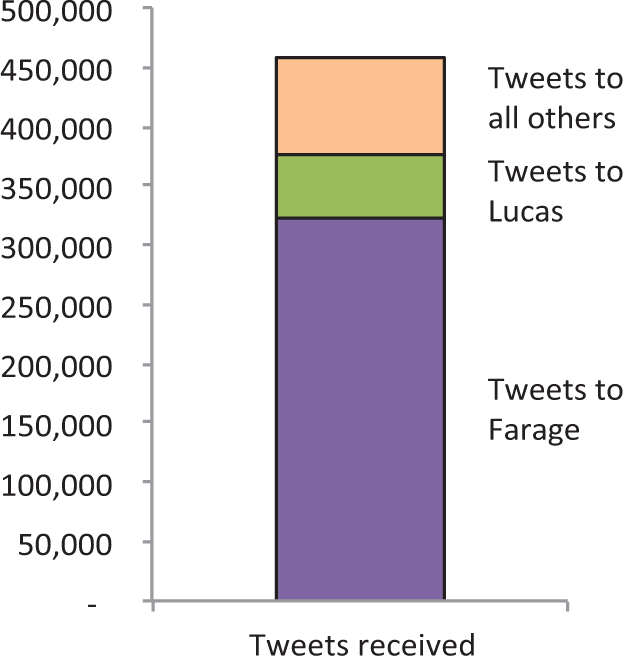
In general, it appears that a candidate’s usage pattern – as defined by our four-way segmentation – reflected independent preference rather than party strategy. The scatter diagram (limited to active accounts) in Figure 2 shows that whilst there were members of most parties in most quadrants and a wide scatter for every party (with the exception of no Labour candidates in the celebrities quadrant), the majority of candidates were either chatterers or ‘info sharers’.
Candidate segmentation.
Table 7 shows the aggregate statistics (again limited to active accounts) that all parties had a good share of chatterers, who were primarily using Twitter as an opportunity to enter into direct discussion with individuals (a ‘virtual doorstep’). Equally popular for Conservatives, Labour and Liberal Democrats was the educator strategy, which backs up such direct messages with supporting links (or retweets). For the Conservatives, Labour and Liberal Democrats, 77%, 65% and 72%, respectively, of all active accounts pursued one or other of these strategies. The Greens and UKIP, however, tended to have more accounts that just ‘broadcast’ to their account followers. Fifty-eight per cent of Green accounts and 60% of UKIP accounts showed this pattern of being more biased to broadcast strategies (mainly information sharers).
Summary of Twitter segmentations by party.
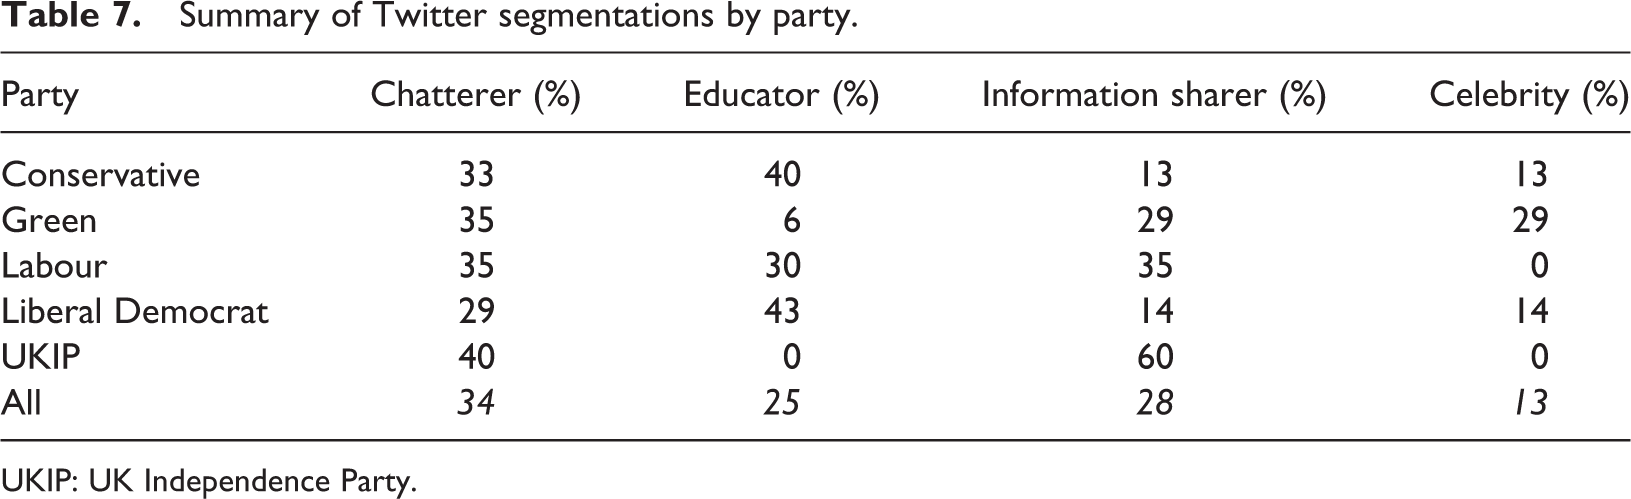
UKIP: UK Independence Party.
So to what extent, if any, can we equate electoral success (in our constituencies) to the types of Twitter users we identified? As earlier indicated, we did identify data that suggested that one aspect of Twitter activity – the rate of reply to @mentions – could be indicative of a more engaged and active candidate and this bore some relationship to subsequent electoral performance. However, our broader candidate segmentation approach offers little support to this finding. So, for example, in the main, the Liberal Democrat and UKIP candidates largely ignored Twitter, but the Liberal Democrats were crushed whilst UKIP were (arguably) relatively successful in terms of vote share, albeit against an unknown base of support. Conservative and Labour candidates broadly pursued a similar (varied) range of strategies across the constituencies with differing levels of overall performance in these constituencies. Hove, where Labour performed very strongly and won the seat on a large swing, saw the Labour, Green and Conservative candidates all active on Twitter and all pursuing chatterer strategies, but the Green candidate pursued the most active Twitter campaign (by some margin) but emerged with relatively meagre rewards. All of which demonstrates that individual candidate activity on Twitter, indicative as it might be of local levels of campaigning, probably only has a marginal impact on electoral performance when weighed against other local factors and the overwhelming national electoral trends.
Issue agendas
Another area we investigated was what issues were most prominent on Twitter during the campaign and how this compared between parties and with the issue agendas of the mainstream media and the public. When we look at the issue agendas pursued by the parties via their Twitter accounts, it is impossible not to be struck by the relative message discipline that their feeds demonstrate (see Table 8).
Party issue agendas as tracked by their Twitter feeds.
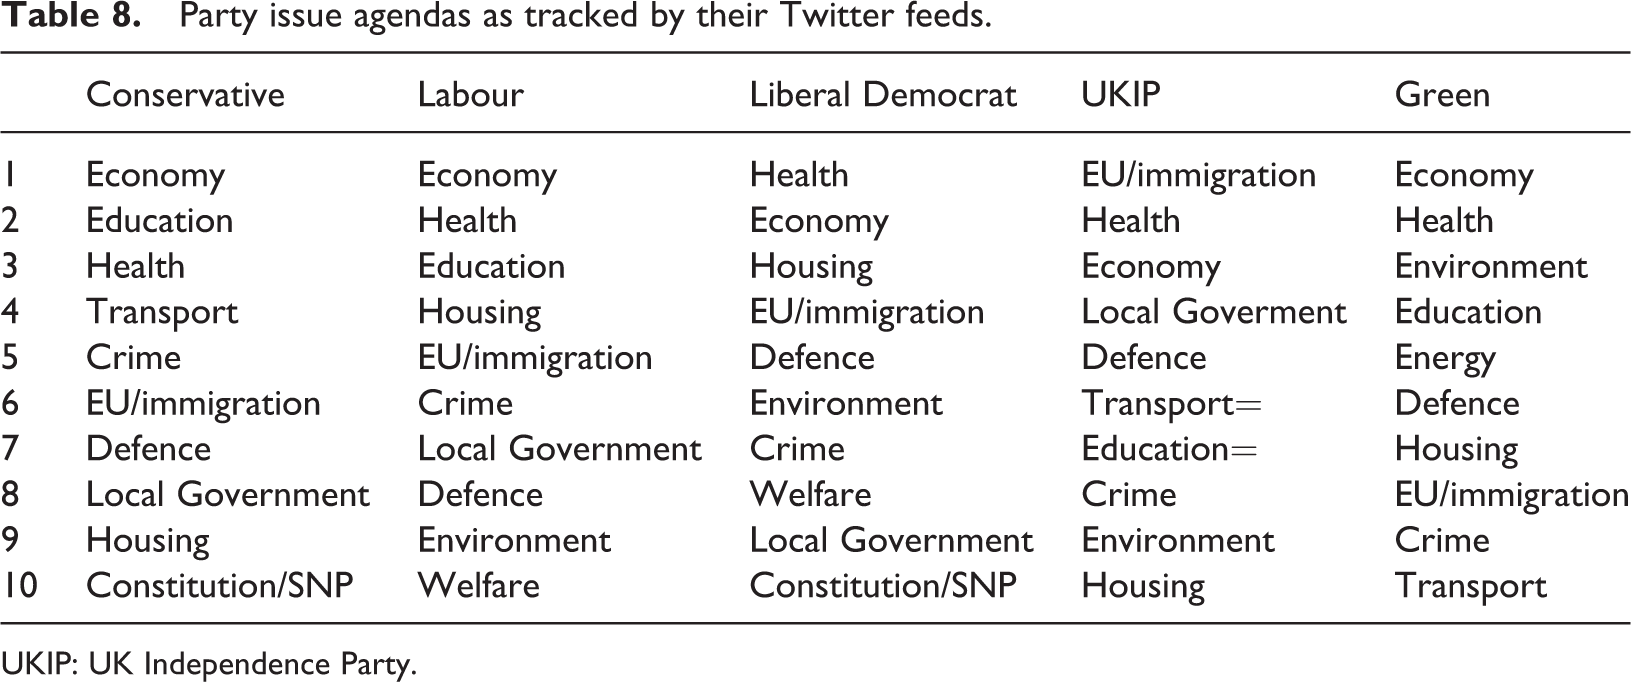
UKIP: UK Independence Party.
For Labour and Conservatives, the three top issues are exactly the same – economy, education and health; the Liberal Democrats substituted housing for health; UKIP (unsurprisingly) have European Union (EU)/immigration, instead of education, in their top three, whilst the Greens (again unsurprisingly) have environment, in place of education. Only the Conservatives and the Liberal Democrats – presumably reflecting their recent past as coalition partners – heavily featured the outcome of the election (i.e. the possibility of Labour finding itself having to deal with the Scottish National Party [SNP]), which was characterized as a ‘constitutional’ issue. The presence of Local Government, as an issue, is directly related to the fact that elections for many of the local authorities in our sample were taking place at the same time and this also probably accounts for the prominence given to education as an issue, which did not figure as a national election campaign issue. We also investigated the extent to which the Twitter conversations shared the same issue agendas as could be found in the traditional media and the public’s agenda, as represented by the polls.
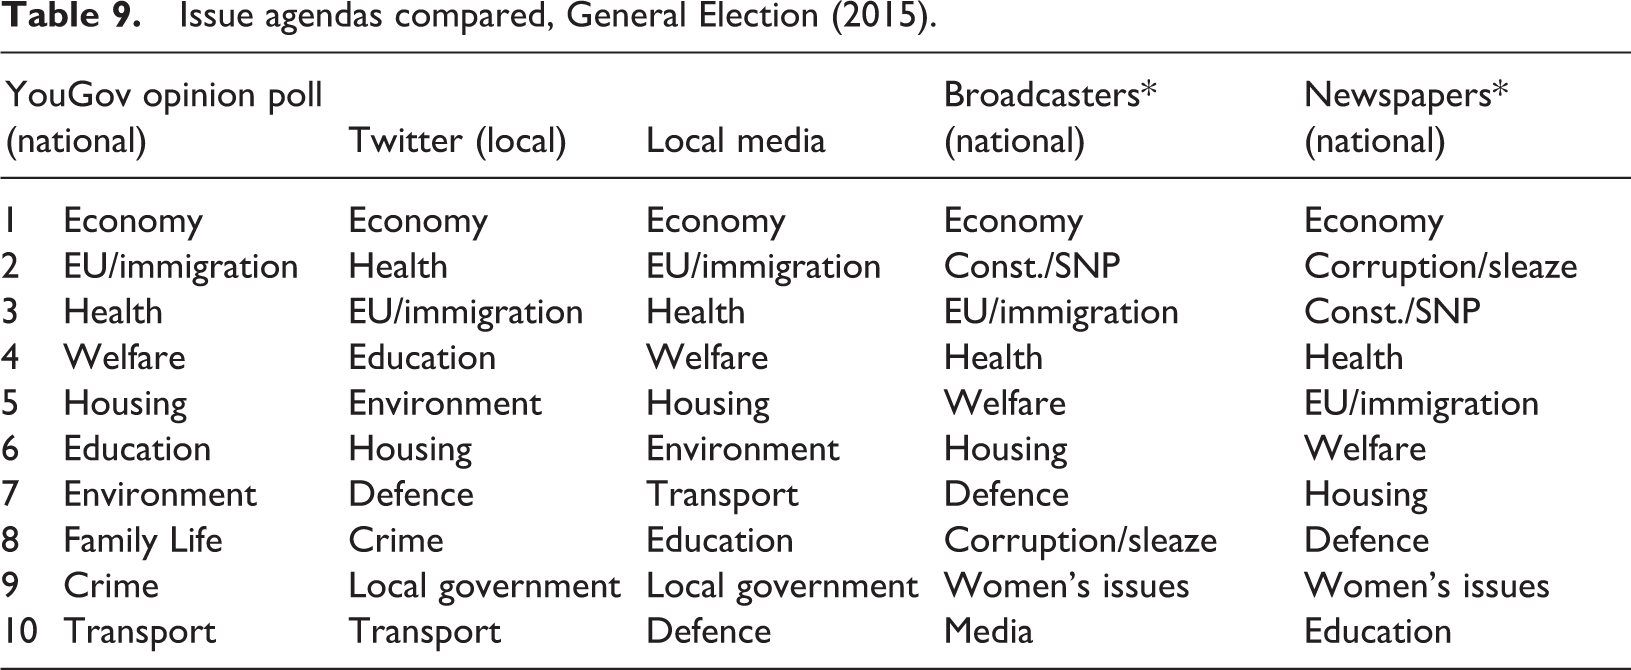
Table 9 presents this information in summation; it should be noted that it compares our local Twitter data collection with the issue agendas reported nationally for the media and the public as well as the local media agenda. It should also be noted that there are no grounds for believing that the electoral ‘conversation’ in the South was significantly different from that taking place in other parts of the United Kingdom (with the exception of Scotland). In looking at this comparison, we can assume that the optimum agenda for any medium of communication is to achieve an issue agenda score as close as possible to that of the public’s. Scoring 0 for those items, which achieve an identical rating with the public and one for items that are out by one and so forth (and 10 for items that do not appear anywhere on the public’s agenda), we see that our Twitter conversations (with a score of 17) did significantly better in reflecting public interest than did the national media that consisted of a broadcasters’ score of 54 and a national newspapers score of 60. However, it is worth noting that it was the local media, with a score of 16, whose issue agenda was closest to both the local Twitter conversation and the public’s, with their top five items exactly matching those as reported by YouGov. 17
Issue agendas compared, General Election (2015).
Two models of Twitter use
One of the overall conclusions of our research is that despite the fact that 2015 represented the second General Election in which Twitter featured as a major campaigning tool, the picture that is emerging is one of a profound mismatch in expectations between the general public and the traditionally organized political parties. Underlying the mismatch are two quite different models of how political discourse should proceed on social media – one held by the political parties and the other held by the general public (or at least those interested in engaging through Twitter).
The model for political discourse, as represented in Figure 3, held by the traditionally organized parties can be termed the ‘doorstep model’. Political interaction between public and candidates in general elections has traditionally been undertaken face-to-face at the local constituency level – very often literally at the doorstep. Allocation of resources by parties has been based around a focused physical geographic perspective; target constituencies are identified and resources put in place to help a local constituency candidate galvanize and win over potential voters – and then to ‘get out the vote’ on the day. Whilst central resources can be provided to support, much of the organization and leadership is devolved to the local constituency candidate. Outperformance is achieved by putting together a strong local team of conveners and by canvassing the local population successfully. These well-embedded local organizations provide a high barrier-to-entry for new political entrants.
‘Doorstep model’ parties ‘traditional’ use of Twitter for political discourse.
Participation in the political process by the general public is encouraged through physical interaction based around locality – meeting with canvassers through door-to-door cold calling, open ‘town hall’ meetings, local party events (both political and social) and so on. The essence of the model is to embed the party in the community and to encourage the development of loyalties through a mix of discussion, persuasion, the provision of support, fixes and favours through constituency clinics, social ties and group norms. This historically has been a powerful model and continues to reap rewards for the major parties when well executed. It can be argued that the successful Conservative campaign was built around this tried-and-tested model, targeting successfully vulnerable Liberal Democrat seats on a constituency-by-constituency basis.
A possible approach to Twitter stems naturally from of this model and appears to have been adopted by the main parties. Constituency candidates develop for themselves a presence on Twitter and engage with the general public through a series of interactions, preferably on a daily basis, that seek to establish a community. In essence, candidates seek to extend to the Twittersphere the kind of local community that they aim to create on the ground. A well-organized local constituency campaign will have a regularly updated Twitter feed or feeds that relate closely to the candidate him/herself, though the level of interaction will typically depend on the candidate’s personal level of enthusiasm for the medium. Various approaches are possible and are employed by candidates on an individual basis (with no evidence of party instructions or mandate on how to proceed): Chatting with people as they drop into the account (by sending a message). This is roughly equivalent to meeting and chatting with people in the town centre as they stop by a party booth. This is a ‘casual conversation’ approach; Sending out regular information updates with links to press conference videos, articles, position papers and so on – directed either to the account’s followers (‘information-sharing broadcast’) or to individuals (‘educational conversation’) or Providing regular updates to followers of latest activities or personal thoughts (‘celebrity broadcasting’).
Whilst these strategies differ in detail and effect, they all share the same localist frame – and stand or fall on the competence and charisma of a local candidate and his or her support team.
But the model for political discourse held by the general public is somewhat different as represented in Figure 4 and is built around the way in which Twitter has been designed to operate and, in particular, around two salient features of Twitter. The first is that Twitter is an event-driven medium. People post to Twitter when they are emotionally affected by some incident in their lives (or in the life of someone else in whom they feel vested). A high proportion of posts by members of the public are therefore triggered by some event, and the post itself is oriented around that event. Tweet volumes will therefore often show the ‘twitcident’ pattern – a large spike in tweets reflecting individual responses to some shared external, event stimulus. These tweets, sent by ordinary members of the public, will be oriented in one or more of three possible directions:
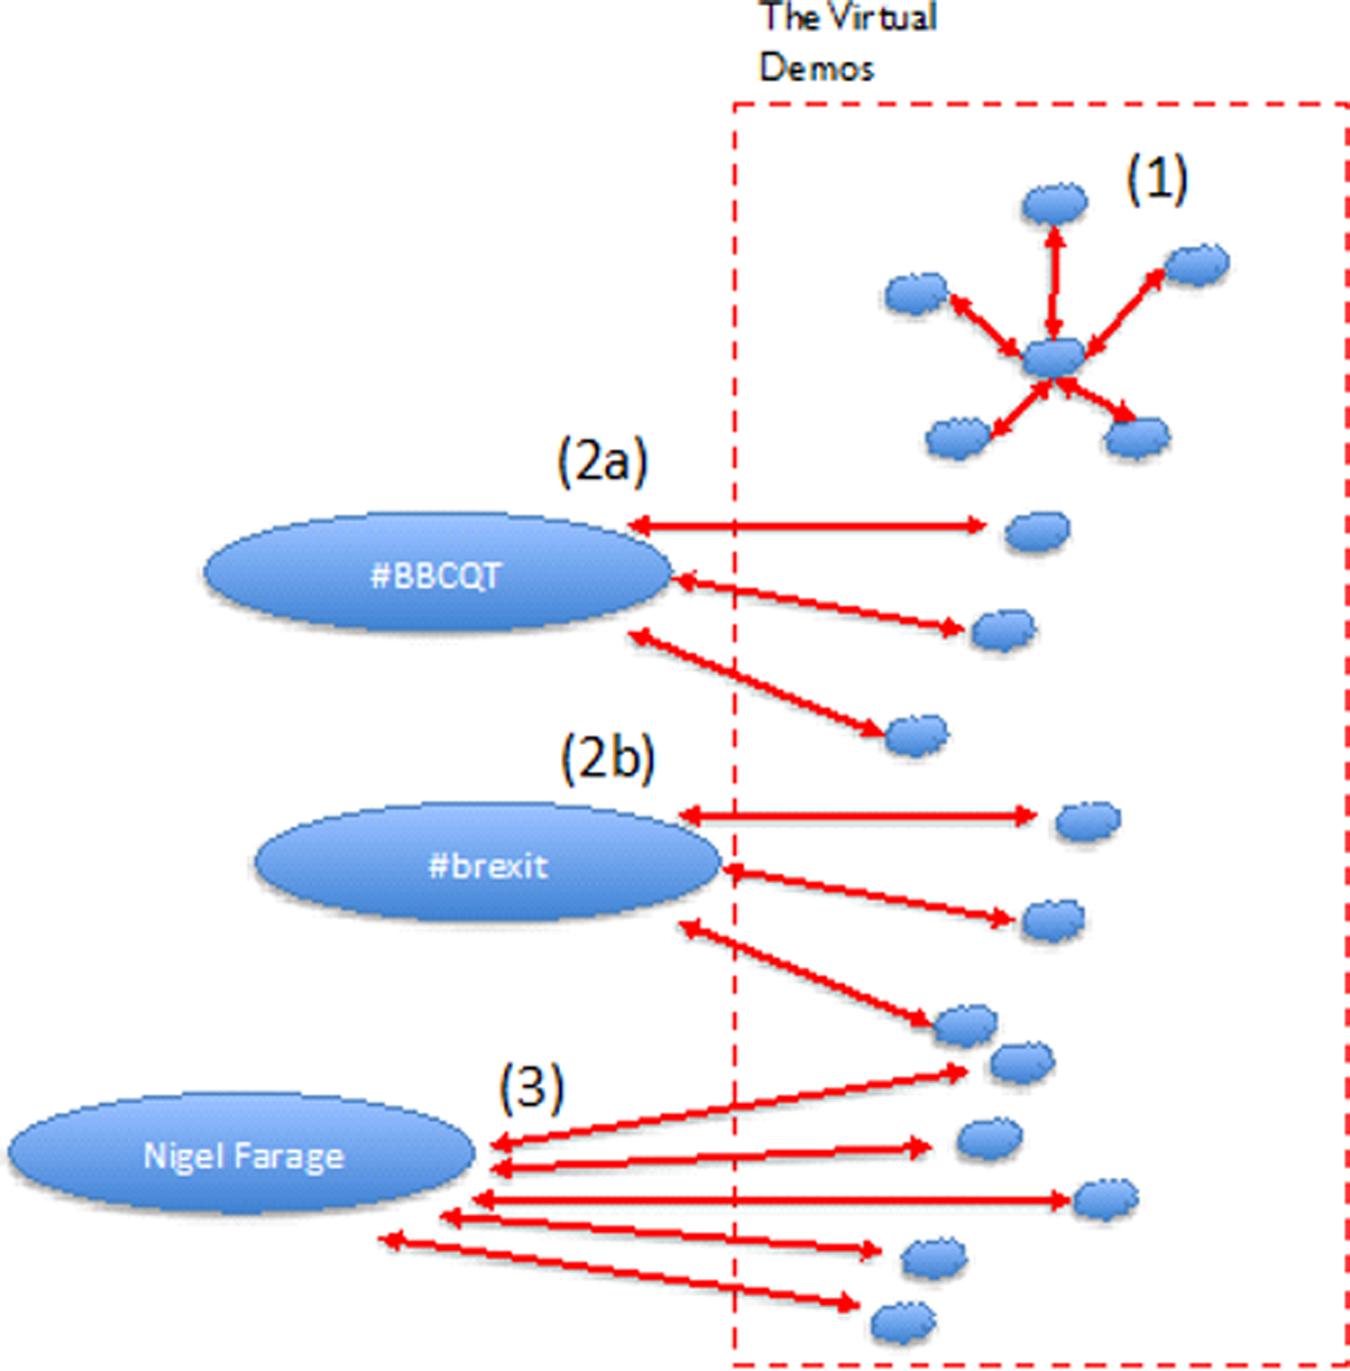
‘General public model’ of twitter political interactions.
towards account followers (usually a small number of people, often know personally) and/or directed at (‘@’) particular friends or acquaintances (see Figure 4) (1);
to a hashtag for a current shared discussion (2a) or long-term shared topic or channel (2b); or
to a celebrity account, especially (for political conversations) towards a major political figurehead such as Nigel Farage, Caroline Lucas, Nicola Sturgeon, David Cameron and so on (3).
The second feature is that Twitter is dominated by a relatively few number of accounts that have a high number of followers – some celebrities, some mainstream news broadcasters and commentators and some a new (and increasingly powerful) breed of digital commentator. Twitter’s follower system allows these personalities to communicate in broadcast to huge followings (3) but also gives ordinary members of the public the opportunity to reach out to the celebrity directly. This system allows celebrities to develop an ersatz relationship with very large audiences.
These two models for interaction are not particularly compatible. On the one hand, significant resources are expended by individual constituency candidates attempting to interact with local constituency members and to build a local following online directly with very meagre returns for their effort. On the other hand, members of the public reach out in large numbers to celebrity politicians and contribute avidly to national debates and discussions driven by particular events (e.g. political debates, national radio, TV, etc.), with little or no response from the political classes.
Conclusion
One of the original aims of the project had been to investigate the extent to which Method52’s use of NLP would be a helpful tool in analysing Twitter during the campaign. As a result of this research, we would suggest that it is but only to a limited extent. For example, during the various televised party leaders’ debates, as Figure 5 illustrates, Method52 was used to measure support by classifying tweets as either ‘boos’, ‘cheers’ or neither, for the various leaders (Daily Telegraph, 2015).
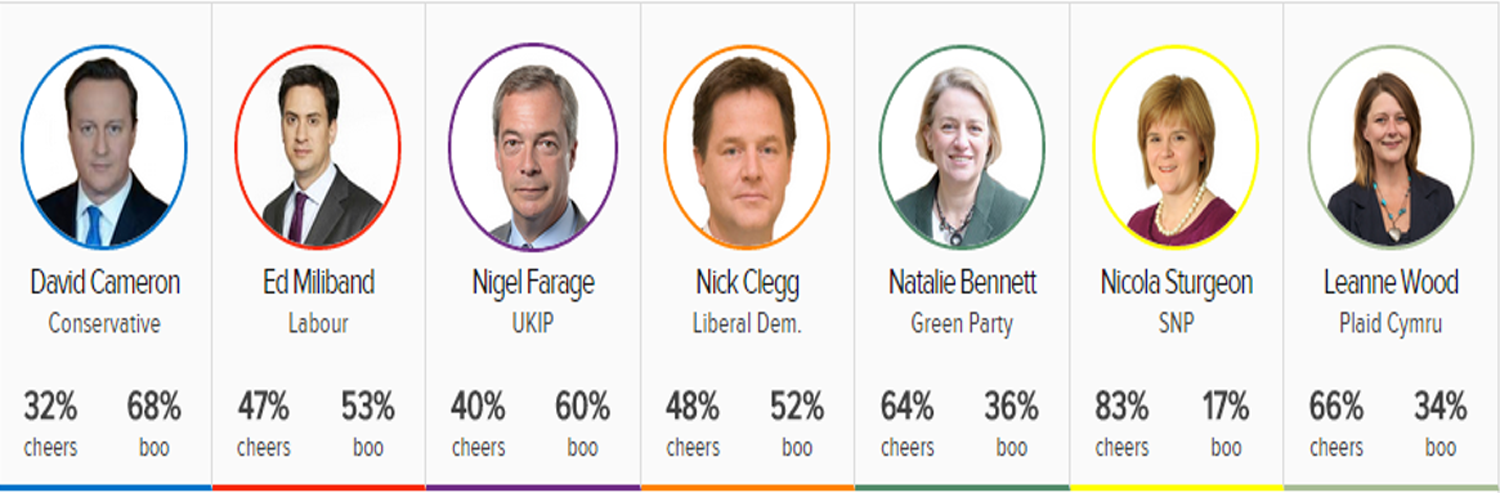
‘Boos’ and ‘cheers’ on Twitter during party leaders debates.
On Twitter, the least popular national party leader appeared to be David Cameron, the Conservative leader, who won the election, whilst the most popular was Natalie Bennett 18 of the Greens, whose party came last. This is a graphic demonstration of the difference between the Twitterarti demographic and that of the electorate as a whole. An additional reason for using NLP to analyse political conversations is because the high frequency of sarcasm, wit and parody that occurs in political debate is not something that is easily analysed by algorithms.
So the question remains, is Twitter a useful tool for studying elections? The obvious answer is that all information about election campaigning and voting behaviour is useful; the extent to which Twitter has particular utility remains an open question. Election research is problematic. On the one hand, the failure of the opinion polls in the 2015 election is an indicative of the shortcomings of quantitative approaches to understanding voting behaviour; on the other hand, the problematics of asking voters to unravel their own political motivations make qualitative research also of limited value. The theoretical value of Twitter as a tool for election research is that the quantitative data are direct, accessible and, in terms of the metadata, unambiguous; and on the qualitative side, the expressions of opinion and sentiment found on Twitter are raw and unmediated. But Twitter has its shortcomings as a research tool.
Twitter is an interactive medium and people tend to interact mostly with their friends and those whose views they find agreeable. It is not a general broadcast medium but nor is it more directly personal as is Facebook. This is a key distinction; for, as our own survey of local campaigners appears to indicate, the indications are that parties are increasingly seeing Facebook as a more effective means of reaching the electorate. In November 2014, according to an invoice leaked to the BBC, the Conservative Party spent over £100,000 in just one month on Facebook advertising (Hawkins, 2015). After the election, a Conservative advisor suggested to this author that during the campaign the Party’s spending on Facebook rose to many times this level. The Conservative’s US campaign advisor, Jim Messina (2015), said that Facebook had been critical to the success of the campaign: Of all the ways of communicating to voters, using Facebook and other social media, was the most effective because it was often a message shared by their friends or others they trusted versus politicians and the media that they don’t trust. (p. 2)
So it is important to study Twitter within the context of the broader digital campaign. What is visible to researchers is not the same thing as what is important to the campaign itself, and Twitter was just one of the ‘digital channels’ that the parties utilized during the campaign. The lion’s share of tangible outcomes – volunteers and donations and vote pledges – as Miller and Hogarth (2015) have reported, came from email interactions and, as has already been alluded to, a great deal of the targeted messaging was targeted at Facebook – which because of the privacy of most of these interactions, cannot be researched in the same way as Twitter posts.
Another major area of research lacunae is on the reception/receiver side of these interactions. We still know very little about the kinds of information that people pay attention to and the kinds of messages (if any) that actually prompt actions such as a pledge to volunteer, to make a donation or to change a voting intention. This is a really crucial missing part of the puzzle.
In addition, it is important to bear in mind just how untypical the Twittersphere is compared to society as a whole. The latest Ofcom research into the UK population’s use of news sources tells us that social media is of growing importance, particularly among the young – of whom 47% identify it as one of their main sources of news. However, there is a clear difference between Twitter and Facebook usage in this context. Facebook is named as overall the sixth most used source of news, with 12% of all adults naming it as their most preferred source. Twitter, on the other hand is the 19th most preferred source with only 4% of adults naming it as their ‘go to’ news source (Ofcom, 2015). Twitter’s 15 million UK users are heavily biased towards the young, with two-thirds of its users being under 34, the group that least likely to vote; whilst Facebook’s 31 million users are, more or less, spread evenly across all age groups (Statisat: the statistic portal “Age distribution of Facebook users in Great Britain from May 2013 to February 2016” available at http://www.statista.com/statistics/278287/age-distribution-of-facebook-users-in-great-britain/). Twitter has not proved to be a useful means of forecasting national election outcomes as Burnapa et al. (2015) found after hazarding an incorrect forecast just days before the UK 2015 election. Nonetheless, as this research demonstrates, studying Twitter activity during an election campaign can still be a very useful source of information for researchers, even if it is, and will always be, unable to tell us who’s going to win.
Footnotes
Acknowledgements
The author gratefully acknowledges the very important contributions made to this article by Paul Webb, Jeremy Reffin, David Weir and Simon Wibberley of the University of Sussex, Mark Margaretten of the University of Bedfordshire and Alex Krasodomski and Carl Miller at the Demos think tank.