
Abstract
Previous work suggests a four-factor structure of the Modern Health Worries Scale. This study is the first to investigate its dimensionality and factorial invariance across age and sex in a representative population sample (N = 2524) using confirmatory factor analysis. The proposed four-factor model failed to achieve good model fit. Model fit was optimized by allowing correlating error terms resulting in acceptable model fit. Multi-group analysis revealed invariance across age and sex. Our study proved the proposed four-factor structure across age and sex. Consequently, the Modern Health Worries Scale can be applied in general population surveys using subscale scores.
Introduction
Aspects of modern life, that is, mobile phones or genetically modified food, and their impact on personal health are subjects of growing concern (Bailer et al., 2008b; Kaptein et al., 2005; Petrie et al., 2001). Petrie et al. (2001) have developed a scale to measure modern health worries (MHW). Besides a total score, different subscale scores can be computed. Petrie et al. (2001) originally established four factors (toxic interventions (TI), environmental pollution (EP), tainted food (TF) and radiation (RA)) using principal component analysis (PCA) with varimax rotation. Since then, several studies have underlined the relevance of MHW by showing associations between the MHW total score with subjective importance and perception of health and healthcare use (e.g. Andersen and Jensen, 2012; Filipkowski et al., 2010; Kaptein et al., 2005). The subscales have been associated with specific physical symptoms (e.g. TF and gastrointestinal symptoms) (Petrie et al., 2001) and attitudes towards the use of complementary medicine (TF, RA) (Furnham, 2007). Patients with subjective food hypersensitivity scored higher on the TI scale than a population sample (Lind et al., 2005), and patients reporting subjective sensitivity to mobile phones had higher RA scores compared to a control group (Rubin et al., 2008).
Other studies have identified a factorial structure identical to Petrie et al. (2001), for example, Bailer et al. (2008a) by principal axis factoring with promax rotation and Filipkowski et al. (2010) (not further specified factor analysis). Kaptein et al. (2005) conducted a PCA with varimax rotation and forced choice of four factors. Their factor structure was comparable with the dimensions of Petrie et al., except that one item (drug-resistant bacteria) loaded on a different factor. On the contrary, a German study has failed to replicate these dimensions by PCA with varimax rotation (Schulze-Willbrenning and Muthny, 2009). Two studies using confirmatory factor analysis (CFA) have reported good model fit according to incremental fit indices and according to badness of fit indices in a sample of German Internet users (comparative fit index (CFI) = .97, Tucker–Lewis Index (TLI) = .97, standardized root mean square residual (SRMR) = .07) (Bailer et al., 2008b) and in a sample of Hungarian students (CFI = 0.96, TLI = 0.95) (Koteles et al., 2011). While the root mean square error of approximation (RMSEA = 0.068) indicated good fit in the study of Koteles et al., it failed to indicate satisfactory model fit in the study of Bailer et al. (RMSEA = .13). Although a substantial amount of variance remained unspecified, Bailer et al. did not optimize model fit by introducing correlations between error terms. If reported subscales were highly intercorrelated, internal consistencies of the total score and of the subscales were very good (Bailer et al., 2008b; Koteles et al., 2011; Petrie et al., 2001). However, the factor structure of the MHW scale has been mostly examined by exploratory factor analytic approaches, and studies have often suffered from small sample sizes or selective samples, for example, students. Moreover, age and sex differences have been reported in some studies (Bailer et al., 2008a, 2008b; Kaptein et al., 2005; Petrie et al., 2001), but stability and invariance of the factor structure across sex and different age groups, that is, if a model is valid across different populations, have not been established to date. Measurement invariance is an important requirement for comparing different populations (Schermelleh-Engel et al., 2003).
Aims
Although previous work strongly suggests a four-factor structure of the MHW scale, the dimensionality of the MHW scale has never been examined in a representative population-based sample. Thus, this study aims to investigate the factorial structure of the MHW scale using a representative sample of the German population. Furthermore, we aim to examine whether the factor structure is invariant across sex and different age groups.
Methods
Study sample
This study was part of a German nationwide face-to-face household survey carried out by trained interviewers of a demographic consultation company (USUMA, Berlin, Germany) on behalf of the University of Leipzig. A representative sample of the German general population aged 14 years or older was approached using 258 sample points in May and June 2008. Households and household members were selected randomly, and after providing written informed consent, self-report questionnaires were presented. The survey met the ethical guidelines of the international code of marketing and social research practice by the International Chamber of Commerce and the European Society of Opinion and Marketing Research. Of the initially selected 4630 addresses, 4572 were valid. In all, 2524 persons (47.6% men) took part in the study (participation rate 62.1%). The average age of the participants was 48.9 years (range: 14–91 years).
Instruments
MHW scale
The concerns regarding the impact of various aspects of modern life on health were assessed by the German adaption of the MHW scale (Petrie et al., 2001; Rief et al., 2012). The 26 items are rated from 1 (no concern) to 5 (extreme concern). Few changes have been made to represent concerns characteristic for Germany. For example, items were omitted (e.g. vaccination programmes), items were merged (e.g. contaminated water supply and fluoridation of water became poisoned drinking water), and items were added (e.g. moulds in living spaces and radiation) (Rief et al., 2012). Rief et al. presented data regarding the prevalence of MHW in the general population and additionally reported associations with depression, symptom reporting and quality of life supporting the construct validity of the adapted scale. The study of Rief et al. (2012) and our analysis rely on the same sample. Yet, because of their epidemiological and clinical perspective, Rief et al. did not report detailed information on the psychometric properties of the scale.
Statistical analysis
The factorial structure of the MHW was tested using CFA, computed with the statistical program AMOS 18. CFA was calculated for the proposed four-factor model (Petrie et al., 2001), with all factors relating to each other. Modified or additional items were not included in the model. The model was estimated with the maximum likelihood method approach. Because Chi-square statistic is very sensitive to sample size, we additionally used different fit indices to assess model fit: the minimum discrepancy divided by its degrees of freedom (CMIN/DF), the RMSEA, the SRMR, the TLI and the CFI. All of these indices reflect different information regarding model fit, that is, goodness of fit (TLI, CFI) and badness of fit (RMSEA, SRMR). While CFI, TLI and RMSEA are moderately sensitive to simple model misspecifications, SRMR, on the contrary, is only moderately sensitive to complex model misspecifications but very sensitive to simple model misspecifications. The SRMR indicates misspecifications of the structural model, whereas the RMSEA indicates misspecified loadings (Beauducel and Wittmann, 2005; Hu and Bentler, 1998, 1999). For a good model fit, the ratio CMIN/DF should be as small as possible (Arbuckle, 2009). Values larger than .95 for CFI and TLI are considered as indicators of good fit (Schermelleh-Engel et al., 2003), whereas values larger than .90 are usually interpreted as indicators for an acceptable fit (Arbuckle, 2009; Hu and Bentler, 1998; Kline, 2005; Schermelleh-Engel et al., 2003). Furthermore, RMSEA values smaller than .06 indicate a good model fit (Hu and Bentler, 1999), and values smaller than .08 still reflect an adequate fit. SRMR values smaller than .05 indicate a good fit, and values smaller than .10 indicate an acceptable model fit (Schermelleh-Engel et al., 2003).
Results
Table 1 shows the results of the proposed four-factor model (baseline model) in the first row. None of the fit indices indicates a good model fit, thus demonstrating a relevant deviation of the data from the model.
Summary of fit indices of the baseline model compared to the optimized model in the total sample.
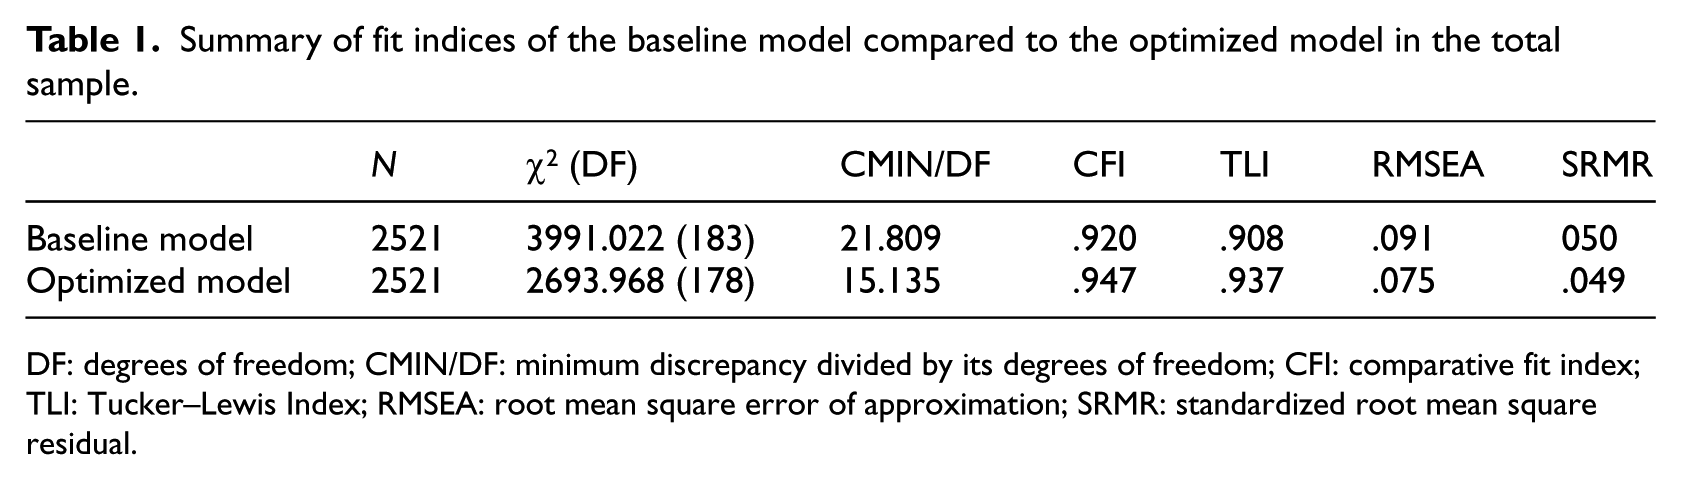
DF: degrees of freedom; CMIN/DF: minimum discrepancy divided by its degrees of freedom; CFI: comparative fit index; TLI: Tucker–Lewis Index; RMSEA: root mean square error of approximation; SRMR: standardized root mean square residual.
In order to optimize model fit, several modifications were conducted according to the modification indices and standardized expected parameter changes if they appeared legitimate with regard to the content. Consequently, error terms of 5 items within the same scale were allowed to be correlated (see Figure 1) Results are given in the second row of Table 1 (optimized model). All but one index demonstrated a good or at least an acceptable model fit. The value of CMIN/DF indicates an improved fit of the modified model compared to the baseline model, but still fails to achieve satisfactory fit, that is, a value close to 1. However, this index is sensitive to the sample size, and even small misspecifications lead to rejection of models in large samples. Hence, we focused on fit indices independent of sample size (Joereskog and Soerbom, 1993).
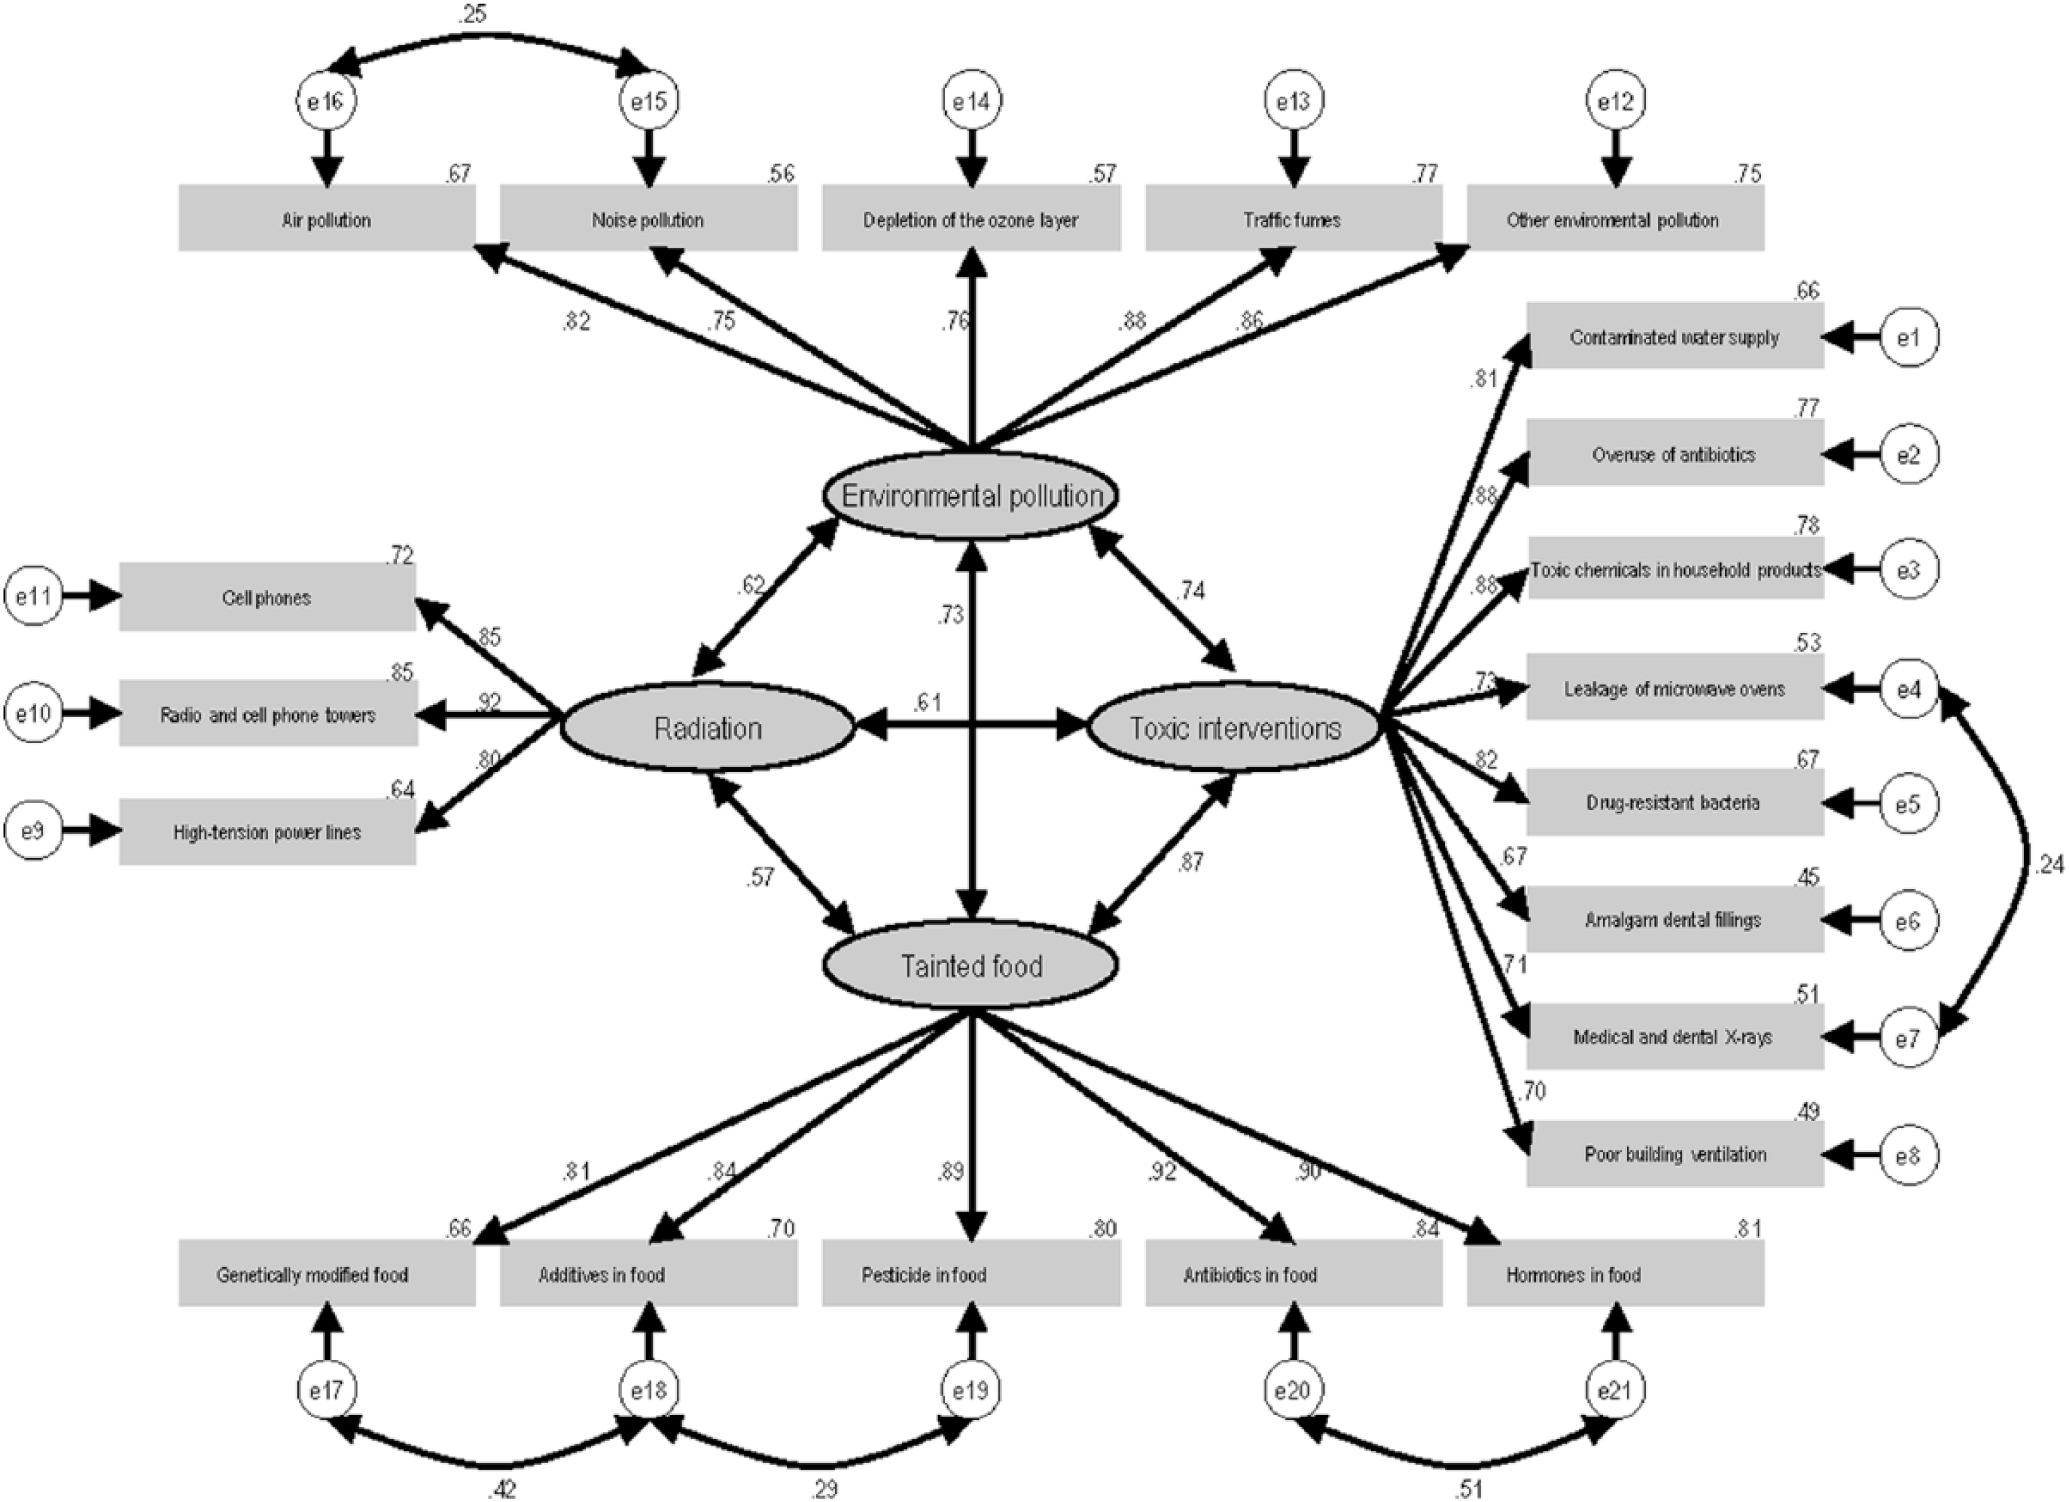
The four-factor structure of the Modern Health Worries Scale.
The standardized factor loadings varied between .64 and .95; all indicator reliabilities were >.3 (see Figure 1). Correlation coefficients between the latent variables varied between .57 and .87, that is, scales were highly intercorrelated. All subscales revealed excellent internal consistency (TI = .93, EP = .91, TF = .95, RA = .89). In total, the explained variance was .62 and composite reliability was .97. In light of the common application of the total score and the high intercorrelation of the scales, we also tested for unidimensionality. However, model fit was poor according to fit indices (χ2 = 12753.795, CMIN/DF = 67.480, CFI = .735, TLI = .706, RMSEA = .162, SRMR = .084). Additional analyses were conducted to test the invariance of the model across age and sex. First, the optimized model was computed for both sexes and seven age groups (see Table 2).
Results of CFA in different subgroups and measurement invariance across sex and age.
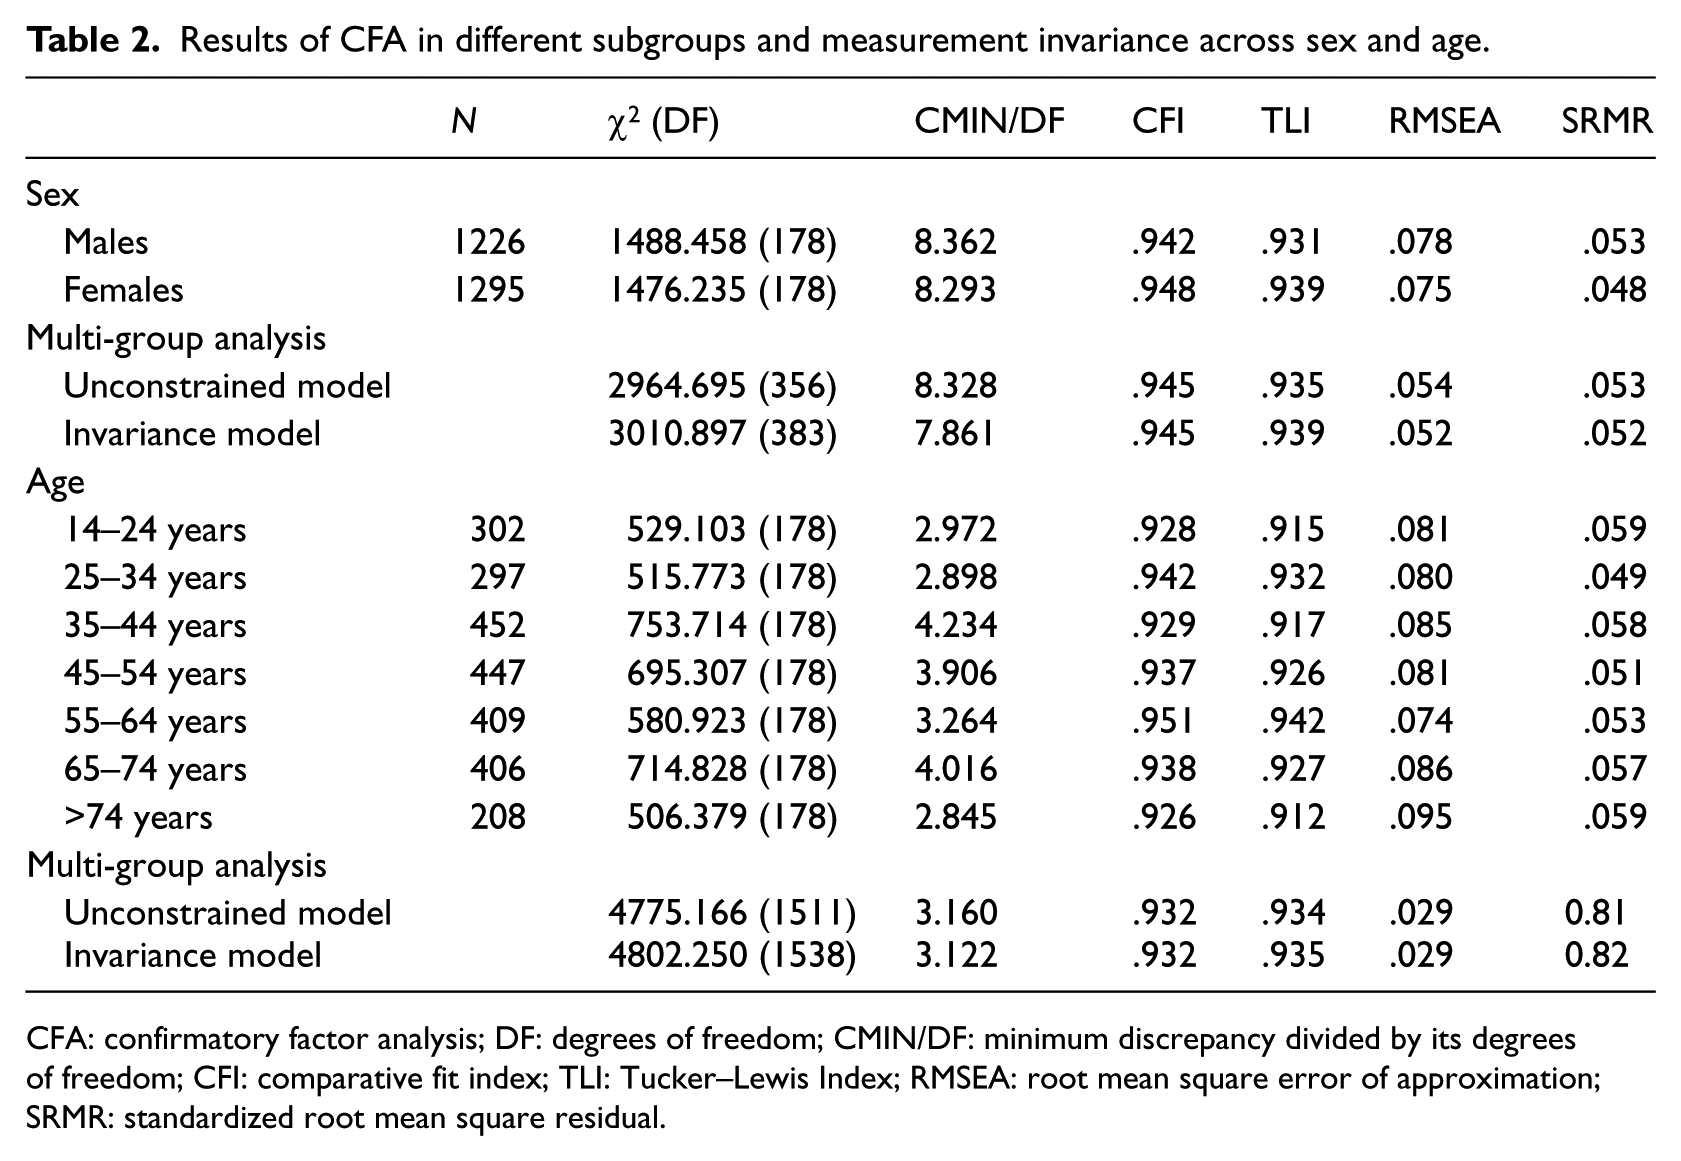
CFA: confirmatory factor analysis; DF: degrees of freedom; CMIN/DF: minimum discrepancy divided by its degrees of freedom; CFI: comparative fit index; TLI: Tucker–Lewis Index; RMSEA: root mean square error of approximation; SRMR: standardized root mean square residual.
Fit indices indicate good to acceptable model fit. Second, we tested measurement equivalency across sex and age groups using multi-group CFA. Measurement invariance is tested using invariant factor loadings (measurement weights) as well as invariant factor variance and covariances (structural covariances) (Arbuckle, 2009). This model (invariance model) is compared to an unconstrained model (see Table 1). Since the Chi-square statistic has often been criticized for its sensitiveness to sample size, we focused on ΔCFI and ΔRMSEA as indicators in the comparison of models. Values smaller than .01 indicate invariance of the models (Cheung and Rensvold, 2002). As shown in Table 2, the multi-group analyses revealed the invariance of the models across sex and age.
Discussion
This study examined the dimensionality and the factorial invariance across age and sex of the MHW scale using CFA. Major strengths of our study are size and representativeness of our sample. In contrast, an adapted German version of the MHW scale was assessed, and we did not further assess criterion validity of the instrument. Even if we did not include modified or additional items in our model, adaptations of scales can be generally seen critically. Besides questioning the intercultural comparability of results, the psychometric quality can differ as well.
The proposed four-factor structure revealed unsatisfactory fit, according to RMSEA value, but acceptable model fit according to SRMR, CFI and TLI. This is in line with previous findings (Bailer et al., 2008b). Because of good model fit in some indicators and for reasons of parsimony, Bailer et al. did not optimize their model. In contrast, we decided to introduce correlations between the error terms according to modification indices and item content. By allowing correlations between error terms of 5 items, an optimized model was calculated, resulting in acceptable to good model fit. All correlated error terms were reasonable with regard to item content, and the psychometric properties of the scale were good. However, our model is not superior to the model of Bailer et al. and needs to be cross-validated in other samples. Yet, in comparison to Bailer et al., our analysis relied on large and representative sample, and we wanted to present a structural model that fitted the data and could be investigated regarding measurement invariance across different subgroups. Our study could demonstrate the invariance of this structure across sex and different age groups using multi-group analysis.
Internal consistencies of the subscales and their intercorrelations were high and comparable to the study of Bailer et al. (2008b). We therefore questioned whether the subscales carry additional information compared to a global score and assumed a one-factor solution possible as well. CFA revealed unsatisfactory model fit for a unidimensional solution though, somehow questioning the use of a global score. Previous studies have also shown that the subscales are linked to specific physical symptoms or attitudes underlining the different dimensions of the MHW scale (Furnham, 2007; Lind et al., 2005; Rubin et al., 2008). The differential validity of the subscales needs to be further studied.
This study was the first to investigate the factorial structure of the MHW scale in a large representative population sample and proved the proposed four-factor structure, even though slightly modified, across different age groups and both sexes. Consequently, the MHW scale can be applied in representative population-based surveys as well. In light of our results, we recommend using subscale scores.
Footnotes
Funding
This research received no specific grant from any funding agency in the public, commercial, or not-for-profit sectors.