
Abstract
Resilience contributes to better chronic disease adjustment but is understudied in Parkinson’s disease. Although nonmotor symptoms affect quality of life, their effect on other aspects of Parkinson’s disease adjustment is less understood. Hierarchical regression analyses from a cross-sectional survey of 138 community-dwelling adults with Parkinson’s disease (mean (standard deviation) age = 64.15(10.09) years) investigated relationships between nonmotor symptoms and resilience on depression, apathy, life satisfaction, and quality of life. After controlling for demographic variables, functional status, and nonmotor symptoms, resilience was associated with all adjustment variables. Nonmotor symptoms were associated with depression and worse quality of life. Nonmotor symptoms and resilience appear to play critical roles in Parkinson’s disease adjustment.
Introduction
Parkinson’s disease (PD) is the second most prevalent neurodegenerative disorder after Alzheimer’s disease. Nonmotor symptoms (NMS) are increasingly a new clinical focus within PD due to their high prevalence and include gastrointestinal, autonomic, sensory, urinary, and sexual dysfunction (Chaudhuri et al., 2006; Pandya et al., 2008). NMS are linked to poorer PD-related quality of life (QOL) (Martínez-Martín et al., 2011) and rated as highly distressing and incapacitating (Witjas et al., 2002). Mood symptoms themselves are also common in PD, with prevalence rates of depression between 40% and 45% (Cummings, 1992; Lemke, 2008) and 38% and 60% in studies of apathy (Oguru et al., 2010; Pedersen et al., 2009). Depression rates in PD are higher compared to other medically ill patients (Ehmann et al., 1990) and are associated with functional impairment (Weintraub et al., 2004) and poorer QOL (Schrag, 2006; Zampieri and Souza, 2011).
The relationship between depression and health-related QOL in PD is likely complex due to the pathophysiological basis of depressive symptoms related to dopamine depletion in PD and the typical “reactive” adjustment to declines and disability. Although often conceptualized within depression, apathy is defined as a distinct PD symptom reflecting a loss of motivation, interest, and effortful behavior (Kirsch-Darrow et al., 2006). It can be present in the absence of depression in PD and have a significant impact on QOL (Benito-León et al., 2012; Oguru et al., 2010). One important caveat to the studies on NMS is that neuropsychiatric and mood-related items, such as depression and apathy, are included within the NMS profile and assessment tools, and therefore overlap with some QOL dimensions. The high correlation coefficients between NMS and QOL measures in these domains (Martínez-Martín et al., 2011) may confound the conclusions that can be drawn from these associations.
Many individuals function well with PD despite the high prevalence of mood symptoms, although factors influencing the experience of such symptoms remain unclear. Relatedly, the concept of resilience is a burgeoning area of study in the chronic disease literature. Recent research highlighted the important role of resilience in the relationships between disease and psychological variables in chronic disease and disability adjustment (Black and Dorstyn, 2013; Terrill et al., 2014). Although no single definition exists, one commonly used resilience definition includes recovery from an adverse event, sustainability of values and purposeful life pursuits, and growth as a result of the adversity (Bonanno, 2004). Resilience in PD has only recently received attention in empirical research. One qualitative study that interviewed patients with PD and other progressive neurological diseases found social support and positive attitude were factors that differentiated participants with better versus poorer adjustment (McCabe and O’Connor, 2012). Another study with individuals with PD demonstrated resilience significantly correlated with better QOL, less disability and psychiatric symptom burden, but not disease severity (Robottom et al., 2012). These findings suggest resilience is related to disease psychosocial adjustment and not necessarily disease progression; however, correlational analyses were employed rather than multivariate analyses, and there are limitations to the conclusions that can be drawn from this study.
The previously reviewed literature emphasizes the value in studying how resilience might buffer the negative psychological effects that can result from disease and illness. PD is an ideal population in which to study resilience due to the chronic, progressive nature of the disease, and the challenges with illness adjustment including mental health issues with a pathophysiological etiology. Additionally, evidence exists that mental health and QOL are modifiable and cannot be solely predicted by disease progression (Cummings, 1992). This project aims to replicate previous findings establishing the role of resilience in PD and address gaps in the PD literature of methodologically sound empirical research on resilience. Specifically, this project examines the role of resilience in potentially modifying mental health/QOL adjustment for individuals with PD, even after controlling for other relevant clinical variables, including NMS. We hypothesize that after controlling for demographic variables and functional impairment, increased NMS (excluding confounding mood-related items) will be associated with poorer adjustment, specifically worse depression, apathy, life satisfaction, and QOL. We additionally predict that resilience will be significantly associated with better adjustment above and beyond control variables and NMS.
Method
Participants
Study participants were recruited from April 2013 to October 2013 through a US interdisciplinary movement disorder specialty clinic (Parkinson’s and Movement Disorders Center; PMDC) that involves research, clinical evaluation, treatment, and outreach. Recruitment used an institutional review board (IRB)-approved advertisement shared at community organizations and the PMDC website, requesting that interested participants contact the PMDC for further information. Inclusion criteria were as follows: (1) a confirmed medical diagnosis of PD and (2) age 21–90+ years. Individuals with other movement disorders (e.g. Essential Tremor, Huntington’s disease, dystonia), unable to understand English, or unable to complete the survey for any reason were excluded from the study. IRB approved this study (IRB # HM14988).
Procedure
The study was advertised as a web-based survey that required 45–60 minutes to complete, with paper copies available upon request. Survey data were collected and managed in a secure, web-based database (Research Electronic Data Capture (REDCap); Harris et al., 2009). Paper surveys were scanned and entered into the database. There was no compensation for study participation. Participants were contacted via phone to complete missing items. Missing data of unreachable participants were analyzed using Little’s (1998) missing completely at random (MCAR) test; results indicated that items were missing completely at random across demographic variables (χ2 = 5.148, degree of freedom (df) = 5; p = .398) and all scale items (χ2 = 142.63, df = 141; p = .446). Missing values were replaced using the Expectation–Maximization method.
Measures
The survey contained a battery of questionnaires from a larger study that comprehensively assessed PD, resilience, and psychologically related variables; only scales relevant for the present study are described below. Demographic information gathered included age, gender, ethnicity, marital status, income level, education level, and patient-reported number of years since diagnosis.
The Resilience Scale for Adults
The 33-item Resilience Scale for Adults (RSA), a highly regarded resilience measure (Windle et al., 2011), measures the protective resources that promote resilience in adults (Friborg et al., 2003). The six RSA factors are as follows: perception of self, perception of future, social competence, structured style, family coherence, and social resources. Each item uses a 5-point semantic differential scale and contains a stem with two responses at both ends of the scale (e.g. “I feel that my future looks: very promising—uncertain”). Participants mark one box along the scale that is most true as it applies to them. Scores are summed for a total RSA score, with higher scores indicating greater resilience (Friborg et al., 2009). The RSA has adequate internal consistency and test–retest reliability, and convergent, discriminant (Friborg et al., 2003), and predictive validity (Friborg et al., 2006).
Nonmotor Symptoms Questionnaire
The 30-item Nonmotor Symptoms Questionnaire (NMSQuest) targets 10 domains of PD-specific NMS: gastrointestinal tract, urinary tract, sexual function, cardiovascular, apathy/attention/memory, hallucinations/delusions, depression/anxiety/anhedonia, sleep/fatigue, pain, and miscellaneous (e.g. diplopia) (Chaudhuri et al., 2006). Respondents indicate whether or not they have experienced each symptom within the past month. The NMSQuest has empirical support as a screening tool to assess NMS in PD with good face and content validity (Chaudhuri et al., 2006) and adequate specificity and sensitivity (Romenets et al., 2012).
In this study, the NMSQuest was administered in its entirety; however, two domains that targeted mood symptoms (i.e. apathy/attention/memory, depression/anxiety/anhedonia) were excluded from analyses since these symptoms were confounded with the mental health variables of interest.
Starkstein Apathy Scale
The 14-item Starkstein Apathy Scale (SAS) measures the diminished motivation, behavioral, cognitive, emotional, and insight aspects of apathy (Starkstein et al., 1992). Respondents rate items on a 4-point Likert scale; responses are summed with higher scores indicating greater apathy. The SAS is an appropriate tool for assessing apathy in individuals with PD (Leentjens et al., 2008) and has acceptable psychometric properties, including internal consistency, inter-rater, and test–retest reliability, and adequate sensitivity and specificity using a cut-off score compared with neurologist ratings (Pedersen et al., 2012; Starkstein et al., 1992).
Parkinson’s Disease Questionnaire
The Parkinson’s Disease Questionnaire (PDQ-39) is a 39-item QOL measure for PD with eight domains: mobility, activities of daily living, emotional well-being, stigma, social support, cognitions, communication, and bodily discomfort (Jenkinson et al., 2008). Respondents rate each item on a 5-point scale the degree of task difficulty he or she experienced within the past month due to PD. Scores for each domain are summed and transformed to a 0–100 scale, with higher scores indicating greater task difficulty and poorer QOL. This study used the single index score as recommended in the manual to assess overall impact of PD on QOL and avoid multiple statistical comparisons. The PDQ-39 has adequate psychometric support through numerous validation studies including internal consistency and test–retest reliability, and construct validity (Jenkinson et al., 2008).
Beck Depression Inventory-II
The Beck Depression Inventory-II (BDI-II) is a depression severity measure comprising 21 items rated on a 4-point Likert scale (Beck et al., 1996). Respondents choose statements characterizing their feelings over the past 2 weeks. Item responses are summed for a total score and classified within a severity range, with higher scores indicating more severe depression symptoms (Beck et al., 1996). The BDI-II is validated with older adults (Segal et al., 2008) and has been widely used in PD research (Ehmann et al., 1990; Schrag et al., 2000).
Satisfaction with Life Scale
The 5-item self-report Satisfaction with Life Scale (SWLS) assesses an individual’s life satisfaction and is validated for use within PD (Lucas-Carrasco et al., 2014; Diener et al., 1985). Individuals rate on a 7-point Likert scale their agreement/disagreement with each statement. Scores are summed (range = 5–35); higher scores indicate greater life satisfaction. The SWLS has adequate psychometric properties, including acceptable test–retest and internal consistency reliability (Diener et al., 1985).
Statistical analyses
Statistical analyses used SPSS Statistics 22 software. Statistical assumptions were checked, including missing data, required sample size, outliers, and univariate and multivariate normality. Of the 224 surveys initiated during the data collection period, 139 (62%) met criteria for use in the final data set. The remaining 85 (38%) were unusable because (1) surveys were initiated but incomplete with over half of the data missing (n = 71) and (2) participants completed duplicate surveys (n = 14; earlier completed survey versions were used to avoid response bias). One completed survey was eliminated from analyses because the participant had a comorbid diagnosis of schizophrenia and his other responses were outliers in several normality tests. The final sample size was 138.
During assumption checks, the control variable measuring degree of functional impairment (Functional Independence Measure-Self Report (FIM-SR); Grey and Kennedy, 1993; Keith et al., 1987) was kurtotic and highly negatively skewed, with most participants reporting high functioning. The FIM-SR achieved normal distribution after a reverse score and subsequent log transformation, which are indicated in negatively skewed data (Field, 2009). This reverse transformation results in higher scores reflecting poorer functioning when interpreting regression output.
Four hierarchical regression analyses were conducted for each of the dependent variables of interest (depression, apathy, life satisfaction, and PD-QOL). In each regression, assumptions of multivariate normality, linearity, homoscedasticity, and multicollinearity were met. Control variables were entered in at Step 1 (age, gender, ethnicity, years of education, income level, years since diagnosis, and functional impairment (as measured by the FIM-SR)), the NMS variable was added at Step 2, and resilience was added at Step 3 to test its contribution to the model above and beyond other independent variables.
Results
Sample characteristics
Bivariate Pearson correlations among the target variables are depicted in Table 1. Of the 138 participants, the mean age was 64.15 years (standard deviation (SD) = 10.09 years, range 34–89 years), with 54% female, 52.9% retired, 95% Caucasian, 65.9% with a Bachelor’s degree or higher, and 40.1% reporting annual income $65,001–$105,000 (Table 2). Participants received a PD diagnosis 6.42 years ago (SD = 5.02 years, range 1–32 years), and 57.9% reported no comorbid diagnoses other than PD. Participants reported higher functional independence using FIM-SR total scores (M = 121.57, SD = 7.21) than a sample of adults with chronic pain and neuromuscular disorders (M = 103.71, SD = 27.97; Jensen et al., 2005).
Bivariate correlations of study variables.
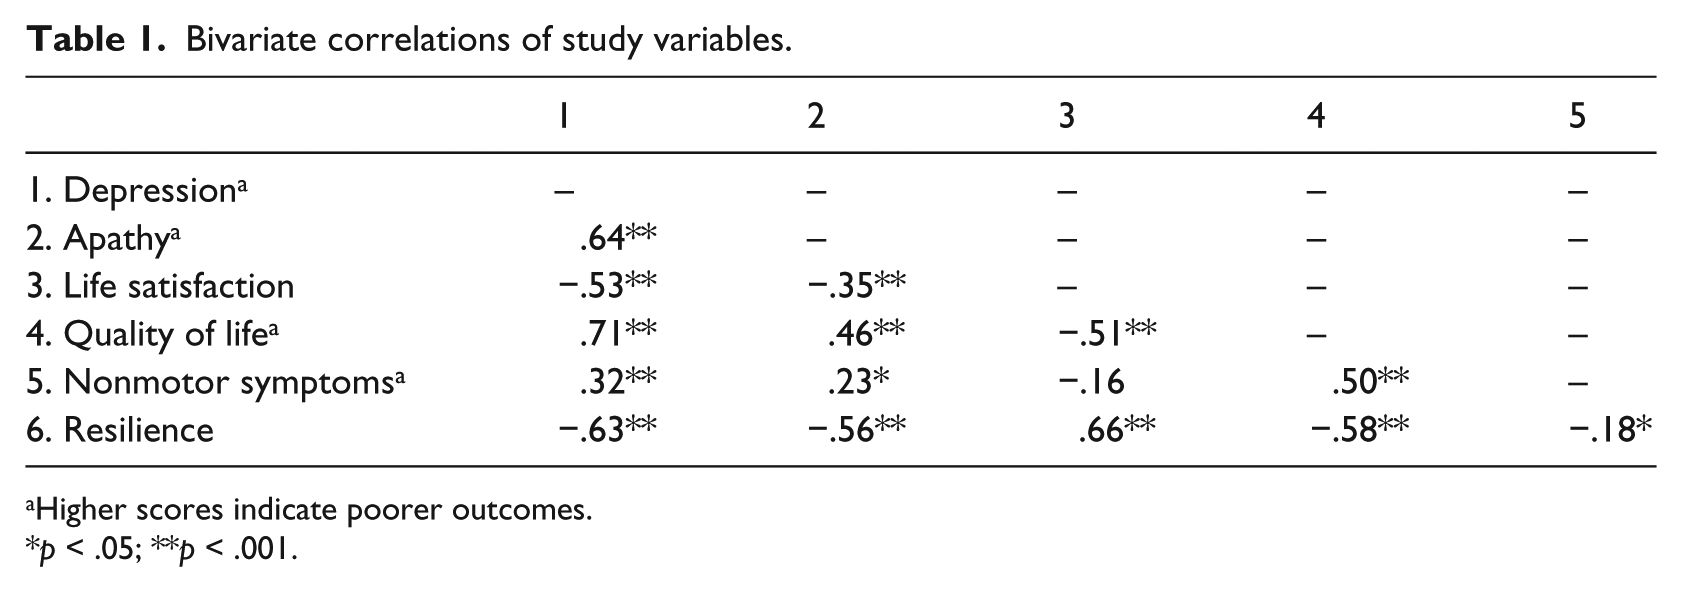
Higher scores indicate poorer outcomes.
p < .05; **p < .001.
Descriptive statistics of demographic and study variables.
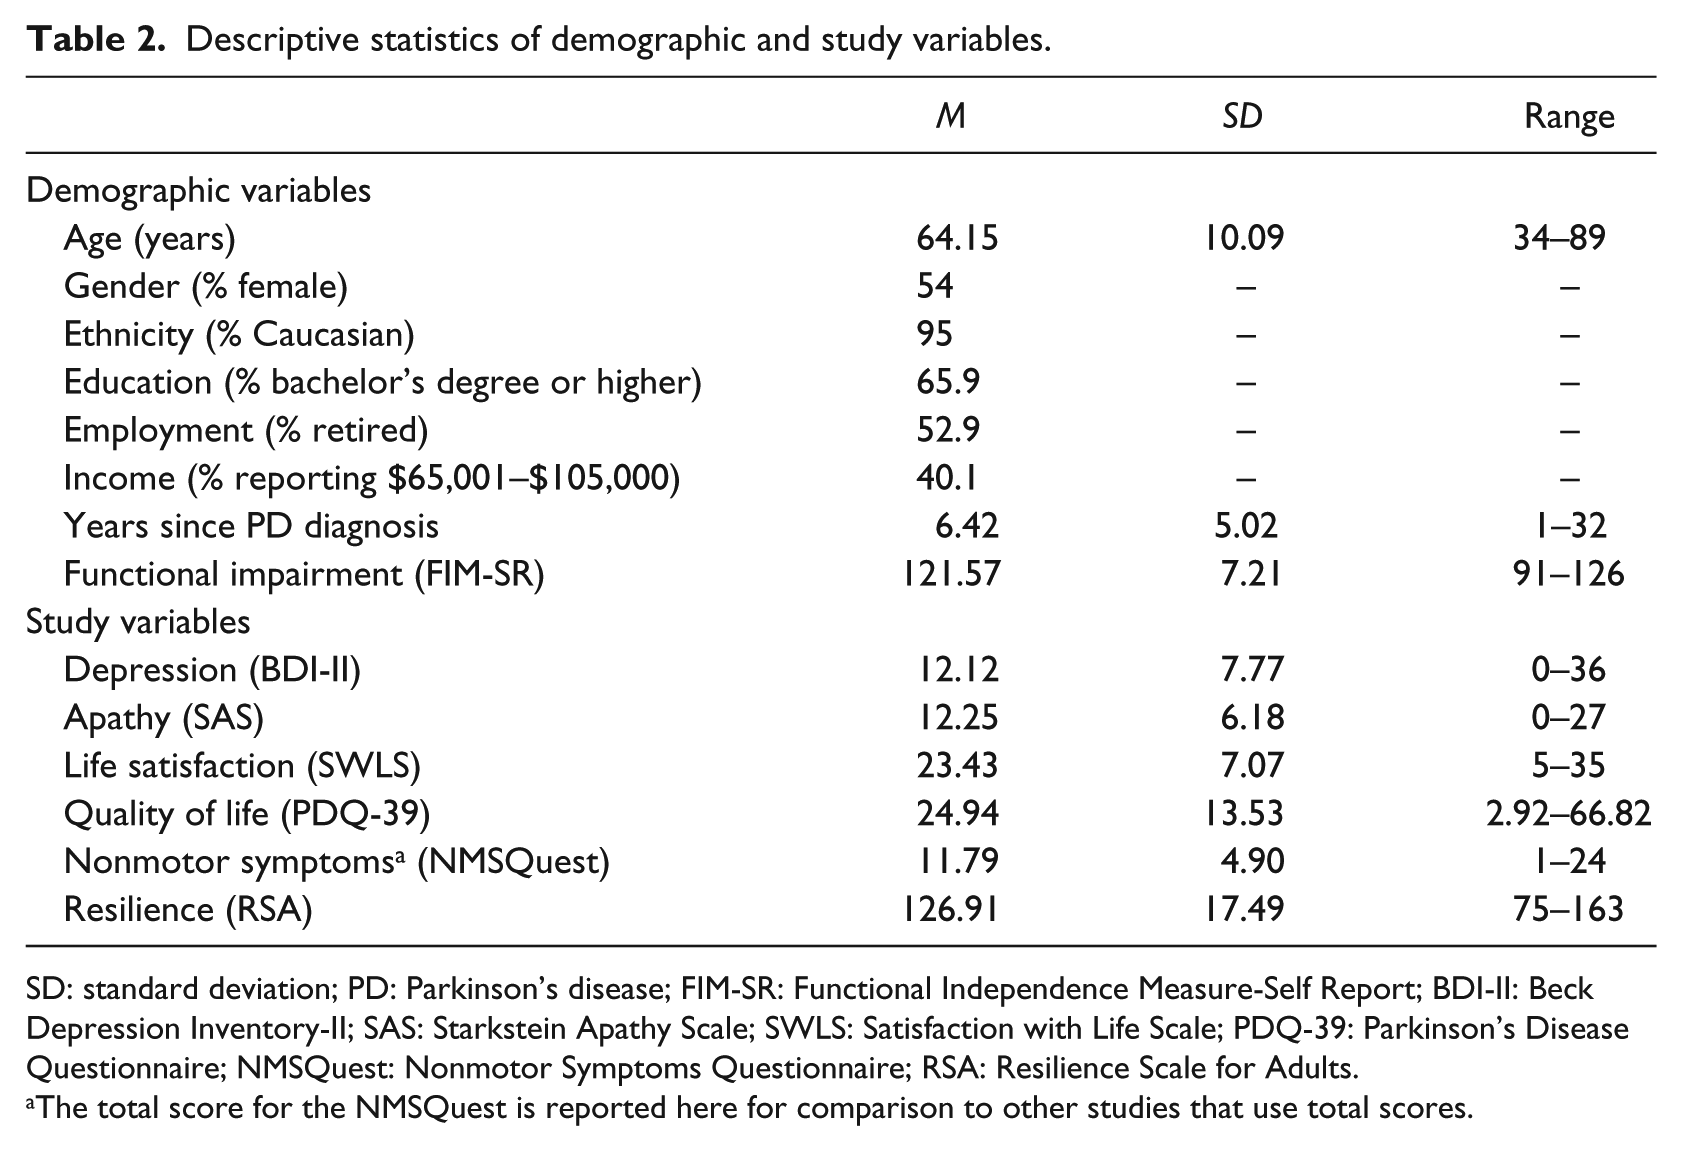
SD: standard deviation; PD: Parkinson’s disease; FIM-SR: Functional Independence Measure-Self Report; BDI-II: Beck Depression Inventory-II; SAS: Starkstein Apathy Scale; SWLS: Satisfaction with Life Scale; PDQ-39: Parkinson’s Disease Questionnaire; NMSQuest: Nonmotor Symptoms Questionnaire; RSA: Resilience Scale for Adults.
The total score for the NMSQuest is reported here for comparison to other studies that use total scores.
Participants reported higher depression and apathy than other samples (Kirsch-Darrow et al., 2011). BDI-II scores indicated that one-third of the participants (35.5%) had clinically significant depression levels (score ⩾ 14); 18.8%, 13%, and 3.6% had scores in mild, moderate, and severe depression ranges, respectively. Almost half (46%) scored above the apathy clinical cut-off (Starkstein et al., 1992). Overall, 17.3% (n = 24) had apathy alone, 6.5% (n = 9) had depression alone, 28.8% (n = 40) had comorbid apathy and depression, and 47.1% (n = 65) had neither depression nor apathy, which are similar distributions found in other studies (Benito-León et al., 2012). The average QOL score (PDQ-39) was 24.94 (SD = 13.53), slightly lower than the normative sample scores reported in the PDQ-39 manual (M = 30.63, SD = 20.02; Jenkinson et al., 2008), indicating better QOL and less negative impact of PD on participants’ daily lives. The average SWLS score was 23.43 (SD = 7.07), indicating slightly greater life satisfaction than a normative sample (M = 21.1, SD = 6.7; Lucas-Carrasco et al., 2014). Participants reported an average of 11.79 symptoms using total NMSQuest score (SD = 4.9), which is comparable to another sample of individuals with PD (M = 10.4, SD = 3.4; Lageman et al., 2014). Participants’ average RSA score was 126.91 (SD = 17.49), similar to a large normative adult sample (M = 127.56, SD = 17.35; Friborg et al., 2009).
Regression analyses
Table 3 depicts the hierarchical regression analyses, beta weights, ΔR2, and corresponding F values at each step of the regression, including the final model with all independent variables included.
Summary of hierarchical regression analyses.
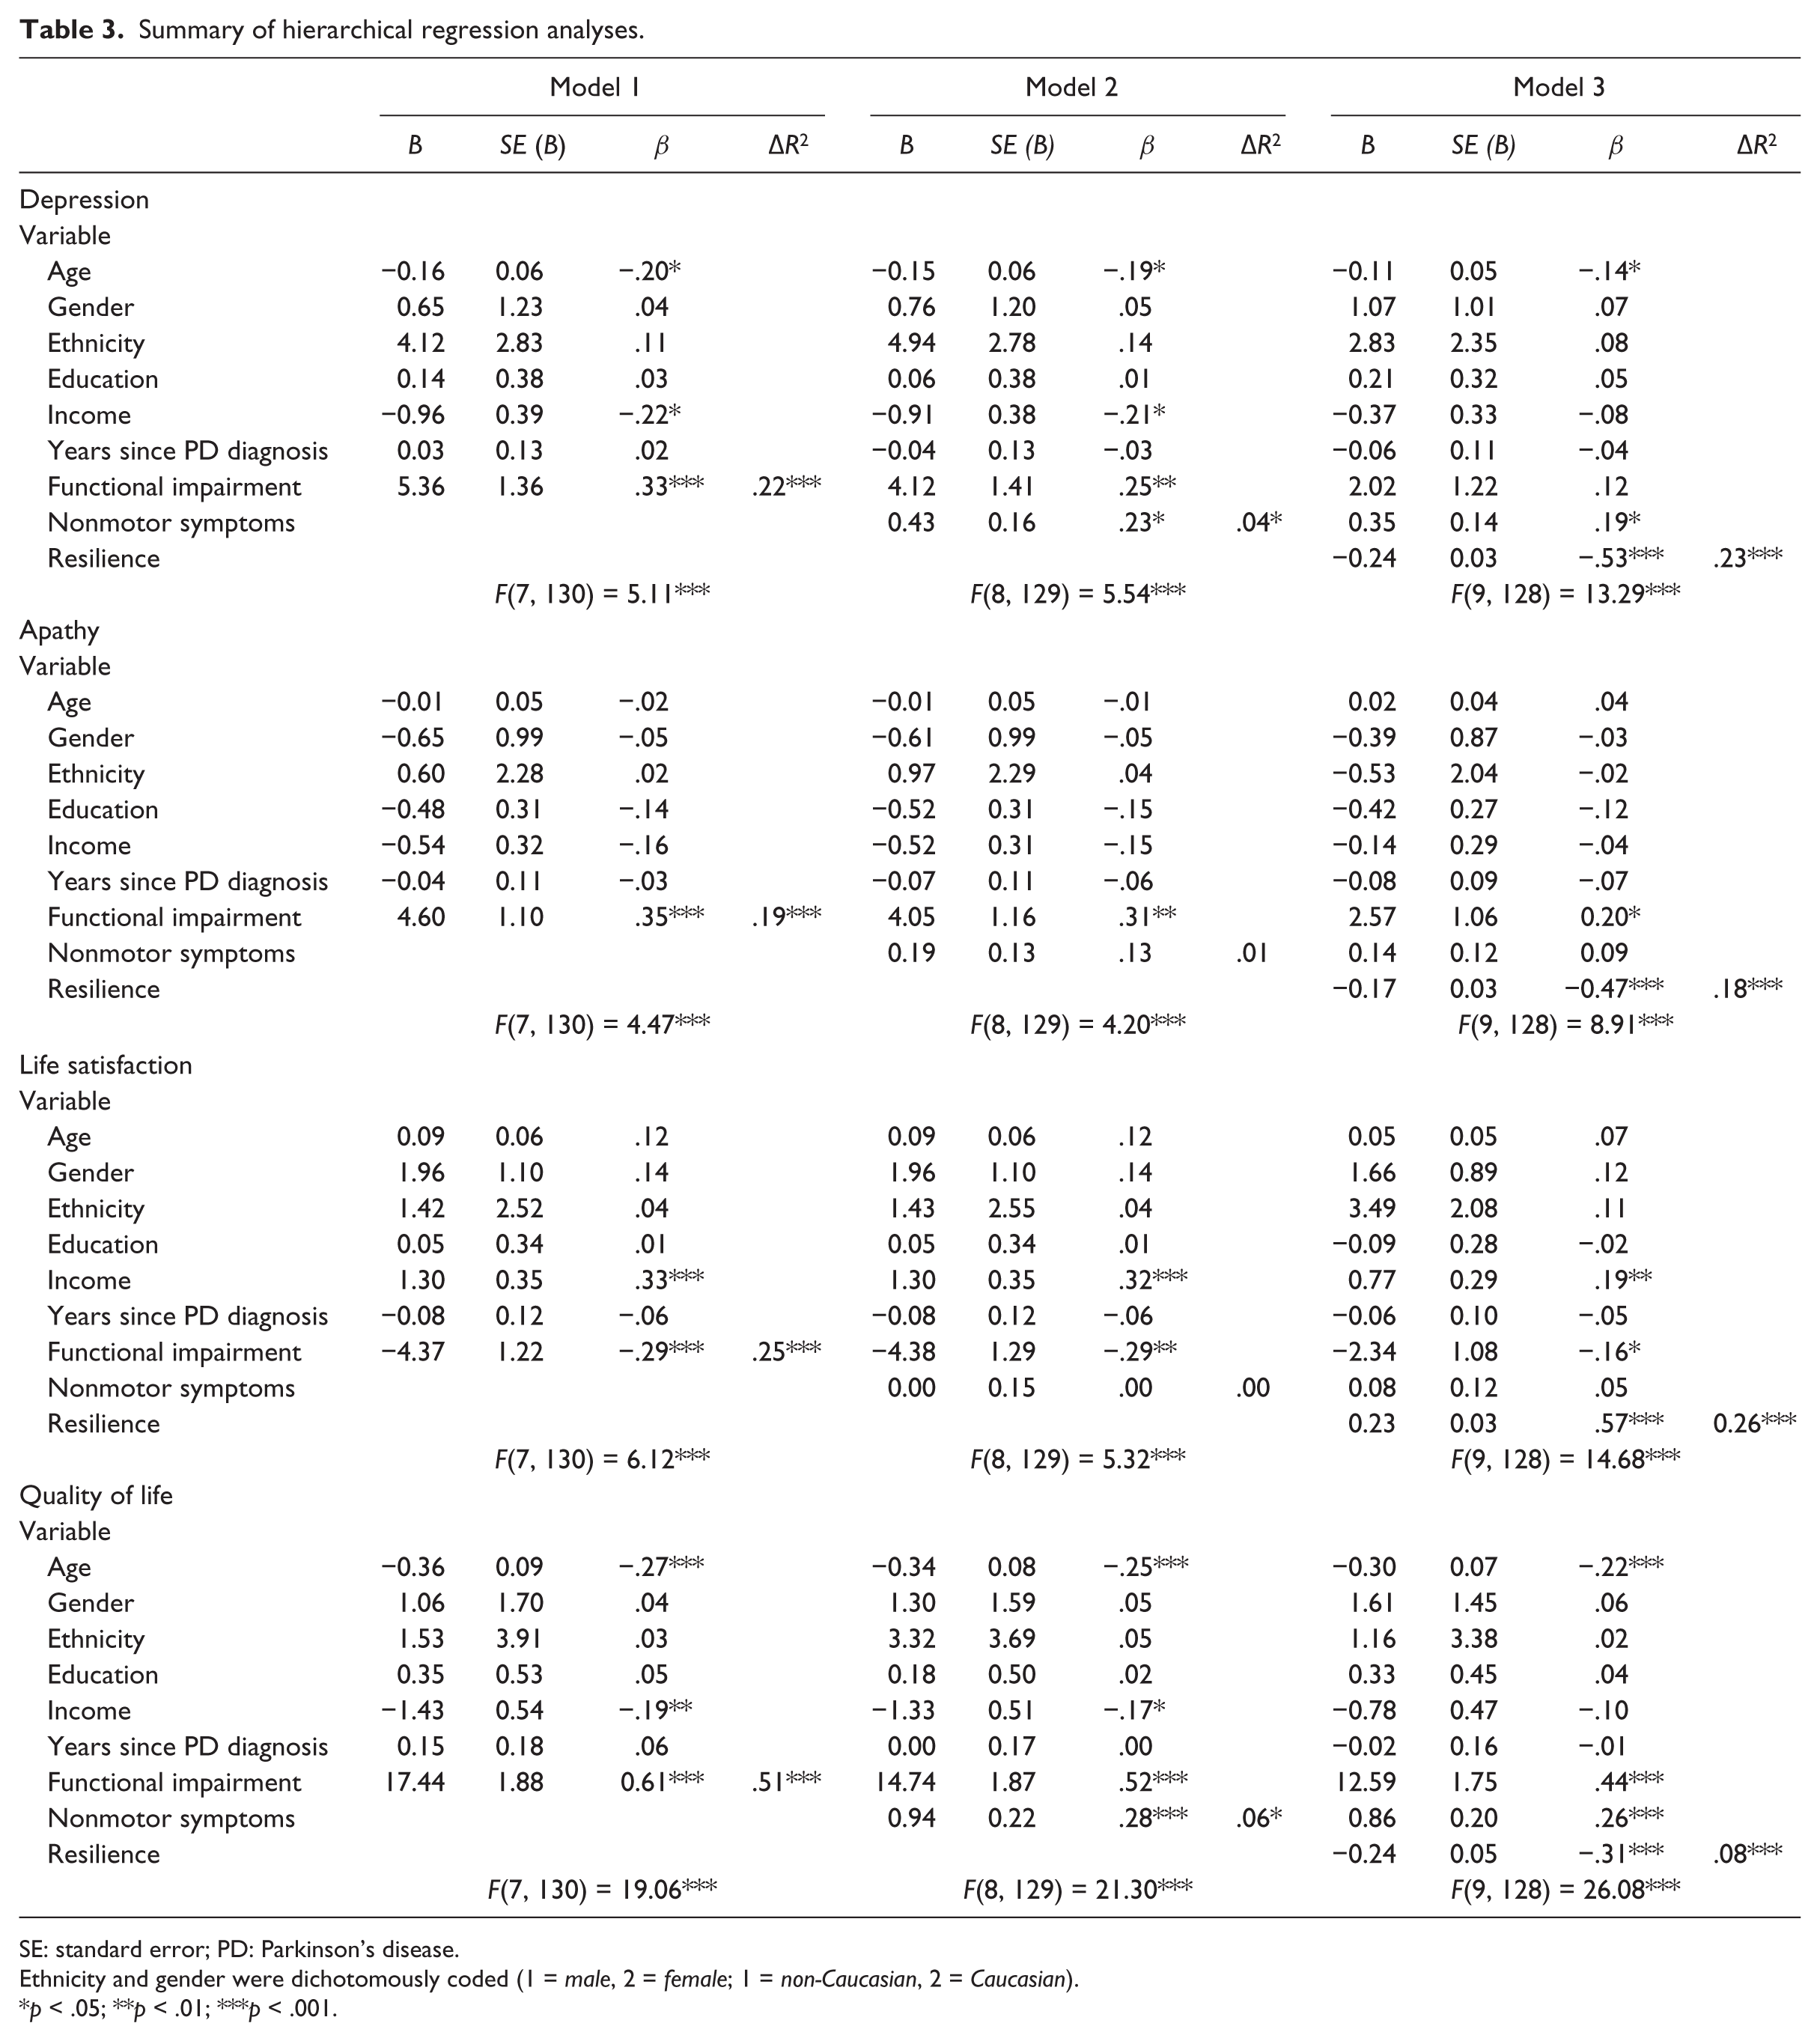
SE: standard error; PD: Parkinson’s disease.
Ethnicity and gender were dichotomously coded (1 = male, 2 = female; 1 = non-Caucasian, 2 = Caucasian).
p < .05; **p < .01; ***p < .001.
Depression
The hierarchical regression model significantly predicted depression, F(9, 128) = 13.29, p < .001, R2 = .48. Younger age, less income, and greater functional impairment were associated with depression at Step 1, R2 = .22, F(7, 130) = 5.11, p < .001. At Step 2, greater number of NMS was associated with more depression and significantly improved the model, R2 = .26, ΔR2 = .04, ΔF(1, 129) = 6.94, p = .009. When resilience was added at Step 3, income was no longer associated and the model was significantly improved, R2 = .48, ΔR2 = .23, ΔF(1, 128) = 56.29, p < .009, with higher self-ratings of resilience associated with less depression.
Apathy
The hierarchical regression model significantly predicted apathy, F(9, 128) = 8.91, p < .001, R2 = .39. Greater functional impairment was associated with apathy at Step 1, R2 = .19, F(7, 130) = 4.47, p < .001. At Step 2, the number of NMS did not improve the model and was not associated with apathy, R2 = .21, ΔR2 = .01, ΔF(1, 129) = 2.05, p = .155. At Step 3, the resilience variable improved the model, R2 = .39, ΔR2 = .18, ΔF(1, 128) = 37.17, p < .001, with higher resilience associated with less apathy.
Life satisfaction
The hierarchical regression model significantly predicted life satisfaction, F(9, 128) = 14.68, p < .001, R2 = .51. More income and less functional impairment were associated with greater life satisfaction at Step 1, R2 = .25, F(7, 130) = 6.12, p < .001. At Step 2, the number of NMS did not improve the model and was not associated with life satisfaction, R2 = .25, ΔR2 = .00, ΔF(1, 129) = 0.00, p = .982. At Step 3, the resilience variable improved the model, R2 = .51, ΔR2 = .26, ΔF(1, 128) = 67.59, p < .001, with higher resilience associated with greater life satisfaction.
QOL
The hierarchical regression model significantly predicted PD-QOL, F(9, 128) = 26.08, p < .001, R2 = .65. Older age, more income, and less functional impairment were associated with greater QOL at Step 1, R2 = .51, F(7, 130) = 19.06, p < .001. At Step 2, fewer number of NMS was associated with greater QOL and improved the model, R2 = .57, ΔR2 = .06, ΔF(1, 129) = 18.74, p < .001. At Step 3, the resilience variable improved the model, R2 = .65, ΔR2 = .08, ΔF(1, 128) = 28.30, p < .001, with higher resilience associated with greater QOL.
Discussion
This study explored the roles of self-reported resilience and NMS in mental health adjustment and QOL among patients with PD. As expected, self-reported resilience was significantly associated with all variables representing mental health/QOL adjustment in PD, even after controlling for relevant demographic variables, functional status, and NMS. This robust role of resilience is noteworthy and suggests that clinically meaningful features of PD adjustment are strongly influenced by perceptions of one’s resilience. Potentially modifiable components of the construct, such as perceptions of self or future, could be bolstered through resilience-focused interventions that emphasize emotion regulation (Tugade and Fredrickson, 2007) and positive emotions to broaden-and-build resources for dealing with challenges (Cohn et al., 2009).
An unexpected study finding was that the majority of individuals reported relatively high resilience (94% at or above the midpoint on average across RSA items) despite slightly higher than normative depression and apathy scores. These results fit with the notion of resilience as “ordinary magic” that reflects basic human adaptation rather than an extraordinary process instilled only in a given few who are free of mood disturbance (Masten, 2001). Even individuals in this study who reported clinically significant depression symptoms (BDI-II score ⩾ 14) also reported relatively high levels of resilience; they did indeed have comparatively lower resilience scores (M = 113.45, SD = 16.76; n = 49) than those without depression (M = 134.31, SD = 12.91; n = 89), t(136) = 8.15, p < .001), but they still rated themselves as relatively resilient, with an average RSA item score of 3.44 on the 5-point scale. This finding supports the resilience conceptualization as a construct that is on a different continuum than poor psychological adjustment (Friborg et al., 2009).
NMS were associated with depression and QOL, which is consistent with the literature (Martínez-Martín et al., 2011; Lageman et al., 2014). Importantly, this study demonstrated that when confounding mood-related items (i.e. neuropsychiatric symptoms), which are typically included in NMS assessments, are excluded from analyses, the remaining somatically focused NMS (e.g. autonomic and gastrointestinal dysfunction) still account for significant variance in depression and PD-QOL. While there may be some overlap between these remaining NMSQuest symptoms and the somatic depression symptoms within the BDI-II (e.g. energy, libido, sleep disturbance), somatic symptoms can be manifestations of depression and/or PD that are challenging to distinguish between due to symptom interaction. Similarly, the relationship found between NMS and PD-QOL may be largely driven by some of the physically focused PDQ-39 items. NMS were not related to apathy or life satisfaction, possibly due to this exclusion of conceptually similar mental health/QOL items. The remaining somatic NMS may have been more disruptive to overall QOL and mood but not life satisfaction in our functionally independent sample. Overall, NMS are an important focus area for PD adjustment in which perception of symptom influence on QOL may be more powerful than disease progression itself (Hurt et al., 2012; Suzukamo et al., 2006).
Older age was associated with less depression and greater QOL and remained a significant variable in the final regression models. However, the beta weights were rather modest and age did not affect life satisfaction nor apathy. A post hoc calculation showed no significant correlation between age and resilience in our sample (r = .04, p = 0.65). Some studies have found an association between older age and better chronic disease adjustment (Rustøen et al., 2005; Shamaskin et al., 2012; Wenzel et al., 1999) and greater resilience (Terrill et al., 2014). Possible explanations for why age was not a robust predictor in this sample relative to other studies include the restricted older age range and the unique nature of PD, such that depression and apathy are more likely to have an organic rather than reactive etiology.
There are several limitations to this study. The cross-sectional design precludes any definitive assertion that having higher self-perceived resilience actually protected against adverse outcomes in a causal fashion. An ideal longitudinal study might repeatedly measure individual’s resilience, mental health/QOL, and PD symptoms throughout the disease course and test whether self-reported resilience could predict later outcomes. Similarly, tying the study to a specific self-report measure of resilience is another limitation. The definition of the multifactorial resilience construct remains debated, such as when resilience is best measured, if stressors carry the same risk over the lifespan, if adversity is even required for resilience development (Luthar et al., 2000; Smith and Hayslip, 2012), or the degree to which resilience involves genetic underpinnings (Kim-Cohen and Turkewitz, 2012). The measurement limitations in this study partly reflect the state of the resilience literature and challenge integrating the construct into mental and physical health domains.
Another limitation is that participants self-selected to complete the survey and were possibly a healthier group not reflective of the general population of individuals with PD, although average scores on several measures matched closely to other samples with the disease. Similarly, these findings may not extend to those who have significant cognitive impairment or dementia. However, data from baseline neuropsychological evaluations at PMDC from participants that consented for their records to be used for research purposes (n = 66) demonstrated that 33% of the entire sample in this study met criteria for mild cognitive impairment, which is comparable to other clinical samples (25%–30%; Aarsland et al., 2010).
In summary, these results demonstrated that resilience plays a critical role in mental health/QOL adjustment for individuals with PD, even after controlling for other relevant demographic and clinical variables. Furthermore, the pattern of high resilience along with higher prevalence of mood symptoms than normative samples underscores the notion that resilience represents more than the absence of vulnerability to mental health disorders (Friborg et al., 2009). Finally, this project is the first to the authors’ knowledge to measure resilience in PD with the RSA, providing normative data for a sample of older adults with a common, age-related chronic disease. This study offers a foundation for using the RSA to predict clinical outcomes, as has been demonstrated in other studies with the measure (Friborg et al., 2006), and supports efforts toward capitalizing on psychological strengths and enhancing the quality of people’s lives as they live with chronic disease.
Footnotes
Declaration of conflicting interests
The authors declare that there is no conflict of interest.
Funding
This research received no specific grant from any funding agency in the public, commercial, or not-for-profit sectors.