



Abstract
This study modified food attentional biases via computerized attentional bias modification training and examined the effects on food intake. Overweight women were randomly allocated to (1) direct attention away from food (“attentional-training”), (2) direct attention at random to food or neutral (“placebo”), or (3) no training (“control”). Individuals then completed a taste test. Those in the attentional-training consumed on average 600 kJ less of total food compared to the placebo. Those in the attentional-training had a reduction in food attentional bias compared to the placebo group, when controlling for executive function. Attentional-training seems to reduce high-calorie intake in overweight women.
Introduction
Research has found that obese individuals find high-calorie foods more rewarding than low-calorie foods (Davis et al., 2007; Stice et al., 2009) and demonstrate increased activation of dopaminergic reward pathways during exposure to food-related cues (Stoeckel et al., 2008). Overactivation of the brain dopamine pathway increases the salience of these food-related cues in the environment to make them more “attention-grabbing,” resulting in a selective tendency to automatically attend to food cues (Castellanos et al., 2009; Nijs et al., 2010; Werthmann et al., 2011). Thus, attentional biases to food cues develop in a similar way to any other conditioned response to reward (e.g. drugs) or fear (e.g. threatening or painful stimuli). This continued selective attention to food stimuli promotes craving and further intake of food, which perpetuates and maintains the cycle of overeating (Field and Cox, 2008). Individuals with high food cue reactivity (e.g. attentional bias, craving) are therefore assumed to be more vulnerable to overeating and become obese, especially in the current food-rich environment (Polivy et al., 2008).
Attentional biases to food cues in obesity have been documented. Using a dot probe task, attentional biases toward high-calorie foods have been found in obese women compared to normal-weight controls (Kemps et al., 2014). One study measuring attentional bias via visual fixation on food versus non-food pictures demonstrates enhanced orientation to food among both obese and non-obese individuals when fasting, but only among the obese when satiated (Castellanos et al., 2009). Subsequent studies concur that, compared to healthy-weight individuals, overweight and obese people pay more attention to food pictures (Nijs et al., 2010; Werthmann et al., 2011). A recent systematic review of 19 studies found that the current findings are suggestive of differences in attentional bias, with all but four studies supporting the notion of enhanced reactivity to food stimuli in overweight/obese individuals compared with healthy-weight individuals (Hendrikse et al., 2015).
The evidence to date on attentional biases in obesity is in need of replication and extension. Indeed, attentional biases have been studied more extensively in clinical disorders, including anxiety (Bar-Haim, 2010) and eating disorders (Brooks et al., 2011; Faunce, 2002). In particular, research in anxiety has used the dot probe task to modify attentional biases (Bar-Haim, 2010). These studies indicate that training individuals to divert their attention away from threat-related cues reduces both attentional bias for the threat-related cues and symptoms of the anxiety disorder, and these effects were sustained at follow-up testing (Amir et al., 2009; Schmidt et al., 2009). Hence, computerized attentional bias modification programs have emerged as a potential intervention for clinical disorders where attentional biases are involved. In experimental studies using obese individuals, attentional modification training using food pictures has been shown to increase attentional biases in the attend food group and decrease these biases in the avoid food group (Kemps et al., 2014, 2016). These findings were replicated in an undergraduate sample; participants trained to attend to healthy food cues, compared to the group who had to attend to the unhealthy food cues, showed an increased attentional bias for healthy cues (Kakoschke et al., 2014). In addition, the healthy food group also ate healthier snacks. In another study using the attentional modification training, undergraduate students in the “avoid food” group ate less chocolate than did those in the “attend food” group (Kemps et al., 2015), and these were maintained 1 week later but only when multiple sessions were completed. Unfortunately, it is not clear whether the group difference in food intake was driven by a decrease in intake in the avoid food group, an increase in the attend food group, or both, and a no-training control group is needed to understand these issues further. We also do not know whether obese individuals, as opposed to undergraduate students, will reduce their food intake after an attentional modification training, as this could potentially be used as a weight management treatment strategy. This study aimed to replicate and extend previous studies by modifying attentional biases related to high-calorie food in overweight and obese individuals and examine the impact on eating behavior toward both high- and low-calorie foods. The design will also help us understand whether modifying attentional biases away from high-calorie foods has an effect on high- and low-calorie intake, or whether the effect is specific to high-calorie stimuli, providing important information for treatment.
It was hypothesized that attentional-training away from food cues would reduce attentional bias and food intake when compared to the placebo training (where training occurs to both food and neutral stimuli at random) and control (no training) groups, in overweight and obese participants. The current placebo control has been used in previous studies, including clinical populations (Amir et al., 2009; Schmidt et al., 2009). The placebo training will be used to assess the influence of attentional-training on attentional bias, and both the placebo and control groups will be included in the assessment of food intake.
In addition, reviews indicate that obesity is associated with low executive function across all ages (Fitzpatrick et al., 2013; Smith et al., 2011). Executive functions are referred to as “higher order” or explicit cognitive abilities due to their role in modulating “lower order” or implicit cognitive abilities (Gilbert and Burgess, 2008; Lezak et al., 2004), including perhaps attentional biases. Consequently, reduced executive function could lead to poorer control of attentional biases and impair the sustained attention required to successfully complete the attentional bias training tasks. This study will examine the association between executive function, attentional biases, and food intake and control for executive function in the relationship between attentional bias and food intake to understand whether executive function moderates this relationship.
Method
Participants
A total of 75 female overweight/obese participants were included in this study, of which 67 first-year undergraduate psychology students from Western Sydney University participated for course credit and 8 participants from the community received US$20 for their time. Participants had a mean age of 26.1 years (standard deviation (SD) = 9.0; range = 18–50) with a body mass index (BMI) in the overweight/obese range (BMI ⩾ 25 kg/m2; M = 33.3; SD = 6.1; range = 25–59), as defined by the World Health Organization (World Health Organization, 2000). Participants were initially excluded if they endorsed any serious psychiatric condition (e.g. schizophrenia) or demonstrated limited fluency in English. In addition, two participants were excluded, one for having a BMI below 25 and another due to being highly distracted during the task and unable to finish. This study was approved by the Ethics Committees at the University of Western Sydney and the University of New South Wales.
Power analyses
For comparison between groups, predicting a medium effect size (Cohen’s d of 0.6), using a power of 80 percent and an alpha error rate at 0.05, a sample size of 23 individuals per group is needed (one-tailed, as direction is expected). This study included 25 participants per group.
Materials and tasks
Demographic questionnaire
Information on age and English fluency (years speaking English) was collected.
BMI
Participants’ weight and height were measured and BMI (kg/m²) was calculated.
Hunger and craving scales
A visual analog scale (VAS) was used as a rapid index of subjective hunger and craving before and after the attentional-training task. Participants placed a mark on a 10-mm horizontal line from 0 (not hungry) to 10 (very hungry) in response to the questions “How hungry are you feeling now?” and “How strong is your craving for food right now?” VAS have been used in a variety of settings and found to be a reliable and valid method of measuring subjective motivational states of hunger and craving (Flint et al., 2000).
Fasting
Participants were instructed not to eat for 2 hours before testing, so that both groups would be equally hungry and could engage sufficiently in the taste test. Fasting was measured by the question “When was the last time you ate?” The number of hours of fasting was then computed.
Mood
The Depression Anxiety Stress Scale-21 (DASS-21; Lovibond and Lovibond, 1995) is a 21-item self-report questionnaire. Participants were asked to rate the extent to which they experienced each mood state (depression, anxiety, and stress) over the past week on a 4-point Likert scale. We included this measure to ensure that the groups were equivalent in terms of mood, as a negative mood can impact on the eating behavior (Cardi et al., 2015).
Executive functioning
Two tests of executive function were used. These measures of executive function were selected because of their availability and because they are freely accessible, easy to administer, and take into account any mobility issues individuals with obesity might have. The Trail Making Test (TMT) assesses mental flexibility (Reitan, 1958). TMT-B requires the participant to switch cognitive sets between numbers and letters. The second executive function test was the Hayling Sentence Completion Task (Burgess and Shallice, 1997), which measures pre-potent response suppression, by the Hayling B. A list of 15 sentences was read and the participants were asked to complete the sentence as quickly as possible with a word that does not fit at all. Higher scores indicated greater cognitive inhibitory capacity. Both the Hayling B and TMT-B were used in the analyses as measures of executive function.
Eating disorder symptoms
The Eating Disorder Examination Questionnaire (EDE-Q; Fairburn and Bèglin, 1994) is the self-report measure which consists of 28 items that evaluate four aspects of eating disorder symptoms: restraint (5 items, for example, “Have you been deliberately trying to limit the amount of food you eat to influence your shape or weight?”), eating concerns (5 items, for example, ‘Has thinking about food, eating or calories made it very difficult to concentrate on things you are interested in—working, following a conversation or reading?”), shape concerns (8 items, for example, “How dissatisfied have you been with your shape?”), and weight concerns (“How dissatisfied have you been with your weight?”). Items refer to the past 4 weeks and are scored in terms of severity or frequency from 0 to 6. The EDE-Q was used to ensure that there were no differences between the groups in terms of eating disorders symptoms.
Dot probe task
The dot probe task was developed to measure attentional bias (Posner et al., 1980) and has since been adapted for use with various disorder-related cues (MacLeod et al., 1986). A central fixation point (“+++”) was presented at the beginning of each trial for 500 ms, followed by the word pair for 500 ms. This duration allows for controlled processing of the stimuli (i.e. maintained attention) based on studies in visual perception (Duncan et al., 1994). A total of 15 word pairs (e.g. cake–maps) were presented with one word above the other and were shown four times each (with position counterbalanced) for a total of 60 trials. Target and neutral words were matched for usage frequency and word length (Kucera and Francis, 1967). A probe (“<” or “>”) appeared immediately upon word offset in the location of either the top or bottom word and remained until the participant pressed one of the response keys. The participants were instructed to respond as quickly and accurately as possible. Words were presented on a 15-in WXGA+ screen (ASUS M51V series laptop computer) with a resolution of 800 × 600 pixels. The dependent variables were the median latency to respond to the probe (in ms) and the accuracy of the responses. All trials with errors and trials with response latencies <100 or >3500 ms were removed from the analyses.
General procedure
Participants were instructed to refrain from eating for at least 2 hours before testing, to ensure similar levels of hunger and craving. This was assessed prior to testing with the hunger and craving rating. Testing occurred between 10:00 and 16:00. Participants were not given any detailed instructions about the nature of the study in the Participant Information Statement, and they were simply told: “You are asked to participate in a study of attention and concentration for individuals in the overweight and obese weight range. We hope to see whether there is a relationship between attention and weight.” During the session, the participants were not told about randomization; they were simply told that they would complete some computer-based tasks involving attention. After measuring the initial baseline attentional bias using the dot probe task, the participants were randomized, using an online random numerator, to one of the three conditions:
Attentional-training (AT) group. These participants had their attention trained away from the high-calorie food words by having the probe appear in the position of the neutral word for every trial. A different set of stimuli to those used in the dot probe task (baseline) were used in the training task. The training task consisted of 20 high-calorie and neutral word pairs presented 10 times, for a total of 200 trials. A total of 20 food-related words (target words) were paired with neutral words that were matched for usage frequency and word length (Kucera and Francis, 1967). The words cookies, biscuit, chips, or grapes were not used in the attention task as these were the items in the bogus taste test.
Placebo control training (PC) group. This group completed the same training task as the Attentional-training group except that the probe appeared equally often in the location of the neutral word versus the food word, as used in previous clinical studies on anxiety (Amir et al., 2009; Schmidt et al., 2009). Probe location was randomized across trials.
Control group. This group only had their baseline attentional bias measured via the dot probe task. They did not receive any training and completed the session 5 minutes earlier on average.
After the attention training and placebo groups completed the training task, the participants’ attentional bias was measured again with the use of the dot probe task using the same words as at baseline. This was done to examine the effects of the training. All three groups then completed the hunger and craving rating again. They were then asked to complete a food market research while the experimenter computed the participants’ scores to provide participants with feedback. This was in reality a “bogus taste test.”
Bogus taste test
The purpose of this test was to obtain an objective outcome measure of food intake. The participants were exposed to four identical large pre-weighed bowls completely filled with salted slow-cooked chips, choc-chip biscuits, low-fat biscuits, and grapes. Participants were told what each item was. They were instructed to rate the palatability of these four food items on a VAS and to describe the aspects of each food that they liked or did not like. Palatability influences eating behavior so we examined differences between the groups in terms of palatability. A glass of water and a napkin were also provided to the participants. Due to the differential effects of food flavors and fat content on consumption and to a choice of low and high fat, sweet versus savory food options were provided (Rolls, 2011; Sørensen et al., 2003). The participants were left alone for 10 minutes to complete their ratings and were explicitly informed that they could eat as much as they liked, while the researcher “computed their results” in the other room. Kilojoule (kJ) consumption during the “taste test” was determined by weighing the amount left, subtracting it from the pre-consumption weight, and calculating the kJ based on weight. The outcomes for the assessment of food intake included the amount of kilojoules consumed of each food item, plus the total kilojoules of the low-fat items (grapes and low-fat biscuits) and the high-fat items (high-fat biscuits and chips), and the kilojoules consumed in total. Debriefing regarding the true intention of the study occurred upon completion.
Statistical analyses
Preliminary analyses using one-way analysis of variance (ANOVA) were conducted to ensure that there were no significant differences between the three experimental conditions in terms of age, BMI, fasting, depression, anxiety, stress, eating disorder symptoms, executive function, and accuracy on the task, which could have confounded the findings regarding food intake. Any significant differences in baseline characteristics were controlled for in the main analyses.
A manipulation check was conducted to evaluate whether the attentional-training task was successful in training participants to attend away from high-calorie food words compared to the placebo condition. The control condition did not receive any training so it was not included in these analyses, only in the main analyses. Attentional bias index scores were calculated for each participant before and after training. These were calculated by subtracting the median response latency when the probe was in the same location as the target word, minus the response latency when the probe was not in the location of the target word (i.e. appeared in place of the neutral word). A negative score indicated an attentional bias toward the food word, while a positive score indicated avoidance of this stimulus (or attention toward the neutral word) (Dehghani et al., 2004). A 2 (time: pre, post) × 2 (group: AT, PC) repeated-measures analysis of covariance (ANCOVA) was used. Analyses were conducted twice, one without any covariates and the other using executive function as a covariate.
A series of repeated-measures ANCOVAs were used to examine any pre-training to post-training differences in hunger and craving between the AT, PC, and control groups while controlling for any significant differences at baseline, if any. For the main analyses we conducted a series of planned contrasts within a univariate analysis comparing food intake (kJ) and palatability between the attention training and the control conditions, while controlling for any significant differences at baseline, if any.
Results
Baseline analyses
Participants’ characteristics are presented in Table 1 as a function of the training or control group. Preliminary analyses found no differences between the AT, PC, and control groups in terms of age (F(2,74) = 0.66; p = 0.52), BMI (F(2,74) = 0.55, p = 0.58), fasting (F(2,74) = 1.4, p = 0.27), depression (F(2,74) = 2.1, p = 0.13), anxiety (F(2,74) = 1.4, p = 0.25), or stress (F(2,74) = 0.49, p = 0.62). In addition, there were no group differences in eating disorder symptoms as measured by the EDE-Q in terms of dietary restraint (F(2,74) = 0.27, p = 0.76), weight concern (F(2,74) = 0.83, p = 0.44), shape concern (F(2,74) = 1.2, p = 0.30), and eating concern (F(2,74) = 1.1, p = 0.33). The groups also did not differ significantly on the measures of executive function, in the TMT-B (F(2,74) = 1.04, p = 0.36) and the Hayling B (F(2,74) = 2.4, p = 0.10). The training groups differed in terms of accuracy on the attentional-training task (F(2,74) = 5.58, p = 0.006), and thus accuracy was used as a covariate in the main analyses. No other group differences at baseline were found.
Mean (standard deviation) of participants’ characteristics across groups.
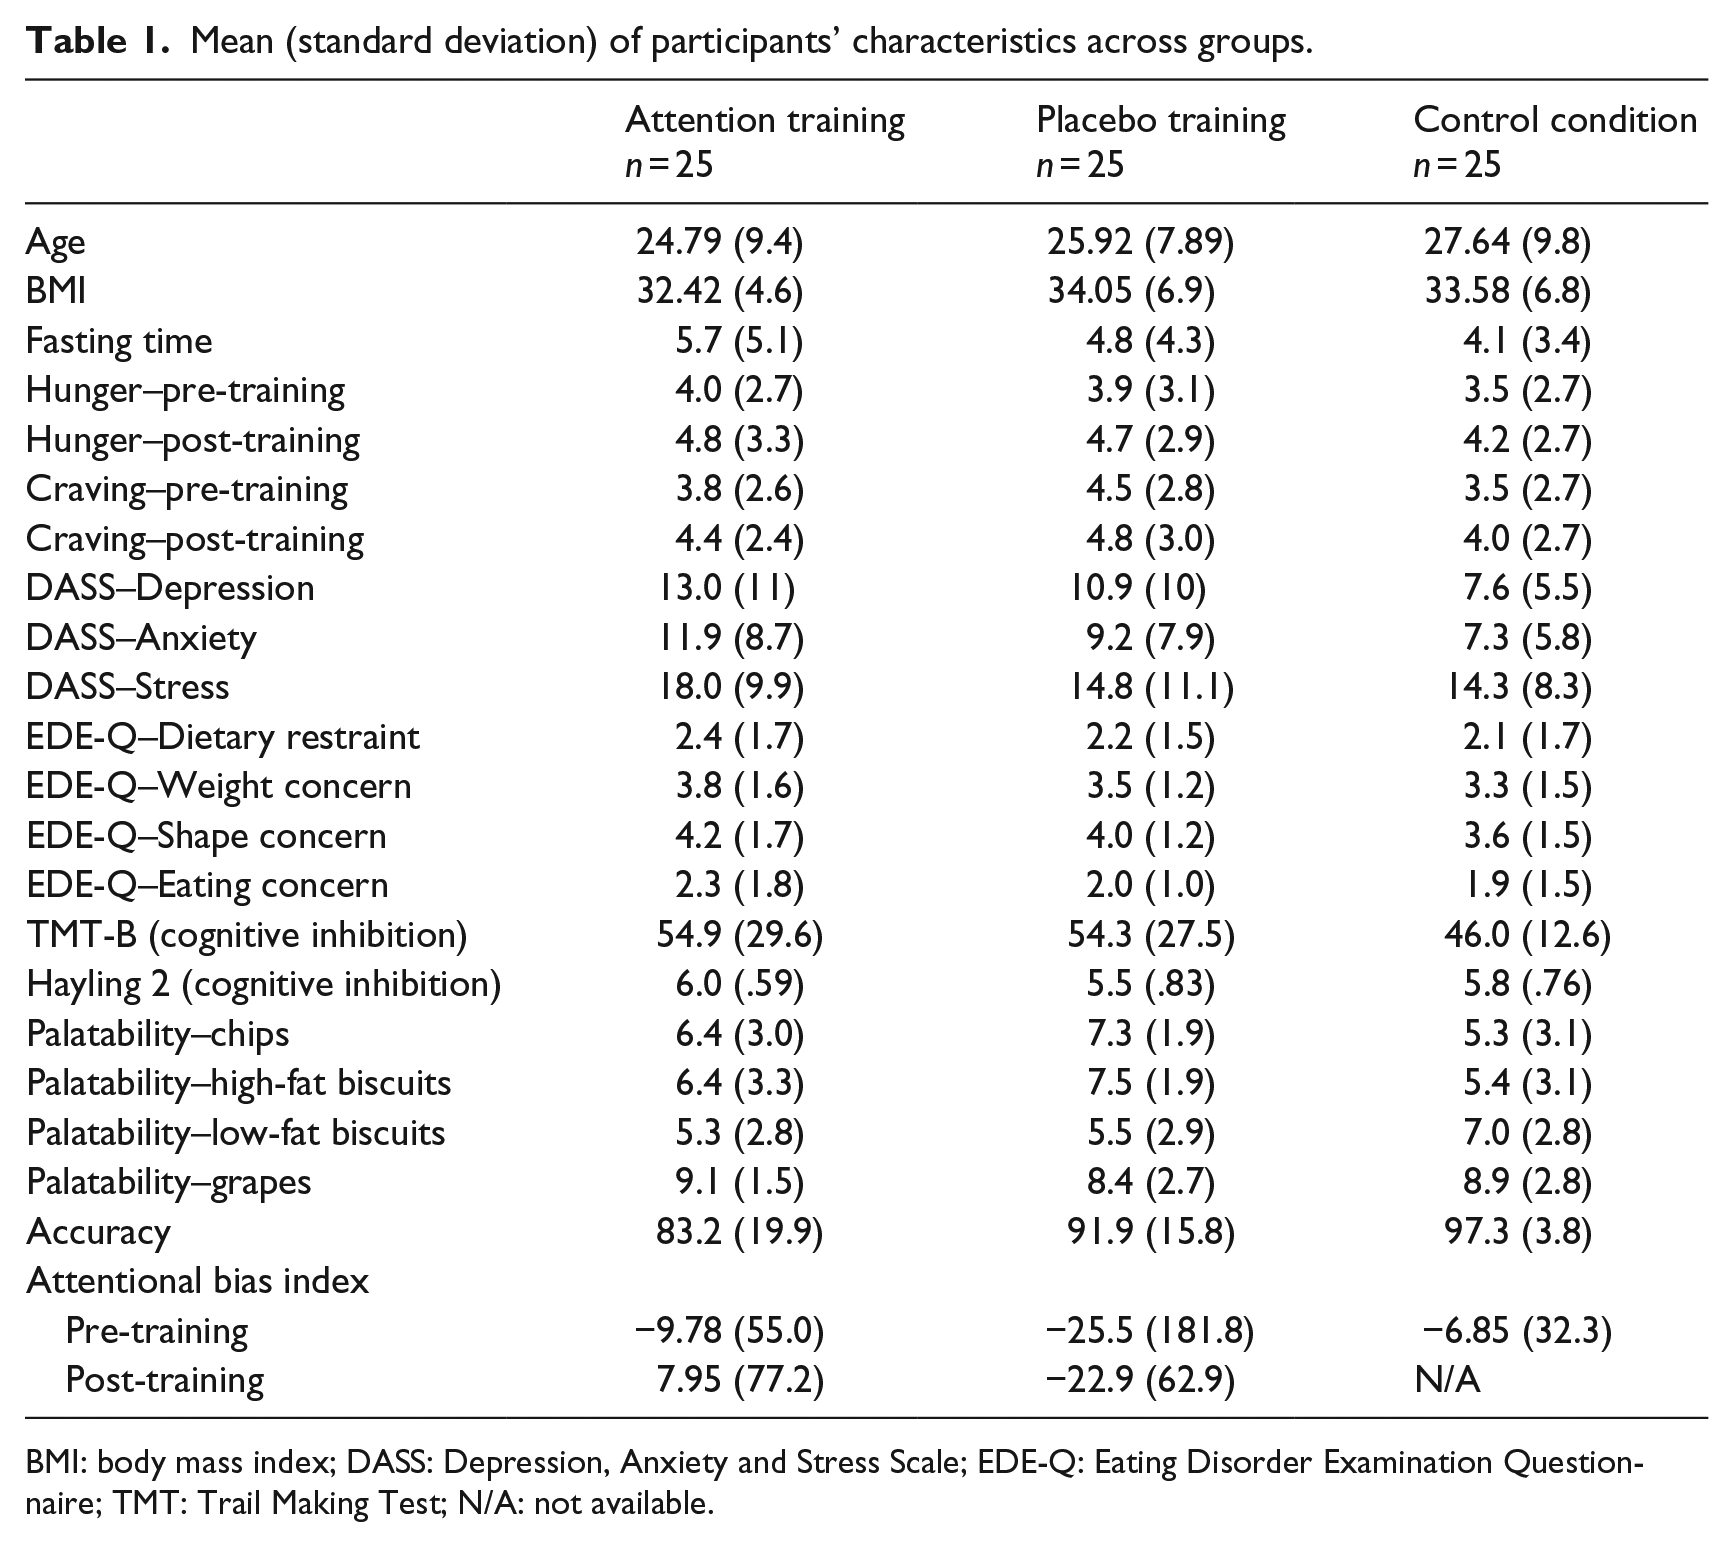
BMI: body mass index; DASS: Depression, Anxiety and Stress Scale; EDE-Q: Eating Disorder Examination Questionnaire; TMT: Trail Making Test; N/A: not available.
Manipulation checks
Table 1 reports the mean attentional bias index scores for the two groups pre- and post-training and also the baseline measures of the control group. There were no differences between the groups in terms of baseline attentional bias index scores (F(2,72) = 0.20; p = 0.82). A repeated-measures ANCOVA revealed that there was no significant difference between the two groups in terms of attentional bias index scores before and after training (F(1,47) = 2.9; p = 0.094). However, when controlling for executive function (TMT-B and Hayling B), which can impact performance on the dot probe task, this effect reached significance (F(1,45) = 7.6; p = 0.008), with attentional bias being reduced in the AT group relative to the PC group.
Hunger and craving
No differences pre- and post-training were found between the groups regarding craving (F(2,71) = 0.67; p = 0.52) or hunger (F(2,71) = 0.05; p = 0.96), and overall individuals did not experience any significant increase in craving (F(2,71) = 0.41; p = 0.52) and hunger (F(2,71) = 1.8; p = 0.18) from pre- to post-training. Mean and SDs can be found in Table 1.
Palatability and food intake
There were no differences between the groups regarding palatability (means are reported in Table 1) of high-fat biscuits (F(2,74) = 1.49, p = 0.23), low-fat biscuits (F(2,73) = 3.1, p = 0.051), and grapes (F(2,73) = 0.90, p = 0.41), but palatability of chips was significant (F(2,74) = 3.23, p = 0.045), with the placebo group liking the chips more than the control group. Therefore, in subsequent analyses, when chips was the dependent variable, we controlled for palatability of chips. Since there was a non-significant trend (p = 0.051) in the difference between groups regarding palatability of low-fat biscuits, a further analysis was conducted to examine whether including palatability as a covariate changed the results for low-fat biscuits.
For food intake (means are reported in Table 2), planned contrasts revealed that AT participants consumed on average 600 total kilojoules less (p = 0.028; 95% confidence interval (CI): –1100, –63.3), consumed on average 480 kJ less of total high-fat food intake (p = 0.023; 95% CI: –903.2, –69.8), and consumed on average 440 kJ less of high-fat biscuits (p = 0.008; 95% CI: –762.3, –116.2) than the PC participants, and this was statistically significant, but not when compared to the control condition. Including palatability as a covariate did not change the results for low-fat biscuits or chips. Results also did not change when controlling for executive function (TMT-B and Hayling B). No other significant results were found.
Mean (standard deviation) and significance levels for food intake in kilojoules (kJ) across the training groups (attentional-training, placebo training, and control groups).
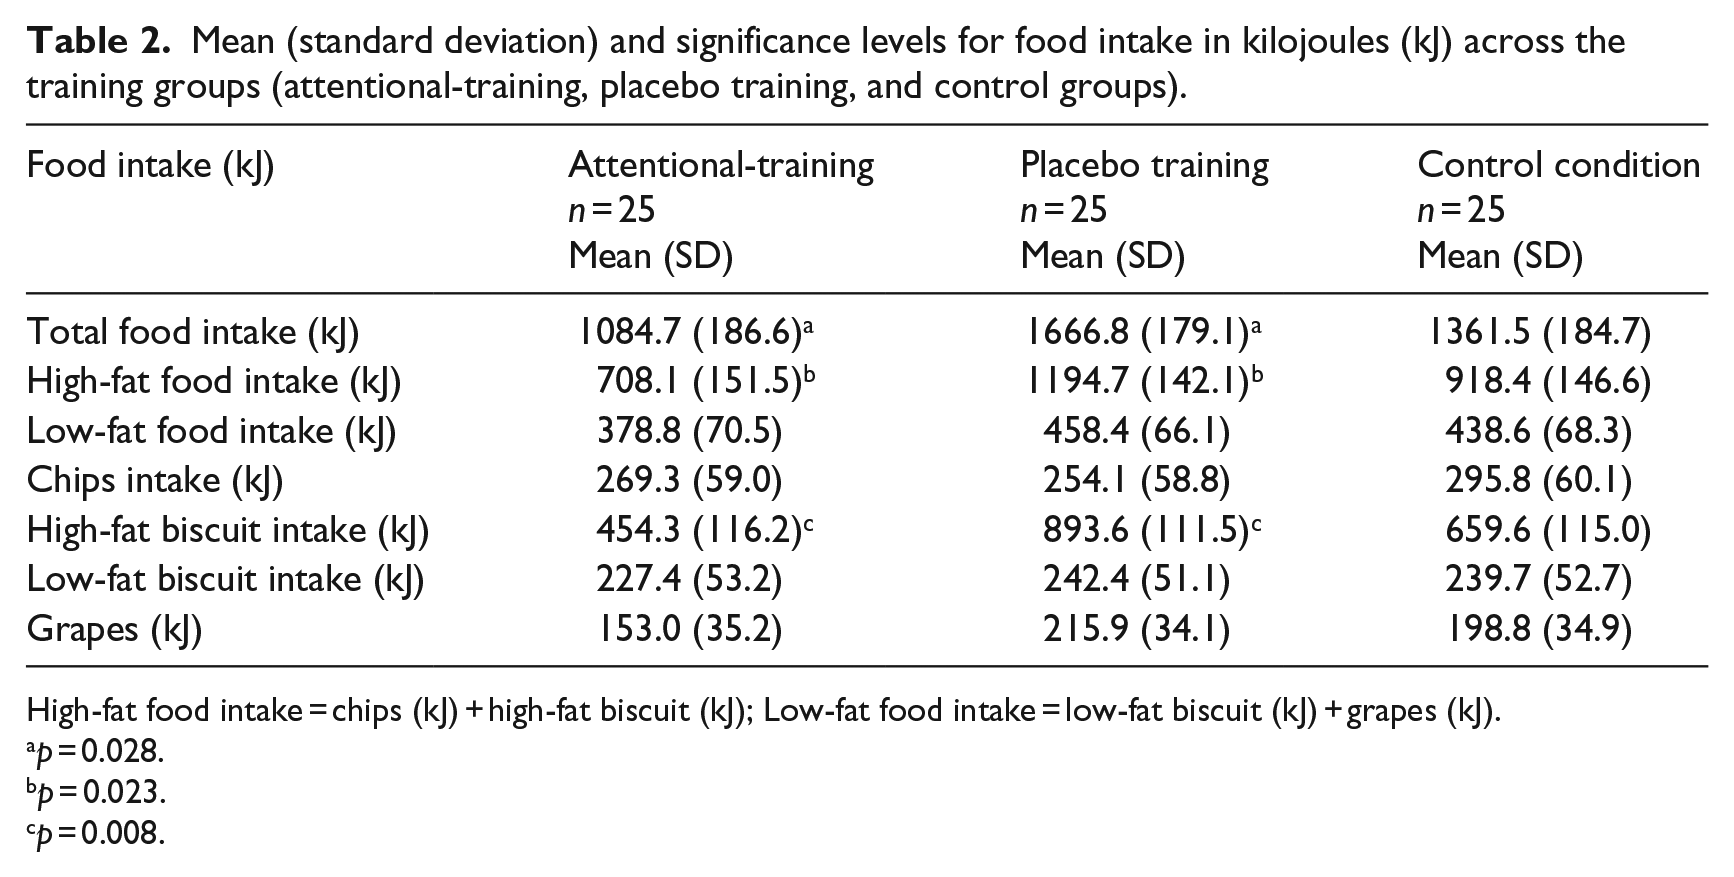
High-fat food intake = chips (kJ) + high-fat biscuit (kJ); Low-fat food intake = low-fat biscuit (kJ) + grapes (kJ).
p = 0.028.
p = 0.023.
p = 0.008.
Discussion
This study investigated whether attentional bias modification training away from high-calorie food cues reduces food consumption, using high- and low-calorie food choices, in overweight/obese individuals, compared to placebo and control conditions. This study further explored whether capacity for executive functioning contributes to the relationship between attentional-training and food intake. The results partly supported our hypotheses, by showing that individuals in the attentional-training group reduced their overall food intake compared to the placebo group, but not when compared to the control group. The pattern of food intake indicated reduced consumption of high-fat biscuits and high-fat foods in general, congruent with the stimuli presented in the attentional-training task. Although executive functioning is associated with obesity and disordered eating (Raman et al., 2013), controlling for executive function did not change the main findings on food.
Both assessments of self-reported hunger and craving indicated no differences between the groups and no increase from the initial to the subsequent test. Despite a reduction in attentional bias to food cues in the attentional-training group, there was no concomitant reduction in self-reported craving observed, but there was a reduced food intake.
It is feasible that decreased food intake in the attentional-training relative to the placebo group may be due to a decrease in attentional bias in the attentional-training group. This would be consistent with the participants’ attentional bias index scores in the attentional-training group showing a greater reduction after treatment compared to the placebo group, when controlling for executive function. It seems that the change in attentional bias was mediated by executive function levels, and perhaps individuals with low executive function were not able to engage in the task to overdrive their attentional bias. Perhaps, executive function deficiencies in the obese would need to be remediated, as suggested by Smith et al. (2011) before participants can engage in attentional-training tasks. This could also explain the mixed findings on attentional bias in obesity. In fact, there was no association between executive function at baseline and food intake irrespective of attentional-training, yet there was a positive correlation between executive function, specifically the TMT-B, and the attentional bias index scores at baseline (r = 0.32). Perhaps, high-order cognitive abilities impact on food intake only via being able to modulate these attentional biases.
It is evident by inspecting the data that those in the attentional-training condition ate on average less than those in the control group and that those in the control group ate on average less than those in the placebo group. The difference between the attentional-training and the control groups might not have reached significance due to power, as we were expecting a medium effect. In addition, it is possible that the placebo condition experienced an exposure effect as it was exposed to the high-calorie food words for half of the trials. The unpredictable nature of the appearance of the food word may therefore have had a small training effect toward food cues; however, this was not evident in the attentional bias index scores. This highlights the concerns of previous research in other areas, such as anxiety disorders, that have used the active placebo without a waitlist control, as suggested by others (Becker et al., 2018; Kakoschke et al., 2018).
Our study is limited by only including words, instead of pictures, in the dot probe task. However, previous research in eating disorders (McManus and Chadwick, 1996; Rieger et al., 1998) suggests that word stimuli are at least as effective as pictorial stimuli in eliciting attentional bias, but perhaps not as good for inducing an attentional bias, and that needs to be examined in future research. Our study only included women, limiting its generalizability. However, women are usually the individuals who seek treatment for obesity. Our study also has a number of strengths. Specifically, the experimental design allows for the understanding of causality between attentional biases and food intake. In addition, few other studies have considered the relationship between executive functioning and attentional processes/biases. Understanding this relationship has clinical implications in terms of determining targets for cognitive interventions. It may be that attentional bias training, in addition to cognitive remediation, which improves executive functioning, may be an appropriate treatment to explore.
To conclude, this study suggests that attentional bias modification training has an effect on food intake in overweight and obese individuals compared to placebo training. The next step is to provide attentional-training as an additional treatment option, which would augment and be complimentary to the current evidence-based behavioral treatments used to treat obesity.
Footnotes
Declaration of conflicting interests
The authors declared no potential conflicts of interest with respect to the research, authorship, and/or publication of this article.
Funding
The authors received no financial support for the research, authorship, and/or publication of this article.
