
Abstract
The interpretative and flexible nature of qualitative research is one of its hallmark strengths, yet this can pose a significant obstacle for researchers who wish to incorporate computer-assisted qualitative data analysis software (CAQDAS), especially for educators of CAQDAS and researchers who may have abandoned CAQDAS following past frustrations. We seek to help qualitative researchers and teachers by illustrating how CAQDAS can be used to follow specific analytic strategies (e.g. inductive and deductive analysis, category identification and synthesis, and qualitative model building). To bridge the gap between qualitative methodology and CAQDAS, this article provides guidelines for researchers to familiarise themselves with widely used qualitative analysis strategies, and learn how ATLAS.ti, MAXQDA, and NVivo can be used in each phase of the qualitative analysis process. By effectively translating analytic strategies into CAQDAS features, CAQDAS can greatly facilitate data management, analysis, and collaboration when software features are harnessed to realise analytic strategies.
Keywords
Introduction
Demand for and interest in computer-assisted qualitative data analysis software (CAQDAS) has only been growing (Odena, 2013; Silver and Rivers, 2016), but learning qualitative research and CAQDAS can be challenging, as there are no ‘formulas’ for interpreting rich qualitative data. Even when teaching is provided in universities, novices may spend considerable time learning on their own given the idiosyncrasies of qualitative studies. As the power of qualitative research largely rests in the hands of the researcher, it can be challenging to learn both how to use CAQDAS and make sense of qualitative data. While a great variety of free online learning resources are available, these typically provide instrumental instructions regarding how to use the specific features of the software, but it is still up to the researcher to discern how to set up and carry out their analysis in the CAQDAS.
Yet, the value of CAQDAS to qualitative research comes when the software is used to carry out a methodologically sound study that adheres to quality standards, such as transparency, communicability, and coherence (Auerbach and Silverstein, 2003). In other words, CAQDAS is most powerfully harnessed when the researcher plans how they will analyse their data and then translates this analysis into how they use the software (Silver and Woolf, 2015). Thus, researchers need sufficient understanding of both qualitative methods and how CAQDAS works, but it is more likely that novices learn about these different aspects in distinct courses and projects, and a lack of a shared language among qualitative research and CAQDAS instructors makes integrating CAQDAS into methods courses a long-standing challenge (Schmieder, 2020). Just like the craft of qualitative research is best learned through practical experience, CAQDAS is likewise best learned through hands-on practice (Blank, 2004). It is also important that novices have the opportunity to learn – and make mistakes – in a safe environment, such as during one’s undergraduate studies as opposed to during their doctoral dissertation research (Kalpokaite and Radivojevic, 2019). For example, the central importance of the research question and methodology remain when using CAQDAS, but these considerations may be moved to the back of a novice’s mind when learning the ins and outs of a new software. Mangabeira et al. (2004) pointed out that although CAQDAS is often expected to make research faster, poor applications of analysis strategies can ironically lead to greater delays as researchers later realise their coding scheme was insufficiently designed to effectively answer their research question(s). In other words, there may be potential dangers of unsophisticated use of CAQDAS leading to a ‘distancing from craft procedure’, which may be particularly present in ‘instrumental adopters’, who have little background in qualitative analysis (Mangabeira et al., 2004: 173).
The present approach reconciles concerns voiced in previous research by showing how CAQDAS can be used by applying widely used qualitative analysis strategies so that researchers can reflect on how they could effectively harness CAQDAS and instructors, teachers, and professors of qualitative research may draw ideas of how they could provide practical instruction. Researchers have shared how CAQDAS can aid the complex process of theory development, refinement, and testing during the iterative cycles of analysis that are central to making sense of rich qualitative data; moreover, the use of the software can increase transparency as the development of the analysis and theory is documented and has a sort of ‘audit’ trail that can trace this development, which perhaps most notably increases transparency for the internal evaluation of the team (Dalkin et al., 2020). Deciding which software to use can also be aided by considering the structural design of software in tandem with the complexity of the research project (Barry, 1998). However, both novices and experienced researchers who may have abandoned using CAQDAS out of past frustrations still face important gaps in discerning which CAQDAS features to use and when to carry out the specific analytic strategies they are pursuing. The present article thus provides practical steps for both researchers and educators to help bridge this gap.
Rather than simply teaching the technical aspects of CAQDAS, the present article shows how CAQDAS can be used with a foundational qualitative data analysis (QDA) model that is suitable for novices and can be applied to a variety of qualitative research projects (Kalpokaite and Radivojevic, 2019). By QDA methods, we refer to the explicit and systematic methods that researchers use to draw conclusions, and these methods need to be ‘credible, dependable, and replicable in qualitative terms’ (Miles et al., 2014: 5). Based on an examination of similarities and differences across QDA methods, this model (outlined in further detail below) essentially brings together commonly used QDA strategies that seem particularly well suited for novices. The goal is to familiarise novices with these analytic strategies so that they may later critically reflect on the practice of qualitative research and go on to make more methodologically informed decisions in their future work. Given the likelihood that researchers will learn about one of the main CAQDAS packages, the present article provides illustrations of how ATLAS.ti, MAXQDA, and NVivo can be used following the same analytic strategies. Building on previous work that calls for critical appraisals of how the specific features of CAQDAS can be meaningfully and creatively combined to meet analytic needs (Schmieder, 2020; Silver and Woolf, 2015) as well as more evaluative and reflective personal accounts of working with software (Lewins, 1996), this article details how widely used qualitative analysis strategies can be realised in three of the main CAQDAS packages used today. We always encourage researchers to carefully consider the different data analysis strategies they can use to answer their research question (Silver and Woolf, 2015), and we hope this practical walkthrough aids researchers and instructors, teachers and professors in reflecting on how methodology can guide the use of software, as opposed to simply following software manuals.
Background: qualitative researchers’ evolving relationship with technology
When CAQDAS first emerged, there were many debates around the potential dangers of relying on software to carry out QDA. In particular, researchers raised concerns of CAQDAS leading to methodological bias (especially towards grounded theory) and the propulsion of a sort of ‘Frankenstein’s monster’ whereby researchers uncritically apply whatever tools the software offers (i.e. equating using a CAQDAS with following a rigorous methodology; Kelle, 1997). Yet, for hundreds of years already, researchers examining texts have used some form of technology, primarily to construct indexes of information and include cross-references in text (Kelle, 1997). Over time, researchers began pointing out that many CAQDAS concerns were overemphasised as users also abandon the software if it does meet their needs, and there is still a plurality of analytic approaches and software applications. As Lee and Fielding (1996) succinctly put it, ‘Qualitative researchers have gone beyond seeing the computer either as a panacea for analytic woes or as a devil-tool of positivism and scientism’ (p. 4).
Discussions regarding the use of CAQDAS initially distinguished between software that facilitates coding-and-retrieval of data and software that permits hyperlinking to dynamically draw connections across data in a nonlinear fashion (Coffey et al., 1996). Although CAQDAS may have differed when they were first created based on their focus on coding-and-retrieval, hyperlinking, and/or theory generation, the most widely used CAQDAS packages already offer some form of each of these three key features (Kelle, 1997). While coding-and-retrieving text segments remain to be the main function of CAQDAS today, there have been great improvements, including more fine-grained query tools, sophisticated auto-coding features, and greater connectedness across all parts of the project. Moreover, CAQDAS can facilitate methodological interrelations (including mixed qualitative and quantitative methods), analyses of multimedia data (Gibson et al., 2005), and teamwork (Fielding, 2008).
Successfully guiding novices through QDA with CAQDAS
Given the growth of the ‘digital native’ generation that is increasingly comfortable with pervasive technology use, it is likely that qualitative researchers will increasingly want to learn about CAQDAS (Paulus and Bennett, 2017). These first experiences can form crucial bases from which novices hone their qualitative research skills to subsequently conduct more critical and knowledgeable research. MacMillan and Koenig (2004) very eloquently point out some main current issues regarding CAQDAS, namely, ‘unrealistic expectations of the software as a methodology in itself; the treatment of qualitative analysis as a single, homogenised category; and the use of grounded theory as a legitimating link between tool and method’ (p. 179). Given the complex and multilayered nature of learning to harness CAQDAS, teaching should also consider the various ecologies from which students come, as individuals likely have differing levels of experience and familiarity with methods and analytic tasks or CAQDAS and its diverse components (Schmieder, 2020). A methodologically grounded practical guide could signal some good practices for laying the foundations of a study (and setting up the project in the software in a helpful way), so that the researcher can then focus their energy on the deeper reflection and creative thinking that are hallmarks of good qualitative research. In other words, novices and researchers that have been disillusioned with CAQDAS may benefit from seeing how, rather than following a software manual, they can progress from planning their analytic approach (i.e. the methods they will follow to answer their research questions) to using different CAQDAS features to realise this analysis (Silver and Woolf, 2015).
In today’s increasingly digital world, it is time for debates around the appropriateness of CAQDAS to shift to discussions of how to best harness CAQDAS to meet learning and research needs (Schmieder, 2020). To carry out qualitative research, researchers need to develop understanding, detail, intentionality, and thoughtfulness (Humble, 2012). CAQDAS is informed by methodology, so researchers need to understand methodology and develop coherence between the research question, data, and analysis. Interpreting the details of rich qualitative data is important, but it is easy to feel lost amid all that information. To facilitate exploration of the details while maintaining underlying coherence, these guidelines outline exploration, induction, and deduction. With these iterations, the researcher moves between examining global patterns and identifying novel or useful information to finally tying this together to broader literature and theory. The power of the research always lies in the researchers’ hands, which is why intentionality is key. Researchers can use the data to verify tentative conclusions and empirically depict the findings. Intentionality is markedly important when using CAQDAS, because simply doing whatever the software can do (without any coherence with the research question, data, and analysis) will result in not only poorer quality research but can even lead to misguided conclusions. Bringing all of these together, a thoughtful qualitative sensibility is needed: reflexivity, critical appraisal, and amiable scepticism. Each step involves intentional thinking about the details and understanding how it all fits together to produce a high-quality and meaningful piece of research.
Using CAQDAS with a foundational QDA model
With the aim of providing manageable advice regarding how to use CAQDAS in a way that is informed by one’s analytic strategies, we present a QDA model in Table 1 that integrates common strategies that are suitable for novices and can be adapted to future qualitative research projects (Kalpokaite and Radivojevic, 2019). Rather than suggesting novel data analysis stages that researchers should follow, the value of this model comes from its comprehensive articulation of valuable data analysis strategies that can provide a strong foundation for researchers learning the ropes of qualitative research. Further references for each analytic strategy are also included to facilitate deeper exploration of any of the strategies in which researchers may be interested.
A foundational model of qualitative data analysis (Kalpokaite and Radivojevic, 2019).

Researchers’ choice of software may depend on the institutional support of their university (Humble, 2012; Paulus and Bennett, 2017). We thus include illustrations on the three major CAQDAS: ATLAS.ti 8 Windows, MAXQDA 2020, and NVivo 12. The following sections discuss each of these cycles and how ATLAS.ti, MAXQDA, and NVivo can be used for each step (we present each CAQDAS in alphabetical order). Thus, readers can see applications from all three CAQDAS and consider how they may teach or use their chosen CAQDAS in their own work.
Memoing
After creating the CAQDAS project, the first step is to create a memo that will serve as the research diary. ATLAS.ti, MAXQDA, and NVivo allow researchers to create stand-alone (or ‘free’) memos, and memos provide a space to write down notes and ideas (see Figures 1 to 3).
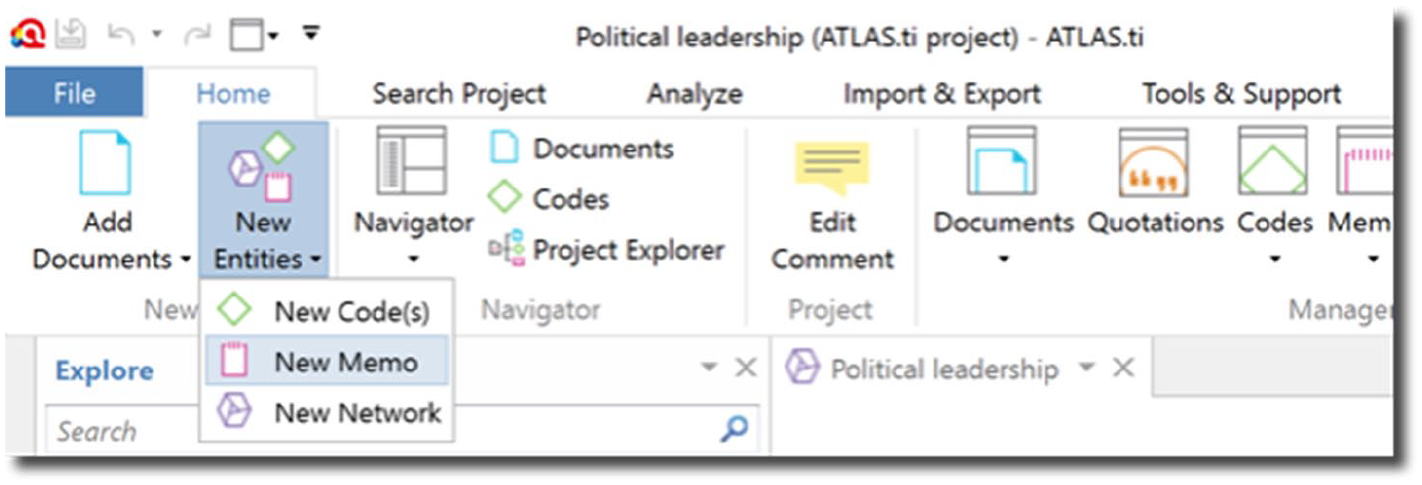
Creating a new memo in ATLAS.ti.

Creating a new memo in MAXQDA.
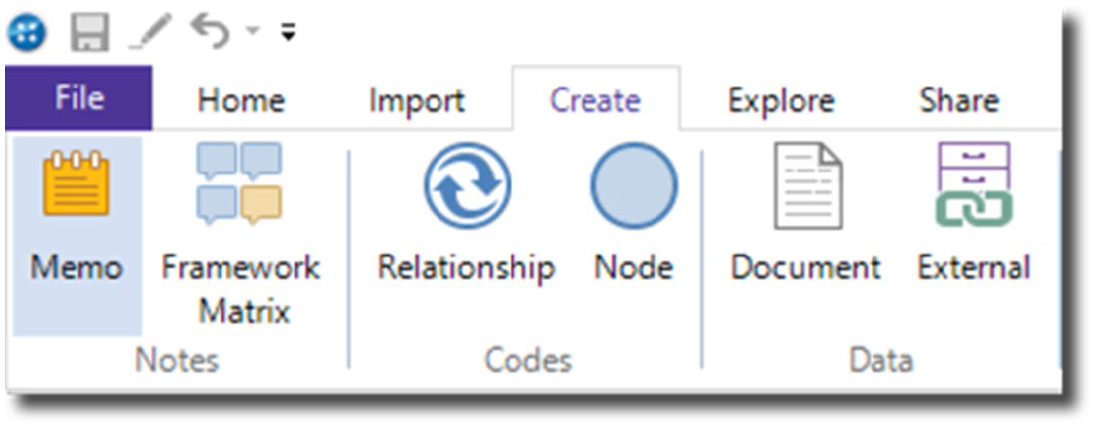
Creating a new memo in NVivo.
New memos can be created from the ‘Home’ tab in ATLAS.ti. Memos in ATLAS.ti are not distinguished by levels; rather, researchers create as many memos as they wish, and they can organise these memos into groups and types. All memos appear in the left-hand panel, so they can also easily be attached to individual data segments and added to networks.
MAXQDA has numerous memo types, and all memos can be accessed from the ‘Memos’ tab. Free memos can be created, and the other types of memos are created in different parts of the project (e.g. code memos are created by right-clicking on a code, document memos are created by right-clicking on a document and these memos can be useful for writing a description about a code or document). To avoid feeling overwhelmed by the different memo types, we recommend beginning by creating free memos to note down ideas.
In NVivo, memos can be made under the ‘Create’ tab, and all memos begin as free objects (similarly to ATLAS.ti). Memos can be easily seen, opened, and edited from the left-hand panel. NVivo memos also have text writing and formatting options akin to widely used writing software (e.g. Microsoft Office), so users can structure different headings, insert tables, and use spell check.
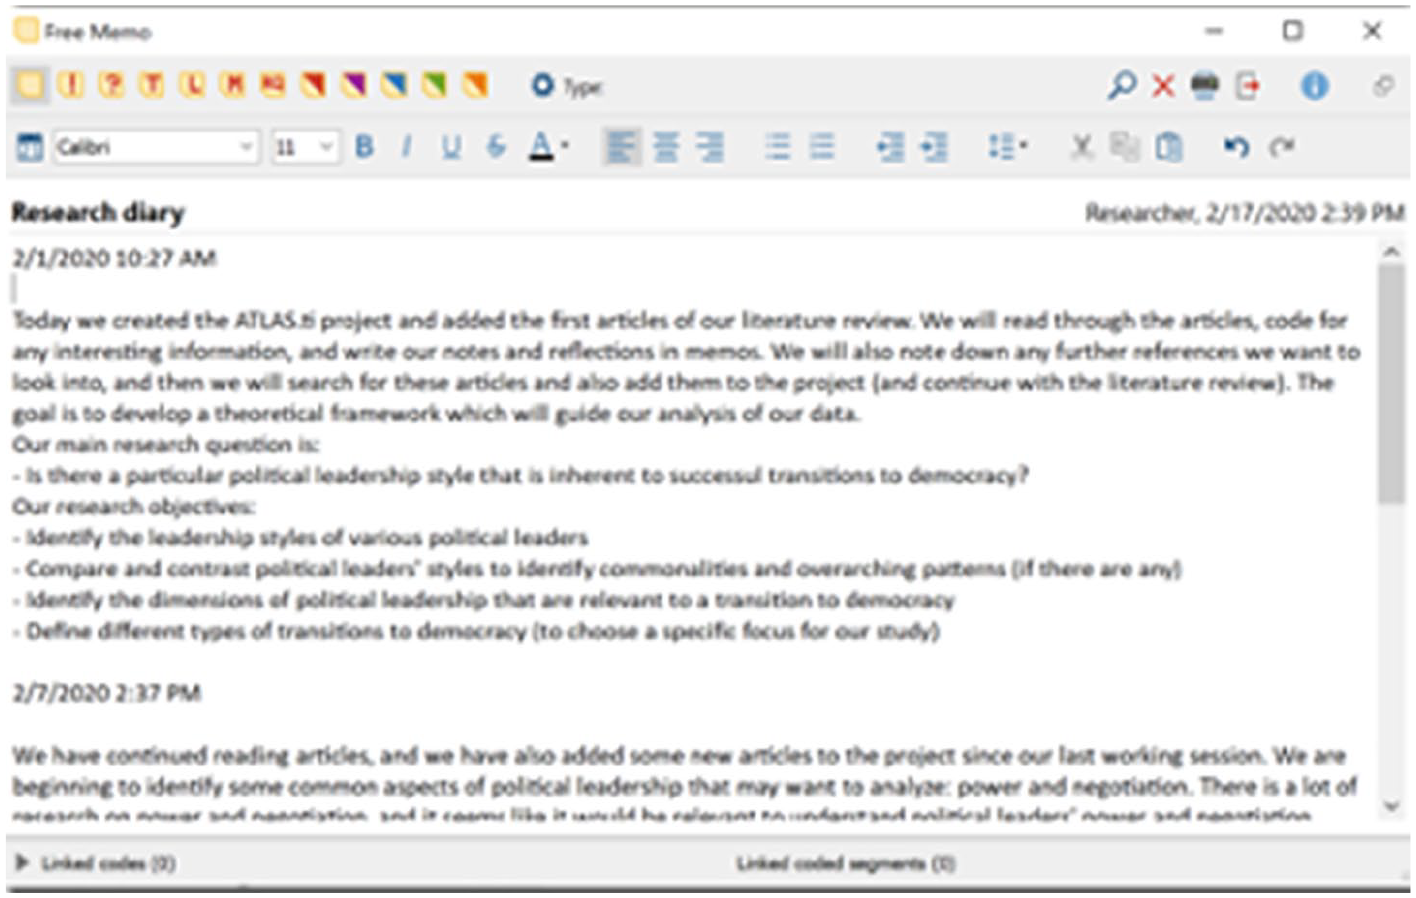
The actual process of analysing qualitative data inherently involves writing: many qualitative methodologists advocate that writing is analysis, because researchers refine their understanding of the data through writing (Braun and Clarke, 2013; Corbin and Strauss, 2014; Given, 2008; Glaser and Strauss, 1967; Miles et al., 2014). Thus, in the research diary, the researcher can write about what they will do and have done in each working session (see Figures 4 to 6 for an example).
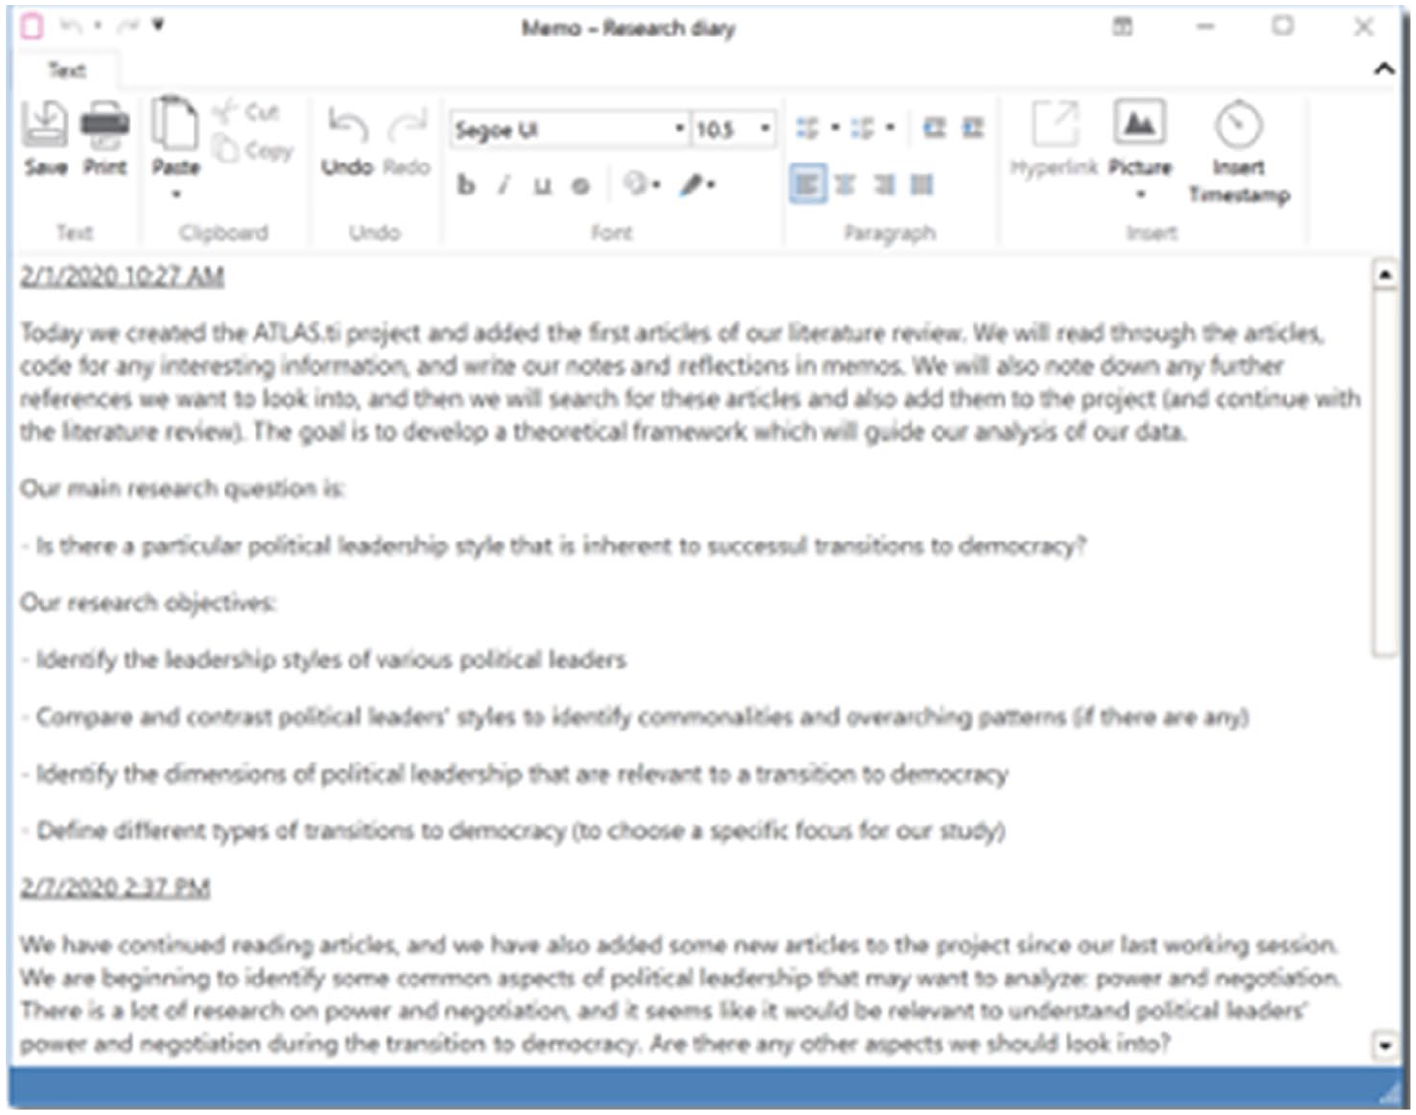
Example of a research diary in ATLAS.ti.
Example of a research diary in MAXQDA.
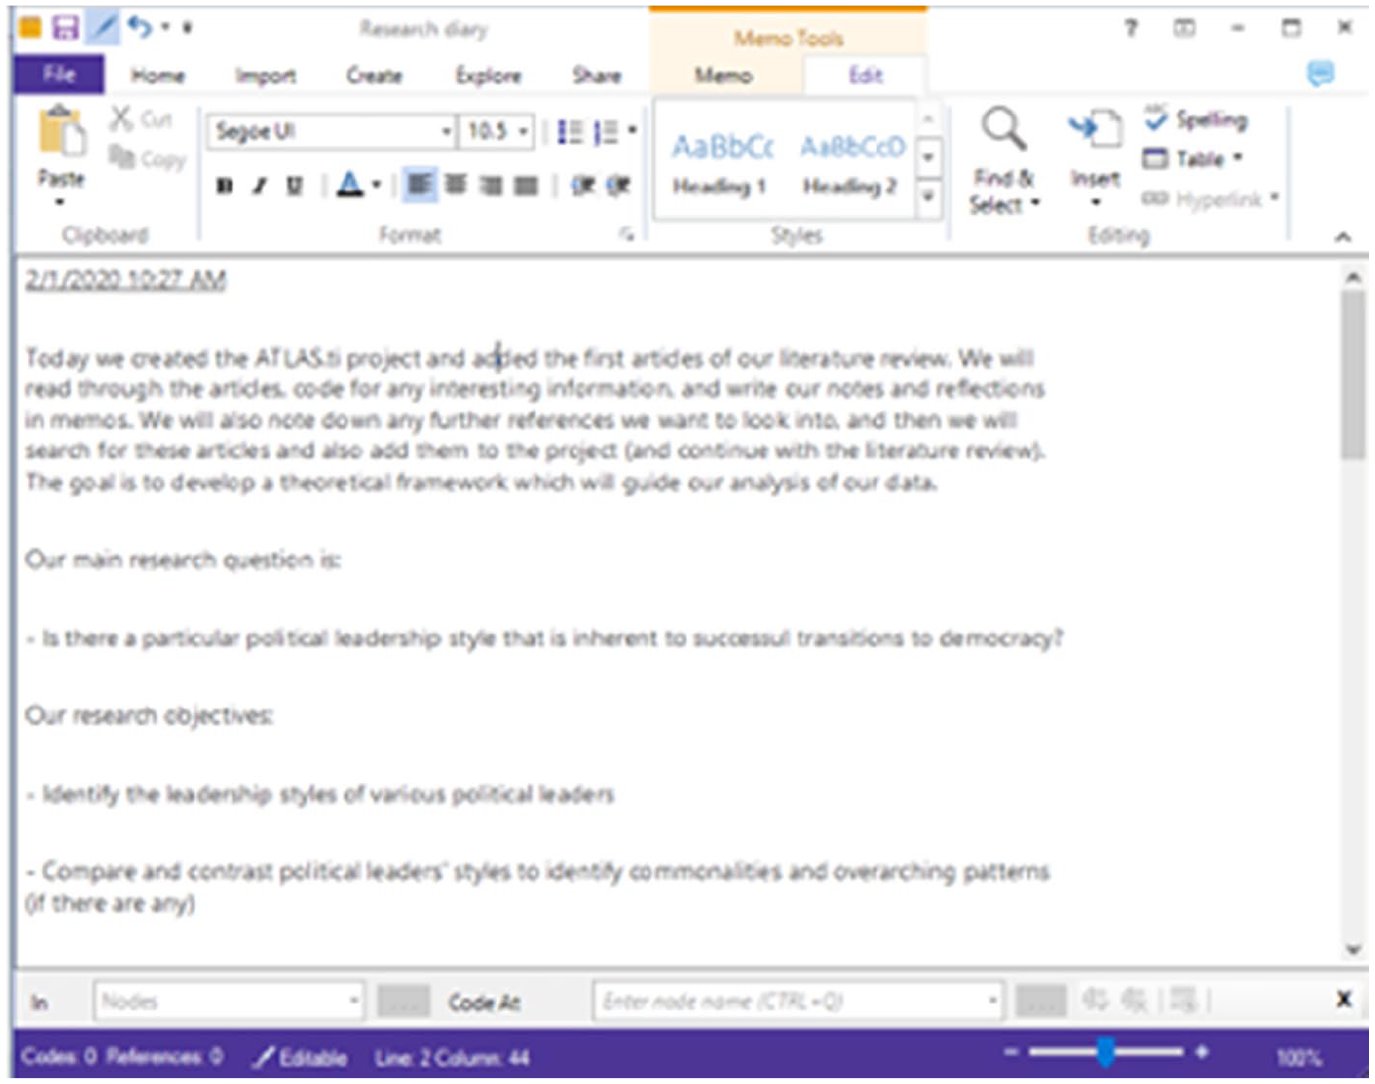
Example of a research diary in NVivo.
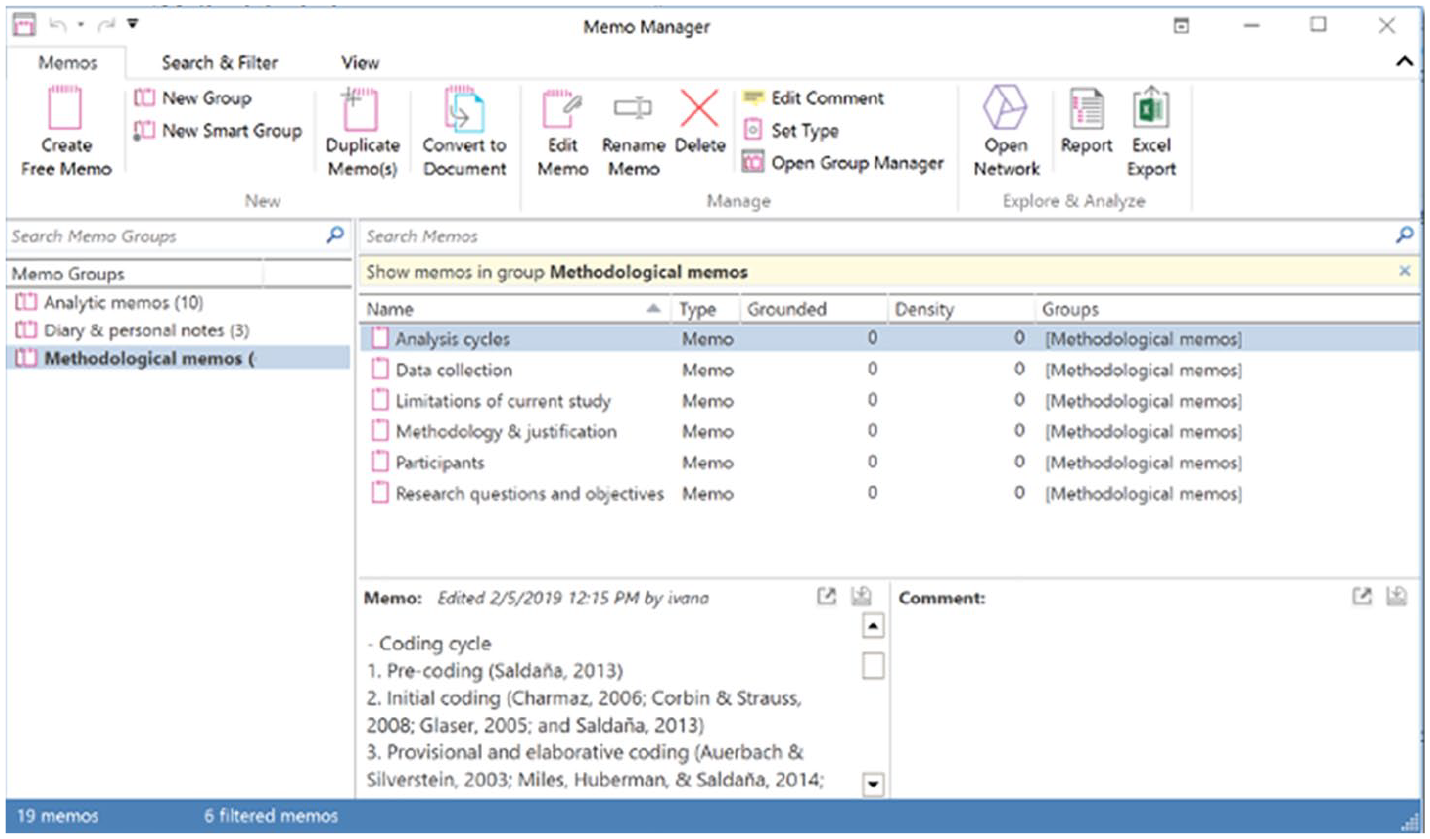
The QDA model also recommends that researchers create a series of memos for writing about their methodology (e.g. research questions, analytic cycles) and another series of memos for writing about their analysis (e.g. thoughts and impressions regarding the data). Thus, the research diary serves to document the progress of the research, methodological memos can be used to describe the approach and any methodological decisions, and analytic memos can be created to note down insights and deeper analyses of the data. Naturally, researchers can create as many memos (and types of memos) as they wish. Organising the memos will be valuable for keeping track of all of the researchers’ notes, and this can be done by creating groups or sets for the different memo types (see Figures 7 to 9).
Organising memos into groups in ATLAS.ti.
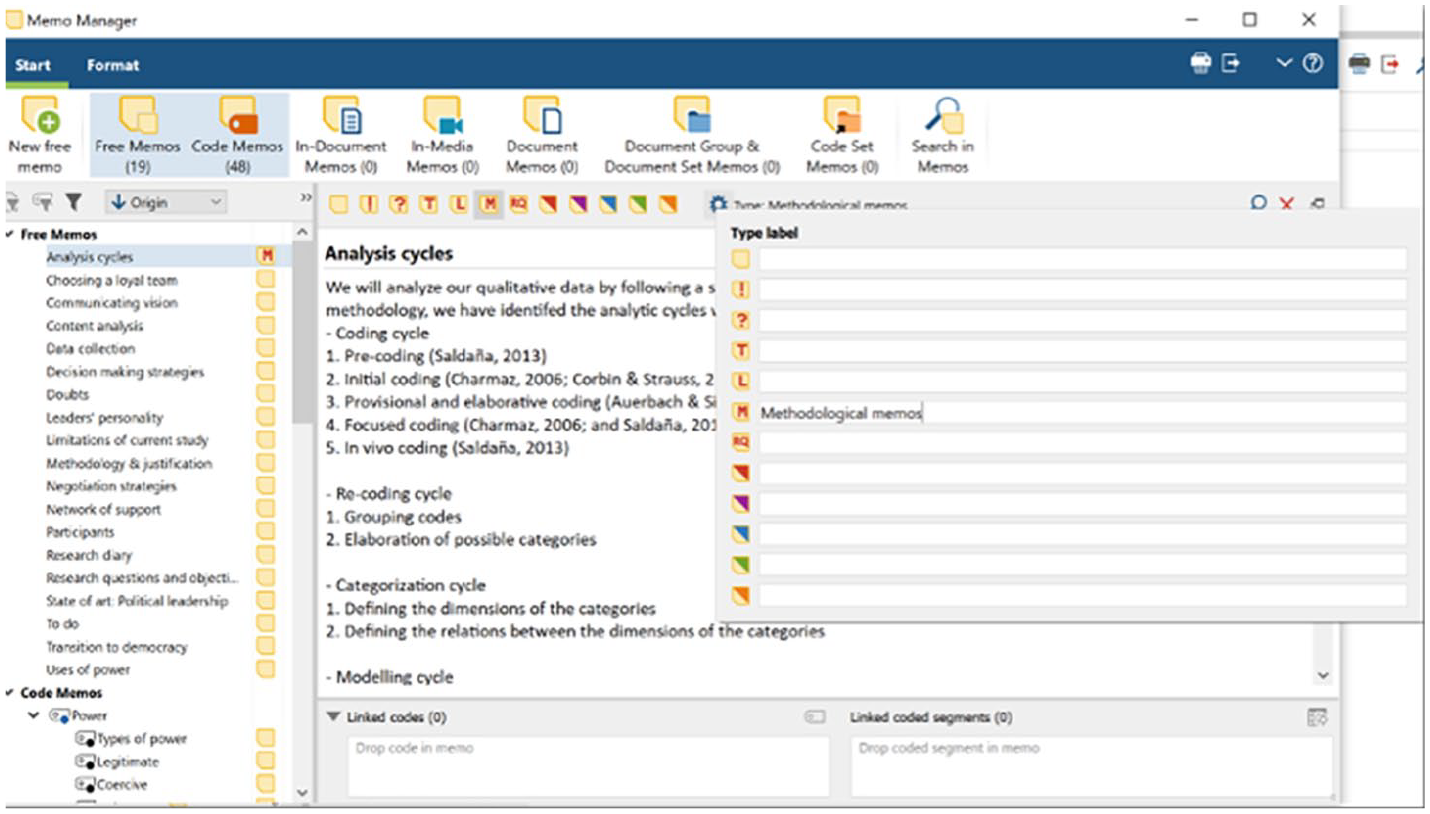
Organising memos into types in MAXQDA.
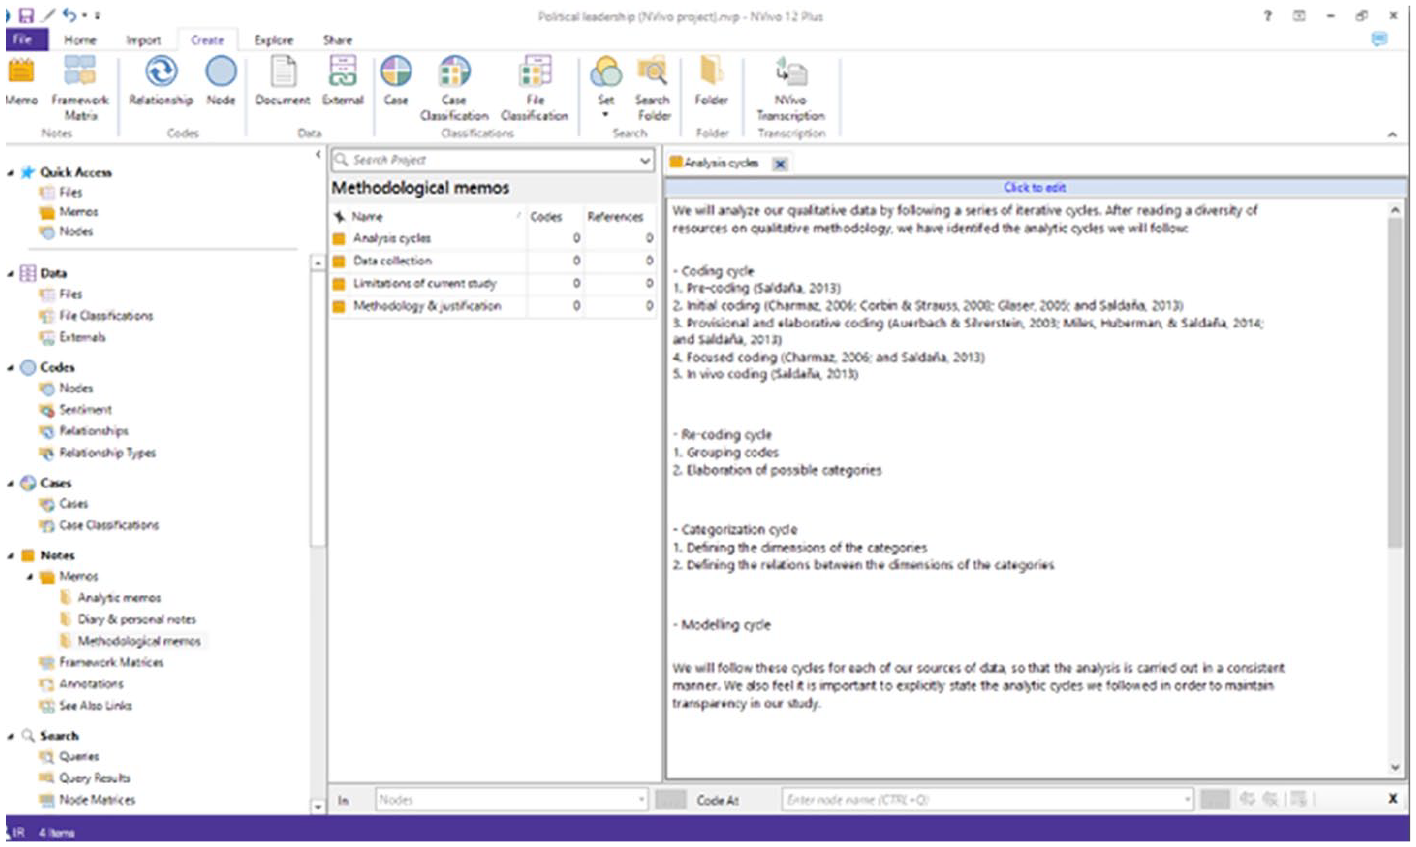
Organising memos into folders in NVivo.
In ATLAS.ti, memos can belong to more than one group at a time. The researcher can set the type of each memo (e.g. methodological, analytical) from the ‘Memo manager’.
In MAXQDA, rather than creating memo groups, researchers can specify each memo’s type (e.g. methodological, analytical); MAXQDA also automatically organises memos depending on how they were created (e.g. analytic memos would effectively be in-document memos), but this does bear the drawback that free memos cannot later be attached to data segments (only in-document memos can be attached to data segments).
In NVivo, a memo can be added to only one static set at a time (a static set is similar to a folder), and researchers can also set memo classifications to organise their memos.
By consistently writing in memos throughout the research process, the researcher is effectively developing the drafts of their final write-up. When it comes to actually writing the full study, the majority of the contents can come directly from the memos, and researchers can focus on polishing these final contents to improve the overall flow of the article. This step can be facilitated by exporting customisable reports from ATLAS.ti, MAXQDA, and NVivo (as further discussed in the final ‘Modelling cycle’ section).
Inspection cycle
The inspection cycle entails the first exploration of the data. Although content analyses such as word frequency counts and automatic coding may be criticised for following quantitative as opposed to qualitative ideals (Flick, 2018), beginning with some basic quantitative analyses of the data can be relatively easy and help ‘break the ice’ for new researchers who are unsure of where to begin. Quantitative content analysis essentially consists of examining word frequencies across (text) data, and word cloud and word lists can be generated in ATLAS.ti, MAXQDA, and NVivo (see Figures 10 to 12).
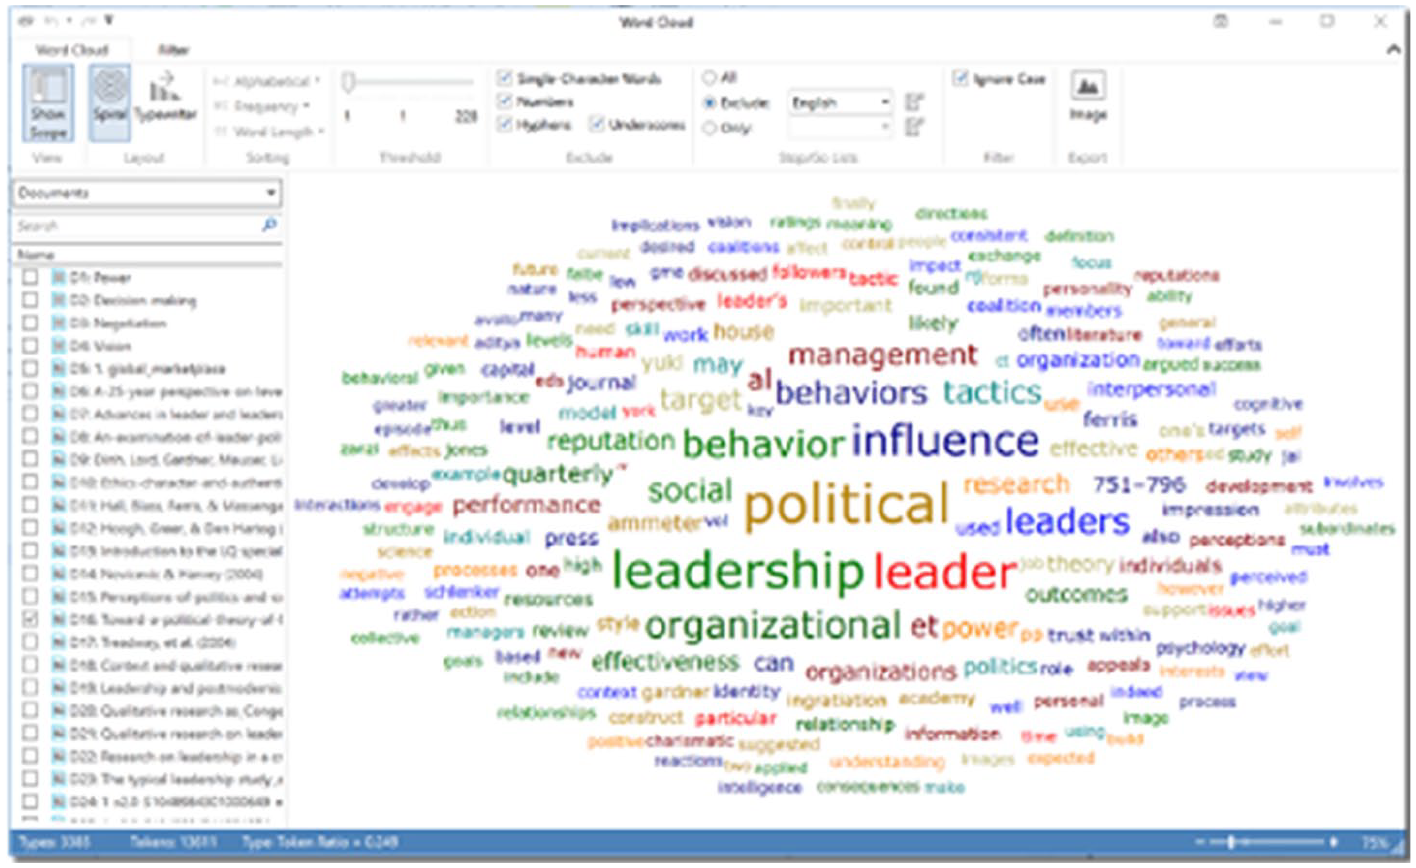
Generating word clouds in ATLAS.ti.
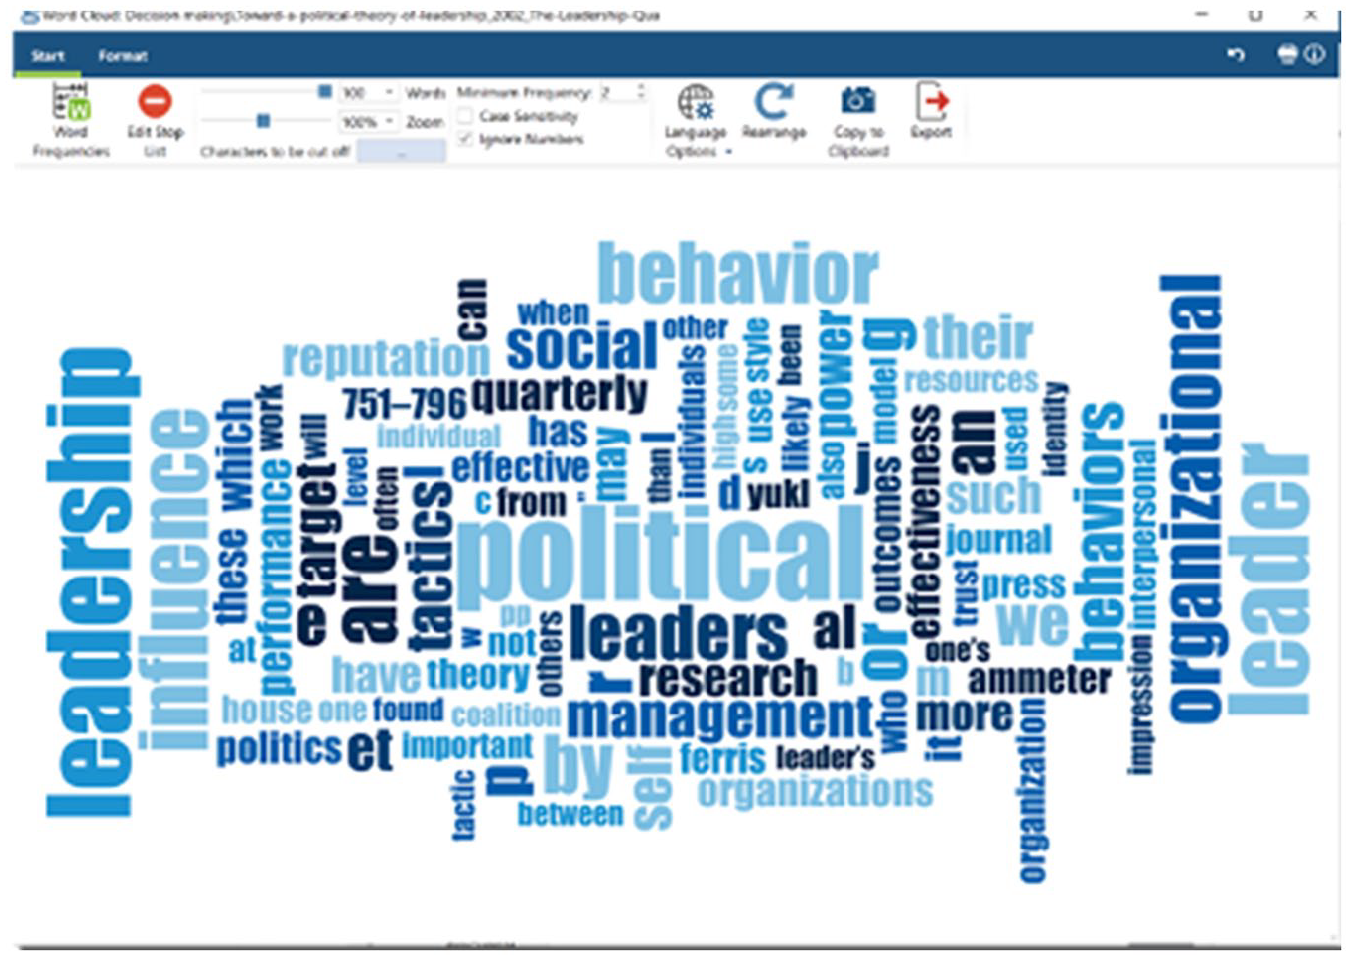
Generating word clouds in MAXQDA.

Generating word clouds in NVivo.
Word clouds in ATLAS.ti can also easily be examined across multiple documents (by selecting the documents on the left-hand side). The exact frequency of each word can be seen by hovering the mouse over that word.
MAXQDA also includes a variety of options for editing layouts and colours of word clouds.
NVivo additionally creates tree maps of words: the most frequently occurring words appear on the left, and the word tree continues towards the right, showing common stems of words that appear in the text (this can be helpful for exploring what other words appear with the concepts of interest).
We also recommend that researchers use ‘stop lists’ when analysing word frequencies (to automatically exclude words such as ‘and’, ‘the’, ‘or’, etc.) to get a better sense of what concepts are mentioned most frequently. At this point, researchers could create a new (analytic) memo where they write down all their ideas and impressions that may be gleaned from this initial exploration of the data.
As relevant concepts are identified from the content analyses, researchers may also wish to capture where these words are appearing. ATLAS.ti, MAXQDA, and NVivo have automatic coding tools, which permit quick and easy coding of data based on word searches (see Figures 13 to 15). These functions essentially work as text search tools, which also save the results as coded data segments. ‘Automatic analysis’ tools such as these can be helpful complements to the QDA process, but it is most crucial that researchers critically reflect on what is found by the software, rather than accepting the ‘findings’ at their face value (this is another moment where memo-writing will be of great help). It is important to remember that these automatic analysis tools are simply computer programmes searching for words, and this has its inherent limitations: CAQDAS will not distinguish whether a participant is talking about ‘going to the park’ or ‘parking the car’, but it will code both of these when searching for ‘park’. Similarly, CAQDAS will not be able to identify when participants are indeed talking about the concept but without using the actual word (e.g. ‘It’s a great place to relax and spend time with family’).

Auto-coding (searching for words and saving results as coded data segments) in ATLAS.ti.
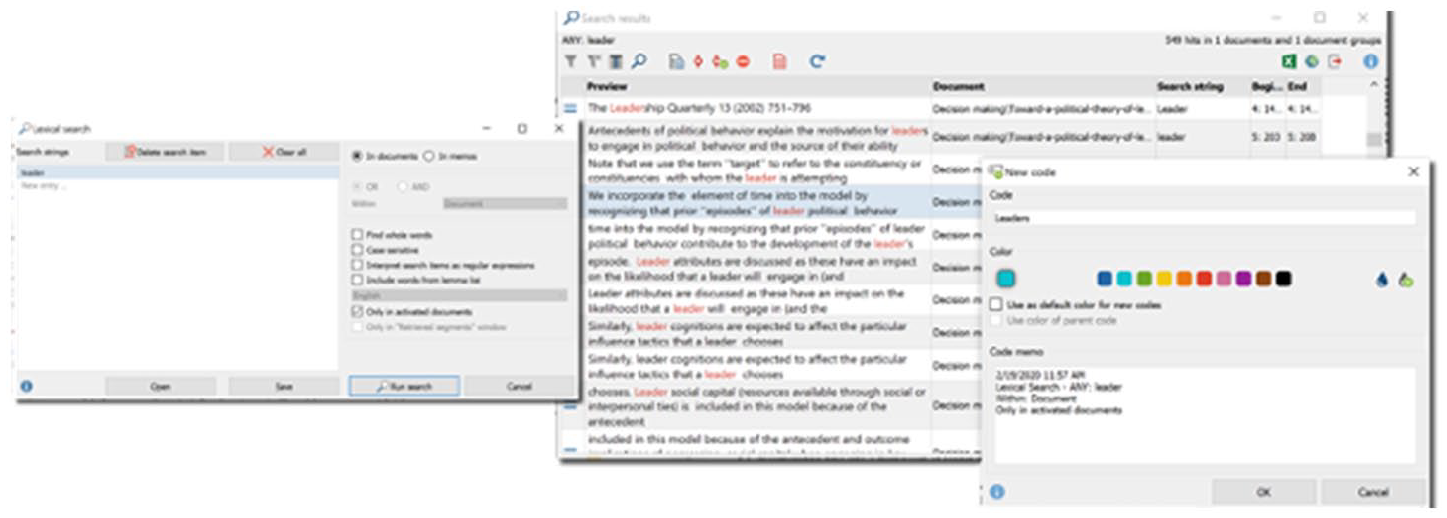
Auto-coding (searching for words and saving results as coded data segments) in MAXQDA.
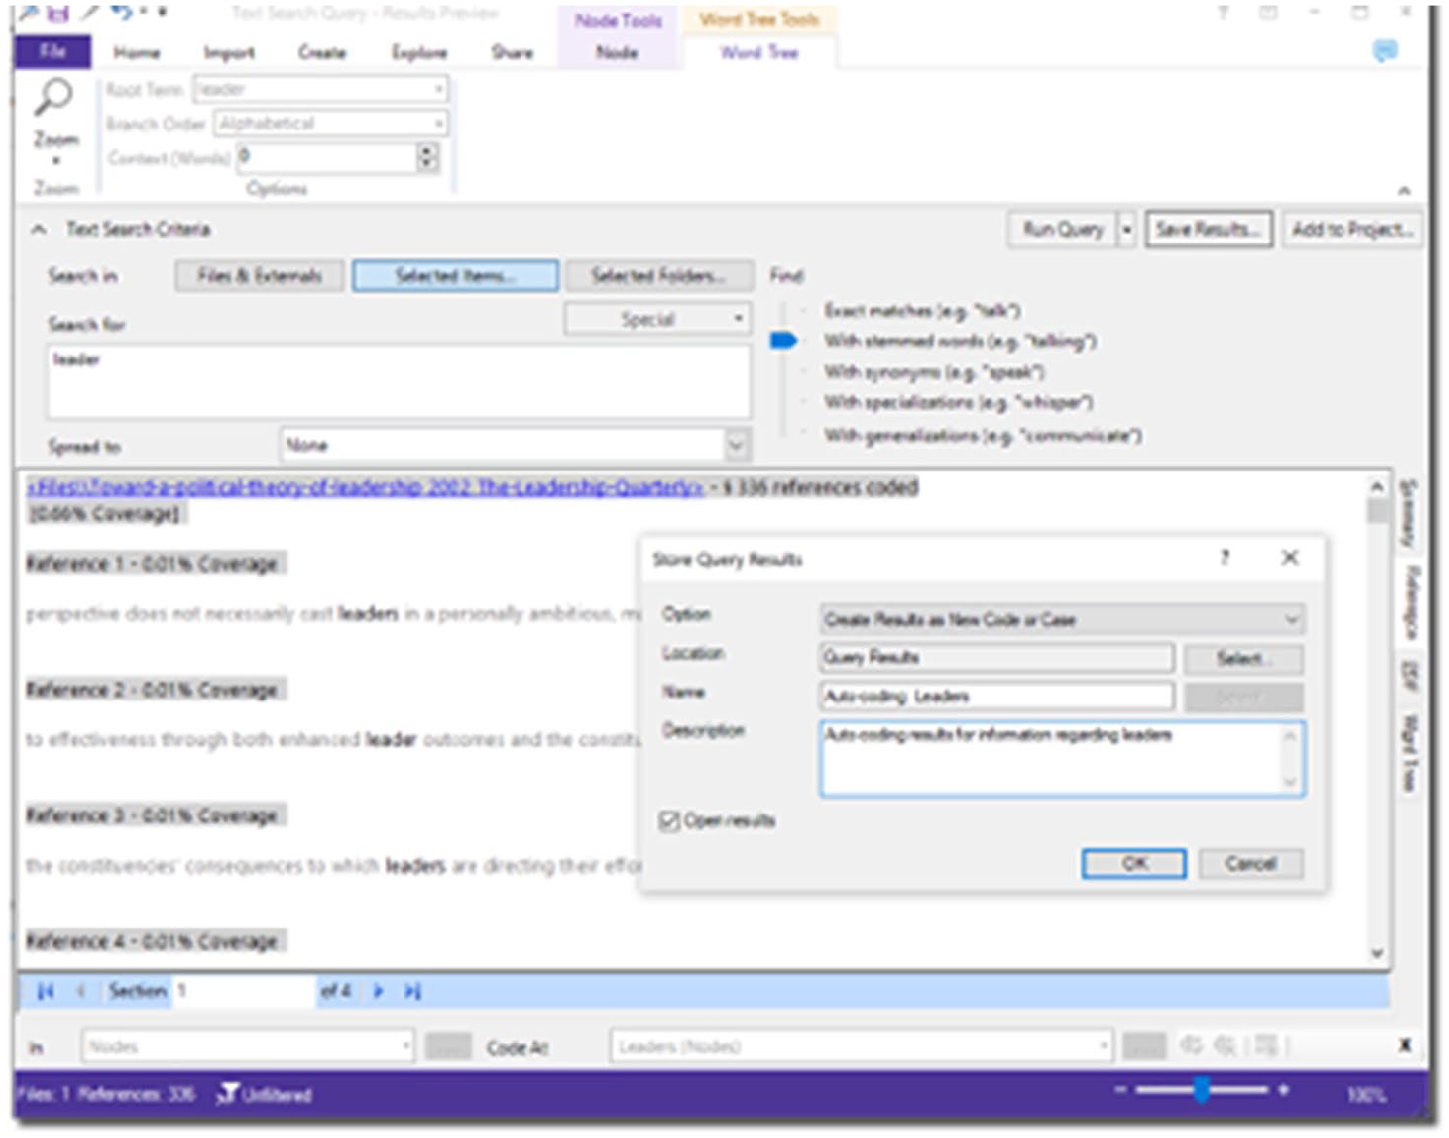
Auto-coding (searching for words and saving results as coded data segments) in NVivo.
In ATLAS.ti, this is called ‘auto-coding’. This is a specific tool for searching for keywords, highlighting data segments and allowing the researcher to easily attach a code. Each match can be manually approved, or all matches can be automatically coded.
In MAXQDA, searching for words and saving matches as coded data segments is called ‘lexical search’. Researchers can search in one or more documents by selecting (or unselecting) the option to only search in ‘activated’ documents. A code memo can also be written on the code being associated with all the matches to provide a description of that code (this is helpful for documenting the auto-coding process, such as which keyword and codes are being used and why the researcher is searching for them).
In NVivo, researchers could use ‘text search’ to save identified data segments to a code. NVivo also has an ‘auto-coding’ tool, which automatically analyses the data for themes, sentiments, structures, styles, or existing coding patterns. This could also certainly be a helpful tool for novices who wish to explore what concepts and patterns are present in their data (however, the researcher has less control over this auto-coding feature to specify which words to search for and so on; rather, NVivo will automatically detect and display information from the selected document).
Coding cycle
The coding cycle entails more in-depth analyses of the data – researchers can collect pieces of data that catch their attention and write interpretations in memos. This cycle also facilitates condensation of the data by beginning to select, focus, simplify, abstract, and/or transform data (Miles et al., 2014). Researchers may begin by selecting and saving interesting segments of data in CAQDAS (see Figures 16 and 17), which is akin to highlighting, bolding, underlining, and/or colouring (Saldaña, 2013).
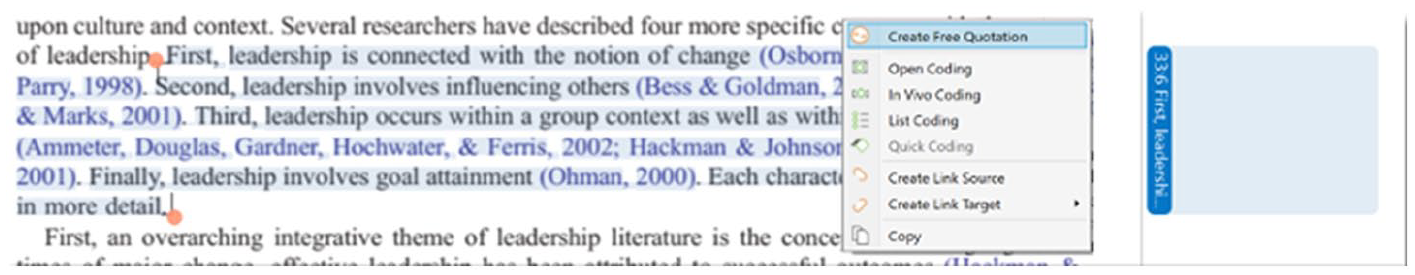
Marking and saving segments of data in ATLAS.ti.
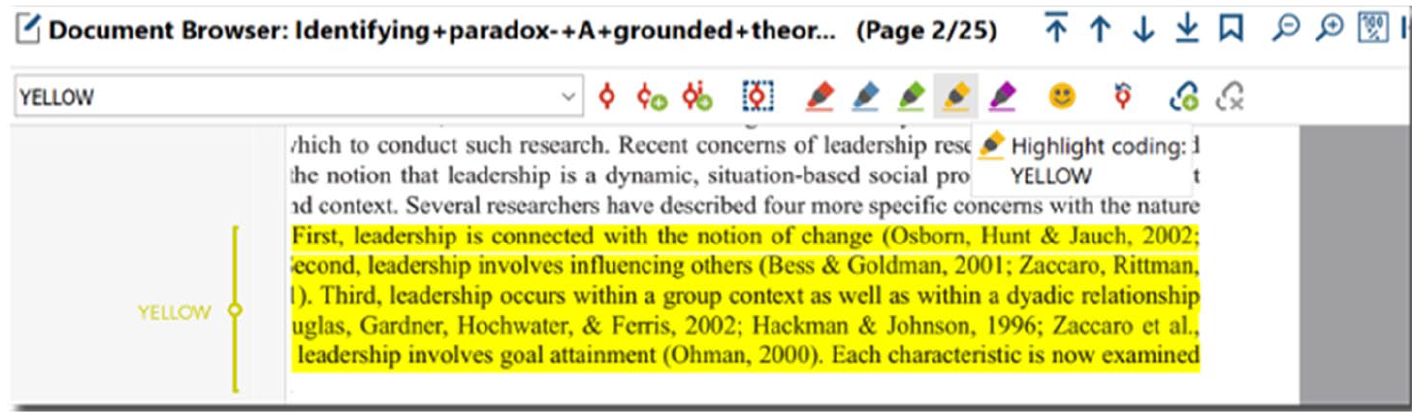
Marking and saving segments of data in MAXQDA.
In ATLAS.ti, users can save ‘free quotations’ (segments of data that are not attached to anything else).
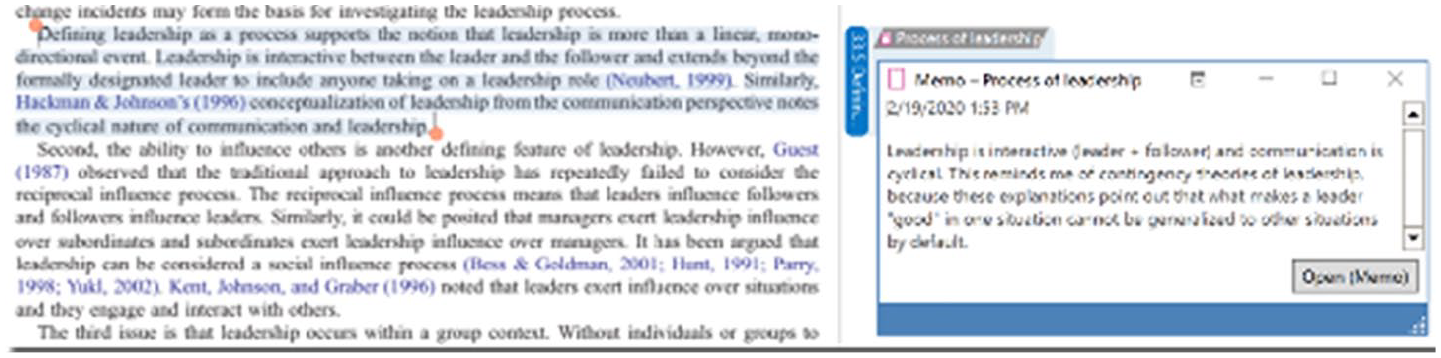
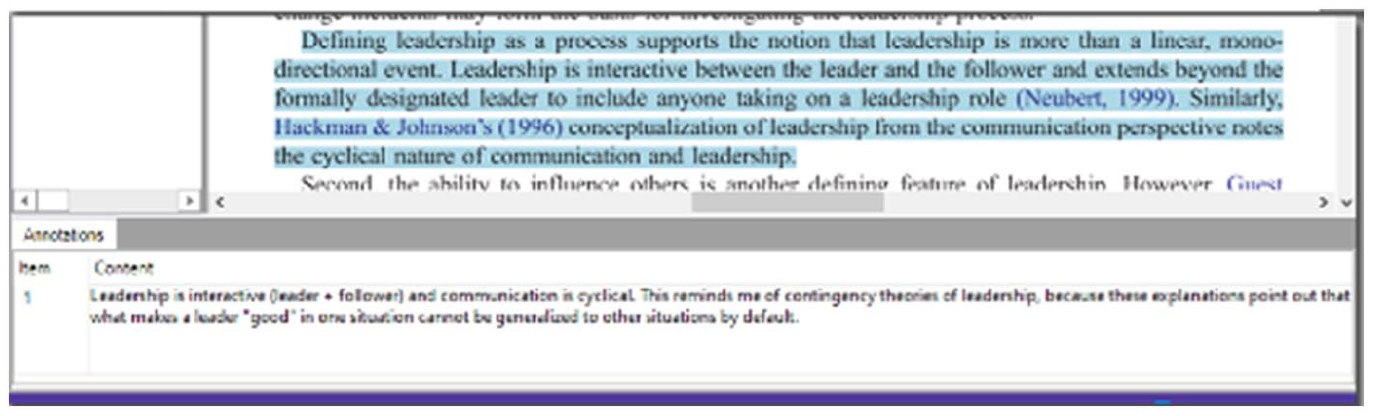
In MAXQDA, researchers can highlight segments of data with different colours and even emoticons. Although NVivo does not have an option to just save a selected data segment, researchers can select data quotations and write annotations (i.e. NVivo does not force users to associate codes, but something has to be done to save the data quotation, such as writing an annotation, adding a ‘See also’ link, or associating codes). In addition to selecting interesting segments of data, we also recommend researchers write why each one caught their attention in (analytic) memos and link their notes (memos) directly to these quotations (see Figures 18 to 20). This is an extremely helpful feature, because it allows researchers to quickly and easily note down their ideas as they come to mind as well as link these notes to the corresponding data segments.
Writing and linking notes to segments of data in ATLAS.ti.
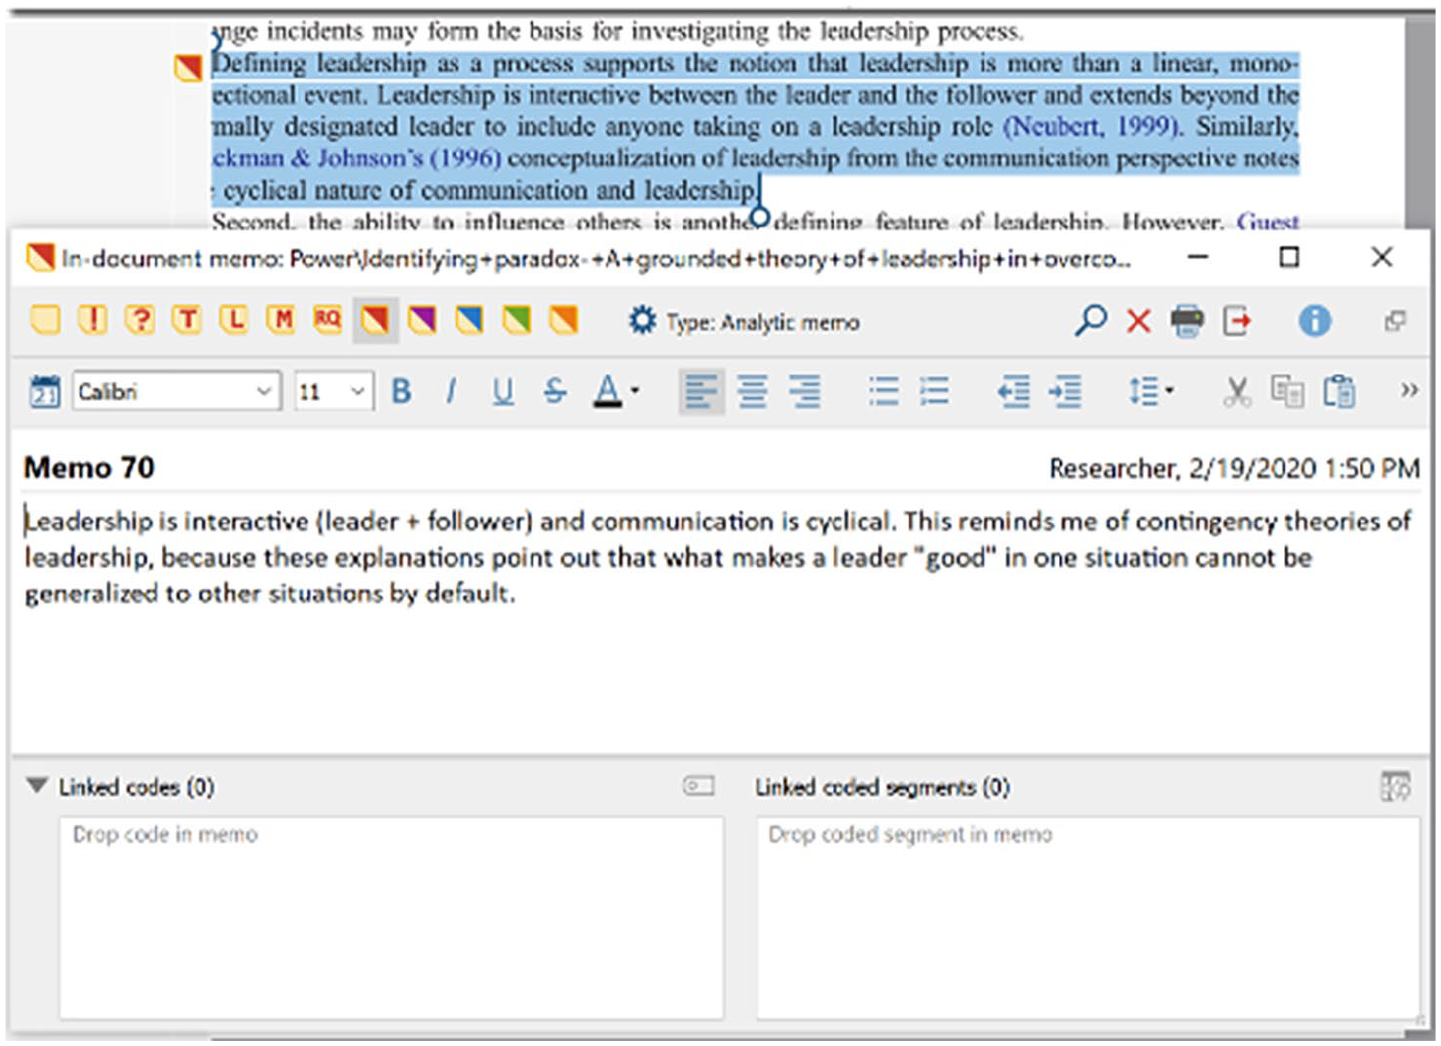
Writing and linking notes to segments of data in MAXQDA.
Writing and linking notes to segments of data in NVivo.
In ATLAS.ti, a free memo first has to be created and then memos can be dragged-and-dropped onto quotations from the list on the left-hand side. A single memo can be attached to as many quotations as the researcher wishes, and any single quotation can have multiple memos associated with it.
In MAXQDA, memos can be created and linked by right-clicking on any data segment. Each time a memo is written on a data segment, a new (‘in-document’) memo is created. Thus, it is easy to write memos on each data segment, but the same memo cannot be attached to multiple data segments. To document overarching ideas and insights, researchers can write in free memos, while in-document memos can be used to note down thoughts regarding specific data segments.
In NVivo, annotations can be created to write comments on each data segment (by right-clicking on the highlighted segment). A memo in NVivo can be linked to a document, but only one memo can be linked to an entire document. Given the benefit of directly linking notes to their corresponding data segments, we recommend using annotations so that reflections on specific data segments can be captured. Memos, on the contrary, could be used to write about overarching ideas and analyses.
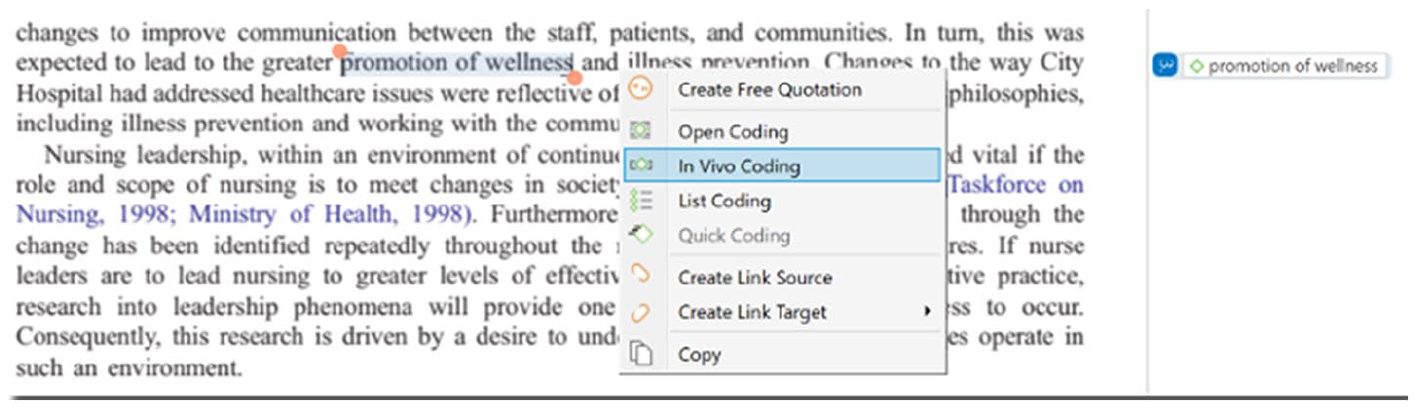
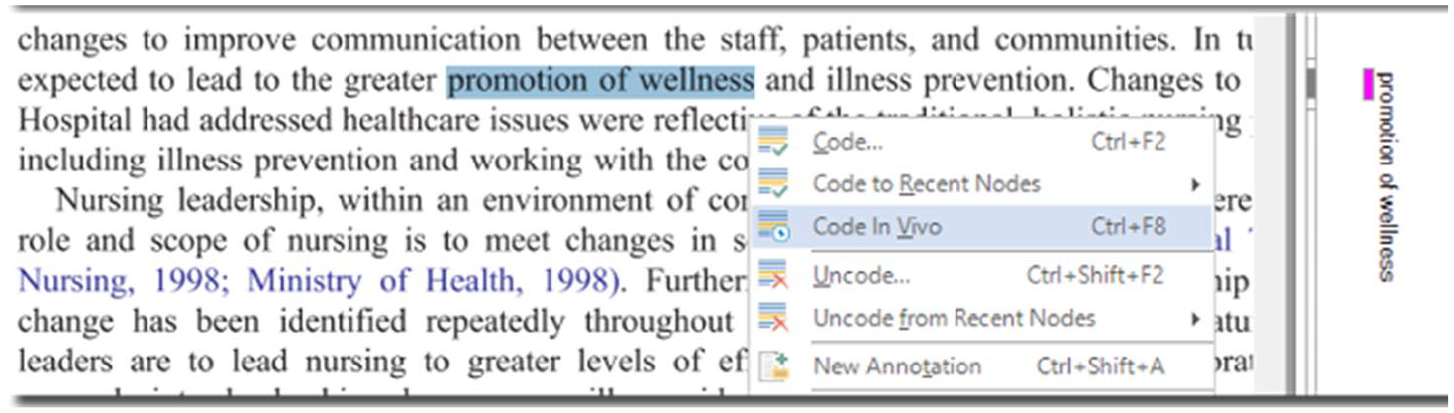
Next, researchers may begin creating and attaching codes to data segments – initial coding. These codes can capture a variety of topics, and openness to different possible theoretical directions is encouraged (Charmaz, 2014; Corbin and Strauss, 2014; Glaser, 2005; Glaser and Strauss, 1967; Miles et al., 2014). The aim is to capture analytic leads that may be worth further exploration (Saldaña, 2013). Researchers can also generate in vivo codes, or words and phrases that come directly from participants (see Figures 21 to 23). In all three CAQDAS analysed here, researchers can attach codes by right-clicking on selected data segments and/or by clicking on the coding buttons in the toolbar located above the opened document. Moreover, codes that have been associated with data segments appear in the margin area next to the document; researchers can thus easily scroll through their documents and see which codes were attached and where.
In vivo coding (creating code names directly from data) in ATLAS.ti.
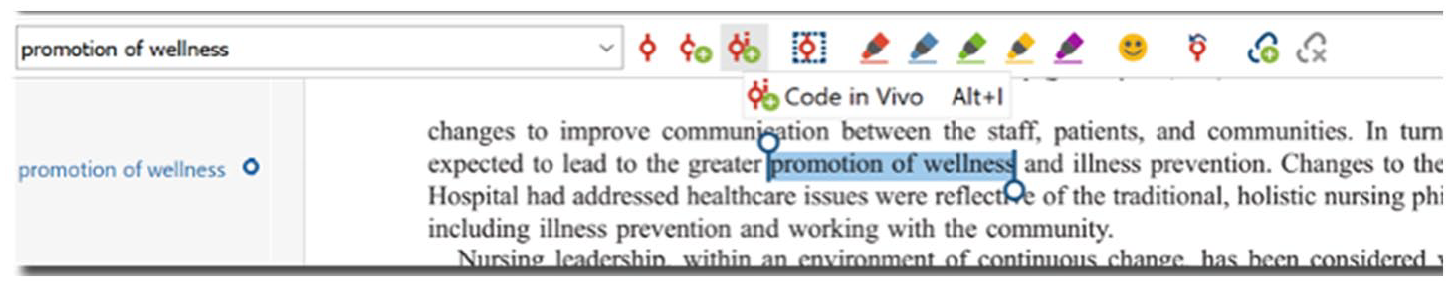
In vivo coding (creating code names directly from data) in MAXQDA.
In vivo coding (creating code names directly from data) in NVivo.
Third, researchers can engage in elaborative coding – initial deductive analyses of the data. Researchers are encouraged to create a ‘start list’ of codes based on their previous literature review and theoretical understanding. Coding is thus carried out in a ‘top-down’ manner: researchers analyse their data to see which segments ‘fit into’ each code from the previously created list (see Figures 24 to 26). ‘Coding by list’ and even importing pre-existing codebooks (from Excel, for example) can easily be done in ATLAS.ti, MAXQDA, and NVivo.
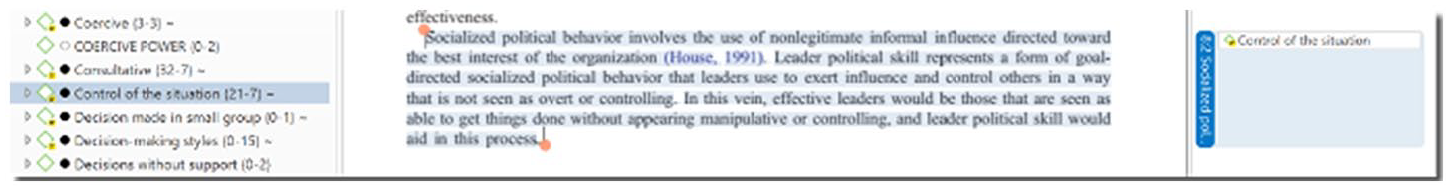
Using codes that were already created (e.g. deductive coding) in ATLAS.ti.
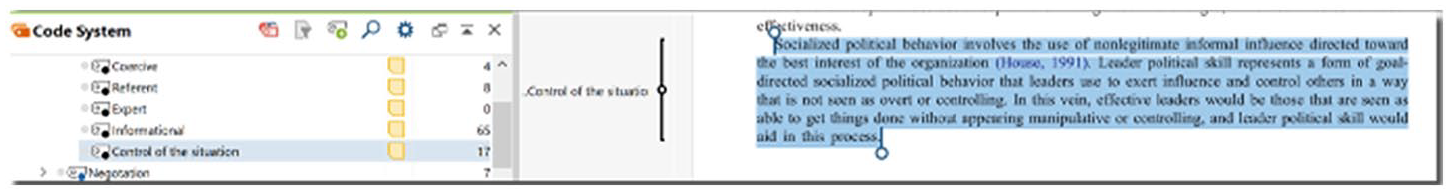
Using codes that were already created (e.g. deductive coding) in MAXQDA.
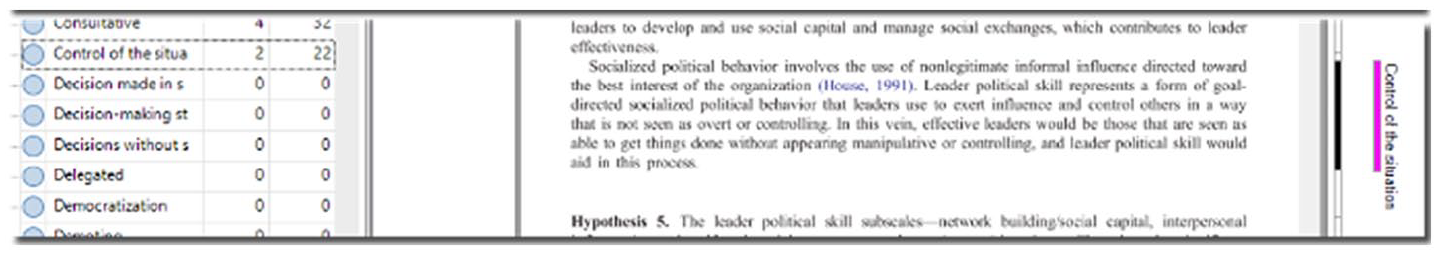
Using codes that were already created (e.g. deductive coding) in NVivo.
All of the created codes will appear in the list on the left-hand side in ATLAS.ti. When coding data with already-created codes, the ‘drag-and-drop’ features of all three CAQDAS greatly facilitate the workflow: researchers simply need to highlight the relevant segment of data and then drag-and-drop their code(s) on top of that segment.
MAXQDA has an additional feature that is particularly helpful for coding by list: keyboard shortcuts can be assigned for up to nine codes.
In NVivo, highlighted data segments are dragged-and-dropped onto codes.
In our opinion, the ability to save data segments without having to associate any particular object is valuable. Importantly, all three CAQDAS make it easy for researchers to write and associate memos to data segments. Creating new codes are easily done in all three software. MAXQDA also permits researchers to assign keyboard shortcuts as well as the option to use code alias names (in case the researcher wishes to use different, perhaps more ‘polished’, code names for final exports and reports). Drag-and-drop features are quite helpful during extended work on the computer, and users may prefer the logic of dragging-and-dropping codes onto data segments (as done in ATLAS.ti and MAXQDA) or dragging-and-dropping data segments onto codes (as done in NVivo).
Categorisation cycle
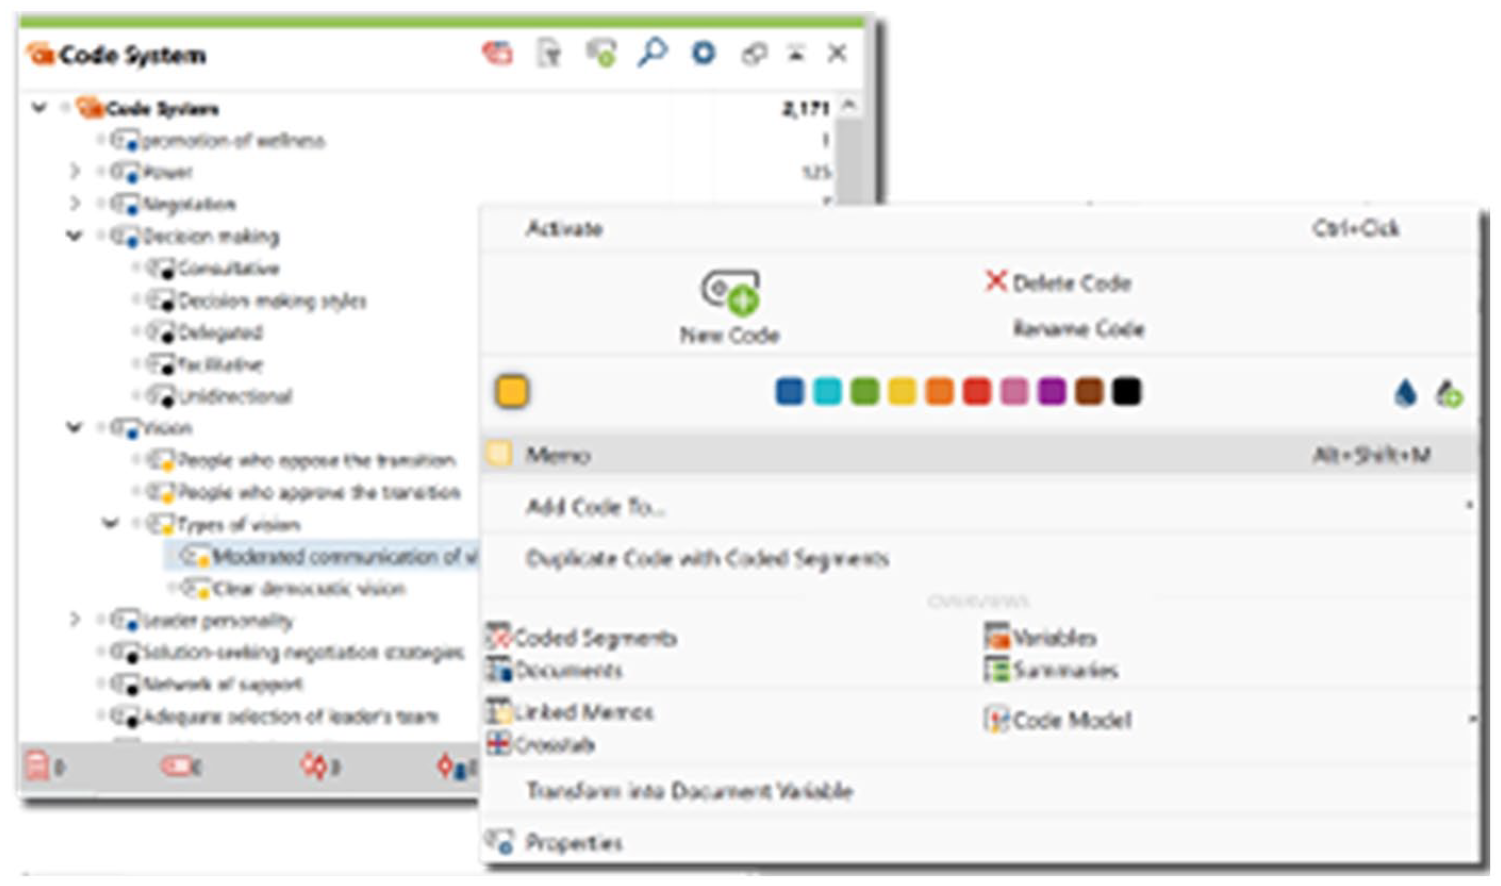
The categorisation cycle draws the researcher’s attention to more coherently organising the codes. Codes may be renamed and deleted, multiple codes can be merged, and single codes can be split (see Figures 27 to 29). Codes can also be grouped (e.g. to begin identifying different categories or dimensions). Researchers may note down how and why they are changing their list of codes in a methodological memo.
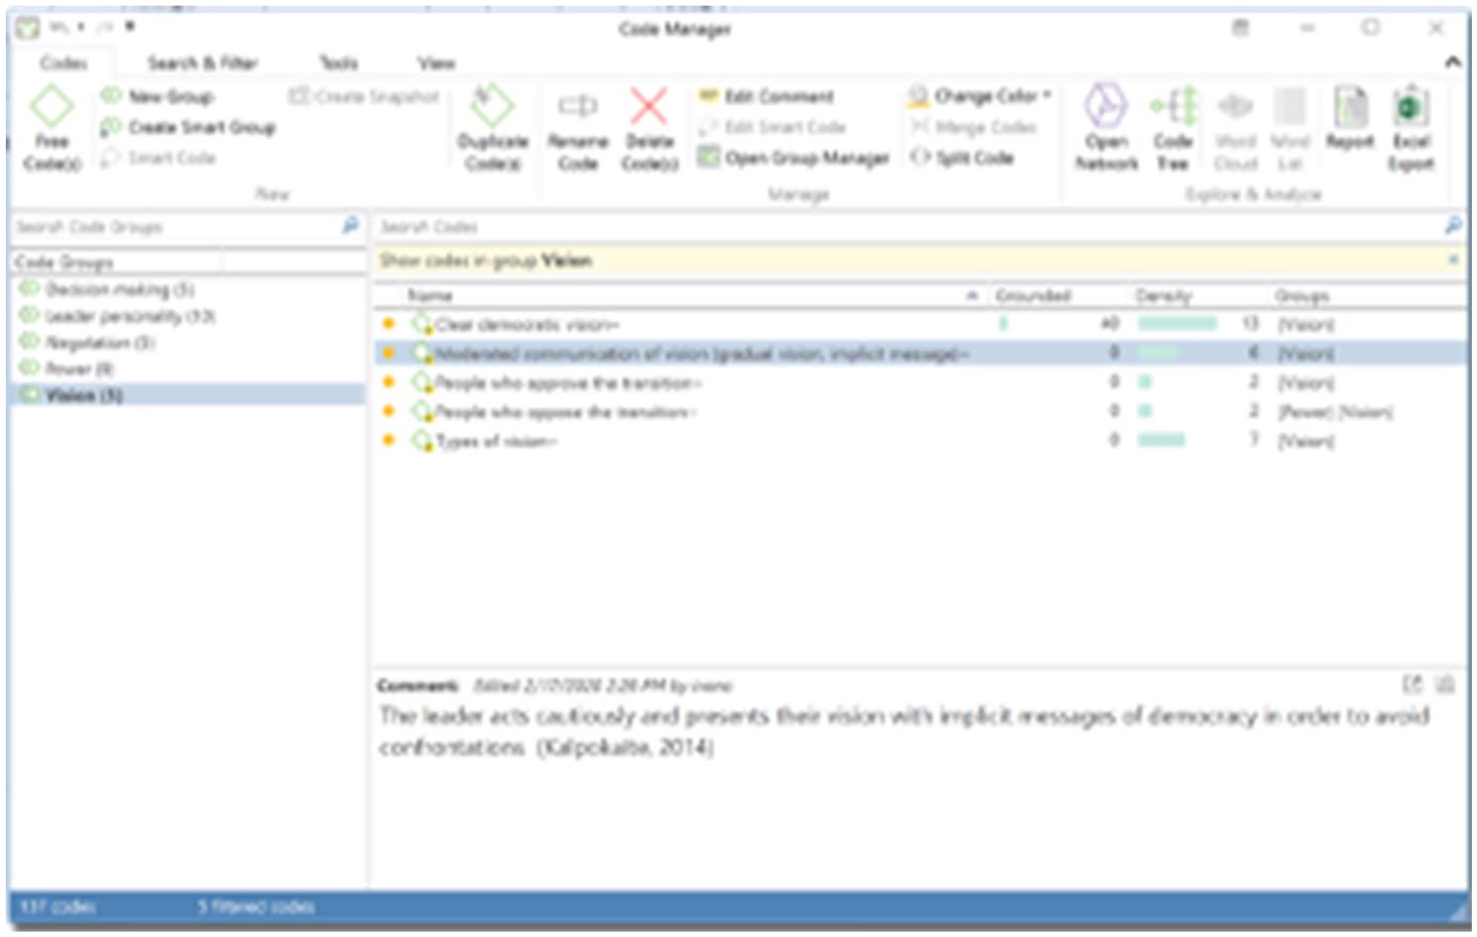
Editing the list of codes (grouping, writing definitions, changing names, colours, etc.) in ATLAS.ti.
Editing the list of codes (grouping, writing definitions, changing names, colours, etc.) in MAXQDA.
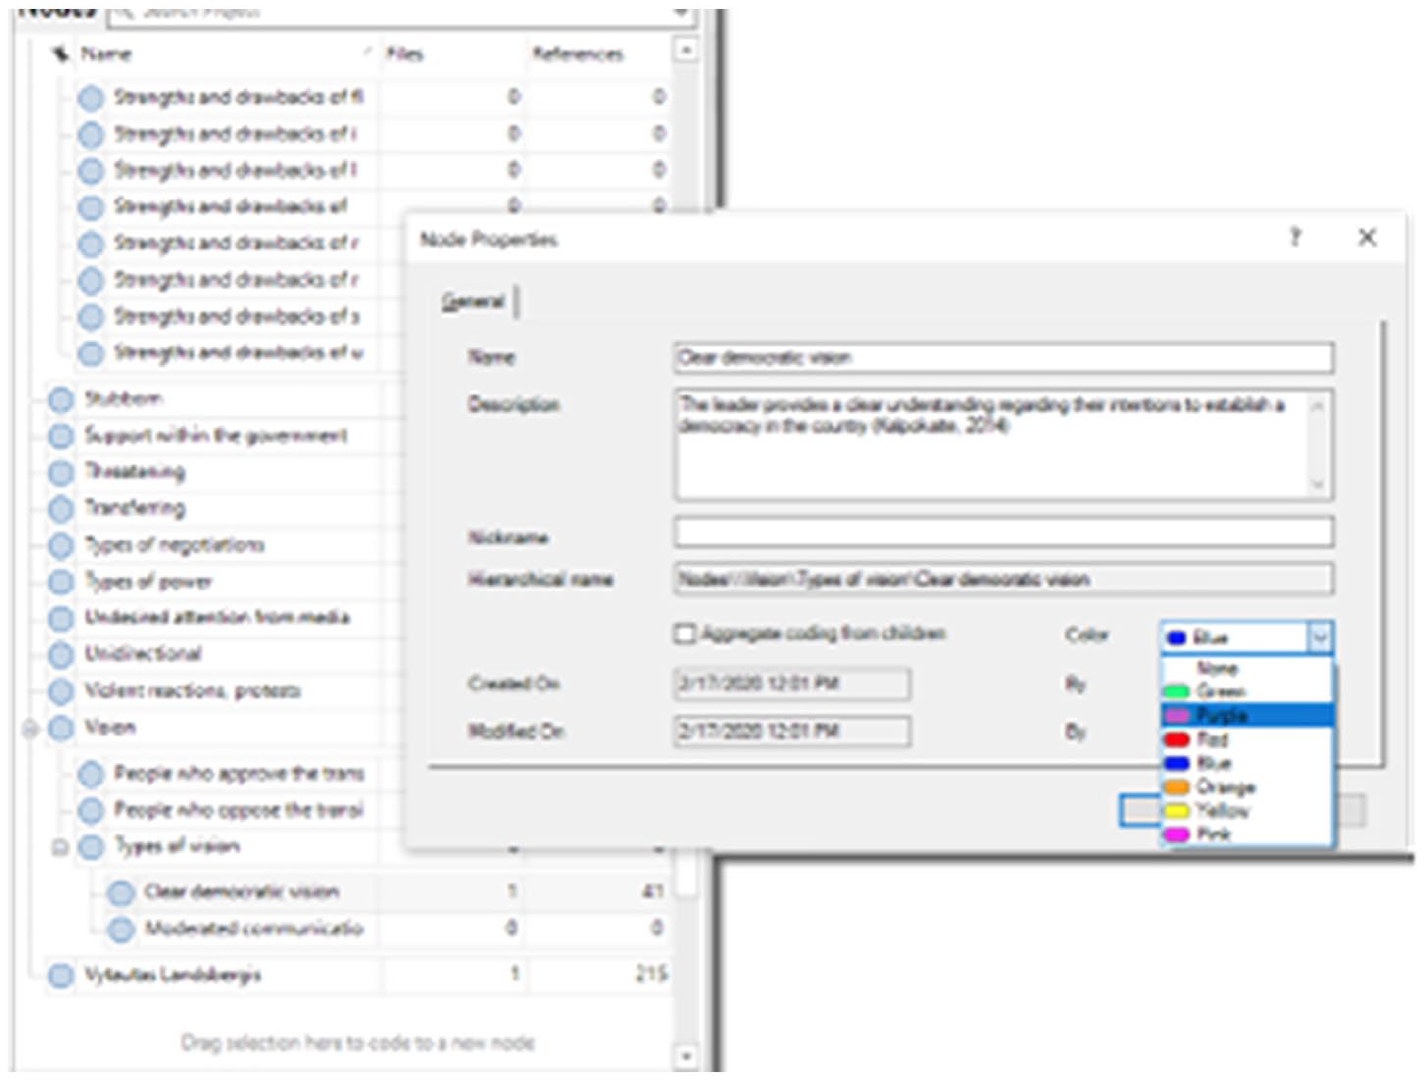
Editing the list of codes (grouping, writing definitions, changing names, colours, etc.) in NVivo.
In ATLAS.ti, the code manager is a dedicated space for organising codes (groups can be created, and codes can be coloured, renamed, merged, and split). While ATLAS.ti does not permit the creation of subgroups, codes can be renamed to include prefixes to indicate hierarchical levels.
In MAXQDA, all code editing is done directly from the code list on the left-hand side (the Code System window). Multiple subgroups of codes can be created by simply dragging-and-dropping codes, and codes can be moved into whichever order the researcher prefers.
All code editing is also done directly from the code window on the left-hand side in NVivo. Multiple subgroups can also be created by dragging-and-dropping codes.
It is important to conceptually and operationally define the dimensions or categories. The code comment space can be used for writing definitions in ATLAS.ti; code memos are dedicated spaces for definitions in MAXQDA; NVivo code definitions can be written in the description of the code properties. Thus, editing and structuring codes are easy to do in all three CAQDAS. For users who want to be able to create code subgroupings, MAXQDA and NVivo are recommended. On the contrary, ATLAS.ti and MAXQDA stand out for their visual display of the codes, as the codes can be seen with their colours and icons appear to indicate when a comment/memo has been written on a code. Researchers can then carry out focused coding by re-reading their data and considering how the data ‘fit’ with the newly identified categories (or dimensions) of codes; this is also important for checking the consistency of the coding.
Modelling cycle
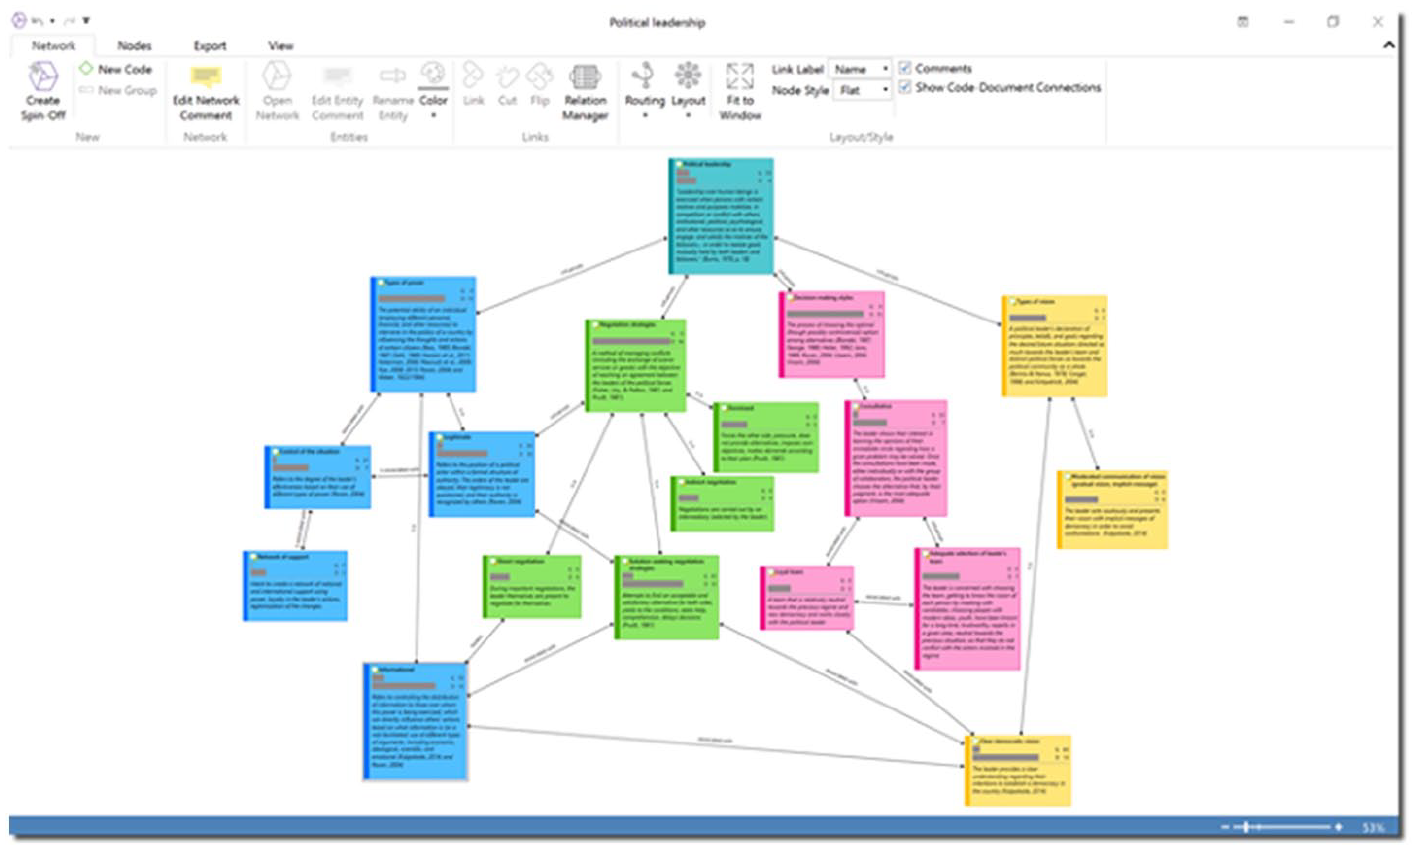
The Modelling cycle consists of creating the final conceptual framework (see Figures 30 to 32). In line with many other qualitative researchers, we highly encourage the practice of displaying data to explore overarching connections and develop ‘meta-thinking’ skills (Braun and Clarke, 2013; Corbin and Strauss, 2014; Flick, 2018; Miles et al., 2014). Visual displays can be very compelling (and they can easily be exported from CAQDAS in different formats and included in final reports and presentations). These networks (or conceptual frameworks) can be revised to incorporate new codes, remove unnecessary codes, and specify relations among codes. With CAQDAS, creating and flexibly changing networks as understanding evolves is easier than ever. It is also common at this point to revisit the literature in light of the new insights gained from the data analysis. Finally, with tentative conclusions developed, a final verification can be done to check that the researcher’s findings and interpretations accurately represent the data (Miles et al., 2014).
An example of a conceptual framework in ATLAS.ti.
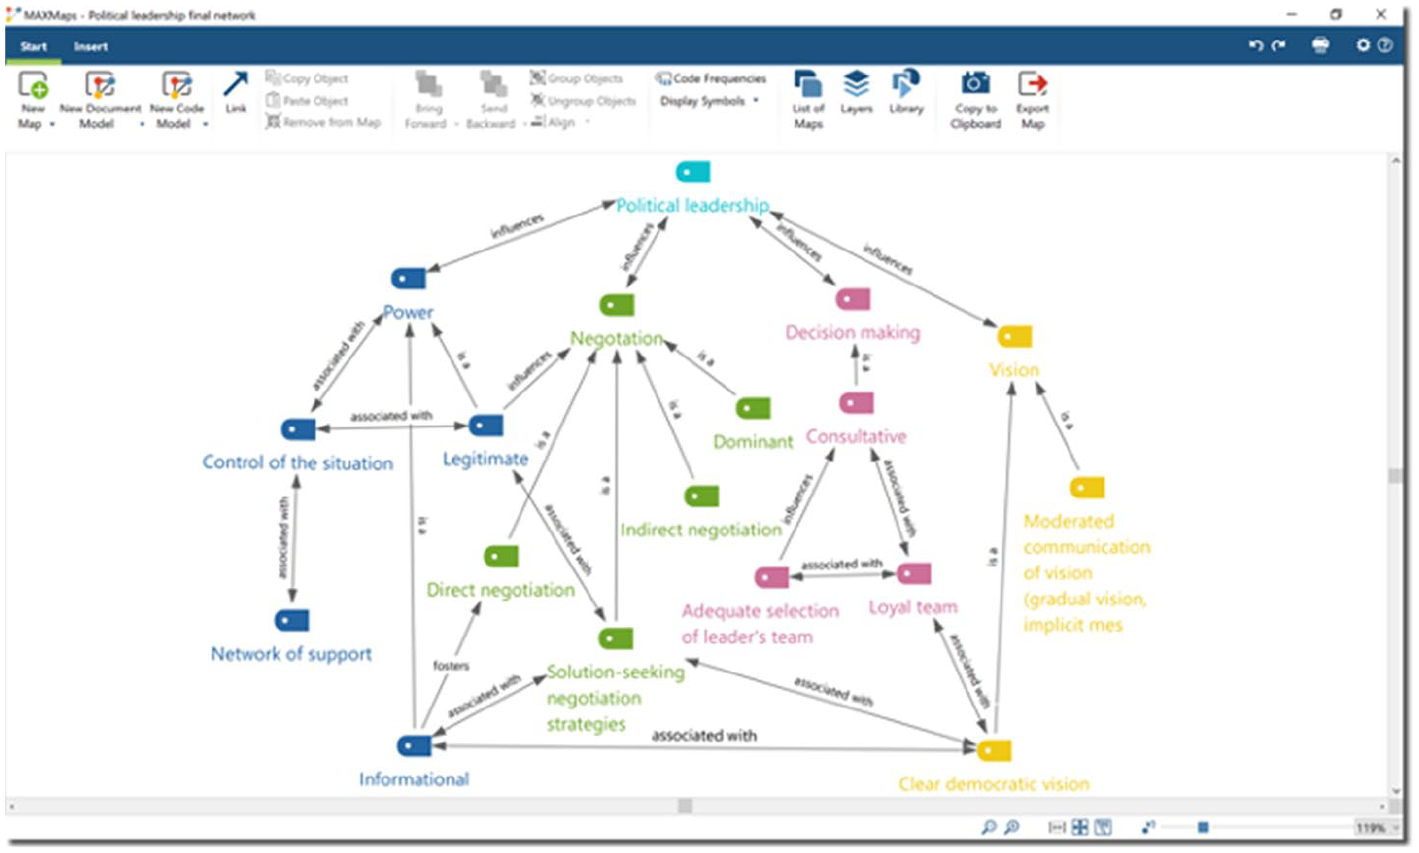
An example of a conceptual framework in MAXQDA.
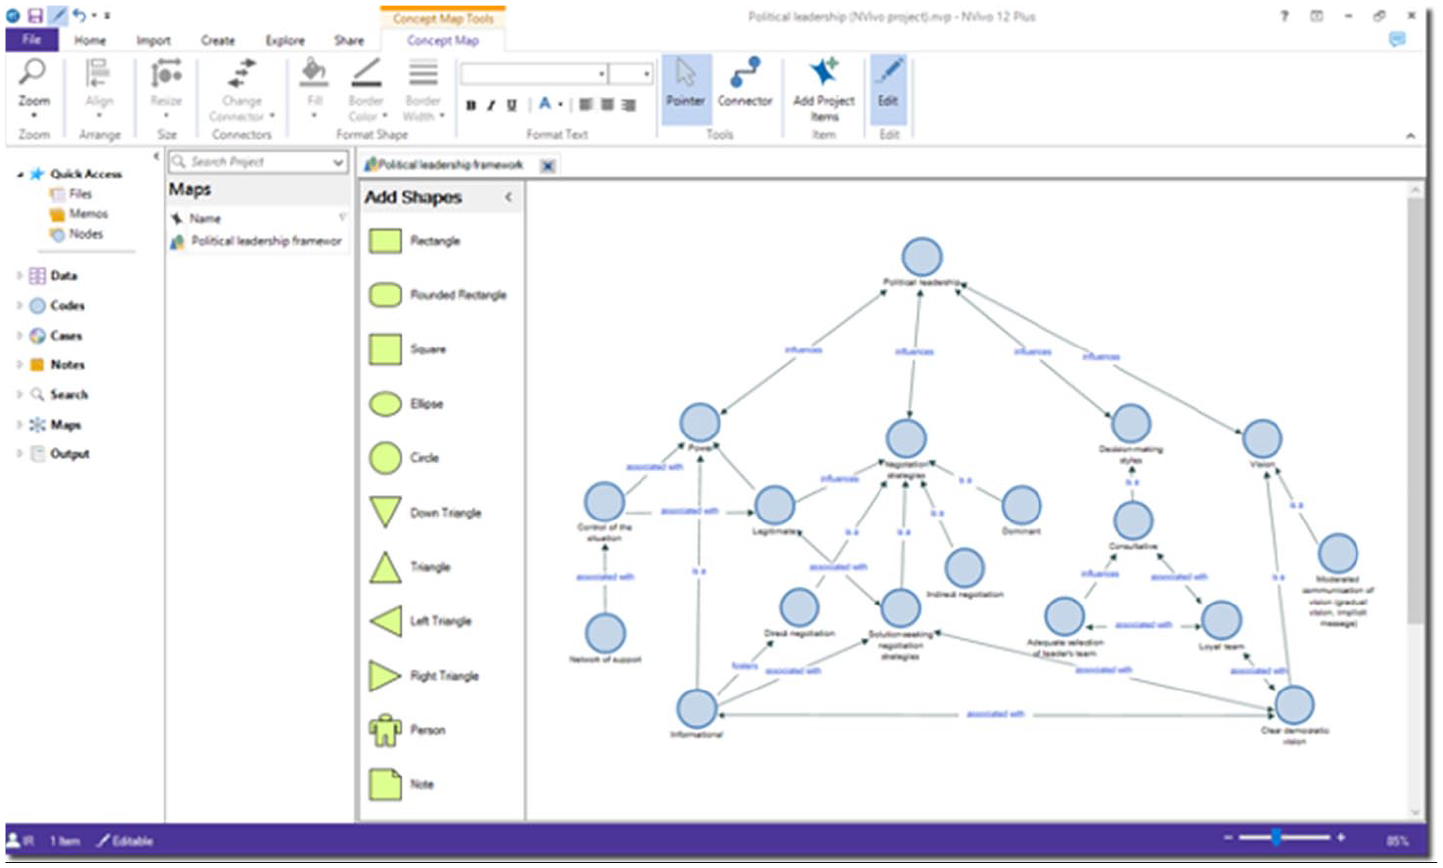
An example of a conceptual framework in NVivo.
Networks in ATLAS.ti are fully customisable, from specifying link labels to visualising any part of the project (including data segments). Additional coding can even be carried out by connecting codes to quotations in networks. ATLAS.ti allows users to visualise code frequencies and comments, which is particularly helpful when elaborating the final conceptual framework. For example, researchers can easily show how many data segments are attached to each code as well as all of the operational definitions.
MAXQDA has a variety of visual tools that researchers can use to explore their research, such as a code matrix browser, code relations browser, code map, and document map. For the modelling cycle, however, we recommend using the ‘MAXMaps’ feature. This permits researchers to freely create networks and link together the different parts of their project, and extra objects can be added (like shapes, arrows, text boxes, and images). While code memos can be added to also see the operational definition of each code, this would essentially duplicate the number of items in the map, so MAXQDA users may prefer to present their code definitions in a separate display (e.g. a map or table).
In NVivo, mind maps and concept maps are drawn by the researcher by creating shapes, adding text, and drawing connections between the objects (akin to sketching out maps with pen and paper). Mind maps can later be converted into codes (thus, this feature may be more useful in the beginning cycles of analysis). Adding actual objects from the project (such as codes, data segments, memos) can only be done in concept maps and project maps. In our view, concept maps are the most appropriate for the modelling cycle, as researchers can draw fully customised networks in which they decide which codes are linked together and how (in project maps, on the contrary, the links between objects are automatically generated and cannot be manually edited). Being able to sketch out ‘mind maps’ by adding shapes and writing text is an interesting tool for thinking through a project, and it may feel more intuitive and easier to use for novices (who may be accustomed to sketching out ideas in this way with pen and paper). When researchers reach the modelling cycle, however, creating maps of the finalised list of codes, groups, and memos (along with possibly including data quotations and documents) can be very helpful.
Finally, the capability to export the different parts of the analysis can be incredibly helpful for putting together the final report. Researchers may export their memos, data segments, codebook, networks, and more, to quickly and easily retrieve relevant parts of their analysis that will go into the final report. In these three CAQDAS, various export options are offered (e.g. exporting networks, word clouds, and tables) in different formats (e.g. Word files, Excel spreadsheets, images). It is not necessary that researchers export and include every part of their analysis project in the final report. Rather, what is most important is that the final report shows readers what the research question is, how it was addressed, and what answer to this research question is ultimately provided. Following the QDA model here, the most important aspects for researchers to refer back to in writing up the final report are the memos and final conceptual framework. The network can be of particular help in two ways: (1) to provide a compelling summary of the analysis and findings (which is also useful for conveying these contents to readers) and (2) to provide guidelines for researchers to structure the flow of content in their paper (e.g. introduce the broad ideas, which are typically the codes at the upper or central levels of a network and then discuss the more specific details, which are typically the lower or outer level codes connected to the initial broad ideas).
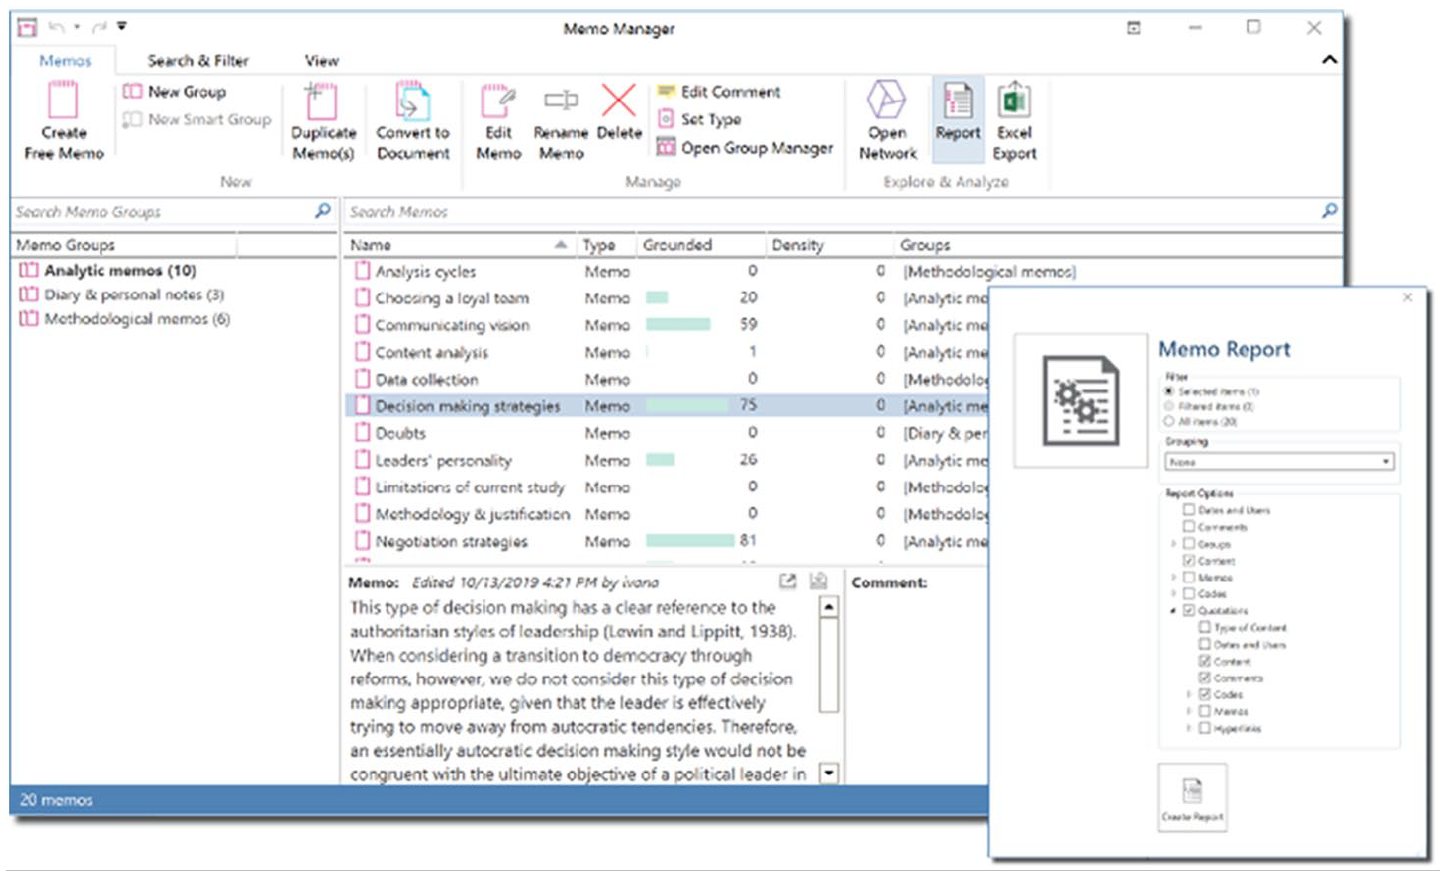
Memos, on the contrary, will contain a great deal of the written content that will go into the final report. Following this QDA model, researchers will have been writing in their memos from the very beginning, from explaining what is being done (i.e. the research diary) and outlining the methodological steps that were taken (i.e. methodological memos) to the critical analyses and reflections regarding the data (i.e. analytic memos). Thus, researchers may find it useful to export their memos (along with any associated data segments and codes) so that they can copy and paste the contents into the final report (see Figures 33 to 35). The writing in the memos is most likely not in its final and polished form, but the ‘hard work’ of actually writing out the analysis is probably already done in the memos. Researchers can then focus on editing their final report for correct spelling, grammar, and the overall flow of the separate sections (e.g. literature review, methodology, and findings).
Exporting memo reports with associated data quotations in ATLAS.ti.
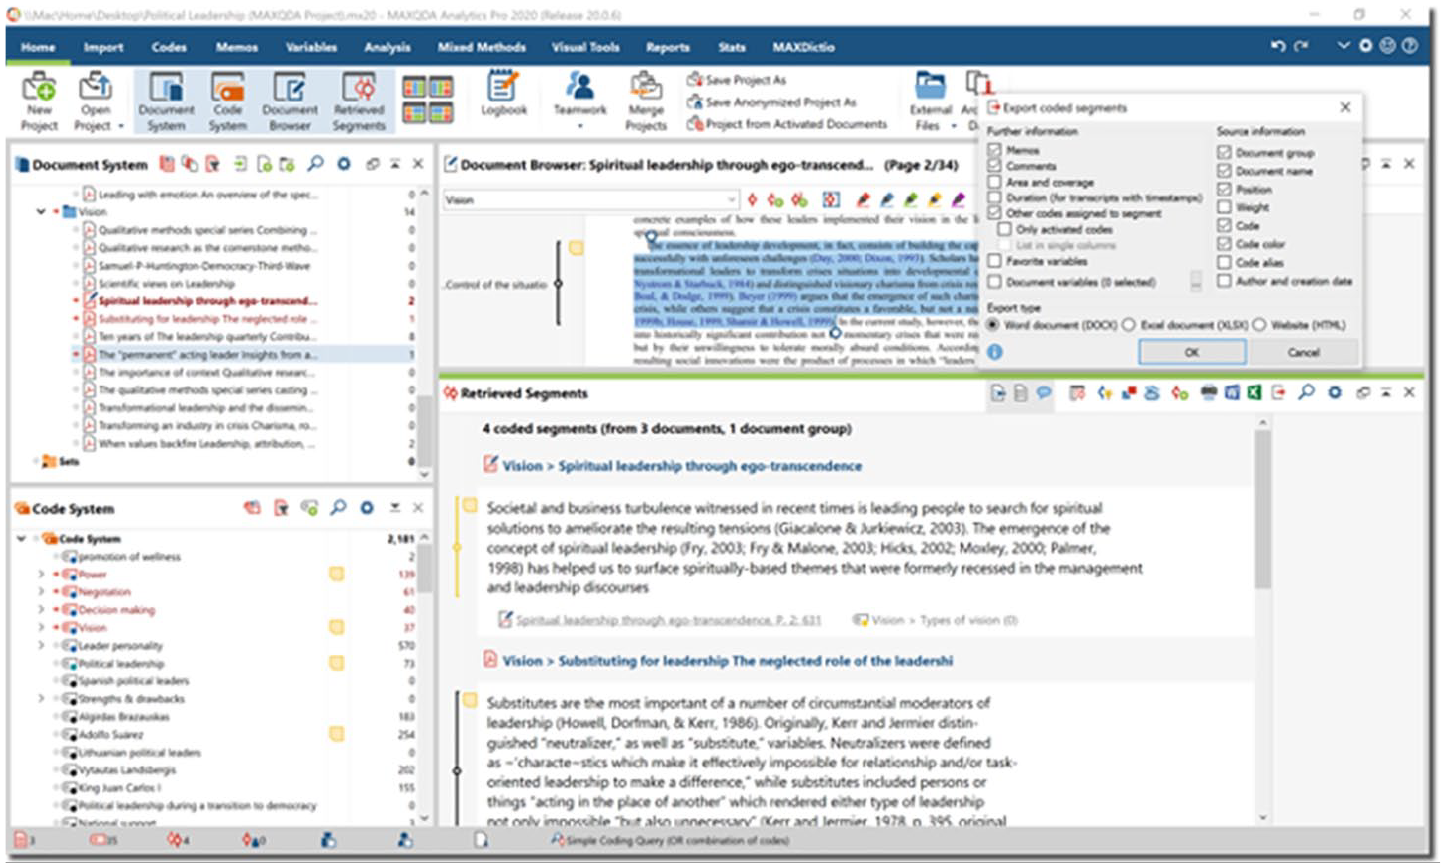
Exporting reports (coded segments and associated memos) in MAXQDA.
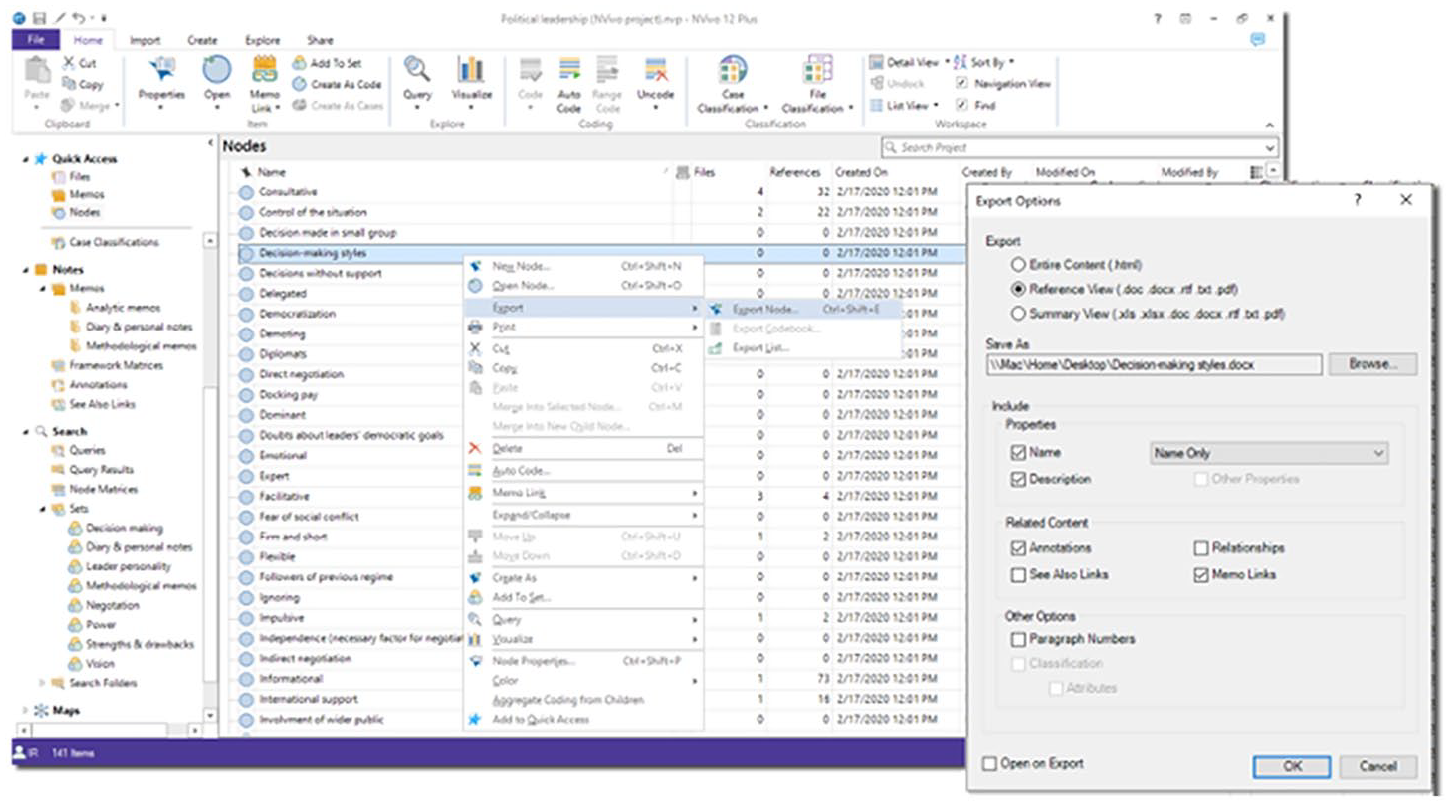
Exporting report of nodes (with associated annotations) in NVivo.
Reports can be exported from any of the ‘managers’ in ATLAS.ti (e.g. document manager, code manager, memo manager). Once the desired memos have been selected, the researcher can click on the ‘Report’ button and select which information they want to include in the report. For example, the full content of the memo can be exported along with its associated data quotations, the codes attached to those quotations, and more.
MAXQDA memos can be exported by opening the corresponding memo window (e.g. Free memos, Code memos, In-document memos, and Document memos under the Memos tab). Researchers can also export their data and analysis from the ‘Retrieved Segments’ window: first, the user needs to activate the document(s) and code(s) they are interested in (this can be done by clicking on the small circle that appears to the left of each document and code). The corresponding coded segments will appear in the window, and by clicking on the ‘Export retrieved segments’ button, all data segments can be exported with their associated codes, memos, and more. MAXQDA also has an additional feature for exporting codes and their associated data segments: the ‘Smart Publisher’ tool (under the ‘Reports’ tab) saves the selected codes and their data segments in a Word document that is conveniently formatted and presented.
Memos can be exported from NVivo by selecting the memo(s) of interest from the left-hand panel, right-clicking, and selecting the ‘Export’ option. This will save the contents of the memos in a file on the computer. However, the real value of exporting reports at this stage is the possibility to view one’s ideas and analyses alongside the supporting data segments. Since memos cannot be linked to individual data segments in NVivo, we recommend that researchers export reports of their memos as well as reports of their relevant codes.
It is also worth mentioning that, at this point, researchers may wish to use other ‘advanced’ analysis tools in CAQDAS. These can be helpful for examining which data segments are attached to which combinations of codes, examining code (or concept) frequencies, and analysing which codes are appearing together, to name a few examples. While advanced analysis tools offer additional possibilities (and we encourage researchers to explore querying their data in different ways), they are not strictly necessary for carrying out a qualitative study (unlike the importance of data segments, codes, memos, and networks).
Overall reflections on all three CAQDAS
For a brief summary of how CAQDAS can be used following a qualitative methodology, Table 2 presents the foundational QDA model with the corresponding CAQDAS features outlined here.
Foundational QDA model with corresponding CAQDAS features.

QDA: qualitative data analysis; CAQDAS: computer-assisted qualitative data analysis software.
This walkthrough of each software was focused on illustrating how CAQDAS can be used following specific analytic strategies and highlighting key similarities and differences. We hope that both novices and those who have been disillusioned with CAQDAS may be able to see how they can use their chosen software to pursue specific analytic strategies. For those trying to decide which CAQDAS to use, we reiterate that virtually all CAQDAS are suitable for QDA as software developments over the years have largely addressed the original concerns that were voiced about CAQDAS (Humble, 2012) and CAQDAS tends to include features for coding-and-retrieval, hyperlinking, and theory generation (Kelle, 1997). We thus recommend that researchers explore each CAQDAS they are interested in by using the free trial version to get a feel for how each software works and how it suits their working style and priorities. In the end, it may also simply be a matter of personal preference for the interface or workflow. We hope that this walkthrough helps researchers see that, rather than labouring over which CAQDAS is ‘better’ for carrying out rigorous QDA, what is most important is that educators and researchers think about how they can translate their analytic strategies into using their given CAQDAS.
Conclusion
Newcomers to the world of social research and CAQDAS may be understandably overwhelmed by the number of methods and software they can choose, and even experienced researchers may have grown frustrated or disillusioned with CAQDAS and thus abandoned it. Instructors, teachers, or professors of CAQDAS similarly may face the challenge of familiarising students with the features of the software while showing how these features can be translated into specific qualitative analysis strategies. This article provides a concrete outline of an adaptable analysis approach and integrates practical advice for using CAQDAS by following specific analytic strategies to illustrate how CAQDAS can support sociological thinking. We also briefly considered the strengths and weaknesses of each software for the different analysis cycles. This article thus allows researchers and educators to gain a global overview of all three CAQDAS and make better-informed decisions about which one to use and how to integrate it with QDA methods.
With increasing digitalisation and online work, CAQDAS use is only going to continue growing, and this article can help lighten novices’ burdens with learning the ropes of qualitative research and CAQDAS. Furthermore, CAQDAS skills will likely prove beneficial for sociologists’ careers as they collaborate in online research. These practical guidelines can thus help make CAQDAS more accessible for qualitative researchers everywhere, and by illustrating three major CAQDAS packages, readers can gain a bird’s eye view of the similarities and nuances of different CAQDAS options. With the advent of universal project exchange formats, a global familiarity with different CAQDAS may likewise benefit researchers’ future work with others. Ultimately, though, using CAQDAS to facilitate rigorous research necessitates methodologically sound applications of the software’s tools and features. With these foundational guidelines, we wish to empower novice researchers to understand qualitative research, make sense of nuanced details, use CAQDAS with intentionality, and foster a thoughtfulness throughout the research process. By bridging the gap between CAQDAS and qualitative methodology, social science researchers and educators can provide important contributions to understanding and thriving in our ever-changing world.
Footnotes
Funding
The author(s) received no financial support for the research, authorship, and/or publication of this article.