



Abstract
Autism spectrum disorder (ASD) symptoms are present in unaffected relatives and individuals from the general population. Results are inconclusive, however, on whether unaffected relatives have higher levels of quantitative autism traits (QAT) or not. This might be due to differences in research populations, because behavioral data and molecular genetic research suggest that the genetic etiology of ASD is different in multiplex and simplex families. We compared 117 unaffected siblings and 276 parents of at least one child with ASD with 280 children and 595 adults from the general population on the presence of QAT using the Social Responsiveness Scale (SRS). Mean SRS scores for siblings, control children, parents and control adults were 25.4, 26.6, 33.7 and 32.9. Fathers of children with ASD showed significantly higher levels of QAT than controls, but siblings and mothers did not. We could not detect a statistically significant difference in SRS scores between relatives from simplex and multiplex families. These results do not support the theory of differential (genetic) etiology in multiplex and simplex families and suggest that a carried genetic risk is generally not expressed phenotypically in most relatives, except in fathers.
Introduction
Autism spectrum disorders (ASDs) are a spectrum of developmental disorders characterized by impairments in reciprocal social interaction and communication and by stereotypical patterns of behavior and interests (World Health Organization, 1993; American Psychiatric Association, 2000). Twin studies have led to the acknowledgement of the genetic etiology of ASD, but have also demonstrated that the genetic risk factors for ASD extend beyond the classical diagnostic boundaries (Folstein and Rutter, 1977; Bailey et al., 1995). The presence of ASD-like features in family members, the ‘Broader Autism Phenotype’ (BAP), has been studied extensively (Piven et al., 1997; Bolton et al., 1998; Szatmari et al., 2000). The results supported the hypothesis of the (poly)genic background of ASD (Abrahams and Geschwind, 2008), with unaffected relatives of an individual with ASD sharing a part of the genetic risk resulting in the BAP. Differences in the presence of the BAP have been found between multiple incidence (MPX) and single incidence (SPX) families, however (Szatmari et al., 2000; Bölte and Poustka, 2003; Constantino et al., 2006; Losh et al., 2008; Virkud et al., 2009; Constantino et al., 2010; Schwichtenberg et al., 2010), suggesting a differential genetic etiology for ASD between these family types. Molecular genetic research supports this hypothesis: in SPX families more de novo mutations with large effect and high penetrance are found to cause ASD (Sebat et al., 2007; Marshall et al., 2008) than in MPX families. In MPX families ASD might be the result of either the transmission of large effect variants by one of the parents – mostly the mother, in whom penetrance of that genetic variation is hypothesized to be smaller – to their children (Zhao et al., 2007) or an additive genetic effect of variants with small effect, inherited from one or both parents (Abrahams and Geschwind, 2008).
In recent research, using questionnaires that measure ASD traits in a quantitative way, it became clear that quantitative autism traits (QAT) 1 are not only present in individuals with ASD and their relatives, but also in the general population (Baron-Cohen et al., 2001; Constantino and Todd, 2003; Ronald et al., 2006), suggesting a continuum from almost no ASD traits to high scores in autistic disorder. If the polygenic theory regarding ASD is correct, unaffected family members of an individual with ASD should present with more QAT than general population controls, and more so in MPX than in SPX families. Table 1 gives an overview of questionnaire-based research on this topic. Although the majority of results are in favor of the hypothesized differences in QAT, some caution about the conclusions is still warranted, because some authors have presented (partly) negative results, and a publication bias might have prohibited other negative results from being published.
Recent literature on quantitative autism traits in first degree relatives of children with ASD
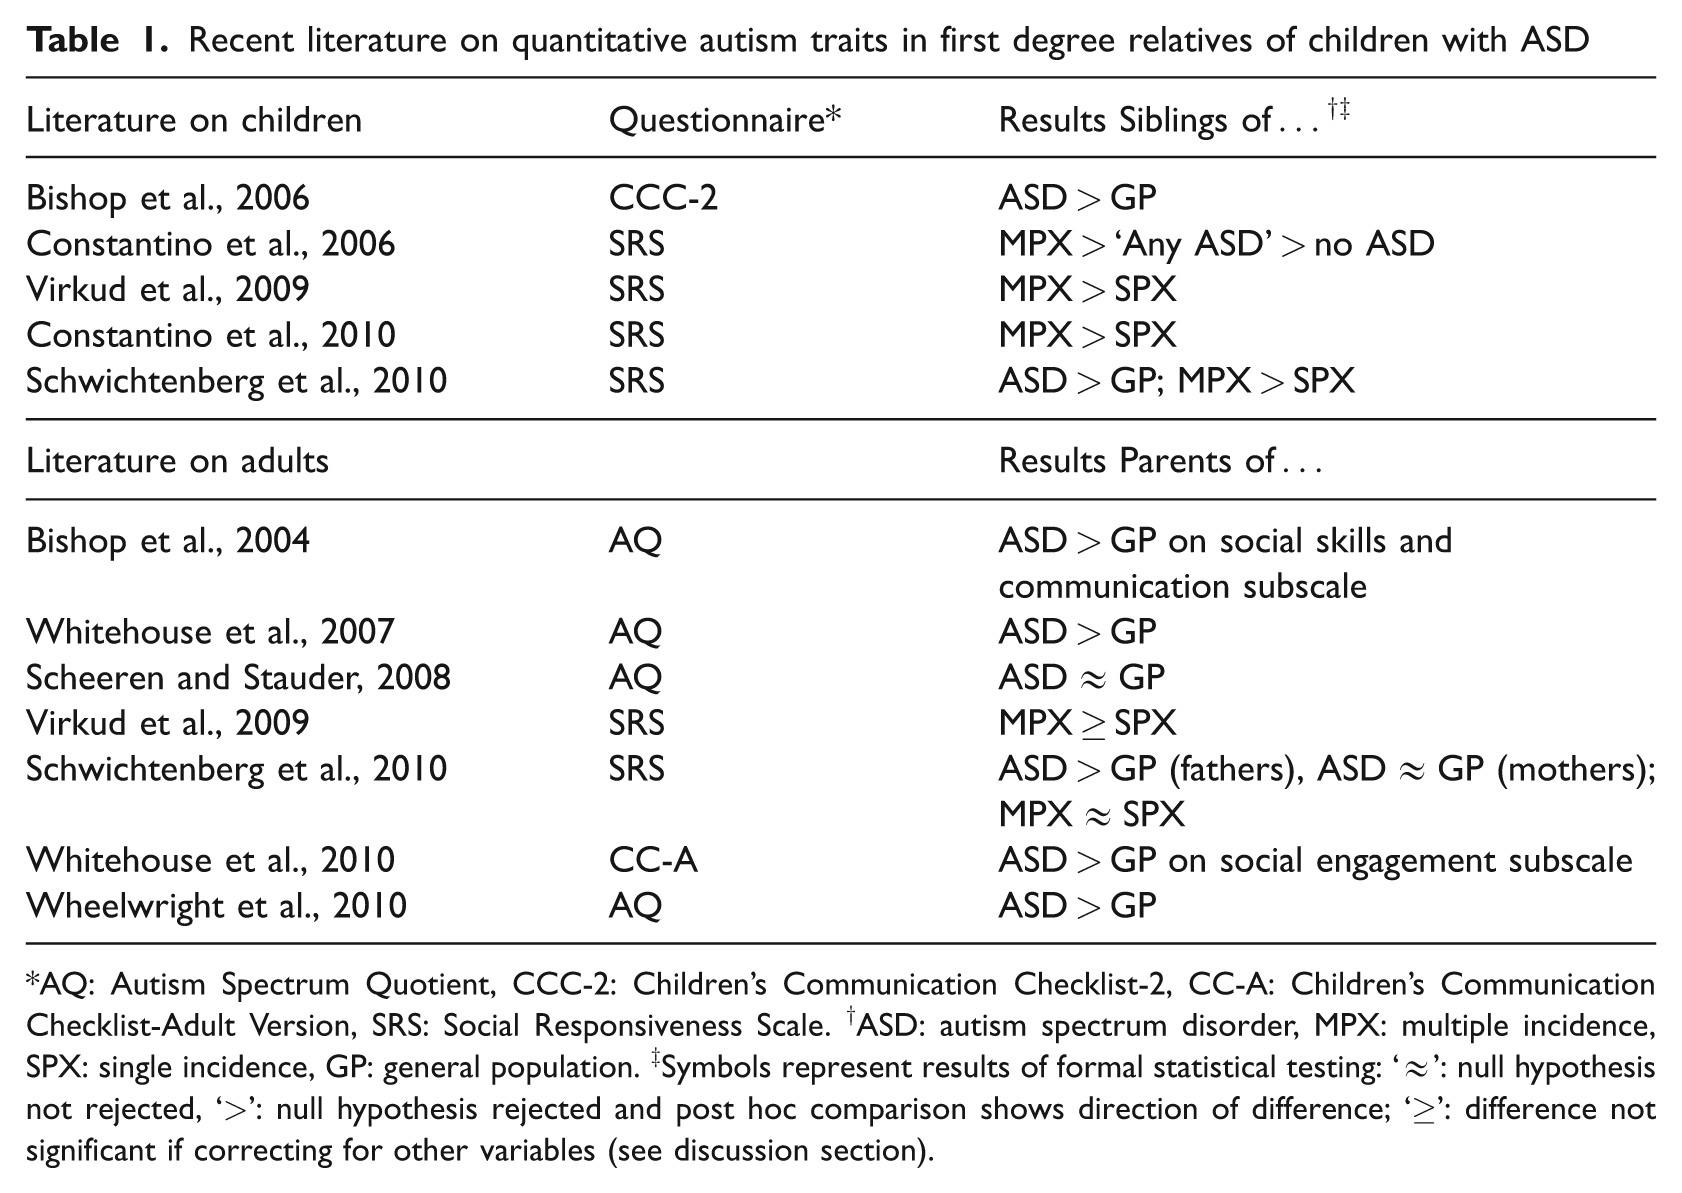
AQ: Autism Spectrum Quotient, CCC-2: Children’s Communication Checklist-2, CC-A: Children’s Communication Checklist-Adult Version, SRS: Social Responsiveness Scale. †ASD: autism spectrum disorder, MPX: multiple incidence, SPX: single incidence, GP: general population. ‡Symbols represent results of formal statistical testing: ‘≈’: null hypothesis not rejected, ‘>’: null hypothesis rejected and post hoc comparison shows direction of difference; ‘≥’: difference not significant if correcting for other variables (see discussion section).
Aims of the study
In this report, we will focus on two research questions: 1) do unaffected siblings and parents of children with ASD show more QAT than general population controls and 2) do unaffected relatives from MPX families show more QAT than unaffected relatives from SPX families?
Methods
Research population
Children with ASD, their siblings and parents
The children with ASD and siblings of children with ASD are participants of a larger family study of Leuven Autism Research. Families with at least one child 4 years of age or older with ASD, known to the University Hospitals Leuven, were randomly contacted (by mail and/or by telephone) to participate in the family study. We asked all children with ASD and their parents and unaffected siblings to participate. Diagnoses of ASD were primarily made by multidisciplinary teams (child psychiatrist and/or expert neuro-paediatrician, psychologist, speech/language therapist and/or physiotherapist) in a standardized way according to DSM-IV-TR (American Psychiatric Association, 2000) criteria. For all children, the Developmental, Dimensional and Diagnostic Interview (3di) (Skuse et al., 2004) was administered with parents with two purposes: supporting the clinical diagnosis and gathering quantitative data on different developmental domains for further research. Besides the 3di on all children, we asked parents to fill out the Social Responsiveness Scale (SRS) (Constantino and Gruber, 2005) about their children under 18 years old. We also asked them to have an adult SRS filled out about themselves by their partner or another close relative. A total of 159 families consented to take part in this study. We included only children under 18 years of age because this is the upper age of the children’s version of the SRS, which led to the exclusion of 39 adult siblings. We also excluded seven half-siblings. Because the SRS is validated for children with normal intelligence and the control sample consists of children from regular schools, we excluded 35 children with an intellectual disability (full scale IQ < 70). In some families parents reported a child to have ASD, which could not be confirmed by either the 3di or a review of their clinical files by an expert clinician. These children were excluded from the analyses. For all participants we received written informed consent. This study was approved by the Medical Ethical Committee of the University Hospitals Leuven.
General population controls
Parents of children between 4 and 18 years of age were contacted via regular schools across Flanders, by researchers of Ghent University, Belgium (H. Roeyers and colleagues). After informed consent, parents filled out the SRS about their child. Adults from the Netherlands and Flanders were contacted partly by email and partly by mail by researchers of the University of Leiden, the Netherlands (author ES). After informed consent adults filled out the SRS about their partners online or on paper. Both samples are part of ongoing research to validate the Dutch versions of the SRS.
Adults with ASD
The adults with ASD in this research were contacted for the validation of the Dutch SRS. They were all diagnosed by a multidisciplinary team in the ASD Reference Centre of Leuven or Antwerp. They all gave written informed consent for the use of their questionnaire data for scientific research.
Total sample
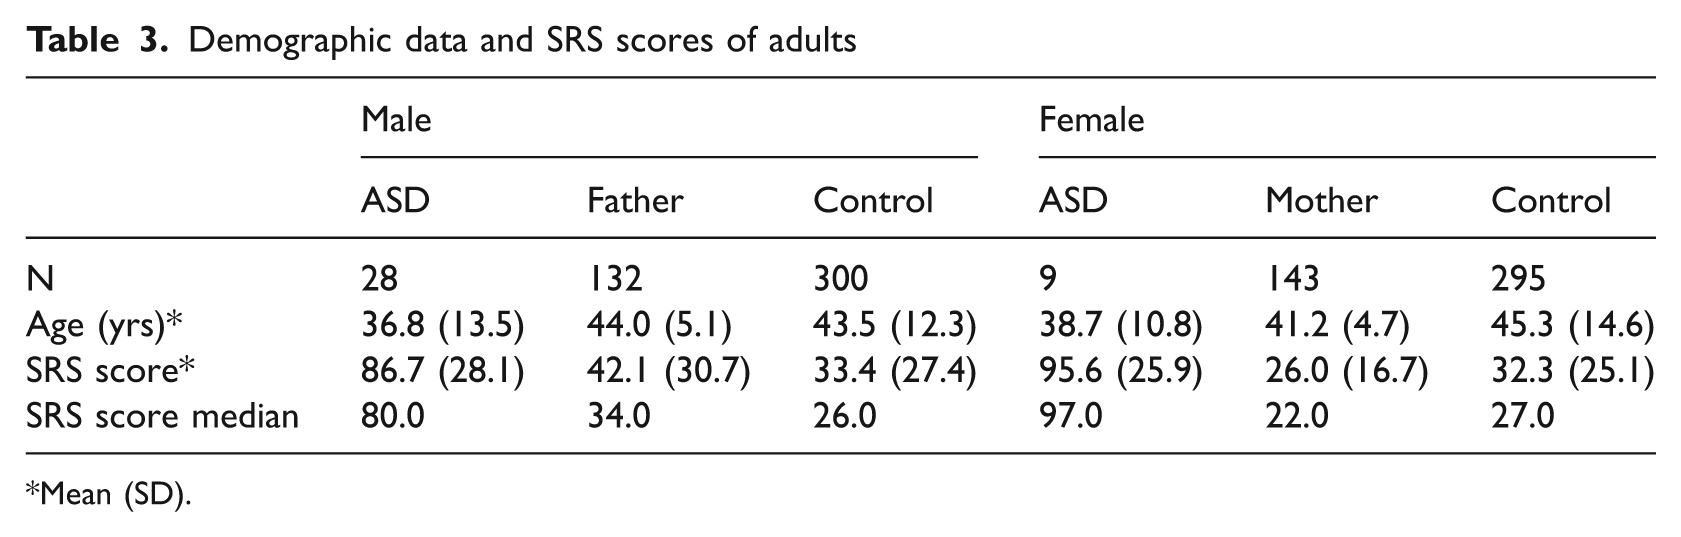
For our analyses we accepted a maximum of two missing items on the SRS. Missing items were substituted by the individual’s mean item score. The final research sample consisted of 145 boys and 41 girls with ASD, 117 unaffected siblings (39 boys, 78 girls) and 100 boys and 180 girls from the general population. Of the 186 children with a clinical diagnosis of ASD, 131 (70%) met criteria of ASD on the 3di. The final adult sample consisted of 132 fathers and 143 mothers of an individual with ASD, 300 men and 295 women from the general population, and 28 men and 9 women with ASD. See Table 2 and Table 3 for more details on the research population. Families were classified to be SPX or MPX on the basis of the number of family members with a clinical diagnosis of ASD. For a family to be SPX, there had to be just one individual with ASD and at least one other child without ASD in the family. Singleton families were therefore excluded from these analyses. MPX families had at least two individuals with ASD. Families in which we excluded children because of an uncertain ASD diagnosis could not be classified SPX or MPX. Therefore, they were excluded from the analyses on the difference in SRS scores between MPX and SPX families.
Demographic data and SRS scores of children

Mean (SD); †based on the data of the 96 boys and 26 girls of whom Wechsler Intelligence Scales scores were available in their clinical files.
Demographic data and SRS scores of adults
Mean (SD).
Instruments
Social Responsiveness Scale
The SRS (Constantino and Gruber, 2005) is a 65-item questionnaire developed to assess a wide range of interpersonal behavior, communication and repetitive/stereotypic behavior characteristic of ASD. Each item has to be scored by a parent or caregiver on a 4-point scale ranging from ‘not true’ to ‘almost always true’, the raw total score ranging from 0 to 195, with higher scores indicating more ASD traits. Although five theory-based subscales can be calculated, factor analysis showed only one principal factor. The manual provides T-scores for clinical use, with T = 60 being the proposed cut-off for clinically significant ASD traits, but in research the raw total score is almost always used. The original children’s version (4 to 18 years) has proven to be a reliable and valid scale, with good psychometric properties, good discriminant validity, and good agreement with the Autism Diagnostic Interview-Revised (Lord et al., 1994). The total SRS score is unrelated to IQ in a sample with normal intelligence, and it is moderately to highly heritable. The adult version of the SRS corresponds item-to-item to the children’s version, but the wording and content have been modified to be more developmentally appropriate for adults. This version also has good internal consistency (Constantino and Todd, 2005).
Developmental, Dimensional and Diagnostic Interview
The 3di (Skuse et al., 2004) is a computerized semi-structured interview administered with parents or caregivers about their children. It consists of questions about the three main domains of ASD (resulting in a diagnostic algorithm) and about other domains of development and general functioning (including biological functions and co-occurring psychiatric disorders). Test-retest and inter-rater reliability were high (Intra Class Correlations higher than .86 for the subscales and the individual items). Agreement with ICD-10-classification (World Health Organization, 1993) and Autism Diagnostic Interview-Revised (Lord et al., 1994) was very good.
Statistical analysis
We used the statistical package SAS 9.2 for all analyses. The SRS scores were log-transformed (logSRS) for our analyses after residual analysis based on linear (mixed) models. Because our main research questions focused on the difference between unaffected siblings and controls, and because the difference in SRS scores between ASD and both other groups is obvious without statistical testing, we did not enter the ASD group into the analyses. In all analyses we used a significance level of α = .05.
Results
Children
Mean SRS scores of children with ASD, the unaffected siblings and the control group are presented in Table 2. For the distribution of SRS scores see Figure 1. We constructed a mixed model with logSRS as the dependent variable, group (siblings, controls), age, gender and all two-way interactions as fixed factors, and family as a random factor, to account for dependency of observations as mostly more than one child per family participated in this study. Age was entered in the analyses as a continuous measure because there was a trend towards a statistical difference in age between siblings and controls (unpaired t-test, t = 1.9, p = .06).

Distribution (percentage) of SRS scores.
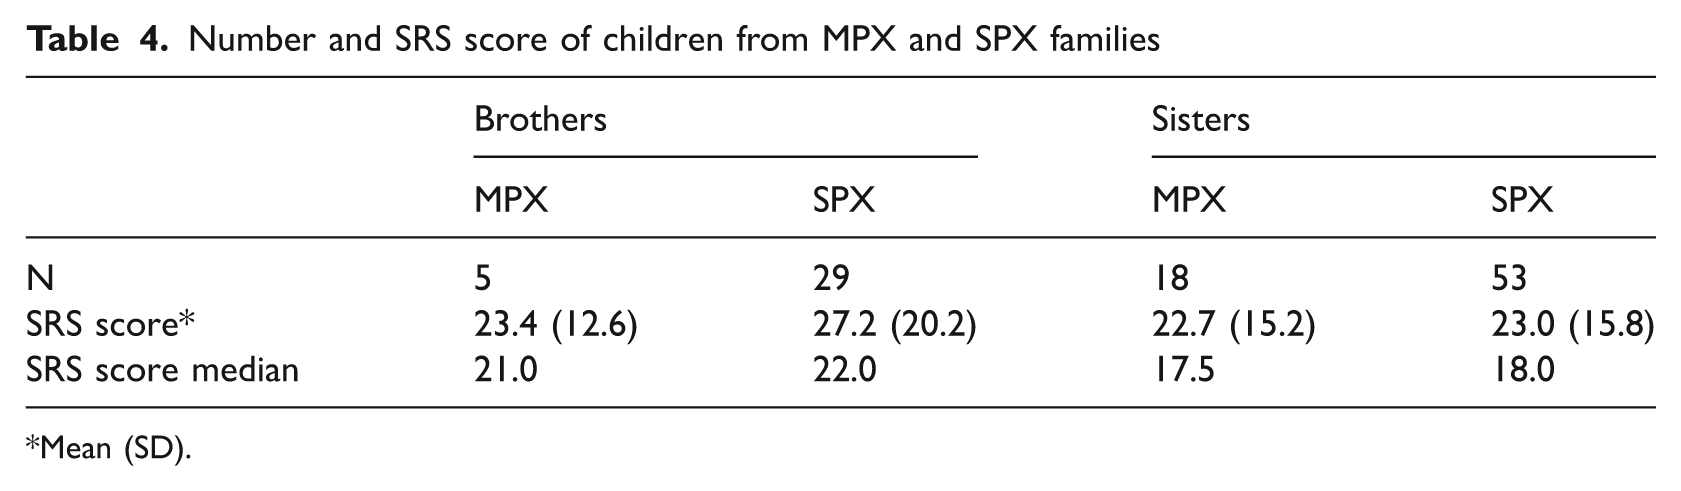
We reduced the model by removing statistically non-significant effects using the likelihood ratio test. The p-value for the gender by group interaction was .07, indicating no evident effect on logSRS. No significant difference in logSRS was found between siblings and control children, and no significant difference was found for for boys and girls separately. For the analyses of the difference between SRS scores of siblings of MPX and SPX families (Table 4), we constructed a mixed model with gender, age, family type (SPX or MPX) and all two-way interactions as fixed factors, and family nested in family type (SPX or MPX) as a random factor. After model reduction using the likelihood ratio test, family type did not have a statistically significant effect on logSRS. We can conclude that there is no difference in SRS scores between unaffected siblings of MPX and SPX families in our sample. Because of the small sample size of unaffected brothers in MPX families, the results in boys should be interpreted with caution.
Number and SRS score of children from MPX and SPX families
Mean (SD).
Adults
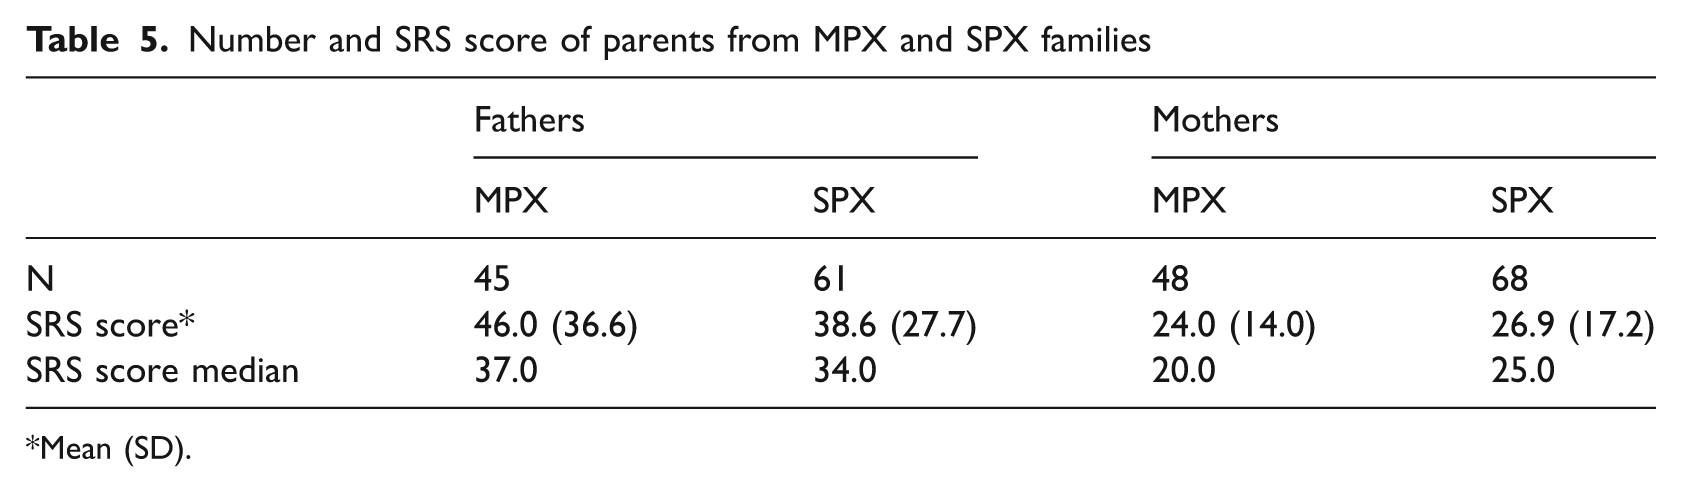
See Table 3 for the summary statistics of the SRS scores of adults with ASD, the parents of children with ASD and the control adults and Figure 1 for the distribution of raw SRS scores. For the adults, we performed almost the same analyses as for the children, but because we did not have to account for the family of origin, only fixed effect models were constructed. In our linear model, age, gender and the interaction between gender and group (parent or control) appeared to be significant moderators of logSRS (all p < .01). Post-hoc Tukey-Kramer comparisons revealed that there was only a significant difference between fathers and male controls (p = .014) and not between mothers and women from the control population (p = .86). In a subsequent analysis, we constructed a linear model with family type (MPX, SPX or control) instead of group (parent or control). Table 5 shows the mean and median SRS scores for parents from MPX and SPX families. The effect of family type was tested within each level of gender. Only in men was family type a significant contributor for logSRS (p = .03). In post-hoc Tukey-Kramer comparisons, the difference between fathers from MPX families and male controls was border significant (p = .05), whereas no statistical differences were found between MPX fathers and SPX fathers and SPX fathers and male controls (Figure 2).
Number and SRS score of parents from MPX and SPX families
Mean (SD).

SRS scores of MPX, SPX and control adults (mean, 95% Confidence interval of the mean).
Discussion
Children
In this study we compared the total SRS scores of children with ASD, their unaffected siblings and typically developing children, all between 4 and 18 years old. The SRS scores of the unaffected siblings did not differ from the SRS scores of the general population controls. We also could not detect a difference in QAT between unaffected siblings of MPX families and unaffected siblings of SPX families, although given the small sample size this result in boys should be interpreted with caution.
Our results partly replicate the results of Schwichtenberg et al. (2010) but contrast with several other studies using questionnaires to measure the presence of QAT in first degree family members (Bishop et al., 2006; Constantino et al., 2006; Virkud et al., 2009; Constantino et al., 2010; Schwichtenberg et al., 2010). In Constantino et al.’s (2006) study a difference in SRS score appeared between the closest-in-age ‘non-autistic brothers’ in MPX families (based on strict criteria of autistic disorder) and the closest-in-age brothers of children with ‘any ASD’ (autistic disorder, Asperger’s syndrome or pervasive developmental disorder not otherwise specified). Given that the authors clearly state that the brothers in the MPX families are ‘non-autistic’, but do not state this for the ‘any ASD’ group, it is possible that some of those closest-in-age brothers in the latter group had (undiagnosed) ASD, especially because it is not certain whether these are all SPX families. Schwichtenberg et al. (2010) studied the difference in SRS scores between ‘additional’ siblings (as opposed to ‘probands’) of SPX and MPX families. Given that the authors do not clearly state that all those ‘additional’ siblings are unaffected, it is possible that some of them have (undiagnosed) ASD, especially in the MPX families in which the proband was ‘the oldest child with an ASD’ (p.1022).
Virkud et al. (2009) reported a significant difference in SRS scores between children with an SRS score below the clinical severity threshold (60T) from MPX families and children from SPX families. If we define our MPX and SPX samples the same way and carry out a similar mixed model as in our main analyses, the results also reveal a significant difference between MPX and SPX children (p = .03 for the effect of family type). These results can be explained by the fact that nine (eight boys, one girl) of the 30 children from MPX families were diagnosed with ASD compared with only five (all boys) of the 77 children from SPX families. After exclusion of the boys with ASD from their analyses, the difference between SPX and MPX also became non-significant (p = .07) in Virkud et al.’s (2009) paper, consistent with our results. We agree with Hoekstra and Wheelwright (2010) that this kind of analyses should focus only on proven unaffected siblings. Because we have 3di data on all siblings and clinically assessed almost all suspected cases, the number of children with undiagnosed ASD in our sample should be very low.
Comparing with the SRS score distribution of unaffected siblings in the paper of Constantino et al. (2010) and of the additional siblings in the paper of Schwichtenberg et al. (2010), in our MPX sample we seem to lack a number of unaffected siblings with relatively high SRS scores. A closer look at our own data shows that the group of children we excluded because their diagnoses, as originally stated by the parents, could not be confirmed by either the 3di nor a revision of their clinical files, matches this ‘missing’ group (Figure 3). These children had come to clinical attention because of social, emotional and behavioral problems and in a clinical assessment they appeared to have impairments on the core domains of ASD, resulting in a clinical diagnosis at that time. Therefore, it is difficult to say that these children are unaffected, simply because they do not meet the scientific inclusion criteria for our study at the time of recruitment. This, again, raises the question about what effort should be made by researchers to clinically assess all siblings in this kind of family study, or to what extent one can rely on earlier clinical judgement, as reported by parents. A possible explanation for the fact that earlier diagnoses could not be confirmed at the moment of recruitment is that clinicians relied more on the impact on daily functioning of the impairments in the ASD domains than on the number of diagnostic criteria met, mirroring the unclear criteria of the ‘pervasive developmental disorder not otherwise specified’ classification. This issue might be resolved in DSM-V, where there will be only one ASD classification.

SRS scores of boys in MPX families (Noconf = clinical diagnosis not confirmed for research (see text)).
One major finding that Constantino et al.’s (2010) and Schwichtenberg et al.’s (2010) results have in common with our results is the very low prevalence of unaffected boys in MPX families, underpinning the high (genetic) risk for ASD for boys in MPX families.
Adults
In adults we demonstrated a significant difference in SRS scores between fathers of children with ASD and men from the general population. Subsequent analyses showed that this difference was mostly driven by fathers from MPX families. In women we could not detect a difference in QAT between mothers of children with ASD and controls. Interestingly, during the course of the study, four fathers from this sample reported to be diagnosed with ASD themselves. Even after exclusion of these fathers from the analyses, the post-hoc difference between fathers and controls remained significant (p = .03).
Our study replicates the results in adults of Schwichtenberg et al. (2010). Bishop et al. (2004) concluded that parents of children with ASD had higher scores on the social skills and communication subscales of the Autism Spectrum Quotient (AQ), but they did not examine whether these general results applied to fathers and mothers separately. Wheelwright et al. (2010) reported significantly higher AQ scores in both fathers and mothers of children with ASD than in control parents. However, the AQ is a self-report questionnaire; we used an informant report SRS, which might negatively influence the comparability. Preliminary data of our research group show that the mothers in our sample received significantly lower scores on the partner-report SRS than on a newly developed self-report version of the questionnaire (whereas in men, the significant difference was in the other direction) (data not shown). It is currently unknown whether this would also apply to women without a family history of ASD. The familiarity with ASD symptoms might influence the results of self-report questionnaires, especially in a context of research that focuses on the etiology of ASD and the presence of ASD-like features in unaffected relatives.
We could not detect a difference in the presence of QAT between MPX and SPX fathers, nor between MPX and SPX mothers. This is consistent with Virkud et al.’s (2009) findings: although raw total SRS scores differed significantly between fathers from MPX and fathers from SPX families in their study, this difference was significant only at a trend level (p = .07) after controlling for age, educational level and average SRS score of the proband.
Although Bölte et al. (2007) focused on personality style (e.g. reserved/schizoid), which is not directly comparable to the focus of our research, our results do replicate their findings in one way, in that they did not find differences in their measures of the BAP between parents of MPX and parents of SPX ASD families.
It is unclear to what extent our results do or do not replicate studies that found differences in BAP between MPX and SPX families using other methodologies (e.g. the Family History Interview (Szatmari et al., 2000) or tests to assess facial affect recognition (Bölte and Poustka, 2003)), because these studies did not differentiate between parents and siblings.
Limitations
First, some remarks can be made about the clinical sample: children with intellectual disabilities were excluded, and only 26 of the 186 (14%) children with a clinical diagnosis of ASD met the full criteria for autistic disorder on the 3di, which is a smaller proportion than in all other studies outlined above. It can also be seen as a strength, because our sample is therefore more representative of the whole ASD spectrum. Little is known, however, about the extent to which these proband characteristics would influence the level of QAT in their first degree relatives. Second, we used only parent-report questionnaires and interviews for our analyses in children. Parents may accentuate the differences between their children with ASD and their unaffected children, increasing the contrast between high and low scores, similar to the contrast effects that were reported in temperament research (Majdandzic et al., 2008). Teacher reports could overcome this problem, but we were unable to collect teacher report SRS forms from the general population sample. For several reasons the number of useful teacher report forms was too small to analyse the difference between siblings from MPX and SPX families. We acknowledge that this possible contrast effect might have influenced the results of our first research question in children, but not in adults. To our knowledge nothing is known about a differential contrast effect between MPX and SPX families, so we can assume that parent report has not influenced the results of our second research question.
Conclusion
Our results confirm the presence of higher levels of QAT in fathers of children with ASD, but not in mothers or unaffected siblings. There was also no difference in the presence of QAT between unaffected relatives of MPX families and those of SPX families. Therefore our findings do not support the theory of differential (genetic) etiology in MPX and SPX families and suggest that a carried genetic risk is generally not expressed phenotypically in most relatives, except in fathers. We argue that it is important in future studies to give adequate information about the diagnostic status of the relatives that are focus of the research question, because this might be the reason for the inconsistencies between different research results. Another important issue in ASD family research is the differentiation between MPX and SPX families, if such a difference really exists. We argue that one can categorize a family to either SPX or MPX only after thorough examination of all family members. But the definition would still be debatable: what would have happened if there had been one additional child? Further genetic and phenotypic research is needed to elucidate this hypothetical difference between SPX and MPX families and on how to define the difference.
Footnotes
Acknowledgements
We would like to thank all families whose participation made this study possible; H. Roeyers and colleagues of the Ghent University for the normative SRS data; V. Stevens and C. Aerts for the many interviews and help in the inclusion of families; V. Stevens for reviewing all clinical files; and all students for the accurate data entry.
This work was supported by the Research Foundation Flanders, FWO (grant number G.0609.07 to JS; JL is a Postdoctoral Fellow of the FWO) and by a grant from the Research Council of the K.U. Leuven (IDO/08/013) to JS and IN. Hogrefe Uitgeverij Nederland supported the gathering of SRS data in the general population.
Authors WD, IN, ES and JS receive royalties from Hogrefe Uitgeverij (not for the questionnaires used in this research).