




Abstract
The autism spectrum disorder phenotype varies by social and communication ability and co-occurring developmental, behavioral, and medical conditions. Etiology is also diverse, with myriad potential genetic origins and environmental risk factors. Examining the influence of parental broader autism phenotype—a set of sub-clinical characteristics of autism spectrum disorder—on child autism spectrum disorder phenotypes may help reduce heterogeneity in potential genetic predisposition for autism spectrum disorder. We assessed the associations between parental broader autism phenotype and child phenotype among children of age 30–68 months enrolled in the Study to Explore Early Development (N = 707). Child autism spectrum disorder phenotype was defined by a replication of latent classes derived from multiple developmental and behavioral measures: Mild Language Delay with Cognitive Rigidity, Mild Language and Motor Delay with Dysregulation (e.g. anxiety/depression), General Developmental Delay, and Significant Developmental Delay with Repetitive Motor Behaviors. Scores on the Social Responsiveness Scale-Adult measured parent broader autism phenotype. Broader autism phenotype in at least one parent was associated with a child having increased odds of being classified as mild language and motor delay with dysregulation compared to significant developmental delay with repetitive motor behaviors (odds ratio: 2.44; 95% confidence interval: 1.16, 5.09). Children of parents with broader autism phenotype were more likely to have a phenotype qualitatively similar to broader autism phenotype presentation; this may have implications for etiologic research.
Autism spectrum disorder (ASD), defined by impairment in social communication and social interaction as well as repetitive and restricted behaviors and interests (American Psychiatric Association, 2013), is heterogeneous in phenotype and genotype (American Psychiatric Association, 2013; An and Claudianos, 2016; Lai et al., 2014; Miles, 2011). Individuals with ASD have a broad range of adaptive functioning, intellectual development, verbal ability, co-occurring conditions, and varying presentation of other diagnostic or associated features (American Psychiatric Association, 2013; Lai et al., 2014; Levy et al., 2010). Potential genetic contributions explain up to 83% of the variance in ASD in the population with potential genetic mechanisms including chromosomal abnormalities, rare inherited genes, copy number variants, and rare penetrant genes (De la Torre-Ubieta et al., 2016; Gaugler et al., 2014; Sandin et al., 2017). Other potential etiologic mechanisms for ASD include epigenetic changes, environmental factors like preterm birth or air pollution, and combined effects of genetic and environmental factors (Lyall et al., 2016). The myriad potential causes and presentations of ASD create challenges when trying to understand how etiologic origin is associated with the development and presentation of ASD (An and Claudianos, 2016; Georgiades et al., 2013; Koegel et al., 2014; Lai et al., 2013; Miles, 2011).
Defining and assessing distinct homogeneous ASD phenotypic subgroups, rather than simply assessing all ASD cases as a single outcome, might enhance the ability to detect etiologic associations and elucidate developmental trajectories (Lai et al., 2013; Landa et al., 2012; Veatch et al., 2014). Data-driven techniques like cluster analysis and latent class analysis (LCA) partition children into meaningful subgroups based on similar responses to observed data and allow different types of variables to be included in analytic models. Thus, data-driven techniques might enhance subgrouping to include a broader range of variables that help define phenotypic groups (Cholemkery et al., 2016; Georgiades et al., 2013, 2014; Munson et al., 2008; Veatch et al., 2014). Indeed, using LCA generated from a variety of behavioral, developmental, and medical symptoms, Wiggins et al. (2017) found four distinct classes of preschool children with ASD that highlighted the influence of co-occurring conditions on phenotypic presentation. The presence of these conditions within the autism spectrum may be a better indicator of shared etiology and brain dysfunction than assessing core ASD domains alone (Lai et al., 2013; Waterhouse and Gillberg, 2014; Wiggins et al., 2017).
Since a large portion of ASD genetic liability in the population can be attributed to both common variation (minor allele frequencies of genetic variants present in >5% of a population; Guthery et al., 2007) and intergenerational transmission (Gaugler et al., 2014; Sandin et al., 2017; Yip et al., 2017), exploring how autism traits congregate in families may improve our ability to identify specific causal genetic mechanisms. In families of children with ASD, the presence of sub-clinical ASD characteristics is commonly referred to as the broader autism phenotype (BAP; Bolton et al., 1994). Common features of BAP include pragmatic difficulties, broadly defined communication difficulties, poor social skills, cognitive rigidity, anxiety, and aloofness (Sucksmith et al., 2011). This congregation of ASD-like traits is significantly more prevalent among parents and relatives of probands with ASD compared to families of typically developing children or families of children with Down’s syndrome (Bolton et al., 1994; Bora et al., 2016; De la Marche et al., 2012; Lyall et al., 2014; Maxwell et al., 2013; Piven et al., 1994; Sasson et al., 2014, 2013b; Schwichtenberg et al., 2010; Seidman et al., 2012). In addition, BAP is heritable (Sucksmith et al., 2011), with a study by Robinson et al. (2011) finding sub-diagnostic autism traits to have a similar level of heritability as ASD. Features of BAP may therefore represent an endophenotype: a measurable phenotypic trait that is heritable, state independent, co-segregates in families, and found in higher rates in relatives of probands than in the general population (Gottesman and Gould, 2003; Gould and Gottesman, 2006). As such, considering BAP as an endophenotype in etiologic research may increase the efficiency of linkage analyses, genome-wide association studies, or other techniques that look for specific causal genes, common variants, and single nucleotide polymorphisms (Alarcon et al., 2005; Butler et al., 2005; Connolly et al., 2013; Flint and Munafo, 2007; Francis et al., 2016; Hall and Smoller, 2010; Liu et al., 2008; Losh and Piven, 2007; Lowe et al., 2015). Furthermore, evaluating the association between BAP and empirically derived phenotypic subgroups of ASD may further our ability to find meaningful endophenotypes through reducing heterogeneity in phenotype, which will allow for improved efficiency when exploring potentially causal common genetic variants.
We evaluated the association between parental BAP and child ASD phenotype subgroups defined by multiple behavioral and health-related constructs using a large US community-based study. In addition, we explored whether these associations differed by which parent had BAP and whether the child’s sex affected the relationship between parental BAP and child class.
Methods
This study used data from Phase 1 of the Study to Explore Early Development (SEED), a community-based case-control study designed to better understand ASD etiology and phenotypic presentation (Schendel et al., 2012). Six sites (California, Colorado, Georgia, Maryland, North Carolina, and Pennsylvania) collected data on maternal pregnancy and health history, child developmental history, and other familial data for children between the ages of 30 and 68 months between 2007 and 2012. Children had to have been born in a study catchment area, lived there at time of first enrollment, and had a caregiver who could provide legal consent for participation (Schendel et al., 2012). Children were identified and recruited through educational or medical providers who served children with ASD and other developmental disorders or delays. A population comparison group was recruited through random sampling of birth certificates. This analysis was restricted to children with confirmed ASD. Each study sites Institutional Review Board approved data collection, and the University of North Carolina Institutional Review Board approved this secondary analysis.
ASD confirmation
Children were screened for ASD using the Social Communication Questionnaire upon study entry. If a child screened positive (scored ⩾ 11 to maximize case finding (Wiggins et al., 2007)), had a past diagnosis of ASD, or was suspected by a study clinician to have ASD during the initial developmental assessment, the child underwent a full ASD evaluation. Clinicians who had established research reliability evaluated the child for ASD using the Autism Diagnostic Observation Schedule-2 (ADOS) (Lord et al., 2012) and completed the Autism Diagnostic Interview-Revised (ADI-R) (Rutter et al., 2003) with the caregiver. Final case status was determined through a SEED-derived algorithm using scores from the ADOS and the ADI-R (Wiggins et al., 2015). SEED clinicians also administered the Mullen Scales of Early Learning (Mullen, 1995), which provided information on expressive and receptive language, visual reception, and motor development. Additional phenotypic and demographic descriptions were provided through the caregiver’s completion of the Child Behavior Checklist (Achenbach, 1992), other questionnaires and interviews, and the child’s birth certificate.
For this analysis, siblings of children who were already enrolled were excluded because their inclusion may introduce violation of our assumption of independence between observations. When evaluating associations with parental BAP, our inferences are only applicable to children who had BAP measures completed for their biological mother and father.
Parent BAP measurement
BAP was measured using the informant-reported Social Responsiveness Scale-Adult (SRS-A), a 65-item Likert-type scale questionnaire (Constantino and Todd, 2005). Although not specifically designed to measure BAP, the SRS-A has shown good consistency with other BAP and quantitative autistic trait measures and is commonly used to measure BAP in adults (Gerdts and Bernier, 2011; Ingersoll et al., 2011; Nishiyama et al., 2014). The SRS-A has strong internal validity, exhibiting a Cronbach’s alpha internal consistency coefficient of 0.95 (Constantino and Todd, 2005; Ingersoll et al., 2011) and has been shown to be independent of the subject’s IQ and age, and not impacted by the informant’s education level (Constantino, 2002; Constantino et al., 2009, 2015; Constantino and Todd, 2005). In addition, results on the SRS-A are not associated with the subject’s race or ethnicity, or the identity of the informant (Constantino and Gruber, 2012).
Each parent was asked to have a friend, spouse, or relative complete the SRS-A on the parent and then return it to SEED. Scores were tabulated based on whether responses indicated social abnormality, with higher scores indicating greater social abnormality. These overall scores were standardized to create T-scores, which were normed using a standard population to have a mean of 50 and a standard deviation of 10. For this study, we used the standard “mild range” recommendation of a T-score ⩾ 60 to classify a parent as having BAP (BAP+) (Constantino, 2002). In addition, we categorized BAP by parental combination: mother and father were BAP+, father only was BAP+, mother only was BAP+, or both parents did not have BAP (BAP−).
Creating child phenotypic classes
We first used an extended LCA to create ASD phenotypic classes based on all ASD cases in SEED, replicating the work of Wiggins et al. (2017) who previously created latent classes in these data using the same methodology. LCA assumes that there are unobservable subpopulations, often associated with certain patterns of observable data, within the larger study population (Hagenaars and McCutcheon, 2002). For each individual, an LCA model provides probabilities of being in each class based on their observed outcome variables. While standard LCA models use only categorical observed variables, an extended LCA model allows for use of continuous, dichotomous, and categorical variables to estimate and explore any potential underlying latent classes.
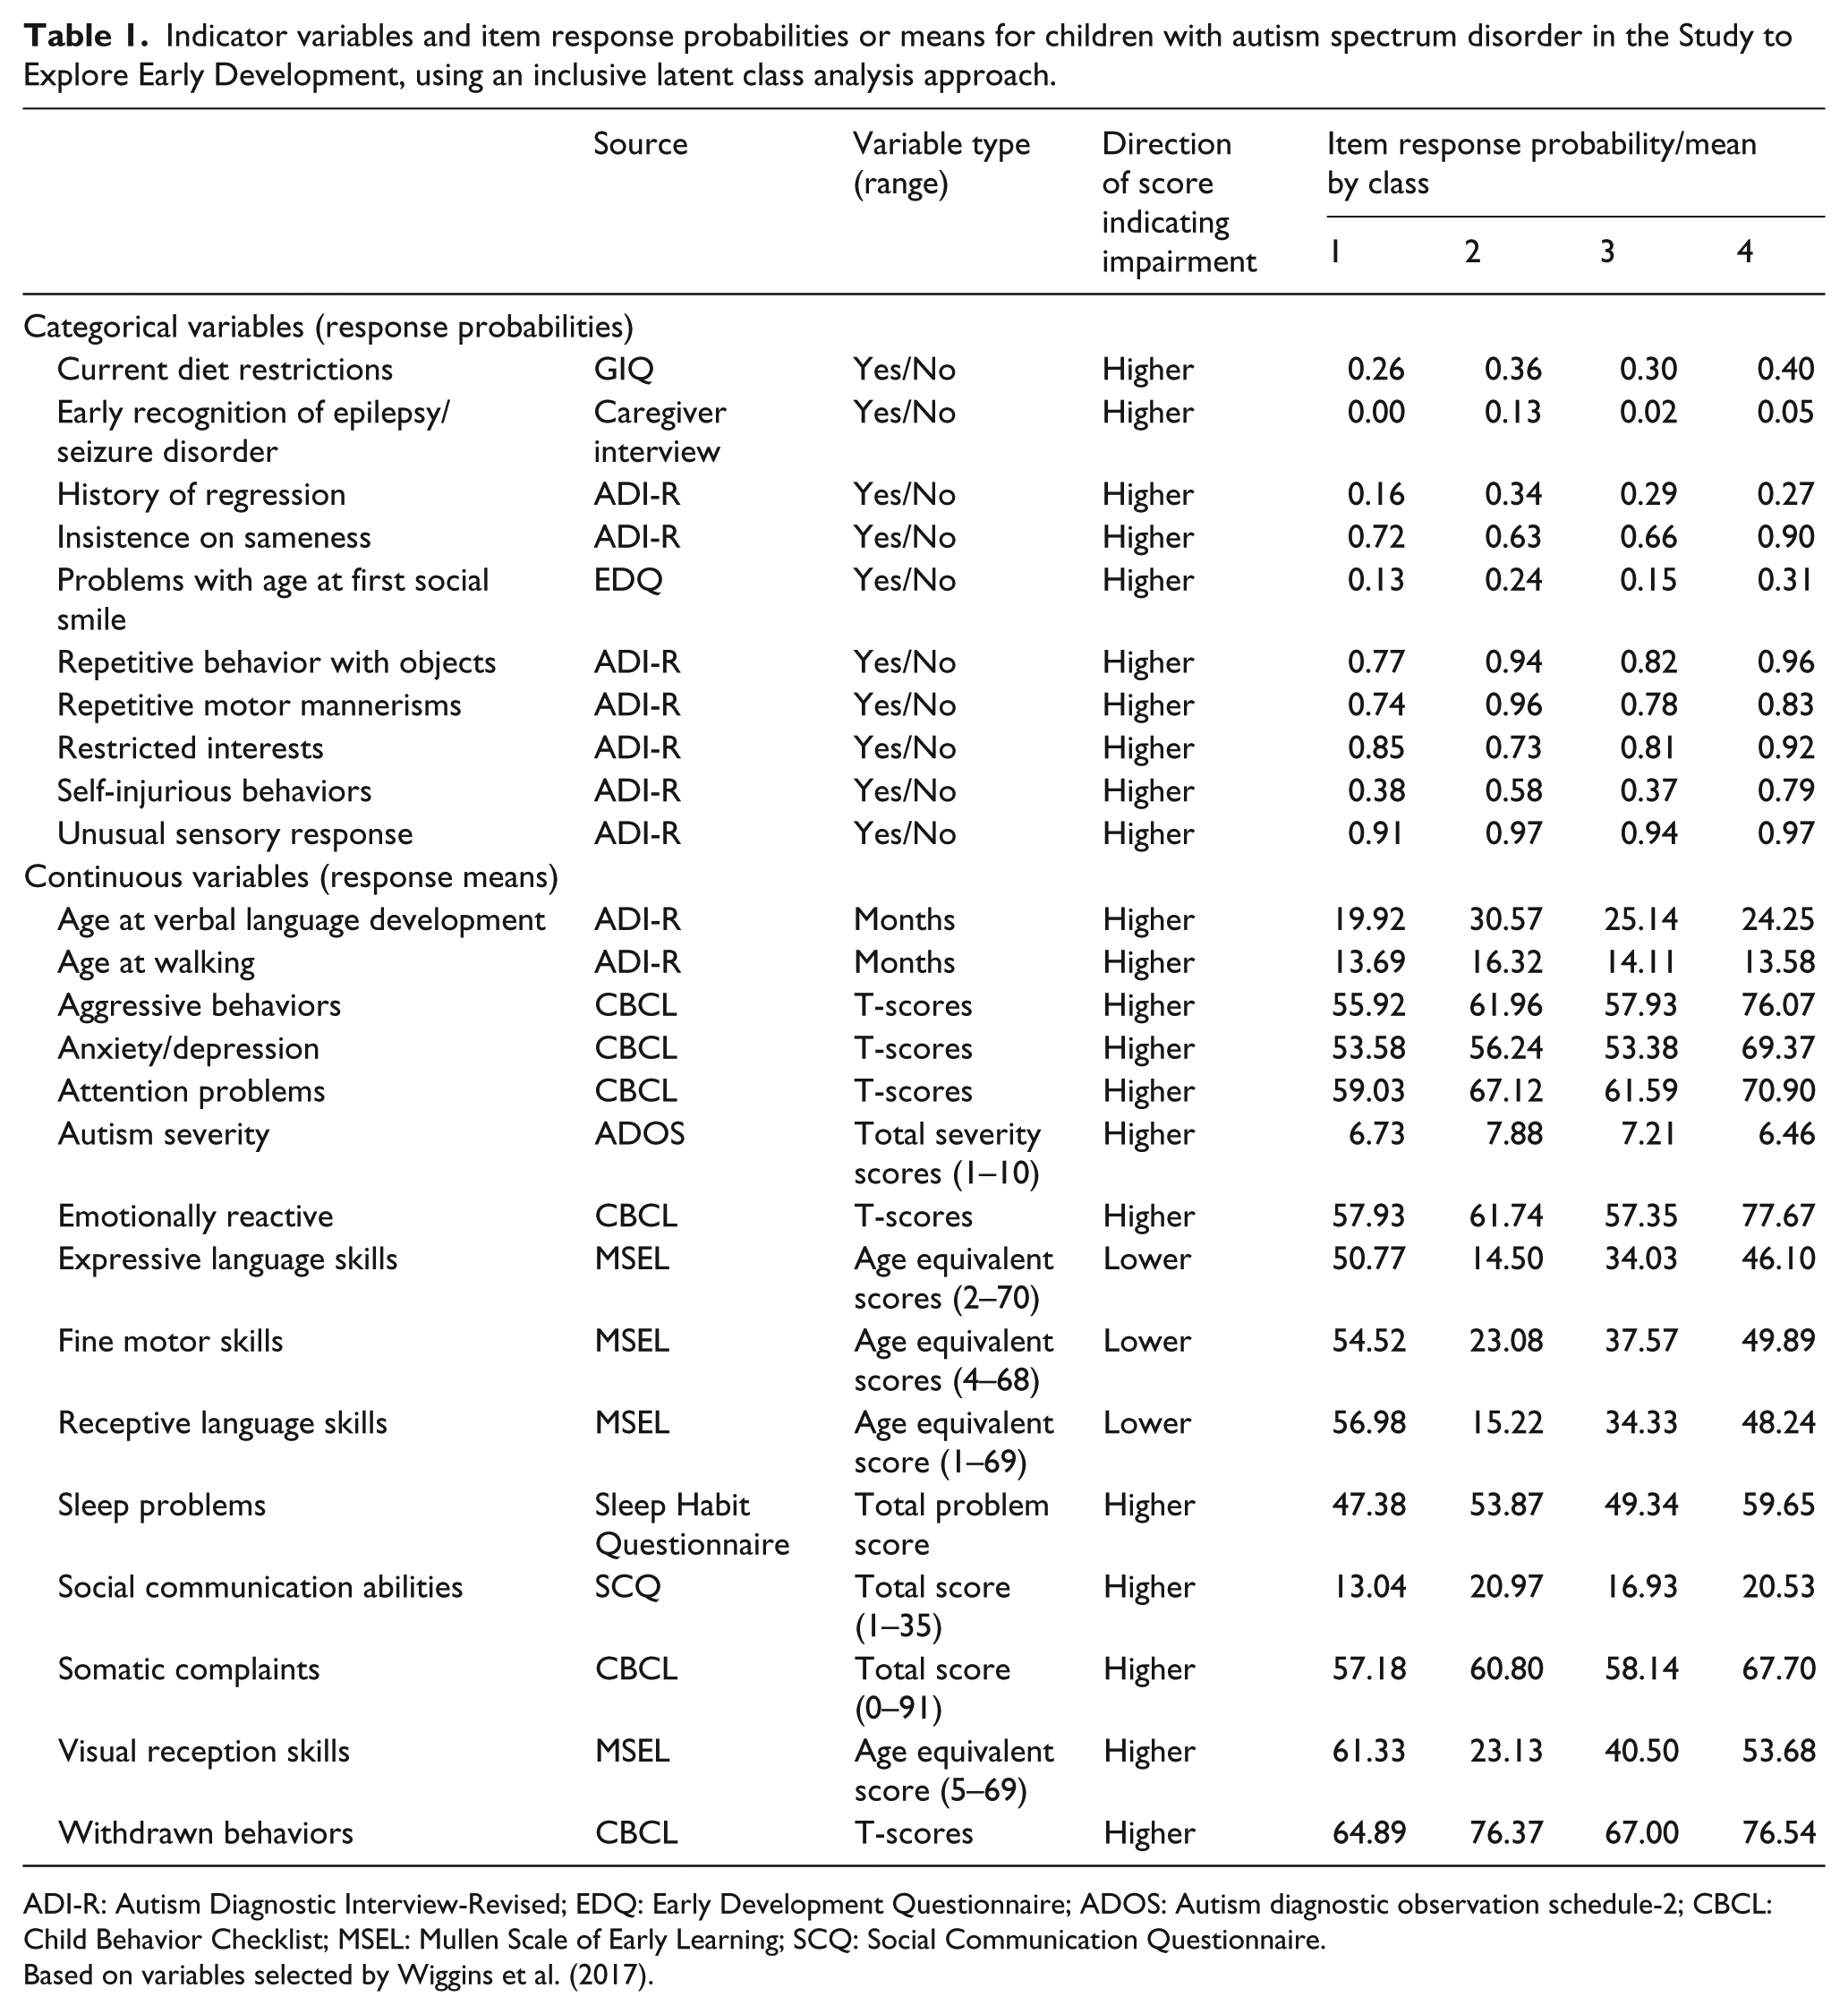
LCA results are highly dependent upon the indicator variables used to generate latent classes. In total, 25 indicators were chosen for the model, as selected by Wiggins et al. (2017). The first step in choosing these indicators was a careful review of studies that classified children with ASD into subgroups, with specific focus on identifying behavioral, developmental medical features that defined subgroups. In the second step, a group of experts, that included psychologists, pediatricians, and epidemiologists, discussed other variables that could be used to describe ASD phenotypes and differentiate subgroups of children within the autism spectrum. Indicators chosen for LCA were those identified by the process noted above and quantified by SEED data collection instruments (Table 1).
Indicator variables and item response probabilities or means for children with autism spectrum disorder in the Study to Explore Early Development, using an inclusive latent class analysis approach.
ADI-R: Autism Diagnostic Interview-Revised; EDQ: Early Development Questionnaire; ADOS: Autism diagnostic observation schedule-2; CBCL: Child Behavior Checklist; MSEL: Mullen Scale of Early Learning; SCQ: Social Communication Questionnaire.
Based on variables selected by Wiggins et al. (2017).
Results found that a four-class model best fit the data based on a lower Bayesian information criterion than the three class model, Lo–Mendel–Rubin Likelihood Ratio Tests (LMR-LRT) that found that the four-class model improved on fit compared to the three class model with no additional improvement in a five class model, and an entropy estimate of 0.92 (entropy ranges from 0 to 1 with higher entropy indicating higher precision of latent classification) (Wiggins et al., 2017). The four classes generated from our analysis were identical to those found in the earlier analysis of the same data and represent children with Mild Language Delay with Cognitive Rigidity, Mild Language and Motor Delay with Dysregulation (e.g. anxiety/depression, attention problems, and sleep problems), General Developmental Delay, and Significant Developmental Delay with Repetitive Motor Behaviors (Table 2). Table 1 presents the item response probabilities (the probability that a member of a class has the given trait) and means scores for continuous indicator by class. Further details on this LCA method in SEED are provided in Wiggins et al. (2017).
Phenotypic subgroups in the Study to Explore Early Development, derived using latent class analysis.

Percentage is from a latent class model that included our broader autism phenotype covariate.
Analytic approach
Having confirmed our classes using the extended LCA, we regenerated our classes using an inclusive extended LCA approach to generate odds ratios (ORs) that compare phenotypic class membership by presence of parental BAP. In this method, we reran our LCA described above to include, as predictors of class membership, our BAP covariate and an indicator for missing SRS-A data. This model then calculated ORs using multinomial logistic regression that estimated model posterior probabilities for the inclusive classes. This inclusive model improves validity of effect estimates since it allows for a child to have a probability of being in multiple classes, rather than assigning them to one class and assuming no classification error. In addition, an inclusive LCA accounts for the potential effect of the covariate in deriving latent classes (Bray et al., 2015). A disadvantage of this approach is that estimated posterior probability for class membership is slightly different than our original model without covariates or when models contain different covariates. To address these issues, we compared our inclusive approach with a “three-step approach” (which assigns each individual a class then weights for classification error) (Vermunt, 2010) as a sensitivity analysis.
Parental BAP data were missing for approximately 17% of children with ASD in SEED. In order to use data on all cases, we included an indicator for missing BAP in our analyses. Past work has shown that for LCA, using an indicator is less biased than restricting to those with complete data (Formann, 2007). A model with missing indicators creates class distributions for both observed and missing data, which provides information on missing data mechanisms (Formann, 2007). In most cases, a missing indicator approach is biased in epidemiological analyses because it removes the effects covariates have on one another, preventing adequate control of confounding (Groenwold et al., 2012; Jones, 1996). However, there were no confounders in our analysis, and our dependent variables (whether dichotomous BAP or BAP by parent type) were exclusive, eliminating the issue of covariance. We ran additional sensitivity analyses to assess the effect of using inverse probability weights to account for missing SRS-As.
We evaluated the effects of which parent or parents had BAP by rerunning our inclusive LCA with indicators for parental BAP combinations (father only, mother only, and both). In addition, we aimed to present data on differences between child sexes. To do this, we added a child sex covariate, a child sex by BAP interaction term, and a child sex by missing SRS-A interaction term to our LCA model in order to stratify estimates by child sex. Child sex was not associated with missing SRS-As (χ2 p-value = 0.2); therefore, we believe the missing indicator approach is still unbiased (Groenwold et al., 2012). Since the sample size of girls was low, we did not statistically test differences between sexes since our LCA model could not calculate exact statistics. Therefore, we present ORs and confidence intervals (CIs) for each sex and compare qualitatively. For all models, we chose the Significant Developmental Delay with Repetitive Motor Behaviors class (class 2) to be the referent class because it was the most distinct class in terms of cognitive impairment and social and communicative deficits.
As a construct, BAP is theorized to be independent of IQ, age, and race (Constantino and Todd, 2005). Factors like socioeconomic status, parental education, child age at diagnosis, and child service usage are potential mediators because they may be caused by BAP and affect child phenotype; these analyses are beyond the scope of this article. For these reasons, we did not add any additional demographic covariates to our models in these analyses, which is consistent with past work that has assessed the relationship between parental autism-like traits and child phenotype (De la Marche et al., 2012; Duvekot et al., 2016; Schwichtenberg et al., 2010).
Analyses were conducted in SAS Institute Inc. (version 9.3; 2011) and Mplus 7 (Muthen and Muthen, 1998–2012).
Results
Of 707 children with ASD in our sample, 524 children had SRS-A data from both parents of which 100 had at least one parent who was BAP+. Table 3 presents demographics by BAP status (either/both parents BAP+, both BAP−, or BAP missing). For mothers, of those in the BAP+ group, 17.8% were black, 16.2% were of Hispanic ethnicity, and 24.2% had less than 12 years of education. For those in the BAP− group, 13.4% were black and 11.0% were of Hispanic ethnicity, while 12.7% had less than 12 years of education. Demographics for the fathers were similar to those of the mothers (data not shown). When SRS-A data were missing (either on the mother only (n = 43), father only (n = 70), or both (n = 70)), 39.7% of mothers were black, 12.5% were of Hispanic ethnicity, and 6.6% had less than 12 years of education.
Demographic characteristics by parent’s broader autism phenotype status in the Study to Explore Early Development.

BAP: broader autism phenotype.
BAP+ defined as a Social Responsiveness-Adult T-score ⩾ 60.
Missing SRS-A includes missing data for mother SRS-A only (N = 43), father SRS-A only (N = 70), or both missing SRS-A (N = 70).
Phenotypic classes were from the inclusive latent class model with any parent BAP+. Classes are assigned by highest posterior probability (analyses did not assign children to classes but used estimated model probabilities).
When at least one parent was BAP+, the odds of the child being in the Mild Language and Motor Delay with Dysregulation class (class 4) compared to the Significant Developmental Delay with Repetitive Motor Behaviors class (class 2) were 2.44 times that then when both parents were BAP− (95% CI: 1.16, 5.09) (Figure 1). Compared to class 2, neither the Mild Language Delay with Cognitive Rigidity class (class 1) OR: 0.73; 95% CI: 0.36, 1.48), nor the General Developmental Delay class (class 3) (OR: 0.86; 95% CI: 0.44, 1.66) was associated with parental BAP status. The results were robust to alternative LCA methods (three-step LCA) and missing data approaches (inverse probability for missing weights) (Supplement 1). Our inclusive LCA approach shifted class distribution by 0.5% compared to our classes without covariates, indicating no difference in class interpretation. Missing SRS-A data (compared to not missing data) were not statistically associated with increased odds of being in a certain class (p > 0.05 for missing indicators). Children with any BAP+ parent in class 4 had the highest scores in anxiety/depression, aggressive behaviors, and sleep problems relative to any other BAP class combination (Supplement 2). In post hoc analyses, parental BAP was statistically associated with the child having history of regression, later age at social smile, and more restricted interests, aggressive behavior, anxiety/depression, emotional reactivity, sleep problems, somatic complaints, and withdrawn behavior.
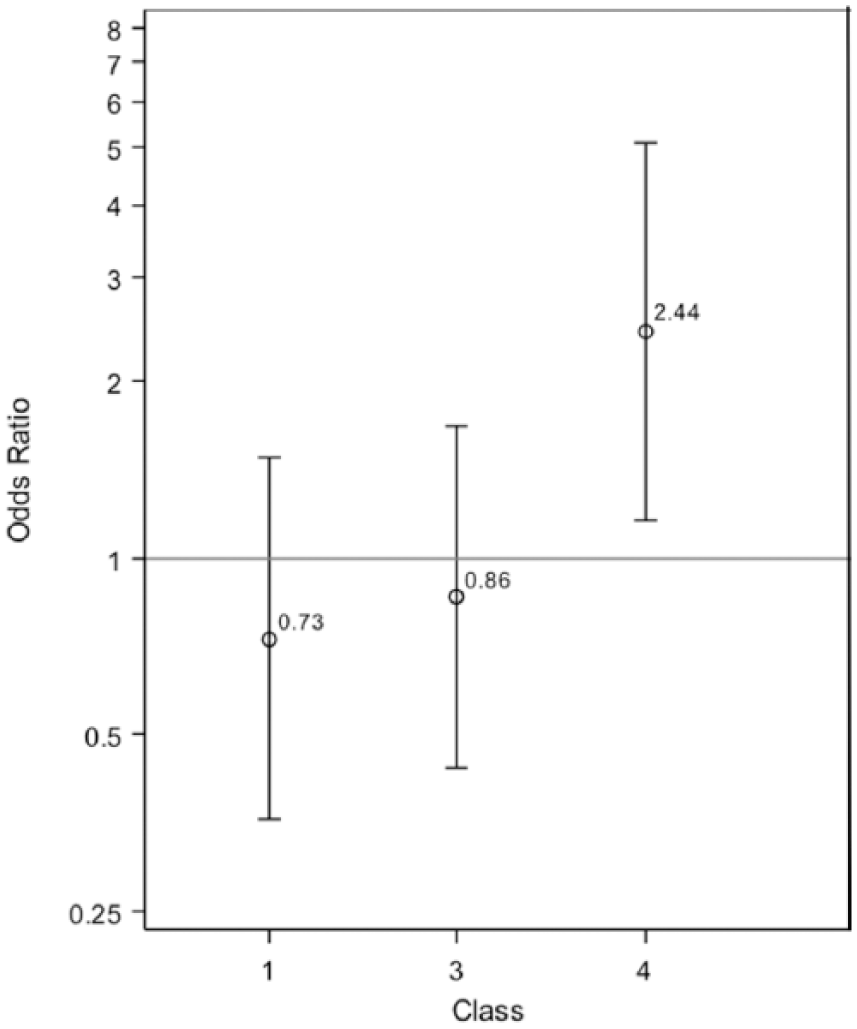
Odds ratios and 95% confidence intervals comparing child autism spectrum disorder phenotypic classes by parental broader autism phenotype in the Study to Explore Early Development.
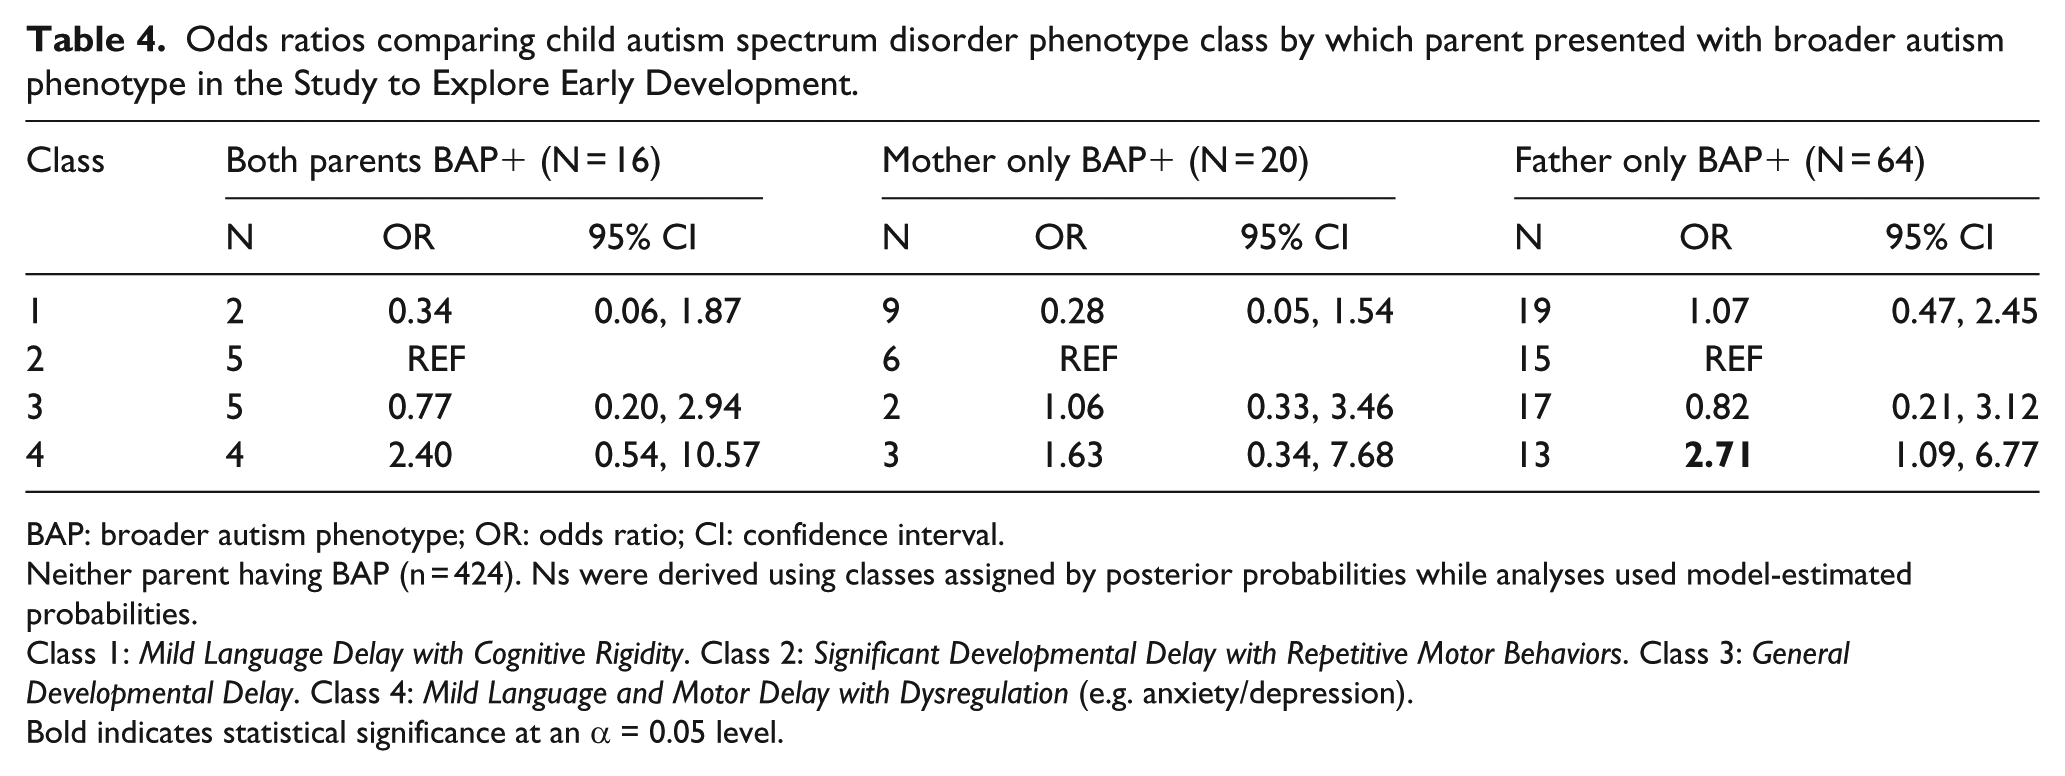
Compared to both parents being BAP−, both parents being BAP+ had an elevated but imprecise association with child’s membership in class 4 versus class 2 (OR: 2.40; 95% CI: 0.54, 10.57) (Table 4). When only mothers were BAP+ (N = 20), there were no significant associations between classes and maternal BAP, but estimates were imprecise. Fathers alone being BAP+ (N = 64) compared to both parents being BAP− was associated with a child being in class 4 compared to class 2 (OR: 2.71; 95% CI: 1.09, 6.77). We saw no significant associations between any of the parental BAP categories and the child being in class 1 or class 3 as compared to class 2. Because we used an inclusive LCA model, the model-estimated posterior probabilities of class distribution were 0.1% different than when we did not include covariates; therefore, there is no difference in interpretation for what each class represents.
Odds ratios comparing child autism spectrum disorder phenotype class by which parent presented with broader autism phenotype in the Study to Explore Early Development.
BAP: broader autism phenotype; OR: odds ratio; CI: confidence interval.
Neither parent having BAP (n = 424). Ns were derived using classes assigned by posterior probabilities while analyses used model-estimated probabilities.
Class 1: Mild Language Delay with Cognitive Rigidity. Class 2: Significant Developmental Delay with Repetitive Motor Behaviors. Class 3: General Developmental Delay. Class 4: Mild Language and Motor Delay with Dysregulation (e.g. anxiety/depression).
Bold indicates statistical significance at an α = 0.05 level.
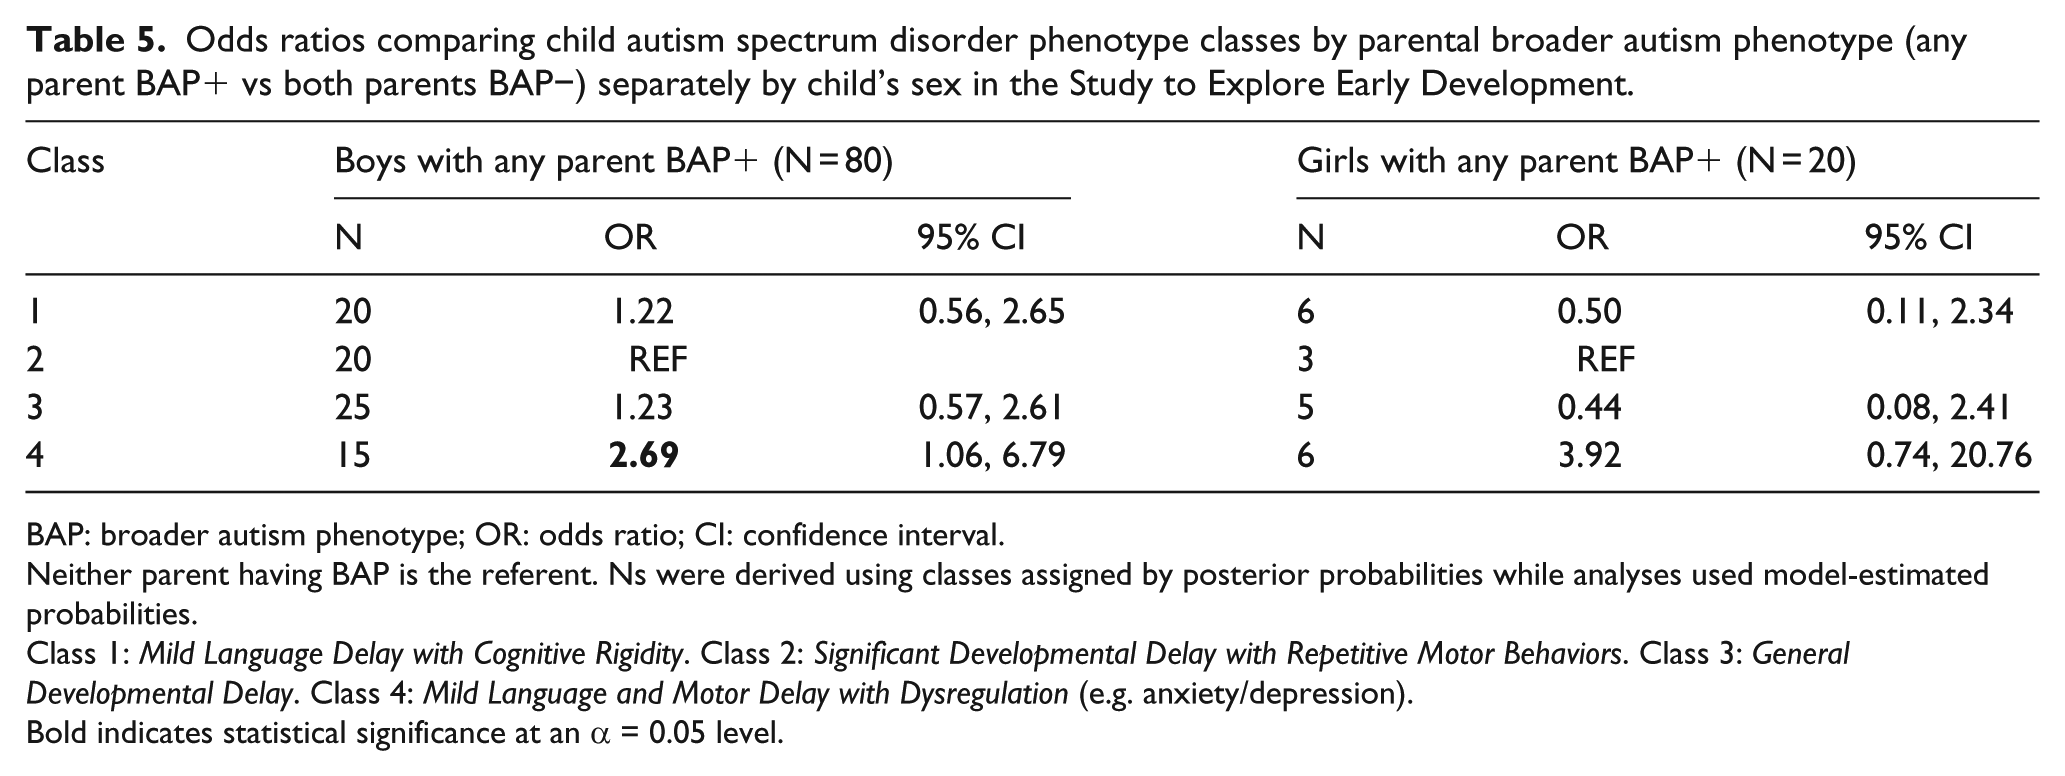
After stratification by child sex, results were similar for boys and girls. Among boys, the relationship between any parent being BAP+ and phenotypic class was similar to overall results, as there was a significant effect comparing class 4 to class 2 (OR: 2.68; 95% CI: 1.06, 6.79) (Table 5). Results for girls were imprecise due to small sample size (N = 20), but ORs for any parent being BAP+ were elevated for the child being in class 4 compared to class 2 (OR: 3.92; 95% CI: 0.74, 20.76). Adding child sex and the interaction term into the LCA model shifted the model-estimated posterior probability by 0.5% from the LCA without covariates, again indicating that our classes have the same interpretation as our model without covariates.
Odds ratios comparing child autism spectrum disorder phenotype classes by parental broader autism phenotype (any parent BAP+ vs both parents BAP−) separately by child’s sex in the Study to Explore Early Development.
BAP: broader autism phenotype; OR: odds ratio; CI: confidence interval.
Neither parent having BAP is the referent. Ns were derived using classes assigned by posterior probabilities while analyses used model-estimated probabilities.
Class 1: Mild Language Delay with Cognitive Rigidity. Class 2: Significant Developmental Delay with Repetitive Motor Behaviors. Class 3: General Developmental Delay. Class 4: Mild Language and Motor Delay with Dysregulation (e.g. anxiety/depression).
Bold indicates statistical significance at an α = 0.05 level.
Discussion
In a study of children aged 30–68 months with ASD, having a BAP+ parent was associated with increased odds of being in the Mild Language and Motor Delay with Dysregulation class, marked by average nonverbal abilities, mild language and motor delays, average nonverbal abilities, and an increased propensity for co-occurring conditions like anxiety, depression, aggression, and attention problems, compared to the Significant Developmental Delay with Repetitive Motor Behaviors class, defined by increased cognitive impairment and repetitive motor behaviors. Our other phenotypic class comparisons were not statistically significantly associated with parental BAP, suggesting that the association with BAP is distinct to the ASD phenotype with more co-occurring conditions and not inversely associated with the phenotype marked by considerable cognitive impairment. In addition, this association with an ASD phenotype class with more co-occurring conditions was statistically significant if fathers alone were BAP+ and had elevated but imprecise ORs if both parents were BAP+ or if mother alone was BAP+. The relationship between parental BAP and child phenotypic class was qualitatively similar for boys and girls.
Past work has found that having a parent with BAP is associated with a child’s ASD presentation, finding that increased scores on a measure of BAP in a parent was related to increased scores on a measure of the child’s ASD or other developmental traits (De la Marche et al., 2015; Hasegawa et al., 2015; Maxwell et al., 2013; Mazefsky et al., 2008; Sasson et al., 2013b; Schwichtenberg et al., 2010; Smith et al., 2009). These studies relied on one standardized measure of child ASD traits. We extend this prior work by defining child ASD phenotype using latent classes derived from multiple instruments and data sources (caregiver interview, developmental questionnaires, and clinician observation), which improves phenotypic classification by enabling a wider description of ASD presentation that considers co-occurring conditions and associated features. This approach is also less reliant on one informant or one instrument, reducing risk of bias due to informant effects or measurement error.
The moderately strong association between parental BAP and a child phenotype defined by average nonverbal skills, mild language and motor delays, mild ASD symptom severity, and more co-occurring conditions may support that this ASD presentation is more likely to be hereditary (Constantino and Todd, 2005; Gaugler et al., 2014). Qualitatively, BAP is similar to this class since BAP also presents with average cognitive functioning and high levels of anxiety, depression, and attention issues (Gerdts and Bernier, 2011). Our results align with other studies that have found that anxiety (Duvekot et al., 2016) and general social ability (Sasson et al., 2013b) present more similarly between parents with BAP and their children with ASD as compared to parents without BAP and their children with ASD.
This result has implication for the study of ASD genetics. Past work has assessed de novo copy number variants (CNVs) as potential causal mechanisms for ASD (Shishido et al., 2014). CNVs can be strongly associated with ASD but are rare (<5% prevalence). Although rare, these CNVs are more common in simplex families (families with only one child with ASD) as compared to multiplex families (families with multiple children with ASD) (Gerdts et al., 2013; Leppa et al., 2016; Sasson et al., 2013b). Multiplex ASD is highly associated with BAP in relatives (Gerdts et al., 2013; Losh et al., 2008; Virkud et al., 2009) and thus it is unlikely these CNV mutations explain the intergenerational autistic traits seen when parents have BAP and the child has ASD (Sasson et al., 2013b). The associations that we see between parental BAP and the Mild Language and Motor Delay with Dysregulation class may suggest at least partial inheritance of common genetic variants in this group of parents and children. Common genetic variants are prevalent (>5% prevalence in the population), but do not have a large enough effect to be considered causal for ASD (Geschwind, 2011). However, Klei et al. (2012) found that a combination of these common variants lead to an additive effect on ASD risk with even higher effects among multiplex families. Yip et al. (2017) also found that additive genetic variability explains a large amount of ASD liability in a population-based sample from Sweden. Therefore, shared genetic variability may be the plausible pathway for familial transmission of traits common among parental BAP and child Mild Language and Motor Delay with Dysregulation class.
With the complexity and heterogeneity of ASD genetics, it is important to utilize the unique intergenerational aspects of BAP and ASD to improve the search for risk factors and learn how these factors manifest into the ASD presentation. In studies aimed at evaluating genetic risk associated with ASD, identifying parents with BAP and their phenotypically similar children would reduce heterogeneity in both phenotype and genotype, thus increasing the likelihood of meaningful genetic findings and discovery of etiologic mechanisms for specific ASD traits. In contrast, utilizing a study sample of children with ASD and no family history of ASD or BAP may improve power to find sporadic mutations and other non-heritable ASD etiologies.
There was an elevated but imprecise association between both parents having BAP and a child being in the Mild Language and Motor Delay with Dysregulation class compared to the Significant Developmental Delay with Repetitive Motor Behaviors class. The prevalence of BAP for any parent in our study was 19.0%, which is consistent with the literature that estimates prevalence between 10% and 50% (Dawson et al., 2007; Gerdts and Bernier, 2011; Lainhart et al., 2002; Lyall et al., 2014; Maxwell et al., 2013; Sasson et al., 2013a; Seidman et al., 2012) with lower prevalence among mothers of children with BAP (Gerdts and Bernier, 2011) (6.9% in our sample); consequently, statistical power is an issue when trying to assess the combined effects of having two parents with BAP. Our results for mothers alone being BAP+ compared to both parents being BAP−, which were imprecise, were similar in direction, but smaller in magnitude than results when fathers alone or both parents were BAP+. This result is in line with previous studies that found no or much weaker associations between maternal BAP and child scores on ASD measures of symptomatology relative to associations with paternal BAP (De la Marche et al., 2015; Losh et al., 2012; Maxwell et al., 2013; Schwichtenberg et al., 2010; Smith et al., 2009). This difference between parents with BAP could be a result of our limited sample size, or a reflection of differing etiologic mechanisms based on parent of origin. Parents may transmit genes or epigenetic dysregulation that cause ASD through sex-specific pathways (Flashner et al., 2013; Gerdts and Bernier, 2011; Keverne, 1997). A population-based study found that heritable effects from the mother explained neither ASD liability nor ASD subtype; while in contrast, overall additive genetic variable accounted for a large proportion of ASD variability (Yip et al., 2017). Future work with a larger sample of mothers with BAP will allow us to better assess the sex-related genetic effects of BAP as an endophenotype.
In the full SEED sample, there was no statistically significant difference in class distribution between boys and girls (Wiggins et al., 2017), and qualitatively, our results did not show modification of the association between parental BAP and child ASD phenotype by child sex. Child sex may play a role in ASD etiology, based on a “female protective effect” (Jacquemont et al., 2014) or differences related to diagnostic practice and under-identification of ASD in females (Begeer et al., 2013). However, our results suggest that pathways associated with parental BAP do not drive sex differences in ASD. Caution is warranted given the imprecision of our findings because of limited sample size. Further work should explore how parental BAP relates to the biological mechanisms that lead to female ASD in a larger sample of girls.
Our ability to investigate whether the paternal versus maternal BAP was more strongly associated with the child’s phenotype was limited by the low prevalence of having both parents BAP+ or only mothers that were BAP+. The ability to investigate whether the associations differed by child’s sex was also limited by the small number of girls. We aim to statistically assess these associations with larger samples in the future. In this work, 183 children were missing parental SRS-A data. Sensitivity analyses that weighted for this missingness had results similar to the full sample missing indicator approach. We did not know who acted as the informant on the SRS-A for 37.5% of fathers and 75.7% of mothers. It is likely that some mothers and fathers filled out SRS-As on themselves and this could affect accuracy in reporting BAP (De la Marche et al., 2015; Sasson et al., 2014). The effect of this self-reporting on the SRS-A in our study would likely lead to non-differential misclassification, since reporting method would not be associated with BAP status or child phenotype (Constantino and Gruber, 2012; De la Marche et al., 2015).
Although SEED was community-based, the sample is comprised six sites that may not fully represent other geographic areas with differing socioeconomic and demographic distributions. In addition, the results of LCA are dependent on the variables used to generate latent classes and characteristics of the sample. Replication studies are needed to demonstrate the stability of our subgroups in other samples of children, in similar and different age ranges and over time. In addition, this work should be replicated using results when using other methods, such as semi-structured interviews, observations, self-reports, and other tools to measure BAP to ensure there are no residual effects of using the SRS-A. In past work with these data, we found mothers with BAP may report differently on child ASD traits (Rubenstein et al., 2017); this may have affected reporting on indicators taken from maternal report measures. However, since we used indicators from a wide range of instruments with both maternal and clinician informants, this is unlikely to have substantially biased our results. Based on the conceptual framework of our study, we did not believe that it was necessary to statistically adjust for demographic characteristics. Nonetheless, with more data, we hope to validate latent classes after stratification by race or parental age and then assess relationships between parental BAP.
An important strength of this study is SEED’s large community-based sample of children with ASD. These children had a broad range of symptoms and symptom severity, yet were confirmed to have ASD by a comprehensive in-person evaluation with research reliable clinicians. The inclusion of children with a diverse range of symptoms increased the generalizability of the observed associations with parental BAP compared to observations from potentially more severe clinic-based samples. In addition, SEED collected extensive data on behavior and co-occurring conditions that allowed us to better describe child ASD phenotypic subgroups. Although sample size was limited for some groups, we were able to explore effects of which parent was BAP+ and interaction by child sex, highlighting avenues for future research.
Conclusion
BAP in parents of children with ASD was significantly associated with the child being in a phenotypic class that presented with average nonverbal abilities, mild language and motor delays, and more co-occurring conditions like anxiety, depression, and sleep problems. Children in this class have a presentation that includes traits qualitatively similar to BAP in adults. Future work should continue to better define and identify ASD subgroups using characteristics like BAP in parents and then use these groups to explore endophenotypes that can identify hereditary genetic mechanisms to for certain ASD characteristics.
Supplemental Material
AUT753563_Lay_Abstract – Supplemental material for Associations between parental broader autism phenotype and child autism spectrum disorder phenotype in the Study to Explore Early Development
Supplemental material, AUT753563_Lay_Abstract for Associations between parental broader autism phenotype and child autism spectrum disorder phenotype in the Study to Explore Early Development by Eric Rubenstein, Lisa D Wiggins, Laura A Schieve, Chyrise Bradley, Carolyn DiGuiseppi, Eric Moody, Juhi Pandey, Rebecca Edmondson Pretzel, Annie Green Howard, Andrew F Olshan, Brian W Pence and Julie Daniels in Autism
Supplemental Material
AUT753563_Supplementary_material – Supplemental material for Associations between parental broader autism phenotype and child autism spectrum disorder phenotype in the Study to Explore Early Development
Supplemental material, AUT753563_Supplementary_material for Associations between parental broader autism phenotype and child autism spectrum disorder phenotype in the Study to Explore Early Development by Eric Rubenstein, Lisa D Wiggins, Laura A Schieve, Chyrise Bradley, Carolyn DiGuiseppi, Eric Moody, Juhi Pandey, Rebecca Edmondson Pretzel, Annie Green Howard, Andrew F Olshan, Brian W Pence and Julie Daniels in Autism
Footnotes
Declaration of conflicting interests
The author(s) declared no potential conflicts of interest with respect to the research, authorship, and/or publication of this article.
Funding
The author(s) disclosed receipt of the following financial support for the research, authorship, and/or publication of this article: This study was funded by Centers for Disease Control and Prevention (Cooperative Agreement Number U10DD000180, Colorado Department of Public Health; Cooperative Agreement Number U10DD000181, Kaiser Foundation Research Institute (CA); Cooperative Agreement Number U10DD000182, University of Pennsylvania; Cooperative Agreement Number U10DD000183, Johns Hopkins University; Cooperative Agreement Number U10DD000184, University of North Carolina at Chapel Hill; and Cooperative Agreement Number U10DD000498, Michigan State University) and Autism Speaks (Weatherstone Predoctoral Fellowship Grant #10052). The findings and conclusions in this report are those of the authors and do not necessarily represent the official position of the Centers for Disease Control and Prevention.

References
Supplementary Material
Please find the following supplemental material available below.
For Open Access articles published under a Creative Commons License, all supplemental material carries the same license as the article it is associated with.
For non-Open Access articles published, all supplemental material carries a non-exclusive license, and permission requests for re-use of supplemental material or any part of supplemental material shall be sent directly to the copyright owner as specified in the copyright notice associated with the article.
