
Abstract
This study examined the reading and math achievement profiles and longitudinal growth trajectories of a nationally representative sample of children ages 6 through 9 with an autism spectrum disorder. Four distinct achievement profiles were identified: higher-achieving (39%), hyperlexia (9%), hypercalculia (20%) and lower-achieving (32%). Children with hypercalculia and lower-achieving profiles were more likely to be from low socioeconomic families and had lower functional cognitive skills than the higher-achieving profile. All four profiles lost ground in passage comprehension over time. Slower improvement occurred for the higher-achieving group on letter–word identification, the hyperlexia group on conversation abilities and the hypercalculia group on calculation and functional cognitive skills relative to the lower-achieving group.
Keywords
Between 2002 and 2008, the prevalence of children with an autism spectrum disorder (ASD) increased by 78% (Centers for Disease Control and Prevention, 2012). With a growing number of children with an ASD attending schools and being subject to the same academic standards as their peers without disabilities, it is increasingly important to understand their diverse academic learning needs in order to provide them effective instruction.
Children with an ASD often experience difficulties in the classroom, both academically and socially. Yet most of the current research on children with an ASD focuses on social and communication skills, with less attention paid to academic achievement. Of those studies that examine the academic achievement of children with an ASD, many do not look at within-group differences but instead compare the group-level, overall academic achievement of children with an ASD with that of children with other disabilities (Blackorby et al., 2004; Wei et al., 2011, 2013). These group-level findings may mask different learning patterns of subgroups of children with an ASD (Jones et al., 2009), making it difficult to provide appropriate individualized instruction and supports for these students.
Among the handful of studies that have explored within-group academic achievement differences, a number of data-driven approaches have been used to categorize the academic variations of students with an ASD. For example, Stevens et al. (2000) found two subgroups among school-age children with an ASD: a “higher-functioning group,” with higher social, language and nonverbal abilities, and a “lower-functioning group,” with lower scores on these dimensions. In another study, Jones et al. (2009) found four mutually exclusive achievement profiles: reading peak (14%), reading dip (10%), arithmetic peak (16%) and arithmetic dip (6%) based on 100 14- to 16-year-olds with an ASD. Arguably the most-studied approach to profiling the academic achievement of students with an ASD is identifying those who show particularly high achievement in certain domains of reading and math, often referred to as hyperlexia and hypercalculia (Estes et al., 2011; Jones et al., 2009).
Hyperlexia first appeared in the literature during the 1960s to describe children who demonstrated word recognition skills superior to reading comprehension skills, beyond what would be expected given their reported intellectual ability (Silberberg and Silberberg, 1967). Although the rate of hyperlexia has not been identified in the general population, in a clinically referred sample of children with an ASD, Grigorenko et al. (2002) found 20.7% showed discrepancy scores indicating hyperlexia. In a study of ASD children with and without hyperlexia, children with an ASD and hyperlexia performed as well as typically developing children on all reading-related tasks other than reading comprehension (Newman et al., 2007). Adolescents with an ASD and hyperlexic reading abilities and exceptional word reading relative to their intelligence quotient (IQ) outperformed typically developing children (matched on age and IQ) on lexical orthographical and phonological representation tasks (Saldaña et al., 2009).
Hypercalculia has been discussed and defined to a lesser degree than hyperlexia. Research evidence on the math abilities of children with an ASD is generally mixed. Some studies show difficulties with math and problem-solving tasks; some studies find average math abilities among children with Asperger syndrome and high-functioning autism; and others find mathematically gifted individuals with an ASD, some of them scoring above the 99th percentile on standardized math achievement measures (for a review, see Chiang and Lin, 2007).
Although these studies provide a foundation for identifying the academic achievement profiles of the ASD population, some shortcomings are evident. First, much of the research to date has limited generalizability due to small and nonrepresentative convenience samples or different measures to assess reading and math levels. This makes it difficult to identify subgroups within ASD and factors that may influence academic achievement. Second, investigators rarely consider growth in academic achievement among subgroups of children with an ASD. Of the few studies that have examined academic trajectories, considerable heterogeneity appears in their intercept and/or slope. Turner et al. (2006) found that half of the children with an ASD in that study improved their cognitive and language scores over time. From preschool to school age, Stevens et al. (2000) found that the “high-functioning” group had normative growth in academics, social skills and IQ; however, the “lower-functioning” group remained stable or even dropped in language and social skills. Anderson et al. (2007) categorized the growth in verbal skills into four subgroups for children with an ASD within the most improved group (23%), which had normative or above average growth. The other groups had lower than normal growth rates. Despite these initial findings, no study to date has systematically explored the longitudinal growth patterns of different profiles/subgroups of those with an ASD. Third, factors contributing to achievement levels and growth trajectories in children with an ASD are not currently well-understood despite the fact that higher levels of cognitive ability (Assouline et al., 2012; Jones et al., 2009), social skills (Estes et al., 2011), language abilities (Anderson et al., 2007) and verbal intelligence (Mayes and Calhoun, 2007) at an early age are predictive of higher academic skills later on among children with an ASD. Finally, although it is critically important to better understand the academic profiles of children with autism, considering a range of outcomes would more fully capture children’s potential for participating in society more broadly. For example, little attention is given to the variety of health problems that are co-morbid with ASD (Treating Autism and Autism Treatment Trust, 2013), and this can seriously restrict the ability of children with ASD to attend school. Also, few studies have examined the ways that ASDs limit activities of daily living, even though they are important aspects of physical well-being, a fundamental component to the concept of quality of life (Schalock, 2000, 2004).
Given this state of the knowledge base, further investigation is needed to explore the factors affecting academic achievement and growth trajectories of subgroups of children with an ASD group, thereby identifying potential avenues for improving their academic outcomes. The current study builds upon foundational research such as that of Jones et al. (2009) to investigate the academic strengths and weaknesses of subgroups of children with an ASD. We then extend that knowledge one step further by examining the growth trajectories of these students as well as factors that are related to level and growth within the ASD population nationally. Specifically, this study poses the following research questions.
What are the distinct academic achievement profiles of children with an ASD?
What are the differences in sociodemographic factors and in the functional, social, conversational and health outcomes of children with different academic achievement profiles?
What are the growth trajectories in academic, functional, social, conversational and health outcomes across these achievement profiles?
Methods
Data sources
The study draws on data from the Special Education Elementary Longitudinal Study (SEELS), funded in 1999 by the Office of Special Education Programs, US Department of Education, to generate a comprehensive picture of the characteristics, experiences and outcomes of children with disabilities, including ASDs. SEELS used a two-stage sampling procedure to select a nationally representative sample of children receiving special education services in public schools who were ages 6–12 years in 1999 (SRI International, 1998). Student academic achievement scores were collected in academic years 2000–2001(Wave 1), 2001–2002 (Wave 2), and 2003–2004 (Wave 3). Parent interview, teacher survey and school program survey data were collected at about the same time.
Study sample
The analysis sample included children who were identified by their school district as receiving special education services under the autism disability category. This resulted in 130 children with an ASD ages 6 through 9 in 2000 who had complete scores from standardized reading and math tests; parent-reported functional, social and conversational skills; and demographic variables. The data were weighted to represent students with an ASD nationally who could have participated in the direct assessment of academic achievement administered to SEELS sample members (Godard et al., 2007). Full details of the study’s sampling and weighting strategy were previously published (Wagner et al., 2005).
Measures
Reading
SEELS included two reading subtests from the research editions of the Woodcock Johnson III (WJ III; Woodcock et al., 2001): WJ III Letter Word Identification (LWI), which measures letter and word identification skills and WJ III Passage Comprehension (PC), which measures language comprehension and reading skills using a cloze procedure (i.e. fill-in-the-blank for missing words in text passages). Test–retest reliabilities are reported to be 0.85 and 0.76 for LWI and PC, respectively (Mather et al., 2007).
SEELS also administered the Comprehensive Test of Phonological Processing (CTOPP) Rapid Letter Naming (RLN) subtest (Wagner et al., 1999) to children ages 6 through 9 years. The RLN subtest measures the efficiency of retrieval of letters from long-term memory and the production of word sounds. Independent from phonological awareness and IQ, rapid-naming scores are highly predictive of later reading abilities (Lervag and Hulme, 2009). The internal consistency reliability is 0.80 (Wagner et al., 1999).
Math
Math achievement was measured by two WJ III subtests. The Applied Problems (AP) subtest measures a student’s ability to comprehend orally presented test items along with his or her visual stimulus of text, numbers and graphs; identify relevant information; and select and conduct calculations to arrive at the correct response. The Calculation subtest consisted of calculation problems that measured a student’s computation skills. Test–retest reliabilities were 0.93 for the Applied Problems subtest and 0.86 for the Calculation subtest (Mather et al., 2007).
Standard scores were used to conduct cluster analyses and hierarchical linear modeling (HLM) growth analyses. WJ III standard scores have a mean of 100 and standard deviation of 15 to show the relative ranking of a child in comparison with other children his or her age. The CTOPP- RLN subtest provides a standard score with a mean of 10 and standard deviation of 3, which was transferred to a mean of 100 and a standard deviation of 15 for ease of comparison with WJ III scores. The CTOPP-RLN subtest was not used for the growth analysis because it was only administered to children ages 6 through 9 at each wave.
Functional, social and conversational skills and health condition
Functional cognitive skills were measured as the sum of parents’ responses on a 4-point scale (1 = not at all, 2 = not very well, 3 = pretty well, 4 = very well) indicating a youth’s ability to read common signs, tell time on an analogue clock, count change and look up telephone numbers and use the phone. Scale scores ranged from 4 to 16, with internal consistency reliability of 0.93.
Children’s social skills were measured by summing the responses to 11 questions from the Social Skills Rating Systems (SSRS)-parent version (Gresham and Elliott, 1990). The social skills score ranges from 11 to 33, with a reliability of α = 0.79. Parents rated children’s conversational ability as 1 = does not converse at all, 2 = has a lot of trouble conversing, 3 = has a little trouble conversing or 4 = converses as well as other children his or her age. Parents also reported children’s general health relative to that of other children of about the same age as 1 = poor, 2 = fair, 3 = good, 4 = very good or 5 = excellent.
Children’s demographic characteristics
Demographic variables included youth’s gender, coded 1 for male; age in years at the first data collection; race/ethnicity, coded as two dichotomous variables for African American and Hispanic; annual household income, coded as 1 = US$25,000 and under, 2 = US$25,001 to US$50,000 or 3 = more than US$50,000; and mother’s education level, coded as 1 = less than high school, 2 = high school graduate or General Educational Development (GED), 3 = some college or 4 = Bachelor of Arts/Bachelor of Science (BA/BS) degree or higher.
Statistical analysis
Descriptive analysis
All analyses were performed using SAS 9.2 (SAS Institute, Cary, NC). SAS PROC SURVEY Taylor Series Linearization method was used to account for the complex sampling design and to provide the exact estimate of the standard errors. Descriptive analysis of child outcomes at each wave of data collection and demographic variables was performed for all children with ASDs, as well as children in each distinct ASD cluster. Pair-wise comparisons among the four clusters on continuous outcomes were performed using analysis of variance (ANOVA) and a post hoc Tukey test. Pair-wise comparisons among the four clusters on binary outcomes were performed using chi-square and post hoc Tukey tests (Elliott and Reisch, 2006; Zar, 1999).
Cluster analysis
Using cluster analysis to identify subtypes of autism has been well-documented in the literature (Prior et al., 1998; Stevens et al., 2000). K-means cluster analysis procedures in SAS (fastclus; candisc) were used to identify groups of children with common reading and math achievement profiles. Cluster analysis is a person-oriented approach that divides children into clusters based on multiple aspects of reading and math achievement. Cluster algorithms generally cannot handle cases with missing values (Kaufman and Rousseeuw, 2009); therefore, only children with complete data on all five achievement measures (n = 130) were included in the cluster analysis. The clustering was conducted based on the Euclidean distances computed from these variables. Observations that were close to each other were assigned to the same cluster, whereas those that were far away from each other were assigned to different clusters. All five achievement variables were standardized before running cluster analyses. To ensure the robustness of the groupings, both theoretically and statistically, the sample was randomly split in half and separate cluster analyses were performed on each half sample to compare with the results using the full sample.
HLM growth models
HLM (Raudenbush and Bryk, 2002) was used to explore growth trajectories in academic achievement scores, as well as functional cognitive, social and conversational skills and health for children with an ASD. Two-level HLM is appropriate for this purpose because it takes into account the nesting of observations within each individual. Level 1 is the within-person model using Time to predict child outcomes. Time was within-person centered by values at Wave 1. Because Waves 1 and 2 were a year apart but Waves 2 and 3 were 2 years apart, Time was coded as 0 for Wave 1, 1 for Wave 2 and 3 for Wave 3, respectively. Level 2 is the between-person model, which includes the profiles of ASD children and sociodemographic factors. The intercept was modeled as random effects. Age at Wave 1, gender, race/ethnicity, mother’s education level and family income were modeled as fixed effects, as demographic characteristics are highly predictive of child outcomes (Wei et al., 2011, 2013). Restricted maximum likelihood estimation with an unstructured covariance was specified. HLM’s capability of using all available outcome scores from all waves to estimate growth trajectories reduces bias due to missing data. However, HLM is inflexible in handling missing data at Level 2. We assumed that the missing data at the student level (e.g. functional skills or demographics) were missing at random and the corresponding observations were list-wise deleted.
Results
Four distinct profiles of academic achievement of children with an ASD
To address research question 1 and identify any distinct patterns of reading and math achievement in children with an ASD, cluster analyses on five measures of achievement were conducted: LWI, RLN, PC, AP and Calculation. Various potential clusters were tested, and four were found to have the best conceptual and statistical model fit. The four-cluster solution from the full sample mirrored the results from two random half samples; the correlation between the cluster solutions across two random half samples was around 0.90, indicating consistency of results across the samples. By assessing how children in the four clusters differed on the five component measures of academic skills, we identified the specific strengths and limitation of children in each cluster. The mean standard scores on the five achievement subtests for the four achievement profiles are shown in Figure 1. Profiles 1, 2, 3 and 4 characterized 38.5%, 9.2%, 20.0% and 32.3% of the children with an ASD, respectively.
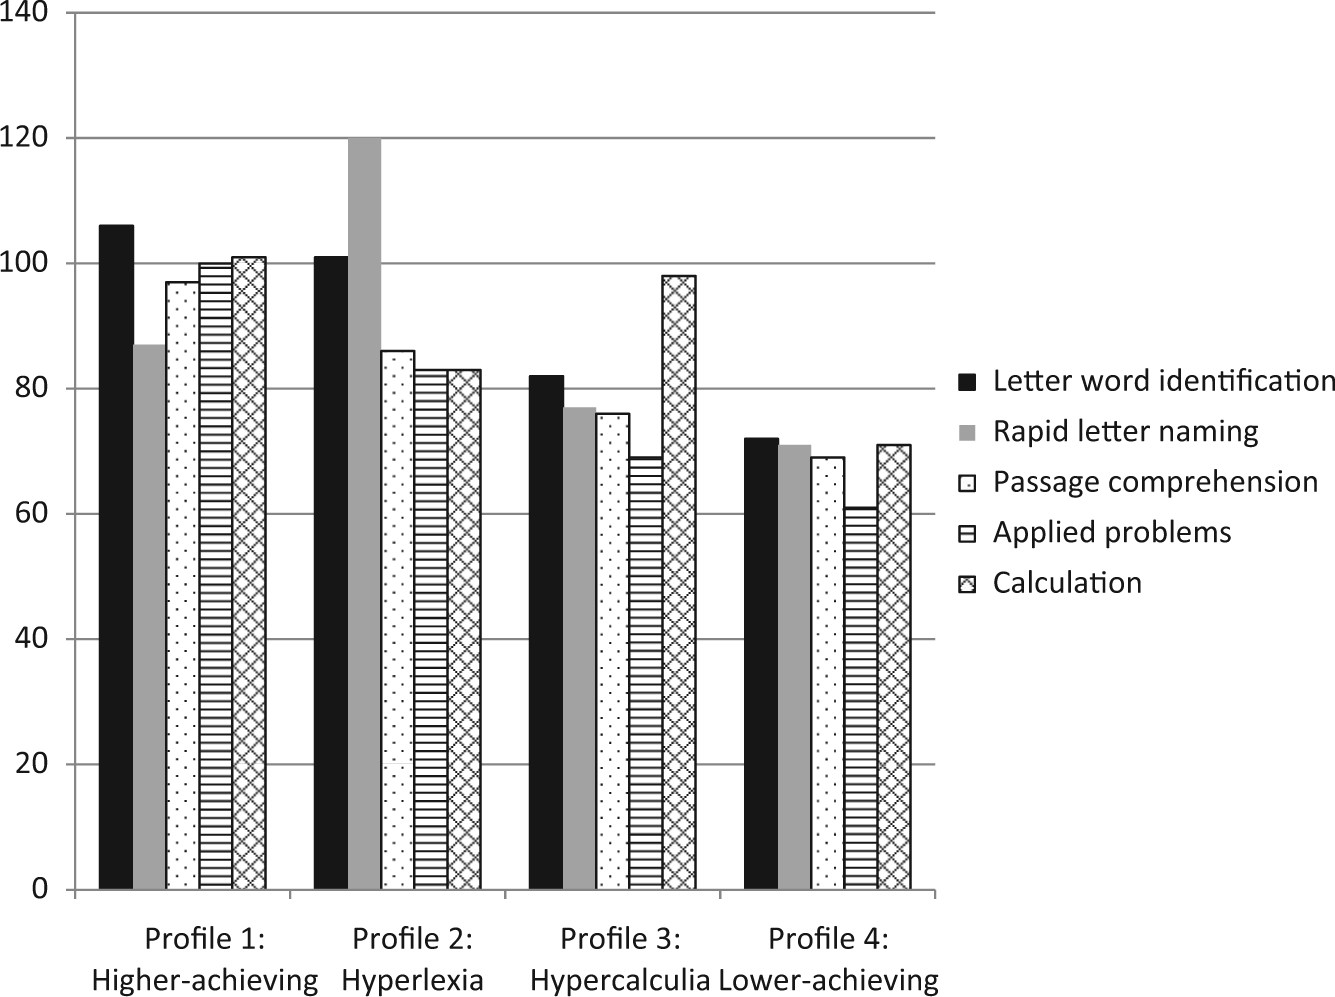
Reading and math achievement profiles expressed in mean standard scores for children with an autism spectrum disorder.
The means and standard deviations of achievement scores for each profile at each wave are summarized in Table 1. Using ANOVA and chi-square tests, significant differences in academic achievement; functional cognitive, social and conversational skills; and demographics across the four profiles were identified. The “higher-achieving” children with Profile 1 scored around the national average on LWI, PC, AP and Calculation, but slightly lower (−0.87 standard deviation) on RLN. Thus, we define this group as children with average achievement, as indicated on all five standardized achievement tests. The second profile, “hyperlexia,” consisted of children who also scored at the national average on LWI and scored 1.27 standard deviations above the national average on RLN, but scored about 1 standard deviation below the national average on PC, AP and Calculation. This subgroup showed superior speed in letter naming but not in reading comprehension or other skills. Children with the third profile, “hypercalculia,” scored close to the national average on calculation skills but scored at least 1 standard deviation below the national average on the other four dimensions. The last profile, “lower–achieving,” characterized children who scored about 2 standard deviations below the national average on all five dimensions of achievement.
Characteristics of children with an ASD, by reading and math achievement profiles at Waves 1–3.
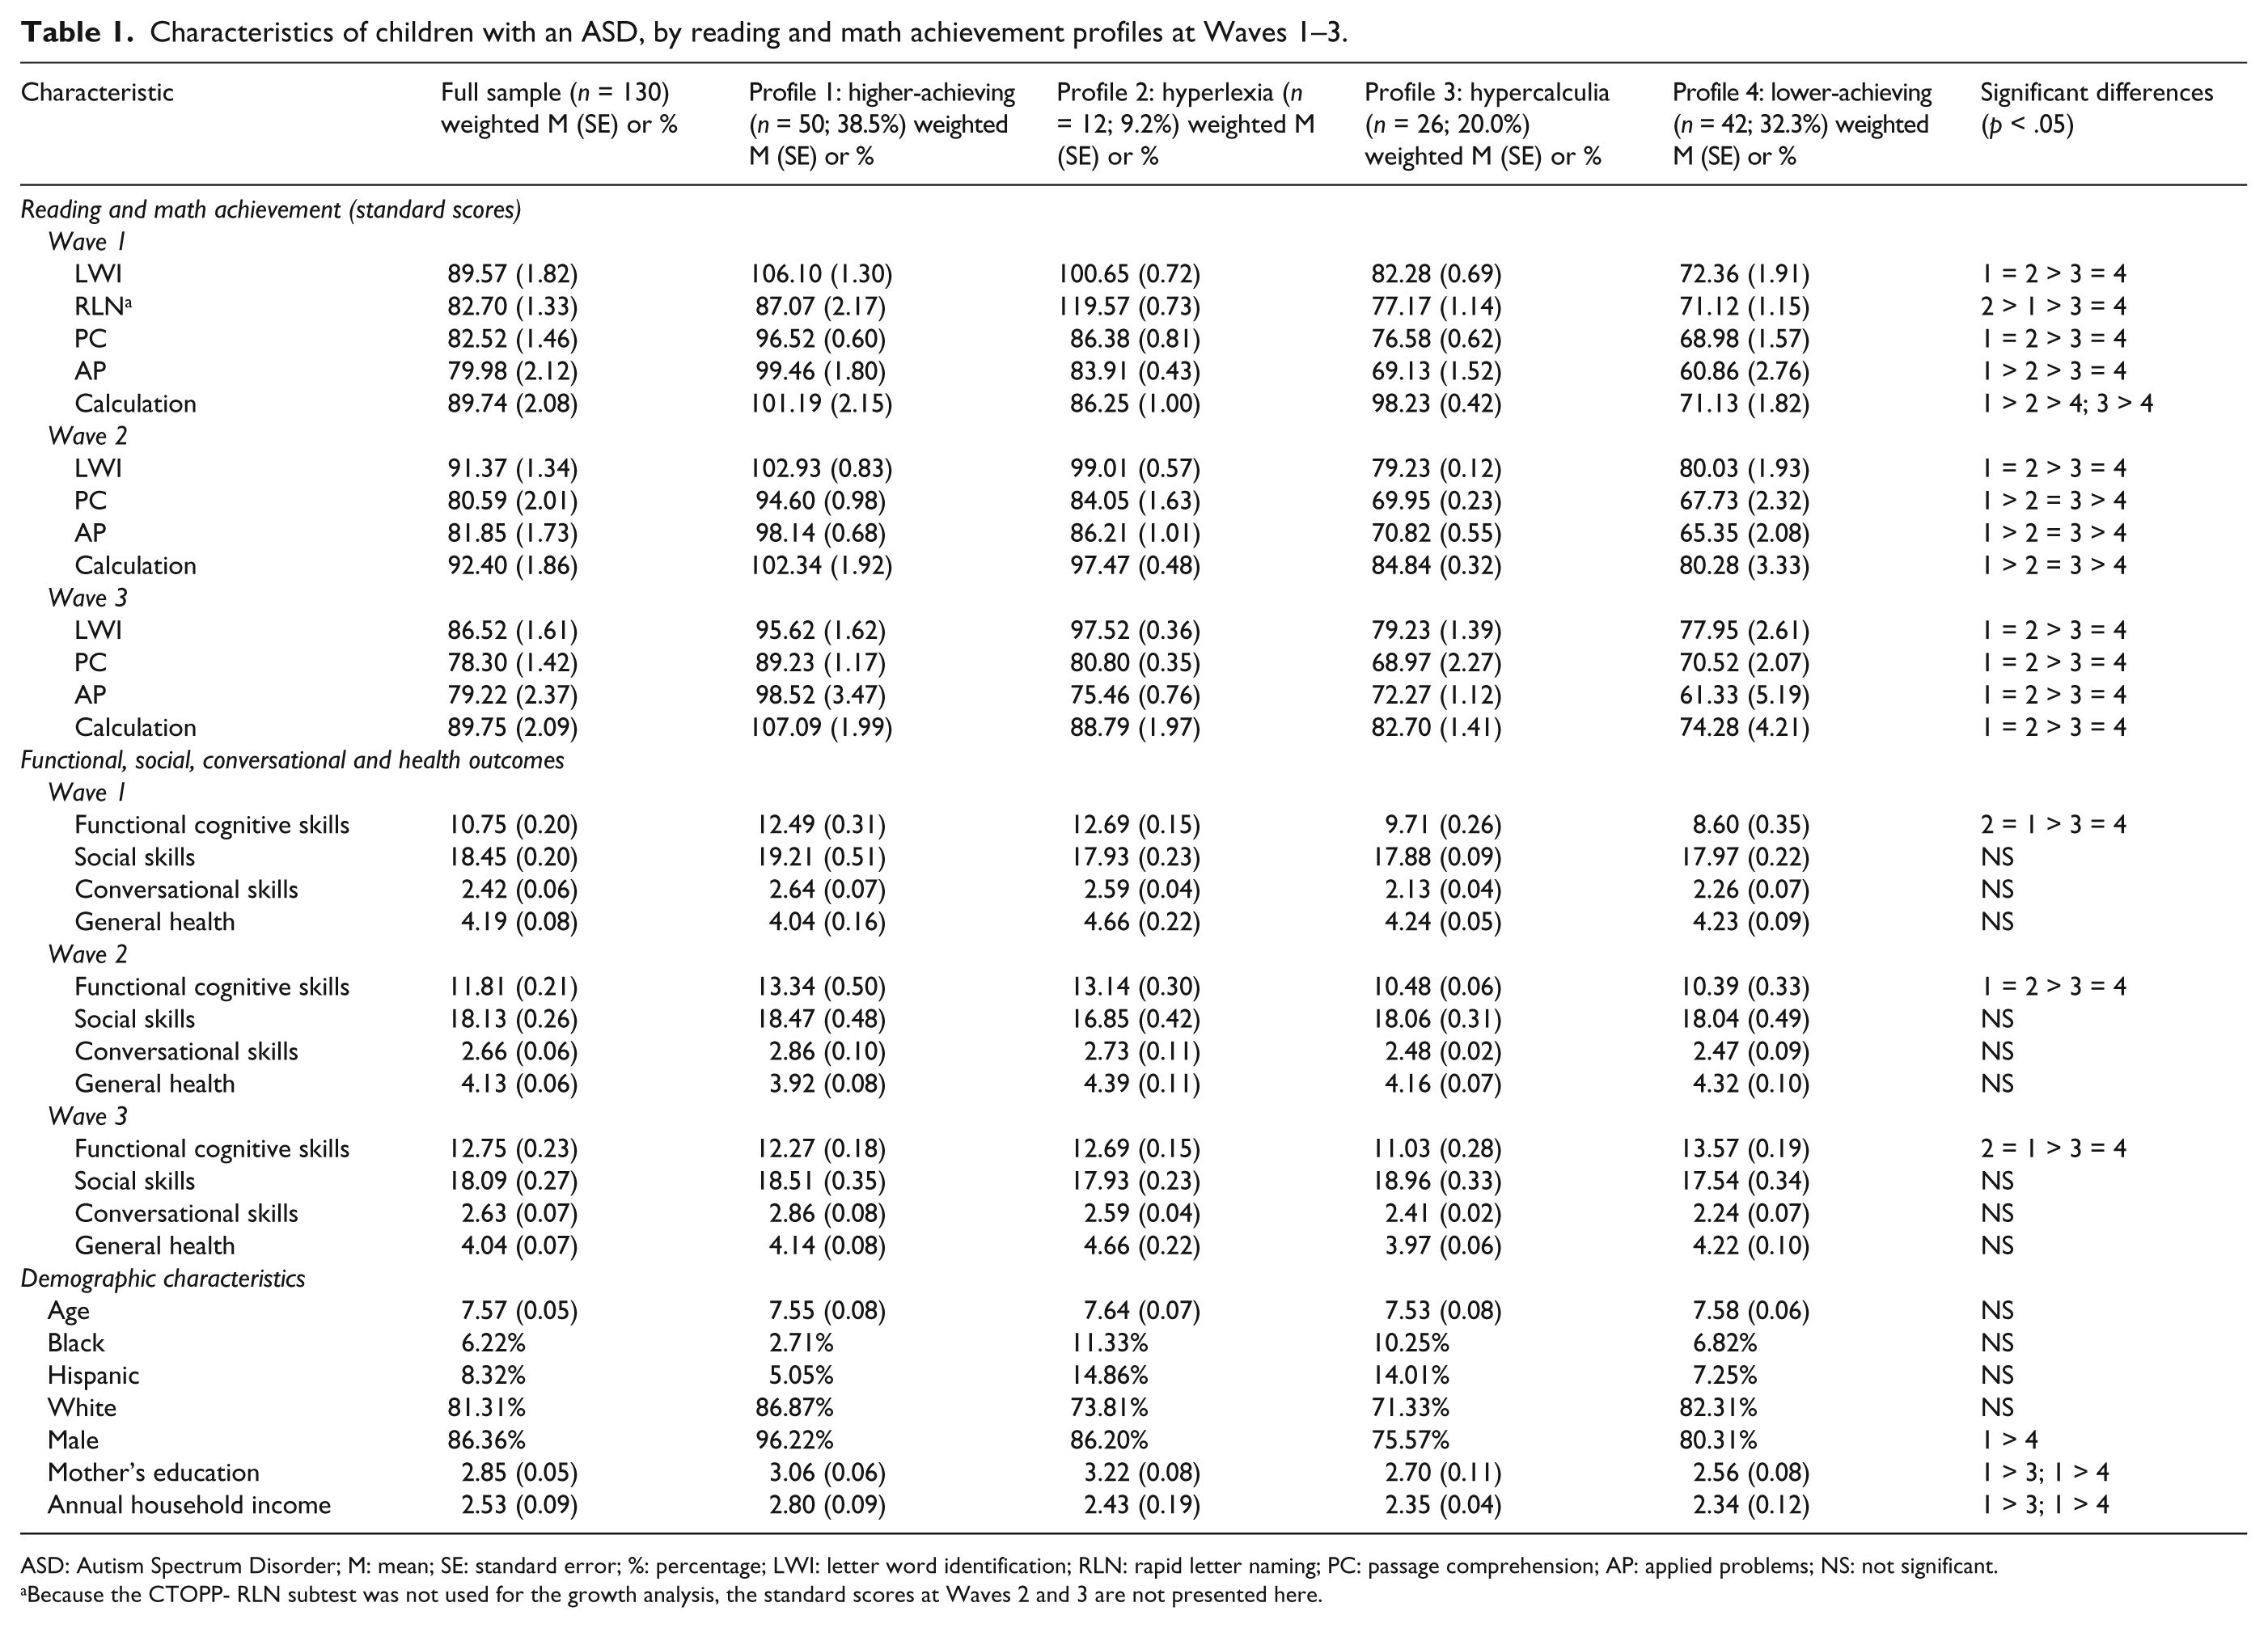
ASD: Autism Spectrum Disorder; M: mean; SE: standard error; %: percentage; LWI: letter word identification; RLN: rapid letter naming; PC: passage comprehension; AP: applied problems; NS: not significant.
Because the CTOPP- RLN subtest was not used for the growth analysis, the standard scores at Waves 2 and 3 are not presented here.
Results of ANOVA showed that children with higher-achieving and hyperlexia profiles scored significantly higher on achievement scores than those with hypercalculia or lower-achieving profiles at Wave 1 (see last column in Table 1). The advantages in achievement scores for the former two groups over the latter two groups persisted over time at Waves 2 and 3. Children with an ASD lost ground in their comprehension skills over time, as demonstrated by the decrease in PC standard scores across all four profiles. A reduction in calculation skills over time for the hypercalculia group shows that this group lost its advantage in this skill area over time.
In addition to their differences in academic abilities, children with the four profiles also differed significantly in some other skill levels and demographic characteristics (Table 1). Consistent with their pattern of academic achievement, children with higher-achieving or hyperlexia profiles had higher functional cognitive skills than those with hypercalculia and lower-achieving profiles. The higher-achieving group had a higher proportion of boys, mothers with bachelor’s or higher degrees, and higher annual household incomes than the hypercalculia or lower-achieving groups. However, no significant differences were found across the four profiles on social or conversational skills, health, or other demographic characteristics.
Growth trajectories by profile
Academic growth trajectories
Table 2 presents the HLM results for estimating growth trajectories in academic achievement. The coefficients of fixed effects indicate the relationship between the predictors and the level and slope of growth. The estimates of the random effects proportion of the model are presented at the bottom of the tables. The significant slopes on AP but not on the other three measures indicate that the AP skills of students with the lower-achieving profile grew significantly over time. Higher-achieving students and those with hyperlexia had significantly higher LWI, PC, AP and Calculation scores than the lower-achieving group at Wave 1, which is similar to the ANOVA results; the hypercalculia group also had significantly higher Calculation scores than the lower-achieving group at Wave 1. When examining the rate of change from Wave 1 to Wave 3, lower-achieving children grew faster in LWI than children with the higher-achieving profile, and lower-achievers’ calculation skills also grew significantly faster than those with hypercalculia. Any lack of difference in slopes (e.g. for AP scores across the four profiles or for LWI and PC scores between the hyperlexia and lower-achieving profiles) suggests that achievement gaps between students with those profiles remained essentially the same from Waves 1 to 3. In terms of how demographic characteristics were associated with the academic growth trajectories, older children with an ASD had higher AP scores than their younger peers, and African American children with an ASD grew more slowly on PC than their White peers.
Hierarchical linear modeling (HLM) models of reading and math growth trajectories for children with an ASD.
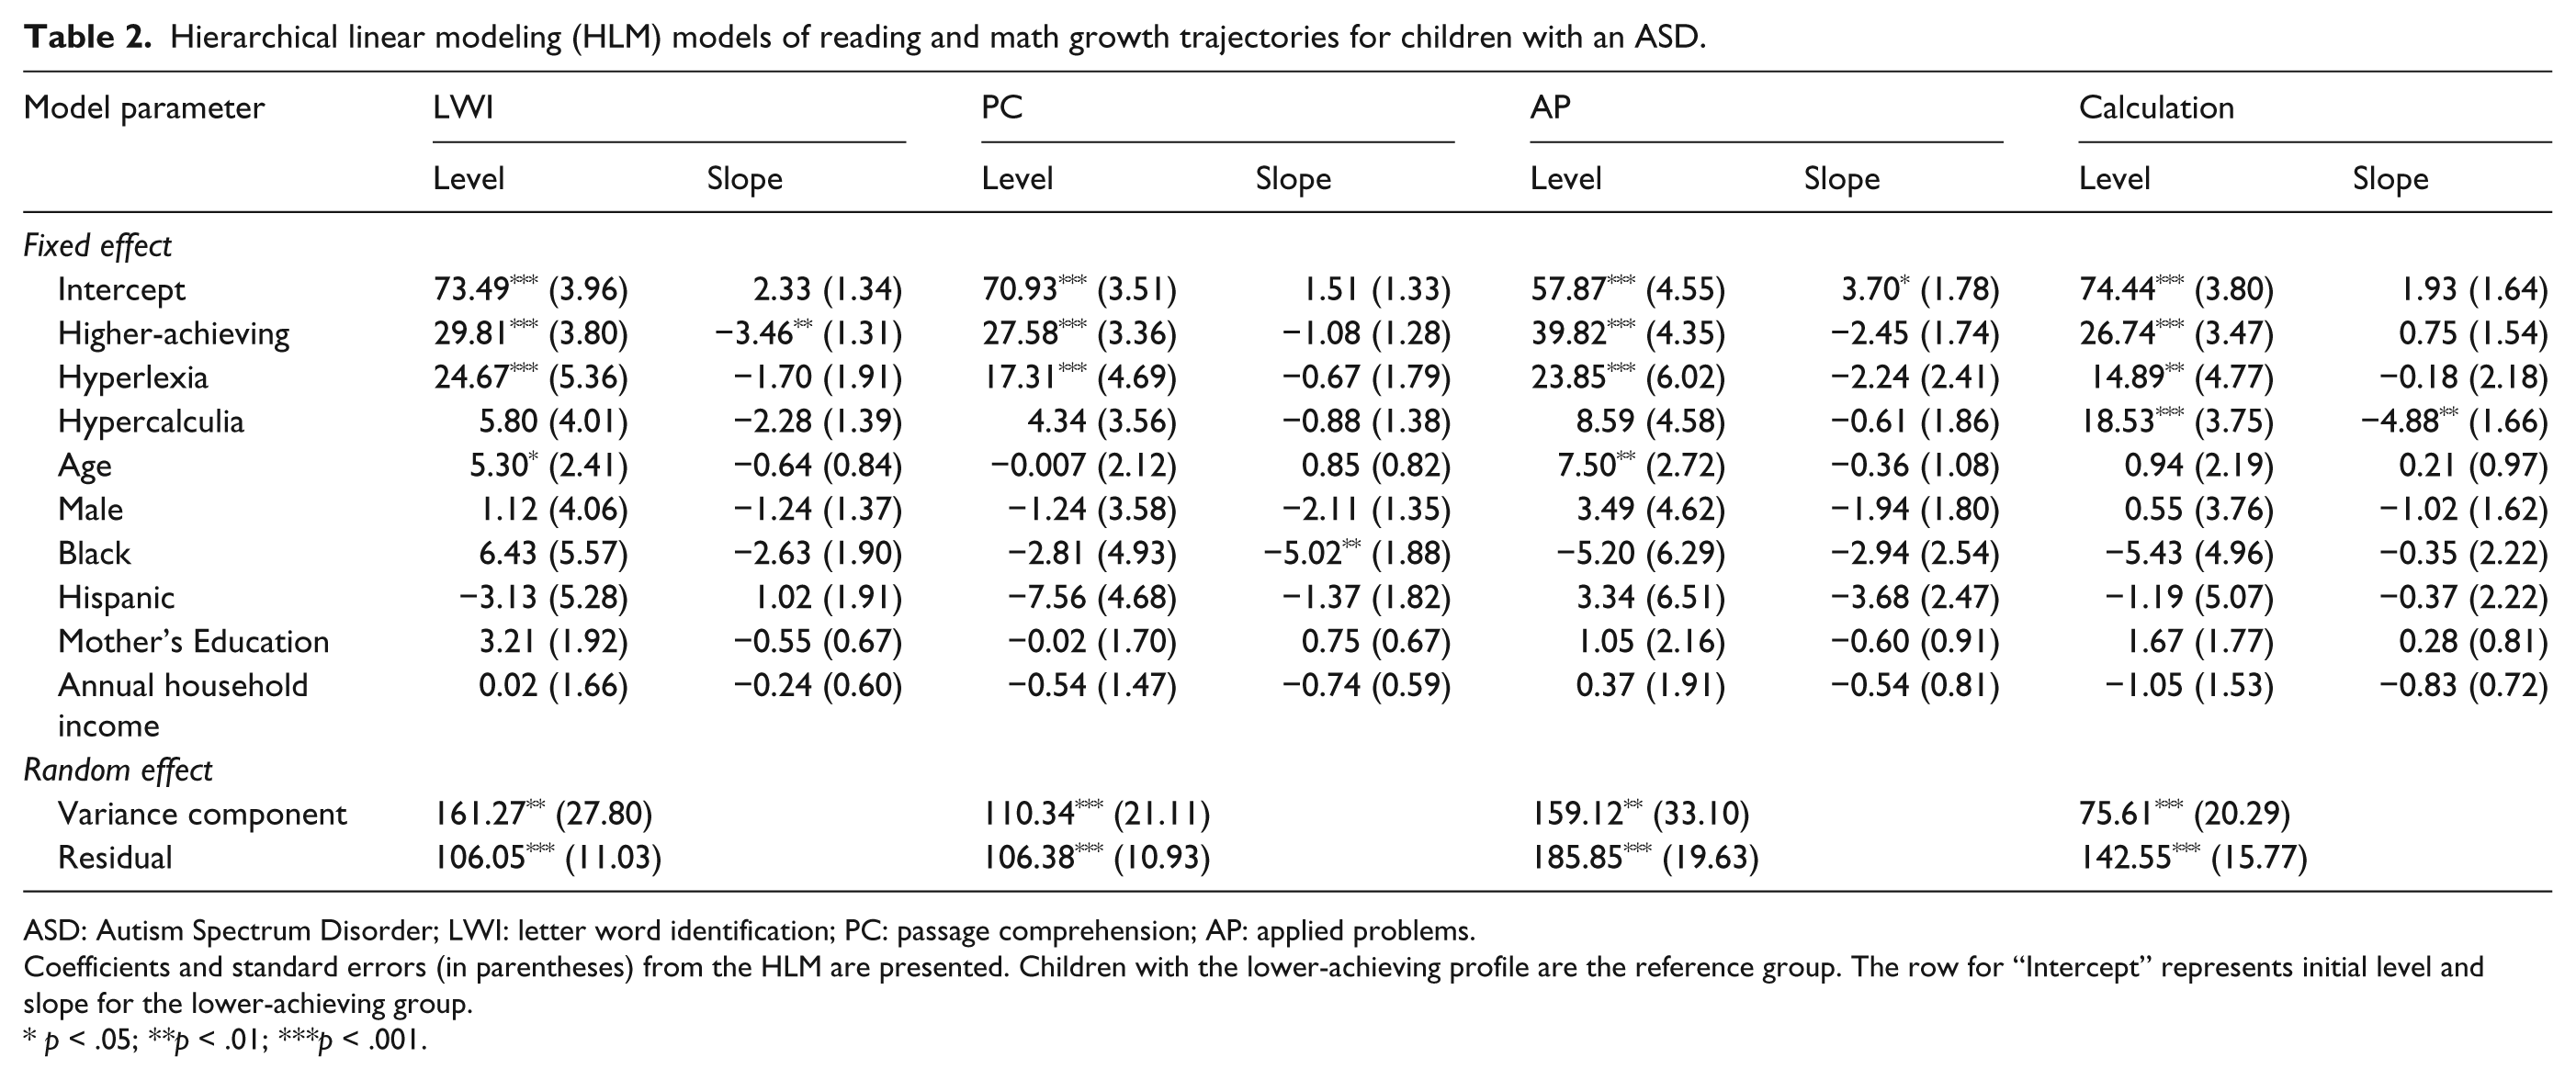
ASD: Autism Spectrum Disorder; LWI: letter word identification; PC: passage comprehension; AP: applied problems.
Coefficients and standard errors (in parentheses) from the HLM are presented. Children with the lower-achieving profile are the reference group. The row for “Intercept” represents initial level and slope for the lower-achieving group.
p < .05; **p < .01; ***p < .001.
Growth trajectories in other skills
The functional cognitive skills of lower-achieving children grew significantly over time, but other outcomes did not (Table 3). While focusing on the differences on slopes, we found that the hypercalculia group grew significantly slower than the lower-achieving group, and the hyperlexia group grew more slowly than lower-achieving children in their conversation ability. No profile differences were found in either level or slope on the social skills and health outcomes. We found that older children with an ASD had higher functional cognitive skills, but they grew more slowly than their younger peers. Boys had lower social skills than their female peers and the male disadvantage in social skills persisted over time. Black children grew more slowly in functional cognitive skills than their White peers. Children of mothers with higher education levels tended to grow faster in social skills but slower in their general health condition.
Hierarchical linear modeling (HLM) models of functional cognitive, social, conversational and health outcome growth trajectories for children with an ASD.
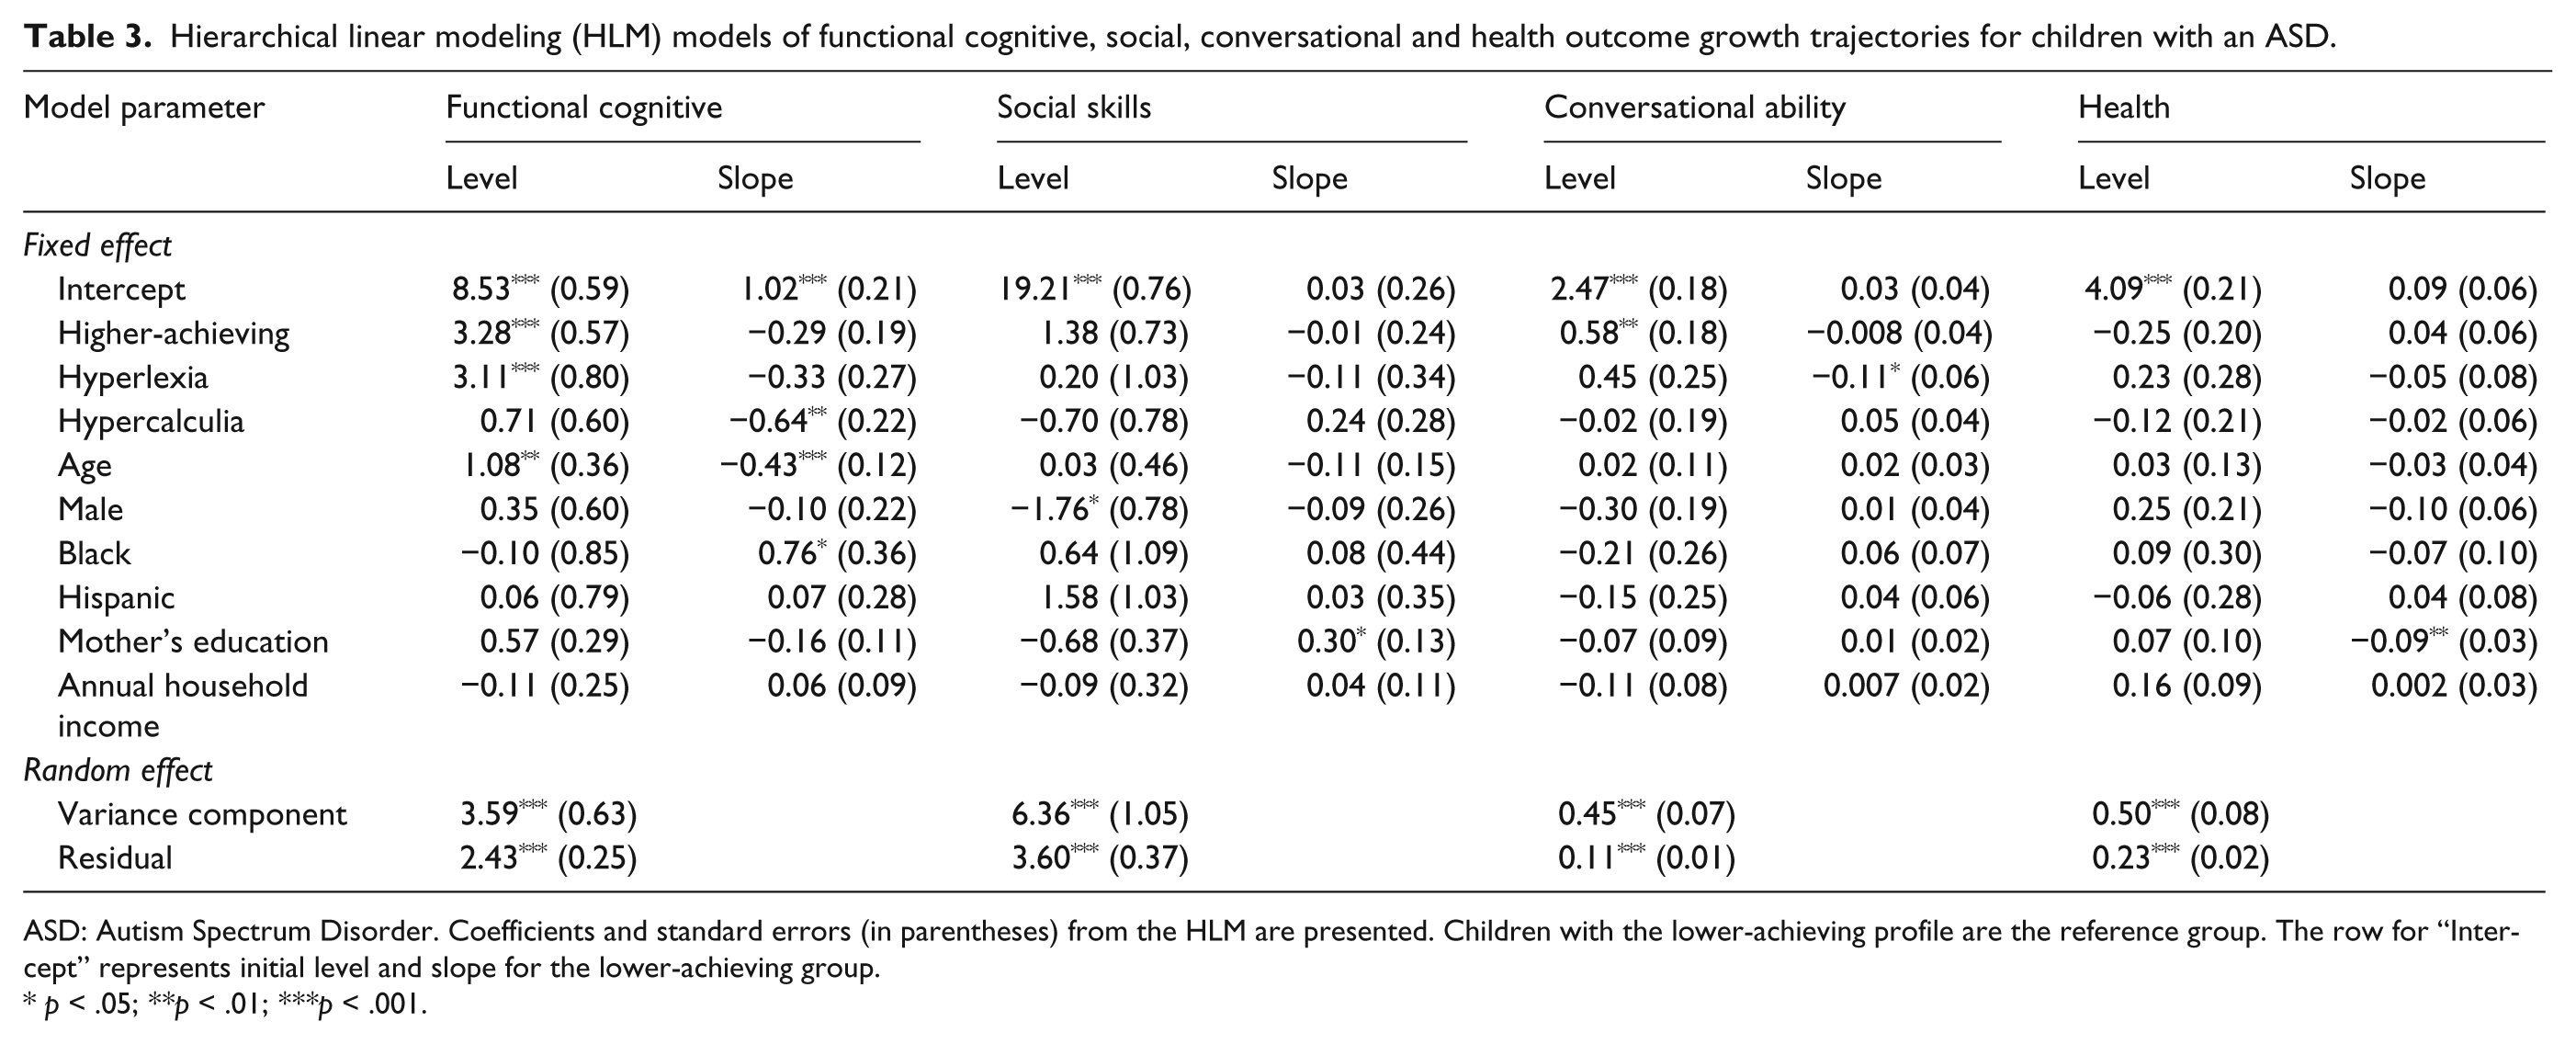
ASD: Autism Spectrum Disorder. Coefficients and standard errors (in parentheses) from the HLM are presented. Children with the lower-achieving profile are the reference group. The row for “Intercept” represents initial level and slope for the lower-achieving group.
p < .05; **p < .01; ***p < .001.
Discussion
This study demonstrates the heterogeneity of the academic achievement of children with an ASD who were able to take a standardized test of their reading and math abilities. When we examined the average scores of the full sample, the ASD group was about 1 standard deviation below the national average for children in the general population on all five measures of academic achievement. However, when we compared individual performance across the five measures, children with an ASD showed four quite different achievement profiles: higher-achieving, hyperlexia, hypercalculia and lower-achieving.
The 38.5% of children with the higher-achieving profile performed around the national average of children in the general population on all academic outcomes except RLN. These results are similar to previous findings showing that those with high-functioning autism (HFA) had average math and nonword reading skills (Church et al., 2000; Griswold et al., 2002; Mayes and Calhoun, 2003; Minshew et al., 1994). However, we did not find higher-achieving students to exhibit lower passage comprehension skills, which differs from previous studies on HFA.
The hyperlexia prevalence (9.2%) was somewhat higher than the 6.6% rate suggested by Burd et al. (1985), but lower than the 20.7% rate reported by Grigorenko et al. (2002), both of which used clinical samples of persons with an ASD. Our finding goes beyond existing literature and suggests that those with the hyperlexia profile do well on decoding but comprehend text poorly. More interestingly, they had an exceptional speed of retrieval of letters from long-term memory and the production of word sounds (measured by rapid letter naming).
We found that 20% of the children with an ASD fit the hypercalculia profile, which was higher than the 16% prevalence rate that Jones et al. (2009) reported. The hypercalculia group scored at about the national average on Calculation, but at least 1 standard deviation below the national average on the other four achievement tests. Children with the lower-achieving profile constituted nearly one-third of the ASD population represented in this study; yet, relative to the hyperlexia literature, research focusing on this group is sparse.
When examining the functioning and demographic differences across the four profiles, the higher-achieving and hyperlexia groups had significantly higher functional cognitive skills than the other groups, consistent with their higher academic achievement. The higher-achieving group also had significantly better-educated mothers and came from higher-income households, which again indicates the heterogeneity of the ASD group and the association between child achievement and socioeconomic status. However, no significant differences were found on social or conversational skills or health status across the four profiles.
The findings show that children with all four profiles lost ground in PC over time, which emphasizes the importance of including extra reading comprehension instruction in the individualized education programs (IEPs) for such students. Furthermore, although the higher-achieving group had higher academic achievement scores and functional cognitive skills than many other children with an ASD, the fact that their LWI grew more slowly than others suggests that more intensive supports for acquiring reading skills may be needed for this group if they are to maximize their academic abilities. Similarly, the relatively low growth in conversational skills of the hyperlexia group and low calculation skills growth of the hypercalculia group suggest specific academic areas that educators could focus on to improve the outcomes of these children.
There are several limitations to consider when interpreting these findings. First, although this study used a national dataset, the analysis sample was restricted to 34% to 46% of children with an ASD who participated in standardized assessments. The rest of the children with an ASD had an alternative assessment completed for them by a knowledgeable adult because of their lack of a consistent mode of response to assessors’ questions or their inability to work with the assessor, who frequently was unknown to the child. Because the results of this study are based on children with an ASD who were able to take the standardized assessment, their academic performance is likely to be higher than that of the population of children with an ASD as a whole. Second, this study does not have a typically developing comparison group. Third, previous studies of children with an ASD identified academic achievement scores that were highly discrepant from their intelligence by measuring the difference between achievement and IQ test scores (Estes et al., 2011; Jones et al., 2009). Because SEELS did not assess students’ IQ, we chose to compare the standard scores in four academic achievement areas to identify skills discrepancies between children with an ASD and those in the general population. Thus, the results of this study are not directly comparable to previous findings that used IQ as a standard for defining discrepancies in ability. Fourth, a limitation of the SEELS dataset is that clustering of children in schools was not provided. Three-level HLM (three observations nested in children and children nested in schools) is optimal, but not possible to conduct. Finally, this study did not track growth into middle school or high school. It is likely that the strengths of hyperlexia and hypercalculia are associated with the emphasis in decoding and calculation in early elementary grades. Future studies are needed to replicate the results of this study using an older age group.
Despite these limitations, our findings represent one of the first studies to consider the heterogeneity in the academic, functioning, social, conversational and health outcomes of children with an ASD and their growth pattern over time. The implications of these profiles are not solely focused on the difficulties or deficits that need to be addressed through appropriate interventions; the profiles also support a move to a more strengths-based approach toward research on individual with autism (Robertson, 2010). While interventions for children with an ASD largely focus on social and skills-based learning (Kurth and Mastergeorge, 2010), these results suggest the need for more research to better understand and support the academic achievement and development of these children. Future studies should consider the specific kinds and combinations of interventions that are most effective at improving the communication and applied skills as well as the academic achievement of children with different academic achievement profiles.
Footnotes
Funding
This research was supported by Grant R324A120012 from the U.S. Department of Education, Institute of Education Sciences and Grant HRD -1130088 from the National Science Foundation. Its contents are solely the responsibility of the authors and do not represent the positions and policies of the funding agencies.