
Abstract
Trajectories of expressive language development are highly heterogeneous in autism. Yoder et al. found that parental responsiveness, child response to joint attention, child communicative intent and consonant inventory were unique predictors of expressive language growth in minimally verbal preschoolers 16 months later (n = 87). This study applied these predictors to an independent sample, over a 12-month period (n = 27). A broader measure of phonetic repertoire, combining reported, elicited and observed speech sounds, was included to further understand the contribution of speech production skills. Expressive language growth was highly variable: 65% remained minimally verbal at mean age 5;2, while 7% gained over 340 words. Contrary to expectations, communicative intent, parent responsiveness and response to joint attention were not found to predict expressive language growth or outcome. In contrast, both consonant inventory and phonetic repertoire were significant predictors (adjusted R2 = 0.29 and 0.45). These results underscore the contribution of speech production abilities to expressive language development in this population, which may reflect an additional deficit rather than a consequence of core autism symptoms. Future work should include those with the most persistently limited expressive language, so that findings can be generalized and additional barriers to communication identified and addressed.
Lay abstract
What is already known about the topic?
Language skills vary enormously in autism: while some autistic individuals can engage in sophisticated conversations, many remain minimally verbal, meaning they use few or no words regularly for communication. We do not know what causes this variation, but we do know that certain child and family characteristics can be measured when a child is young, and this information can improve our prediction of how expressive language might develop over time.
What this article adds?
We examined four characteristics, which have already been found to predict language development in young minimally verbal autistic children. We followed the expressive language progress of 27 minimally verbal children, aged three to five, for a year. One-third no longer met the minimally verbal criteria at the end of the study. In this sample, only one factor predicted language progress, which was the child’s initial speech skills (the number of different speech sounds that the child made during an interaction). This finding adds to the evidence that speech skills contribute to language development in autism. In some cases, persistent and severe expressive language difficulties may reflect an additional deficit in speech production, rather than a consequence of core autism features.
Implications for practice, research or policy
Our findings suggest that there are factors other than social skills that influence language development in autism. Careful assessment of speech production should be considered when language does not develop as expected. Future research should evaluate speech skills interventions for minimally verbal autistic individuals, as well as promoting the use of alternative communication systems.
Keywords
Introduction
Along with repetitive behaviours and restricted interests, limitations in verbal and non-verbal communication are part of the diagnostic criteria for autism spectrum disorder (ASD); however, only pragmatic language difficulties are considered a unifying ‘core’ feature (Lord & Paul, 1997). In contrast, trajectories of structural language development (phonology, lexicon, syntax) are highly heterogeneous in autism (Boucher, 2012). Trajectories show greatest variability prior to age six (Pickles et al., 2014), though development of functional speech by age five is one of the strongest predictors of positive outcome in adulthood (Howlin, 2005). Therefore, identifying early risk and protective factors for expressive language is important for identifying intervention targets and understanding individual differences in language outcome.
Research has belatedly begun to focus on the estimated 25% of autistic individuals 1 who remain minimally verbal beyond school age (Lord et al., 2004; Norrelgen et al., 2014). ‘Minimally verbal’ describes those with very limited ‘useful’ speech (i.e. speech used in a frequent, communicative, non-imitative and referential way, Yoder & Stone, 2006). Tager-Flusberg et al. (2009) depicts a ‘pre-verbal’ phase of language development and multi-dimensional criteria to define the transition to the ‘first words’ phase. Kasari et al. (2013) suggest that for research purposes, the definition of minimally verbal should be a vocabulary size of 20 words or fewer, and this definition has been used in previous longitudinal investigation by Yoder et al. (2015).
Several prospective and retrospective studies have evaluated the contribution of empirically tested and theoretically motivated predictive variables to early expressive language growth in autistic children. Expressive language is either a continuous outcome variable (e.g. vocabulary size) or a categorical one (e.g. acquisition of phrase speech). One type of prospective study tracks infants from an early age, who have higher than usual chance of receiving an autism diagnosis, due to having an autistic sibling. This method has the advantage of exploring prodromal development; however, it can result in cohorts with very diverse diagnostic profiles and expressive language skills. Another prospective approach is to establish a more homogeneous cohort of young children, who meet autism diagnosis and minimal language criteria (e.g. Yoder et al., 2015). If one is particularly interested in what drives and sustains expressive language difficulties for certain children, it is important to establish a relevant and homogeneous cohort, recognizing that predictors may vary in influence according to a child’s age and stage of development.
It is likely that a variety of early observable factors, both child-related and environmental, feed into language abilities in autism in an interactive fashion during the course of development. Positive correlations have been found between later expressive language and earlier attention to speech, joint attention, receptive language, communicative intent, imitative and non-imitative motor skills, play skills, speech production abilities as well as various features of the input (Yoder et al., 2015).
A common problem in longitudinal studies of language is that many of the putative predictors are highly inter-correlated, making it difficult to isolate causal mechanisms. In a bid to address this, Yoder et al. (2015) undertook a 16-month longitudinal study to isolate value-added predictors of expressive language growth in minimally verbal autistic preschoolers (mean age 2;11, n = 87). The approach tested nine predictors, identified from the literature as well as two background variables (autism symptom severity and cognitive impairment). Value-added means that the correlation between predictors is taken into account during model selection. Predictors retained in the model were parental responsiveness, child response to joint attention, child communicative intent and consonant inventory.
The rationale for a causal role for the first three of these predictors has been extensively explored, and due to their perceived ‘malleability’, they have been included as core developmental targets in early interventions (e.g. Carter et al., 2011; Green et al., 2010; Kasari et al., 2014).
Less is known about the role or malleability of consonant inventory, which indexes speech production ability. Pre-verbal speech skills predict later expressive language in typical development (McGillion et al., 2017). A growing literature also suggests that early vocal development difficulties may strongly impact spoken language development in autism. Young autistic children make fewer speech-like vocalizations relative to typically developing peers (Plumb & Wetherby, 2013; Warlaumont & Oller, 2014). Investigations of infant siblings of autistic children (who have a higher chance of obtaining an autism diagnosis) also indicate early differences in vocalization rate and quality (Chenausky et al., 2017; Patten et al., 2014; Paul et al., 2011). A recent meta-analysis concluded that pre-verbal vocalizations are correlated with concurrent and later expressive language in young autistic children (weighted effect size of r = 0.50, McDaniel et al., 2018).
The reasons behind limited vocal development in some autistic individuals are yet to be fully elucidated. The speech attunement theory (Paul et al., 2013) suggests that it is the failure to attend to others’ verbal output (‘tune in’), combined with limited motivation to interact and thus practice their own speech production (‘tune up’), that results in some autistic children’s poor expressive language development. This view links expressive language development to core autism features rather than a speech-specific difficulty. Empirical evidence for this theory comprises studies which show that although vocal development is often delayed in autism, phonetic development is in line with overall language development and does not follow an atypical trajectory (e.g. Shriberg et al., 2011). However, Shriberg et al. (2011) selected a sample that would not include the most severely speech impaired children (fluent language production and mental age above four), making it difficult to generalize these findings across the autism spectrum.
Another hypothesis is that reduced consonant inventory reflects the presence of a speech-motor comorbidity, which would constitute an additional barrier to developing expressive verbal language. Motor and imitation problems have been observed to occur early in autism (e.g. Zwaigenbaum et al., 2013). Early motor skills and later communication abilities have been linked in prospective (Bhat et al., 2012; LeBarton & Landa, 2019) and retrospective studies (Mody et al., 2017). Gernsbacher et al. (2008) found a significant relationship between infant and toddler oral and manual imitation skills and later language outcome in autism. Stone et al. (1997) found that not only were autistic toddlers more impaired in the ability to imitate body movements than developmentally matched clinical controls, but this skill predicted speech development 14 months later. Pecukonis et al. (2019) found that manual imitation skills predicted concurrent expressive language in minimally verbal autistic children and adolescents (n = 37), while play and joint attention skills were not significant predictors.
A more specific oral motor dysfunction could contribute to speech delays in some autistic children (Adams, 1998). Belmonte et al. (2013) described a subset of autistic children whose receptive language outpaced their expressive skills, and these same children also had marked initial and ongoing oral-motor difficulties. Tierney et al. (2015) observed high comorbidity of autism and apraxia in a clinical sample (of 11 autistic individuals, seven also met criteria for apraxia of speech). Smith et al. (2007) found verbal imitation ability (scored simply as present or absent) significantly predicted later language milestones.
Further study is warranted to investigate the role of early speech production abilities in expressive language development. Speech production abilities are typically indexed by a consonant inventory taken from a communication sample, but this method may not be appropriate across the spectrum of verbal ability. When a skill is emerging, it is advantageous to incorporate various sources of reporting (observation, parent report, experimental measures, Broome et al., 2017). If a child does not enjoy interacting with experimenter, the consonant inventory may underestimate the child’s true competencies. Consonant inventories from brief samples may also be unreliable (Van Severen et al., 2012). Thus, a parent reported measure of communicative sound production may be helpful. Given previous findings regarding predictive value of presence/absence of verbal imitation, a measure that includes elicited sounds could also facilitate a fuller picture of a child’s speech skills. Combining these approaches in a composite would aim to reduce error by measuring speech skills from multiple angles.
Auditory processing and speech perception difficulties may also be atypical in autism and could be another source of variance in language outcomes (Boucher, 2012; Haesen et al., 2011; Kujala et al., 2013). This hypothesis is difficult to test in young minimally verbal autistic children; however, several studies have done so using event-related potentials mismatch paradigms. Key et al. (2016) compared event-related potentials of age-matched autistic (n = 24) and typically developing children (n = 18). They found reduced consonant differentiation in the autistic group, which was correlated with degree of discrepancy between verbal and non-verbal skills. Matsuzaki et al. (2019) used an oddball paradigm with vowel stimuli to examine mismatch fields in 84 typically developing and autistic children, some of whom (n = 9) were minimally verbal. Degree of delayed auditory discrimination correlated with language skills.
This study aims to apply Yoder et al.’s (2015) findings to an independent sample over a 12-month period, and to further explore the possible link between speech production abilities and later language development in a group of minimally verbal autistic preschoolers. Specifically, we compare the predictive power of a multi-faceted speech skills composite and a novel alphabet knowledge measure, with that of consonant inventory alone. We use the value-added predictors identified by Yoder et al. (2015) as a starting point, rather than seeking to re-evaluate their value-added nature.
Methods
A longitudinal correlational design was used to evaluate early predictors of later expressive language growth in a group of minimally verbal autistic preschoolers. The experiment design, hypotheses and analysis plan were pre-registered prior to data collection on https:// https://osf.io/x2wcg. The pre-registered protocol was followed except where specified below.
Participants
Recruitment took place over a 7-month period. Twelve children were recruited via social media, referrals from independent professionals, specialist nurseries and units. A further 20 participants were recruited via the Autism Spectrum Database UK (ASD-UK) research database, an agency who help recruit autistic participants for research projects in the United Kingdom (http://www.asd-uk.org).
Ethical approval was obtained from the University College London (UCL) Research Ethics Committee (Project ID 9733/001) and informed written consent was sought from parents on behalf of each participant.
The flow chart in Figure 1 demonstrates how the sample of 27 participants was reached from initial enquiries from 52 families.

Recruitment flow chart.
Participants were aged 2–5 years at intake, had a confirmed diagnosis of ASD and presented at Time 1 as minimally verbal, defined here as fewer than 24 spoken words as reported by parents. Four participants displayed significantly more words and phrases at Time 1 (both observed and by parent report) and were thus excluded from the main analysis. A further participant was excluded from analysis due to providing dependent variable data for only 1 time-point. The following exclusions were also applied: epilepsy; known neurological, genetic, visual or hearing problems; and English as an additional language.
Our original protocol stated that we would include participants with fewer than 20 spoken words by parent report, which is in line with Kasari et al. (2013) and Yoder et al. (2015). However, this criterion was expanded to 24 words in order to include three participants with 21, 22 and 23 reported words, respectively, in order to maximize sample size. Each of these ‘borderline’ children also only uttered up to five different words during the 20-min Communication and Symbolic Behavior Scales (CSBS) language sample, which provided an additional check on expressive language status and is consistent with participant language use in Yoder et al. (2015). These ‘borderline’ children would still qualify as having a small repertoire of words and phrases (Kasari et al., 2013) and meet the definition of preverbal language stage (Tager-Flusberg et al., 2009).
At Time 1, our final sample thus comprised 27 children (male: 21, female: 6), who were aged between 35 and 62 months (M = 50, SD =7.6). This is approximately 15 months older than the Yoder et al. (2015) sample, who were aged 20–47 months (M = 35, SD = 7). This is an unintended consequence of the difficulties recruiting this sample in the UK context: our original protocol targeted 40 participants, aged 24–48 months.
Parents reported 24 participants to be White, one to be Black, one to be Asian and one to be Mixed Race. The formal education levels of the primary caregivers were distributed as follows: 11 completed high school, eight completed university education and eight completed post-graduate studies or equivalent. Additional descriptive information on participants is provided in Table 2.
Variables
Variables were divided into background variables, predictor variables and a dependent variable, as shown in Table 1. The background variables merely serve to characterize the sample and were not entered into the statistical model. For further description of data transformation criteria see ‘anticipated data transformations’ below.
Variables.

CARS: Childhood Autism Rating Scales; CDI: Communicative Development Inventory; CSBS: Communication and Symbolic Behavior Scales; NVIQ: nonverbal intelligence quotient; ESCS: Early Social Communication Scales; Time 1, 2, 3 and 4 separated by 4 months (M = 4.1; SD = 0.4).
Alternative phoneme measures
Phonetic repertoire
At Time 1, three additional measures of speech sound repertoire were taken, in order to compare their combined predictive power versus consonant inventory alone. These comprised Observed Phoneme Inventory (derived from CSBS language sample, Supplemental Material A), parent reported core phonemes used communicatively (derived from Reported Phonemes questionnaire in Supplemental Material B) and Elicited Phonemes, which used a procedure adapted from Kaufman Speech Praxis Test (Kaufman, 1995) to determine participants’ existing echoic repertoires with single phonemes (e.g. /m/).
Alphabet and phonics knowledge
To accurately measure speech perception skills in this cohort would require a laboratory visit and ample testing time. Instead the child’s ability to receptively identify different speech sounds using a letter/sound, recognition paradigm was measured at Time 1, in order to determine whether an ability to link sounds with letter mappings may act as protective factor for expressive language growth. The child was asked to give the experimenter one of three letter cards upon hearing either a corresponding phonics sound or a letter name as part of a counterbalanced pre-determined sequence (see Supplemental Material C). Scores were translated into a percentage of trials completed. This variable was added to the test battery as an exploratory measure, despite confounds with prior print exposure and global attention skills.
Procedure
Data were collected in children’s homes in four sessions separated by 4 months each as summarized in Figure 2. A £5 gift voucher was provided to each child following each visit. Predictor and background variables (including the Childhood Autism Rating Scales (CARS)) were taken at Time 1 apart from the nonverbal intelligence quotient (NVIQ) measure which was carried out on Time 2 to accommodate the limited concentration span of participants. Additional demographic information was gathered at Time 1 (see Supplemental Material D for Family Background Questionnaire). At each visit, the dependent variable, Oxford CDI words spoken, was completed by parents. This is a UK adaptation of the MacArthur-Bates CDI measure (Fenson et al., 2007). In addition, at each time-point parents completed a Therapy Questionnaire detailing the type and amount of weekly therapy received by the child in the preceding 4 months (see Supplemental Material E). Testing sessions were video and audio recorded for later coding and transcription.

Data collection schedule.
Video coding
Parent child interaction
Parents (mothers n = 26, fathers n = 1) were given a set of developmentally appropriate toys and asked to interact as they normally would with their child for 15 min. The coding manual was obtained from Paul Yoder and closely followed the procedures described in Yoder et al. (2015). The following adaptions were made to this study: communication behaviour was coding using ELAN (2018) rather than ProCoder software, and the selection of toys used was different (see Supplemental Material F for list of items and coding manual). As per Yoder et al. (2015), the video was divided into 5 s intervals, which were classified as codeable or non-codeable, depending on whether both participants and their actions were visible. Each codeable interval was examined for evidence of a child lead, and if so, the referent of that lead. Child leads were attentional (e.g. looking at a referent) or physical (e.g. manipulating a referent. Each interval containing an identifiable child lead was then coded for parent response (either linguistic, physical or both). Finally, the percentage of child leads that resulted in a parental linguistic response was computed. Mean sample lengths was 15.0 min (SD =1.3). A random sample of 22% of all coded sessions from media files were analysed by a second coder, blind to specific research question. The intra-class correlation coefficient was 0.98.
Communication and Symbolic Behaviour Scales
The communication temptations section of the CSBS was administered at Time 1 according to the manual. Each communication behaviour displayed by the child was coded according to its function (initiating or responding to behavioural regulation, joint attention or social interaction) and the communicative means (with or without gesture, vocalization or words). This was also coded in ELAN and subsequent information to be extracted was as follows: number of intentional communication attempts in each category (in order to compute total communicative acts), and phoneme and consonant inventory (phonemes and consonants were only counted if they occurred as part of a deliberate communication act and were part of a syllable). Mean sample length was 24.0 min (SD =7.2). Correlation between the sample length and communicative acts was 0.32 (p = 0.10). The total communicative acts measure was conservatively converted to a rate in order to avoid bias caused by variation in sample duration (to avoid conflating shorter samples with fewer communicative behaviours, if the cause of shorter samples was behavioural or attentional) as per Cohen and Cohen (1984).
A random sample of 10%–22% of all coded sessions from media files were analysed by a second coder, blind to specific research question. The variables tested for reliability were those entered into the statistical model. Inter-observer agreement was 0.86 (rate of communicative acts, communicative intent); 0.95 (number of consonants, consonant inventory); and 0.99 (number of phonemes, phoneme inventory). All inter-observer agreement statistics were computed using the intra-class correlation ICC() command in the psych R package (Revelle, 2018). For additional information, we calculated an agreement matrix to determine what percentage of the time raters agreed on individual phoneme and consonant judgements (rather than overall number of phonemes in the repertoire). This was a mean of 84% for consonant inventory (SD =17%, range = 55%–100%) and 80% for phoneme inventory (SD = 15%, range = 57%–100%).
Data analysis
Exclusion criteria
The participant exclusion criteria from the pre-registration were followed, resulting in the removal of one participant who had only provided dependent variable data on one time-point.
We did not plan to exclude outliers, in order to reflect the heterogeneity in expressive language development; however, four data points represented significant outliers (due to two participants making very large language gains by Time 3 which were maintained at Time 4). These data were adjusted to the time-point mean + 3 standard deviations, in order to avoid any undue influence on the analysis (Field, 2013; Kutner et al., 2004).
Missing data
Very few data were missing, only one predictor data point (Reported Phonemes for one participant, >4%) and one dependent variable measure (Time 1 CDI value for one participant, >4%). The missing data were multiply imputed following Enders (2010). Measures requiring transformation were transformed before imputation (Von Hippel, 2009). Forty imputed data sets were used in order to minimize bias in parameter estimates (Graham, 2009). After imputed data sets were created, imputed scores were deleted for the one missing dependent variable data point, since not doing so may bias regression estimates (Von Hippel, 2007).
Anticipated data transformations
The analysis measures used assume multivariate normality. Multivariate normality is more likely when univariate distributions do not grossly depart from descriptors of the normal distribution (Tabachnick & Fidell, 2001). All variables were transformed if they had univariate skewness > |0.8| or kurtosis > |3.0|. Transformations were selected in accordance with the principles in Tabachnick and Fidell (2001). Transformations that were applied are listed in Table 1.
Linear mixed models
All data analysis was conducted using linear mixed effects models, fit in R (R Core Team, 2017) with the lmer() function of the lme4 library (Bates et al., 2015). In line with recommendations in Barr et al. (2013), our analysis assumed a maximal model with random intercepts and slopes. Time was centred at Time 4, meaning that the intercept corresponded with expressive language outcome at the end of 12 months. This was deemed more meaningful than centering at Time 1 when expressive language fell within a tight range (0–23 words) and is in line with the approach taken by Yoder et al. (2015). Time was entered into the model as a nominal value (i.e. a number between 1 and 4) rather than on a continuous basis, given the adherence to a regular time interval between assessments, which also mirrors Yoder et al. (2015).
Model comparisons were made using the deviance statistic, or change in the −2 log likelihood, when comparing nested models. A significant change is one with a chi-squared p-value of less than 0.05. Non-nested models were compared using Bayesian information criterion (BIC).
Planned confirmatory analyses
The following specific Hypotheses were tested:
Hypothesis 1. All value-added predictors identified in Yoder et al. (2015) will be significant positive predictors of expressive language in this sample (parental responsiveness, child response to joint attention, child communicative intent and consonant inventory).
Hypothesis 2a. Phonetic repertoire will provide a better model fit in predicting expressive language compared with consonant inventory.
Hypothesis 2b. Alphabet and phonics knowledge will provide a better model fit in predicting expressive language compared with consonant inventory.
Results
Preliminary results
Expressive language growth
Descriptive measures for dependent, independent and background variables are described in Table 2.
Descriptive measures.

SD: standard deviation; NVIQ: nonverbal intelligence quotient (developmental age/chronological age); SLT: speech and language therapy.
All participants commenced the study at a mean age of 4;2 years with extremely limited expressive language. Over the 12-month period of the study, individual expressive language growth was highly variable, as illustrated in Figures 3 and 4. Using the threshold indicated in the original sample selection criteria (<24 words by parent report), 65% of the sample remained minimally verbal at Time 4. Furthermore, 27% of all participants were at floor on this measure at Time 4, reportedly using no words at all.
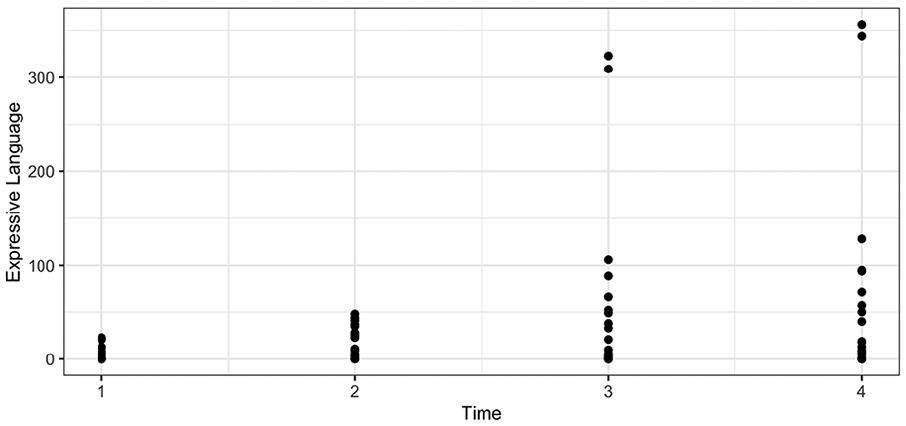
Expressive language (parent report of number of words child reliably produces) at each of the four time-points (each separated by 4 months).
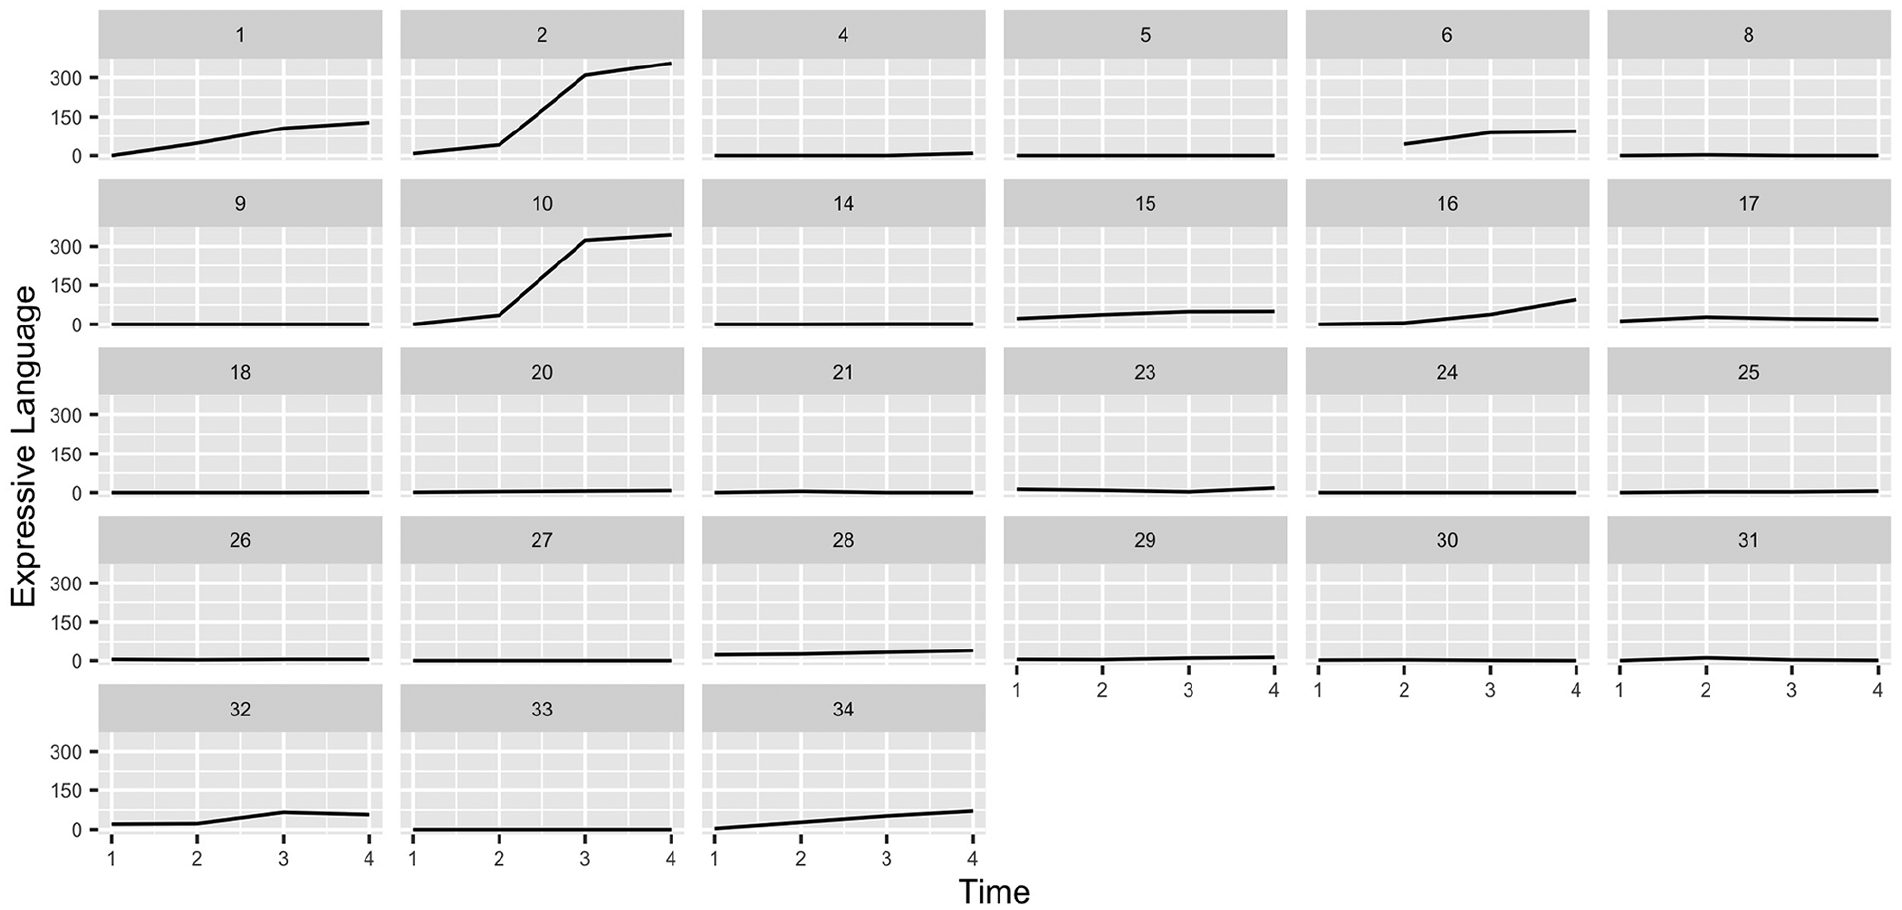
Individual expressive language trajectories (parent report of number of words child reliably produces) at each of the four time-points (each separated by 4 months).
The average gain in expressive vocabulary was 43 words (SD = 95); however, this figure is biased by the presence of two participants whose Times 3 and 4 scores were significant outliers. These two participants both gained over 340 words during the 12-month period. The mean gain excluding these outliers is 17 words (SD = 33).
There was high stability in expressive language, evidenced by high correlations between expressive language scores as measured at each time-point, as illustrated in Table 3. Despite equally spaced time-points, the degree of correlation was much higher between later time-points than it was between Times 1 and 2.
Expressive language correlations.

CDI: Communicative Development Inventory.
p < 0.01; ***p < 0.001.
Putative predictors
The predictor and background variables are summarized in Table 2 and their correlations are presented in Table 4. Background variables including autism symptom severity, NVIQ and Time 1 receptive language, and predictor variables consonant inventory, phonetic repertoire and alphabet score all correlated with Time 4 expressive language level. Conversely, communicative intent, parent responsiveness and response to joint attention were not significantly correlated with Time 4 expressive language. Expressive language change over 12 months (i.e. Time 4 minus Time 1 expressive language) was correlated with autism symptom severity, NVIQ, phonetic repertoire and alphabet score.
Correlations.

NVIQ: nonverbal intelligence quotient.
p < 0.051; *p < 0.05; **p < 0.01; ***p < 0.001.
One composite variable was planned (phonetic repertoire), so the intercorrelations among component measures of this construct were verified. Observed Phoneme Inventory, Reported Phonemes and Elicited phonemes were all measured at Time 1. Elicited phonemes correlated significantly with Observed Phoneme Inventory (r = 0.45, p < 0.05) but not Reported Phonemes (r = 0.28, n.s.). Likewise, Reported Phonemes correlated significantly with Observed Phoneme Inventory (r = 0.46, p < 0.05). The resulting phonetic repertoire measure correlated with each component r > 0.60 and also significantly with consonant inventory (r = 0.87, all ps < .01).
Confirmatory analyses
The steps taken to evaluate the pre-registered hypotheses are as follows, beginning with an unconditional growth model containing random effects of individual differences between participants on the intercept and the slope (i.e. the linear effect of time) and a fixed effect of time, then adding in the previously identified value-added predictors and finally comparing the predictive model this generates with one using alternative predictors. Coefficients for each model are set out in Table 5.
Model summary.

p < 0.05; **p < 0.01; ***p < 0.001.
Selection of unconditional models for language growth – Model 1
A model with Time centred at Time 4, containing fixed and random intercepts and slopes was the best fit to the data, with an adjusted R2 of 0.07.
Conditional model using Yoder et al.’s predictors – Model 2
Of the four original predictors, only consonant inventory had a significant zero-order correlation with expressive language change or outcome; therefore the other three predictors were not entered into the model.
A fixed effect of consonant inventory significantly improved model fit versus Model 1 (χ2 = 12.19, df =1, p < 0.001). The increase in adjusted R2 was 0.23. Adding further interactions with Time did not significantly improve the model fit, so this was deemed the best model using the original predictors, and thus the one used to compare against novel predictors to address Hypotheses 2a and b.
Testing novel predictors – Model 3
The second objective was to test the suitability of two alternative predictors to be used in the model in place of consonant inventory. Model fit was compared using Bayes Information Criterion (BIC) since the models were not nested (i.e. one model did not contain all the parameters of the other model).
Replacing consonant inventory with phonetic repertoire, resulted in a decrease in BIC (148 vs 139) and, therefore, indicated an increase in model fit. Adjusted R2 for this model was 0.45, an increase of 0.16.
The same process was used to test Alphabet score at Time 1 as a predictor. Taking Model 2 and replacing consonant inventory with Alphabet score resulted in a higher BIC (160), indicating a worse model fit. Therefore, no model containing Alphabet score was included in analysis.
Discussion
Expressive language growth
A significant proportion of participants (65%) remained minimally verbal after 12 months, at mean age 5;2. This figure is somewhat greater than the 40% reported to remain minimally verbal in Yoder et al. (2015); however, the time periods are also not directly comparable (16 vs 12 months). Few similar longitudinal studies are directly comparable due to differences in design, definition of minimally verbal or sample characteristics (e.g. Anderson et al., 2007; Bal et al., 2016; Norrelgen et al., 2014).
Children made a mean gain of 45 words during this study, which is lower than the 75 words (SD =95) after 16 months reported in Yoder et al. (2015). When two significant outliers are excluded, the comparison figure shrinks to 17 words (SD = 33), which suggests that on average, children on this study are not making progress at the same rate as the children observed in Yoder et al. (2015). A potential explanation is that participants in this study were recruited at age 3–5 (mean 4;2) rather than age 1;8–3;11 (mean 2;11) in Yoder’s study. It is possible that some of the younger children in Yoder et al. (2015) were less severely impaired and did not have such persistent expressive language impairment, but were experiencing a transient delay in language development which partially resolved during the study period. This suggests that our sample may include children with more severe symptoms and greater difficulty acquiring expressive language. The children in Yoder et al. (2015) share a similar range and mean to our cohort for developmental ratio. Like our cohort, they have a highly variable receptive language score at the start and end of the study, and by design, they start the study with a similarly limited expressive vocabulary. Another possibility may be differences in intervention receipt; however, Yoder et al. (2015) do not report information about the types or duration of interventions children received and our study is not designed to evaluate the impact of intervention on expressive language outcome. Instead, this study has focused on value-added predictors identified by Yoder and colleagues.
Expressive language measures were quite stable within each participant over time, and particularly between adjacent time-points at Times 2, 3 and 4 (all r ⩾ 0.90), correlation was only r = 0.62 between Times 1 and 2. This could be an artefact of the very low variability in the initial Time 1 expressive language level, or could reflect a decrease in measurement error over time in parental judgements of language skills. Language was stable across this period as those children with larger vocabularies at Time 1 tended to have the largest vocabularies at Time 4. This stability does not imply no change in language, 67% children showed some improvement in language scores, with an average increase of 17 words, excluding two outliers. Bornstein et al. (2018) used the Avon Longitudinal Study of Parents and Children data set to evaluate stability of language over 13 time-points and 15 years. They found that core language was stable from an early age in both typical (n = 4111) and atypical groups, including autism (n = 89). Average stability across all time-points was 0.65 for the autistic children and 0.56 in the typical group.
Confirmatory analyses
This study did not find a meaningful relationship between three of the original putative predictors and expressive language. It is difficult to draw a firm conclusion from null results, and given the small sample, this may be due to lower statistical power. Although the sample is smaller than the 87 participants used by Yoder et al. (2015), this study also examines far fewer variables (Yoder et al. tested nine putative predictors and two background variables). However, all but phonetic repertoire was measured via single variables, whereas Yoder et al. (2015) used aggregate measures, which are known to enhance stability and validity. Our sample size reflects the difficulty of recruiting this hard to reach population as well as financial and practical constraints on data collection in a repeated measures design. It is also possible, as mentioned above, that the sample might be qualitatively different to the Yoder et al. (2015) sample due to the older age at which participants were recruited, which could result in different predictive relationships: this cohort may have had more severe speech-motor deficits that are distinct from the social variables that associate with language development. Finally, the high number of participants who continue to be at floor on the dependent variable may attenuate correlations with putative predictors. A key focus of future work should be ensuring that conclusions from younger and broader samples can be generalized to those with the most complex communication difficulties (e.g. Pecukonis et al., 2019).
In contrast, the significant correlation between early consonant inventory and expressive language growth seen in Yoder et al. (2015) was replicated in this sample. This adds to prior emerging evidence that speech production abilities are related to expressive language development in autistic preschoolers (McDaniel et al., 2018) and that speech production is worthy of further consideration when devising interventions (e.g. Chenausky et al., 2018).
In this sample, replacing consonant inventory with a composite of three phonetic measures (Phoneme Inventory, Elicited Phonemes and Reported Phonemes) resulted in a better model fit and explained more variance. This supports the idea that for minimally verbal autistic children, a broader measure of speech skills, incorporating information from multiple sources, may be more nuanced and thus a better predictor of the same underlying construct, a sentiment echoed more generally in Tager-Flusberg et al. (2009).
Our composite measure, phonetic repertoire, comprised three speech measures which were only moderately correlated with each other (r ranging from 0.28 to 0.46), yet this measure proved to be a stronger predictor of expressive language than consonant inventory. Reasons for the low correlation may include measurement error. Some parents reported they found it difficult to evaluate the communicativeness of their child’s babble and identify the specific sounds within it, as required by the Reported Phonemes measure. Equally, children’s engagement during the Elicited Phonemes task varied considerably, which could have understated some children’s actual skills. On the contrary, the measures may be expected to truly vary as they measure different skills. Those needed for Elicited Phonemes (to attend to, process, and copy a specific sound, with no intrinsic motivation and with an unfamiliar interlocutor) compare with those for Reported Phonemes, where motivation may be present in the natural home environment (e.g. to obtain a desired item) and the interlocutor is familiar. Furthermore, no specific speech sound may be necessary (a gesture and a vocalization may suffice to convey information) and performance pressure is reduced. Phonemic repertoire may have been a more informative predictor because different facets of speech skills were combined.
Conversely, Alphabet Knowledge did not appear to have a consistent relationship with expressive language in this sample, nor did it correlate with other phonetic repertoire measures. This novel measure was not continuously distributed across the sample. Given attentional difficulties, future work may employ parent questionnaires as a more effective and accurate way of tapping alphabet and phonics knowledge and relating them to language development.
The weaker correlation in this sample between socio-communicative measures (communicative intent, parent responsiveness and response to joint attention) and expressive (verbal) language, supports the idea that some minimally verbal autistic children could have an additional disorder of speech-motor development. If this were the case, stronger socio-communicative skills would not act as protective factors for expressive language to the same extent that they do in younger and thus more diverse minimally verbal autistic cohorts. To illustrate this point, a few children in our sample were frequent and productive users of alternative forms of communication (Makaton; speech generating application), despite their lack of verbal output. This is a further indicator of a specific additional difficulty with speech production rather than motivation or symbolic understanding. Belmonte et al. (2013) identified a motor-impaired subgroup comprising one third of participants (cohort aged 22–65 months at intake, n = 31). These children had weaker oral-motor skills and a disparity between their receptive and expressive language level, reinforcing the conclusion that motor difficulties contributed to their lack of speech progress.
Potentially relevant predictors not evaluated in this study are nonverbal cognition and autism symptom severity, since they were not deemed to be value-added predictors in Yoder et al.’s (2015) findings. Previous cohort studies have identified associations between these variables and later language (Anderson et al., 2007; Thurm et al., 2007, 2015; Wodka et al., 2013). NVIQ and symptom severity do associate with language outcomes in this study such that those with more severe and pervasive development deficits have more limited consonant inventories and make more limited progress. However, it may be more useful to identify specific predictors, which are more narrowly defined and suitable as potential intervention targets, rather than confirm the pervasive association between later language and global measures of nonverbal cognition or symptom severity. Bal et al. (2019) recently investigated the role of early predictors in two independent cohorts of language-delayed autistic pre-schoolers (n = 267) and identified fine-motor skills as a strong predictor of later expressive language. Their study highlighted the importance of looking at specific skill domains rather than broader indices of developmental level.
Limitations
This study has several limitations. The sample size is relatively small, which impacts statistical power. Second, for financial and logistical reasons, no formal independent diagnostic verification process took place (e.g. ADOS assessment). However, each family reported that autism had been diagnosed by a qualified health professional, and children scored a mean of 41.3 on the CARS autism symptom severity assessment (only one child scored less than the 30 cut-off score). Third, the study design involved a series of home visits. The data generated in such contexts are more vulnerable to measurement error and confounding factors, due to poorer control of the testing environment, for example, presence of pets, siblings, television screens and other distractions. However, home visits are preferred by families of children with complex needs and facilitate their participation, thus creating a broader representation of families within the study. Therefore, greater ecological validity was judged to be worth the trade-off with experimental precision. Finally, in order to limit testing time, single estimates were used for most predictor measures and for the dependent variable. Composite scores would have created more robust estimates and been preferable, however this is unlikely to substantively change the outcomes of this study.
Conclusion
These results underscore the striking variation in expressive language development during a 12-month period for a cohort with fairly homogeneous starting vocabularies (0 to 23 words), with some remaining at zero words and others in excess of 340. They also further highlight the independent contribution of speech production abilities to expressive language development in minimally verbal autistic children.
The current findings strongly suggest that speech production may reflect an additional deficit for minimally verbal autistic children, rather than assuming that severe expressive language deficits are a consequence of core autism symptoms. If we aim to help those autistic children most at risk of persistent expressive language difficulties, we need to understand the drivers of language growth more precisely and ensure that our conclusions are based on research evidence that includes this population. More extensive longitudinal studies of minimally verbal autistic participants’ language development are needed, as is an effort to include those with persistent and limited expressive language, so that findings can be generalized and additional barriers to communication identified and addressed.
Future work could incorporate longitudinal measures of phonetic repertoire in order to build a more informed picture of what predicts phonetic abilities in this population (e.g. Woynaroski et al. 2016). Both segmental (i.e. phonetic) and supra-segmental aspects of preverbal vocalizations (e.g. prosody, utterance length and ‘speechiness’) warrant further examination. The use of automated analysis of day-long recordings as a potential method for future research would also make studies of this nature more feasible (Swanson et al., 2018; Woynaroski et al., 2016). Finally, ways in which speech production could be supported in this group should be developed and evaluated (e.g. Chenausky et al., 2018).
Supplemental Material
AUT898560_Supplemental_material_A – Supplemental material for Does phonetic repertoire in minimally verbal autistic preschoolers predict the severity of later expressive language impairment?
Supplemental material, AUT898560_Supplemental_material_A for Does phonetic repertoire in minimally verbal autistic preschoolers predict the severity of later expressive language impairment? by Jo Saul and Courtenay Norbury in Autism
Supplemental Material
AUT898560_Supplemental_material_B – Supplemental material for Does phonetic repertoire in minimally verbal autistic preschoolers predict the severity of later expressive language impairment?
Supplemental material, AUT898560_Supplemental_material_B for Does phonetic repertoire in minimally verbal autistic preschoolers predict the severity of later expressive language impairment? by Jo Saul and Courtenay Norbury in Autism
Supplemental Material
AUT898560_Supplemental_material_C – Supplemental material for Does phonetic repertoire in minimally verbal autistic preschoolers predict the severity of later expressive language impairment?
Supplemental material, AUT898560_Supplemental_material_C for Does phonetic repertoire in minimally verbal autistic preschoolers predict the severity of later expressive language impairment? by Jo Saul and Courtenay Norbury in Autism
Supplemental Material
AUT898560_Supplemental_material_D – Supplemental material for Does phonetic repertoire in minimally verbal autistic preschoolers predict the severity of later expressive language impairment?
Supplemental material, AUT898560_Supplemental_material_D for Does phonetic repertoire in minimally verbal autistic preschoolers predict the severity of later expressive language impairment? by Jo Saul and Courtenay Norbury in Autism
Supplemental Material
AUT898560_Supplemental_material_E – Supplemental material for Does phonetic repertoire in minimally verbal autistic preschoolers predict the severity of later expressive language impairment?
Supplemental material, AUT898560_Supplemental_material_E for Does phonetic repertoire in minimally verbal autistic preschoolers predict the severity of later expressive language impairment? by Jo Saul and Courtenay Norbury in Autism
Supplemental Material
AUT898560_Supplemental_material_F – Supplemental material for Does phonetic repertoire in minimally verbal autistic preschoolers predict the severity of later expressive language impairment?
Supplemental material, AUT898560_Supplemental_material_F for Does phonetic repertoire in minimally verbal autistic preschoolers predict the severity of later expressive language impairment? by Jo Saul and Courtenay Norbury in Autism
Footnotes
Acknowledgements
Thanks to Dr John Swettenham for reviewing a draft of this manuscript, and to the families who took part in this study.
Author contributions
J.S. had primary responsibility for study design, data collection, data analysis and preparation of the manuscript. C.N. contributed to study design, oversaw data collection and data analysis, and provided detailed comments on drafts of the manuscript.
Declaration of conflicting interests
The author(s) declared no potential conflicts of interest with respect to the research, authorship and/or publication of this article.
Funding
The author(s) disclosed receipt of the following financial support for the research, authorship and/or publication of this article: This work was supported by an Economic and Social Research Council studentship awarded to the first author (grant no. ES/J500185/1).
Supplemental material
Supplemental material for this article is available online.
Notes
References
Supplementary Material
Please find the following supplemental material available below.
For Open Access articles published under a Creative Commons License, all supplemental material carries the same license as the article it is associated with.
For non-Open Access articles published, all supplemental material carries a non-exclusive license, and permission requests for re-use of supplemental material or any part of supplemental material shall be sent directly to the copyright owner as specified in the copyright notice associated with the article.