



Abstract
Autistic adults experience a higher rate of physical and mental health conditions and lower rates of employment and post-secondary education participation than their non-autistic counterparts, which may affect negatively quality of life. Limited information exists on predictors of quality of life for autistic individuals, or how quality of life compares to non-autistic individuals. Our aims were to (a) examine and compare indicators of physical (e.g. sleep quality) and mental health (e.g. anxiety) on quality of life among a sample of 244 autistic and 165 non-autistic individuals aged 15–80 years and (b) examine factors contributing to quality of life 2 years later among the autistic sample (n = 93). Participants were from two Australian longitudinal studies. The pattern of results for quality of life was similar across the autistic and non-autistic groups, with depression symptomatology, psychological well-being, sleep quality and autonomic symptoms all significantly predicting quality of life. In addition, among the autistic group, baseline quality of life had the greatest influence on quality of life 2 years later. These findings have implications for support services for autistic individuals, implying that in order to improve quality of life, mental health, particularly depression, needs addressing. Given known relationships between sleep and mental health, an intervention addressing these may have greatest clinical impact on quality of life among autistic individuals.
Lay Abstract
Research shows that autistic adults are at risk of a range of physical (e.g. sleep difficulties) and mental health (e.g. anxiety) conditions, as well as lower employment and post-secondary education participation; these all can affect one’s quality of life. However, we have little information about what affects quality of life for autistic individuals across the lifespan and whether this differs from non-autistic people. We determined what factors (e.g. mental or physical health challenges) affected quality of life in a large group of autistic individuals aged 15–80 years compared with similar age non-autistic individuals. We also examined what factors affected quality of life of the autistic group 2 years later. We found a similar pattern of results for the autistic and non-autistic groups; depression symptoms, psychological well-being, sleep quality and autonomic symptoms (e.g. sweating) were all significant predictors of quality of life. In addition, among the autistic group, baseline quality of life had the most influence on quality of life 2 years later. These results have implications for support services, as they highlight the relationship between mental health (especially depression) and quality of life. Given that sleep challenges (e.g. insomnia) are related to mental health, an intervention addressing both insomnia and mental health may be most useful in helping autistic individuals improve their quality of life.
An estimated 1.1% of adults meet criteria for an autism spectrum diagnosis (Brugha et al., 2016). Outcomes for autistic adults, regardless of IQ, are mixed, with mental and physical health conditions and unemployment being common, and at least half of individuals remain living at home well into adulthood (Farley et al., 2009; Gray et al., 2014; Howlin et al., 2014). There is a high risk for one or more comorbid mental health conditions, most commonly anxiety and depression, which exceed prevalence rates reported in non-autistic samples (Croen et al., 2015; Hollocks et al., 2018; Lai et al., 2019). Hollocks and colleagues (2018) reported a life-time prevalence rate of 42% for anxiety disorders and 37% for depression among autistic individuals.
Recent evidence also indicates a high rate of physical health issues in about 40%–60% of autistic adults including allergy, cardiovascular disease, obesity, neurological conditions, gastrointestinal disorders and sleep disorders (Croen et al., 2015; Jones et al., 2016). Autistic adults have more frequent sleeping difficulties than comparison groups (Limoges et al., 2005; Tani et al., 2003), and poor sleep is related to poor mental health (Baker et al., 2019; Tani et al., 2003) and pre-sleep arousal (Baker et al., 2019). Symptoms associated with insomnia and circadian sleep–wake disorders appear most common (Baker & Richdale, 2015, 2017; Hare et al., 2006). Sleep apnoea, which can be associated with cardiovascular disease, obesity and diabetes (Cappuccio et al., 2011; Carneiro-Barrera et al., 2019; Wang et al., 2012), also may be more common in the autistic than in the non-autistic population (Croen et al., 2015).
Around half or more of autistic adults are unemployed or underemployed. The Australian Bureau of Statistics (ABS) data (2017) show that about 41% of autistic adults are participating in the labour force, with only 28% reporting they are employed (ABS, 2017), compared with 48% across other disabilities. In a Swedish study, 56% of autistic young adults were not working or studying even though all but one had completed school and 40% were university educated (Hirvikoski & Blomqvist, 2015). Similarly, UK data suggest that only 15% of working-age autistic adults are in full-time employment (Mavranezouli et al., 2014). Poor employment is generally related to poor community engagement and high rates of mental and physical health problems (van Rijn et al., 2016).
Poor employment prospects, low independence and community engagement, and high rates of mental and physical health problems affect quality of life (QoL). A meta-analysis of QoL in autistic individuals showed that from childhood to early middle age, those with autism experience significantly lower QoL than non-autistic individuals; separate examination of older autistic adults supported that poor QoL continues into old age (van Heijst & Geurts, 2015). Similarly, Mason and colleagues (2018) found poor QoL in autistic individuals aged 17–80 years. Factors which are implicated in QoL for autistic individuals include bullying and stress (Hong et al., 2016), co-occurring mental health conditions (Knüppel et al., 2018; Mason et al., 2018), poor sleep (Deserno et al., 2019; Knüppel et al., 2018), poor executive functioning (Dijkhuis et al., 2017), involvement in daytime activity, living arrangements (Knüppel et al., 2018) and autism symptomatology (Knüppel et al., 2018; Mason et al., 2018). Most recently, an examination of a comprehensive range of variables found that insomnia severity was the best predictor of self-reported QoL in autistic adults, using a single QoL question at a 2-year follow-up (Deserno et al., 2019). However, this study only used a single, Likert-type scale item to measure QoL and did not control for baseline QoL in their longitudinal analyses.
Thus, autistic adolescents and adults are affected across a range of areas of functioning and are at risk for poor QoL due to a range of social, mental and physical health factors. Identifying factors that contribute to poor QoL can inform service needs for these adults and intervention aimed at improving mental and physical health. The aim of this study was to examine and compare the contributions of demographic characteristics (age, gender, living arrangements), vocation (employment, study), autistic symptomatology, mental health (anxiety/depression), psychological well-being and physical health (sleep quality/autonomic symptomatology) to physical, psychological, social relationships or environment domains–related QoL, as measured by the WHOQoL-BREF in both autistic and non-autistic adults. Our second aim was to examine the contribution of these variables, including the QoL domains, to QoL of the autistic adults 2 years later. We predicted that autistic symptomatology, sleep quality and mental health would be significant predictors of one or more QoL domains, with sleep quality being the best predictor of QoL in autistic adults at 2-year follow-up.
Method
Participants
Participants from two online Australian longitudinal surveys – Study of Australian School Leavers with Autism (SASLA) and Australian Longitudinal Study of Adults with Autism (ALSAA) – aged 15–80 years and residing in Australia were included in the analyses. To date, 436 autistic and 355 non-autistic participants have completed the baseline surveys. In addition, 153 autistic participants have completed a 2-year follow-up survey. Follow-up data were not available for the non-autistic cohort. Participants in the autistic sample did not have a co-occurring intellectual disability and self-reported a current formal diagnosis of autism spectrum disorder. Following data cleaning, the final sample for analysis consisted of 224 (93 at follow-up) autistic (Mage = 35.37, range = 15–80 years) and 165 non-autistic (Mage = 32.19, range = 15–77 years) individuals.
Procedure
Community consultation
Community consultation was undertaken to determine research priority areas. This was achieved by conducting an adult forum with members of the autism community in 2014 (SASLA) and by national collaboration of researchers, clinical health providers and an advisory network in 2015 (ALSAA) including autistic individuals, parents and organisations (e.g. Aspergers Victoria). In both consultations, the areas of sleep, mental health, physical health and well-being were identified as key areas of interest. In developing the online survey, the research teams consulted with local autism associations, individual parents and young adults on the autism spectrum (SASLA) and with a research advisory network (ALSAA) to ensure that the surveys were accessible, relevant and valid.
Data collection
Recruitment into SASLA and ALSAA began during 2015, following ethics approval from the relevant university ethics committees, and data collection is ongoing. Potential participants were contacted Australia-wide through participant databases (e.g. Rulo; https://rulo.io/), clinicians, advertising (flyers, online sites) and state-based organisations including autism associations and higher education institutions. Potential participants aged above 25 years, who contacted the researchers, received participant information and a consent form, either through a personalised electronic link to the survey or hardcopy (on request; Arnold, Foley, et al., 2019). Those aged 15–25 years received participant information and consent forms through email or hardcopy (on request), including information for parents/guardians and parent/guardian consent for those below 18 years. Following consent, including parent/guardian consent where indicated, these participants received a personalised link to the online survey hosted by Qualtrics (https://www.qualtrics.com); hardcopy surveys were supplied upon request.
Materials
Demographics
The surveys contained a series of demographic questions; those included here are age, autism diagnosis, gender and living arrangements. Specific data on socioeconomic status were not recorded and could only be calculated based on postcode for a small portion of the sample; thus, it was not included in the analyses. Educational attainment was deemed an inappropriate measure for this analysis, as a portion of the sample were still completing their secondary and tertiary studies. Ethnicity was not collected for the full sample.
Autism traits
The Autism Quotient-Short
The Autism Quotient-Short (AQ-Short; Hoekstra et al., 2011) is a 28-item self-report measure which assesses autistic traits in individuals with no intellectual disability intelligence. Participants respond to items on a four-point Likert-type scale from ‘definitely agree’ to ‘definitely disagree’. A total score was generated if no more than 10% of items were missing (Baron-Cohen et al., 2001).
Vocation
The two surveys each contained two questions where participants responded ‘yes’ if they agreed. Participants aged 15–25 years responded to the following questions: ‘Are you currently employed or have a job?’ and ‘Do you currently study at high school, TAFE, university or community college?’. Those aged above 25 years were asked the following questions: ‘Are you currently employed (open or sheltered employment)?’ and ‘Are you currently attending university, TAFE, community college or any other educational institution?’.
Mental health
The Patient Health Questionnaire-9
The Patient Health Questionnaire-9 (PHQ-9; Kroenke et al., 2001) is a nine-item, self-report measure assessing depressive symptomatology. Participants respond to items on a four-point Likert-type scale ranging from ‘not at all’ to ‘nearly every day’. Cronbach’s α ranges from 0.86 to 0.89, with good test–retest reliability (0.84) in an outpatient sample (Kroenke et al., 2001). Scores ⩾10 indicate moderate-to-severe depression symptomatology. The PHQ-9 has excellent internal consistency (α = 0.89; Kroenke et al., 2001) and has recently been validated by us for individuals diagnosed with ASD, with α = 0.91 for the total score (Arnold, Uljarević, et al., 2019).
The DSM-5 Generalised Anxiety Disorder Dimensional scale
The DSM-5 Generalised Anxiety Disorder Dimensional scale (DSM-5 GAD; Lebeau et al., 2012) is a 10-item self-report questionnaire which assesses anxiety symptomatology. Participants respond to items on a five-point Likert-type scale ranging from ‘never’ to ‘all the time’. Higher scores indicate greater symptom severity, with a total score >14 indicating clinical levels of anxiety.
Well-being
The Warwick–Edinburgh Mental Well-being Scale
The Warwick–Edinburgh Mental Well-being Scale (WEMWBS; Tennant et al., 2007) consists of 14 positively worded statements that measure mental well-being over the past 2 weeks. Each statement is scored on a five-point Likert-type scale resulting in a total score generated by summing all 14 items. The WEMWBS has good content validity and excellent internal consistency (α = 0.91; Tennant et al., 2007).
Physical health
The abbreviated Composite Autonomic Symptom Score-31
The Composite Autonomic Symptom Score-31 (COMPASS 31; Sletten et al., 2012) is a 31-item questionnaire measuring autonomic symptoms across six domains: orthostatic intolerance, vasomotor, secretomotor, gastrointestinal, bladder and pupillomotor. The COMPASS 31 identifies symptoms (‘yes’ or ‘no’), their frequency (four-point Likert-type scale: ‘rarely or never’ to ‘severe’) and their time course (four-point Likert-type scale: ‘gotten somewhat better’ to ‘gotten much worse’). Changes in bodily functions are measured on a three-point Likert-type scale with varied labels. For example, ‘get full a lot more quickly than I used to when eating a meal’ and ‘I get full a lot less quickly than I used to’. Each of the six domain severity scores was transformed according to the weighting factors of Sletten et al. (2012) and summed for a maximum weighted score. The scale has good test–retest reliability (rs = 0.886, p < 0.001) and internal consistency is reported (α = 0.919 for the total score; Treister et al., 2015).
Pittsburgh Sleep Quality Index
The Pittsburgh Sleep Quality Index (PSQI) is a self-report questionnaire that assesses sleep habits over the past month, and a global sleep quality score is a sum of the seven component scores: sleep duration, sleep latency, daily disfunction, sleep efficiency, overall sleep quality, sleep disturbance and sleep medication use (Buysse et al., 1989). A global score >5 indicates poor sleep quality (specificity = 89.6%, sensitivity = 86.5%) and high internal consistency is reported (α = 0.83). The global score has good internal consistency (α = 0.73) for adolescents (13–18 years; Raniti et al., 2018) and for autistic adults aged 21–41 years (α = 0.68; Baker & Richdale, 2015).
QoL
The WHOQoL-BREF
This self-report questionnaire was used to measure subjective QoL (Harper, 1998). Participants respond to the 26-item measure on a 5-point Likert-type scale with varying scale anchors. There are four domains: physical health (e.g. ‘How well are you able to get around?’), psychological (e.g. ‘To what extent do you feel your life to be meaningful?’), social relationships (e.g. ‘How satisfied are you with the support you get from your friends?’) and environment (e.g. ‘How satisfied are you with your transport?’). Higher scores indicate a better subjective QoL (McConachie et al., 2018). Each of the domain scores has good internal consistency in both the general population: physical health (α = 0.82), psychological (α = 0.81), social relationships (α = 0.68) and environment (α = 0.80) (Skevington & McCrate, 2012), and in an autistic sample: physical health (α = 0.87), psychological (α = 0.84), social relationships (α = 0.68) and environment (α = 0.84) (McConachie et al., 2018). The final domain scores were transformed to a range of 4–20, comparable with the WHOQoL-100 (World Health Organization, 1996).
Statistical analysis
Data were exported from the online surveys hosted on Qualtrics (https://www.qualtrics.com) into SPSS version 25 (IBM Corp., 2017) for analysis. For inclusion in the regression analyses, the living arrangements variable was dichotomised into independent living (living alone, as a couple or with others) and dependent living (supported living arrangements and with parents/relatives). Thus, dichotomous variables included in the analyses were gender (male/female), living situation and vocation (study, employment); all other variables were continuous. Where possible missing data were pairwise excluded, except where bootstrapping was applied which requires listwise exclusion.
All tests were two-tailed, with p-values less than 0.05 considered statistically significant. Normality of the variables was assessed by visually inspecting P–P plots and histograms. Several variables violated the assumptions of normality, thus bootstrapping analysis with 1000 re-samples and 95% bias-corrected and accelerated (BCa) confidence intervals were applied to the regression models (Field, 2013). Multicollinearity was assessed using tolerance values greater than 0.1 and variance inflation factor (VIF) less than 10 and determined not to be a problem. One univariate outlier was identified on the AQ using the criterion ±3.29 standard deviations from the mean (Tabachnick & Fidell, 2013). Examining multivariate outliers, Cook’s distance identified no outliers, while Mahalanobis’ distance identified several outliers in each regression model. However, omitting these participants from the regression analyses did not significantly alter the total amount of variance explained and they were retained as such.
Bivariate and point-biserial correlations were used to initially examine the relationships between demographics (gender, age, living situation), autistic traits (AQ-short), vocation (employment, study), mental health (DSM-5 GAD, PHQ-9), well-being (WEMWBS), physical health (COMPASS 31 weighted total score, PSQI global score), baseline QoL (WHOQoL-BREF domains) and follow-up QoL (autistic group only), separately for autistic and non-autistic groups. Hierarchical regression models were used to investigate the cross-sectional predictors of each of the four WHOQoL-BREF domains separately for autistic and non-autistic groups. Predictor variables were demographics (step 1), autistic traits (step 2), vocation (step 3), mental health (step 4), well-being (step 5) and physical health (step 6). Additional hierarchical regression models were used to examine the longitudinal predictors of each of the four WHOQoL-BREF domains for the autistic sample. Predictor variables for the longitudinal examination were the same as in the cross-sectional analyses, with the addition of the relevant baseline WHOQoL-BREF domain at step 7.
Results
Table 1 presents the means and standard deviations for each of the variables, as well as comparisons between the autistic and the non-autistic groups, and Table 2 presents the results from the correlation analyses. There were several differences between the autistic and the non-autistic groups. A higher proportion of the non-autistic sample were female, currently employed and living alone compared to the autistic sample. Furthermore, the autistic sample was slightly, but significantly, older (4.94 years) and had higher AQ-short, DSM-5 GAD, PHQ-9, COMPASS 31 and PSQI and lower WEMWBS, Physical QoL, Psychological QoL, Social QoL and Environmental QoL compared to the non-autistic group. Over time there was no significant change in Psychological (t(148) = −0.463, p = 0.644) or Social (t(148) = 1.211, p = 0.228) QoL, but Physical (t(147) = 2.712, p = 0.007) and Environmental (t(148) = 2.145, p = 0.034) QoL both significantly decreased for the autistic group.
Means, standard deviations and comparison between autistic and non-autistic groups in the full sample.
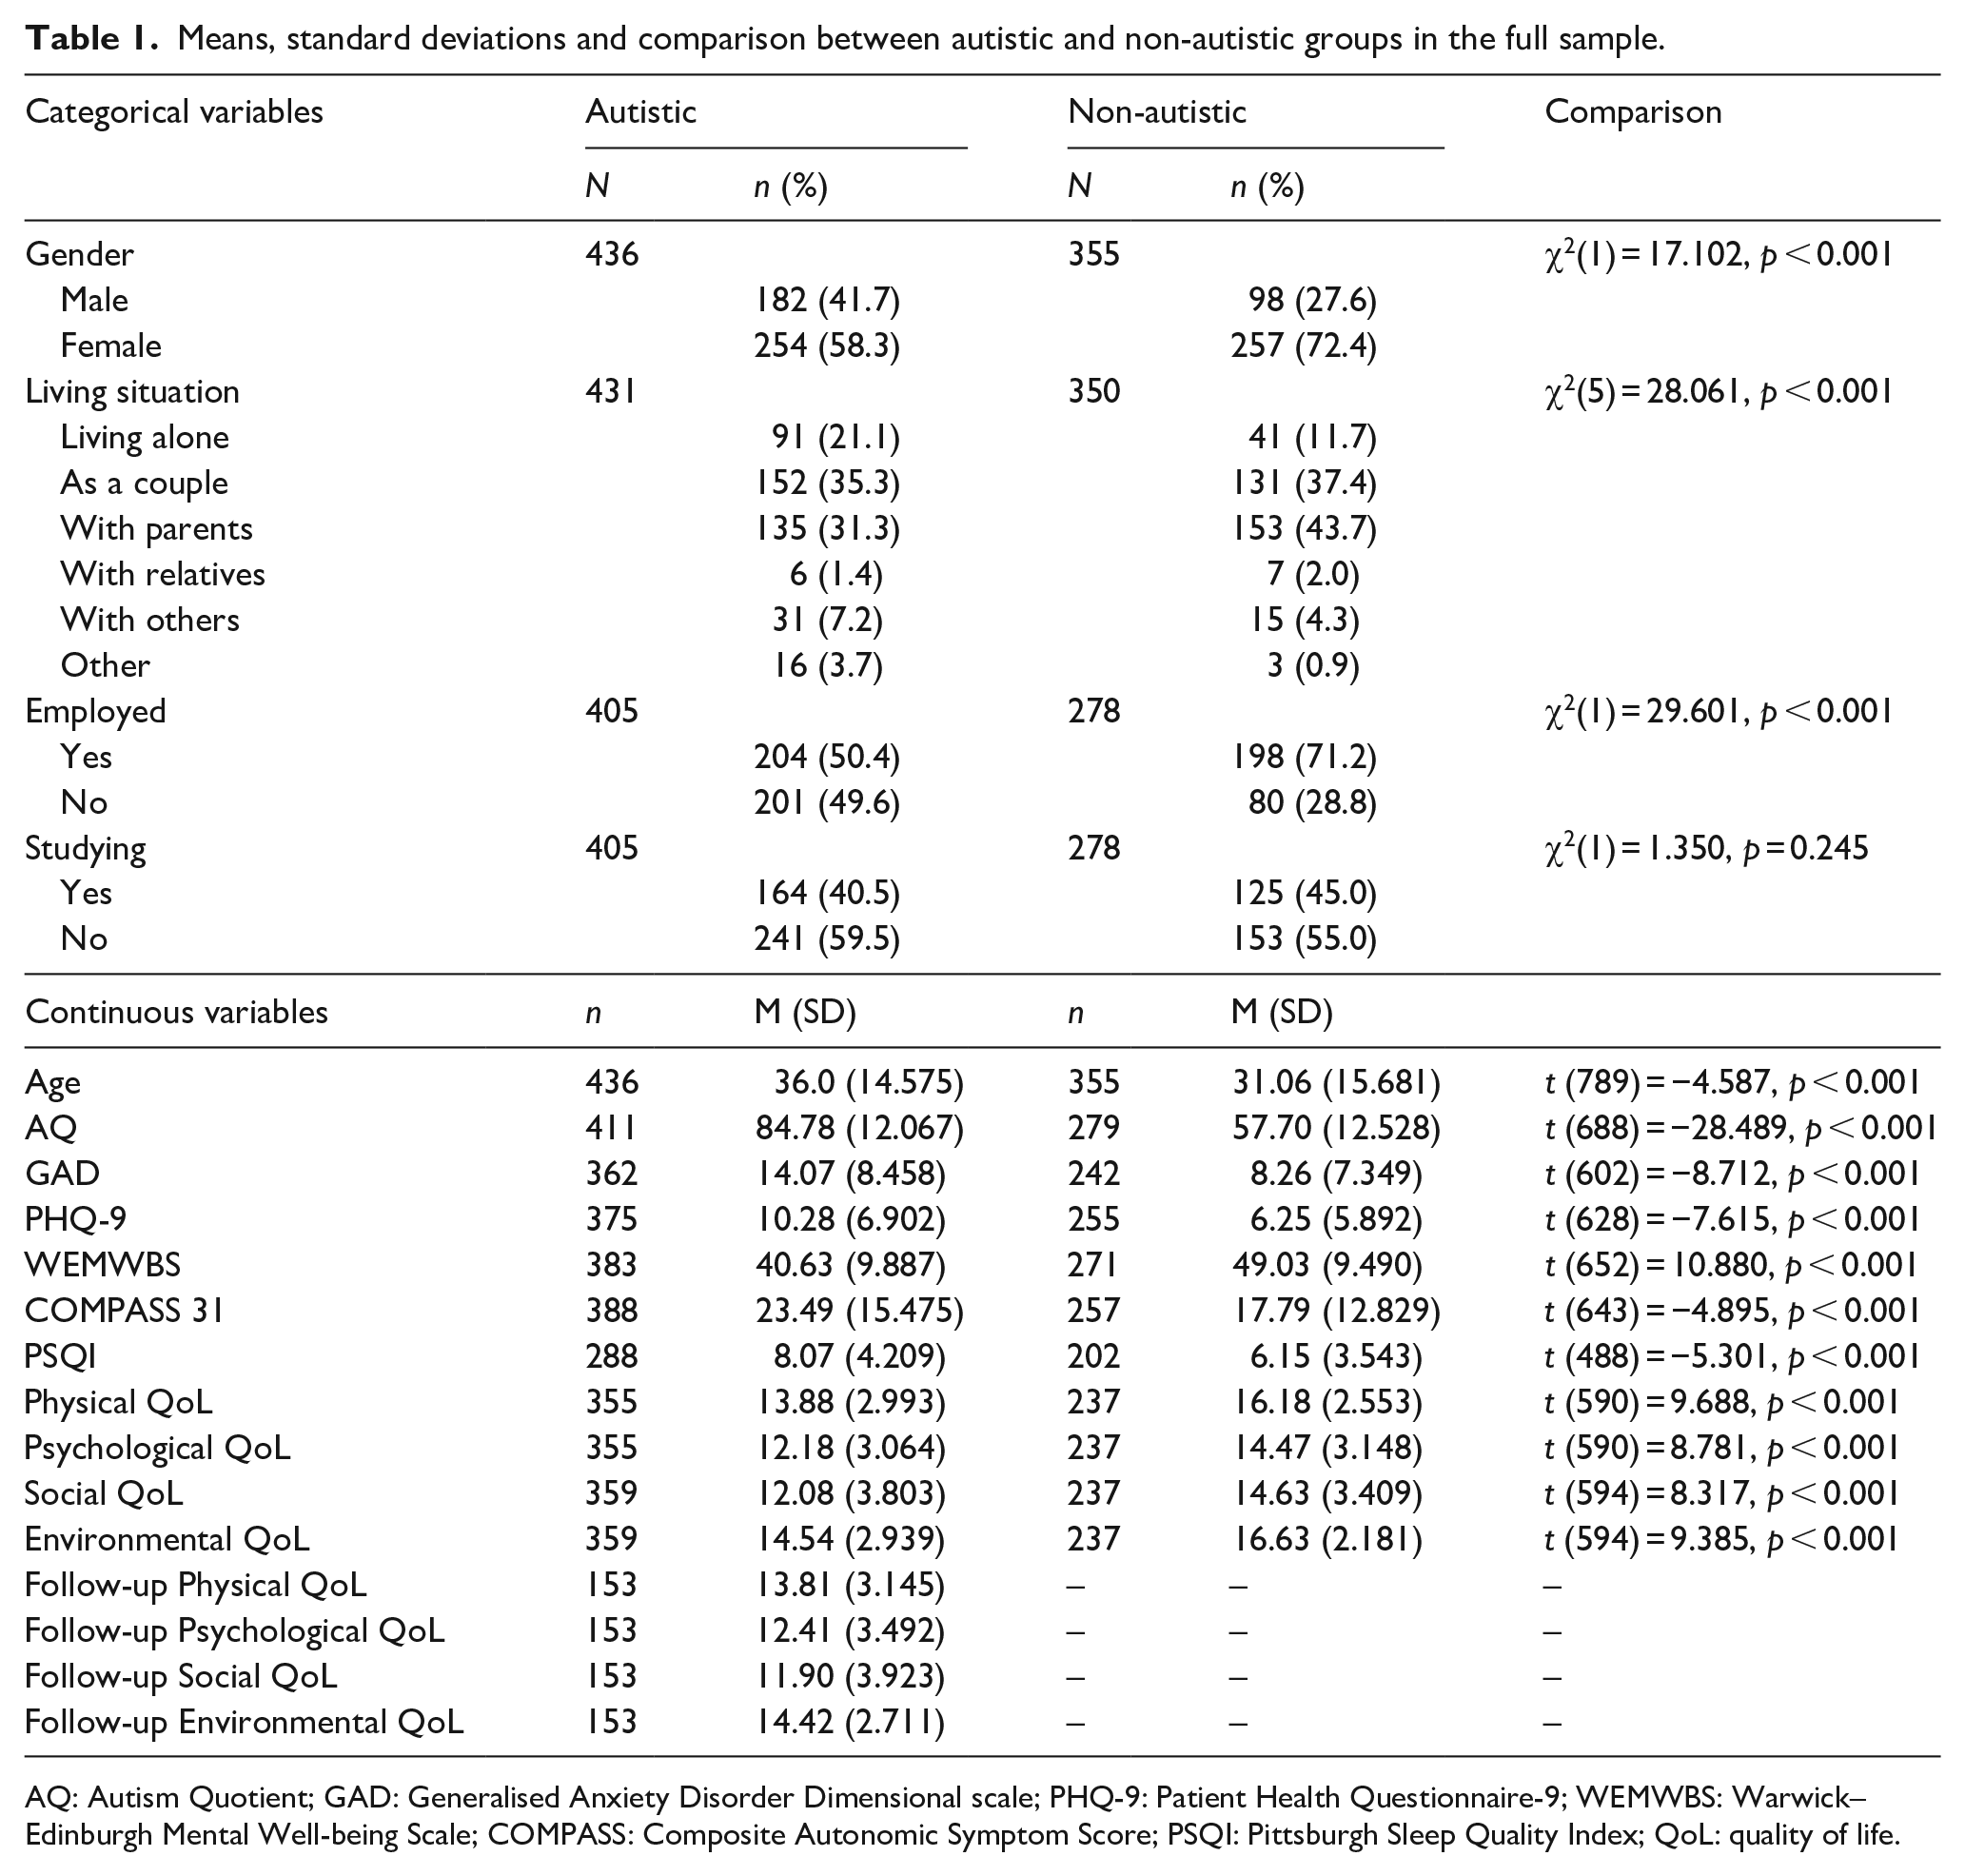
AQ: Autism Quotient; GAD: Generalised Anxiety Disorder Dimensional scale; PHQ-9: Patient Health Questionnaire-9; WEMWBS: Warwick–Edinburgh Mental Well-being Scale; COMPASS: Composite Autonomic Symptom Score; PSQI: Pittsburgh Sleep Quality Index; QoL: quality of life.
Correlation analyses, autistic group presented below the line and non-autistic group above the line.
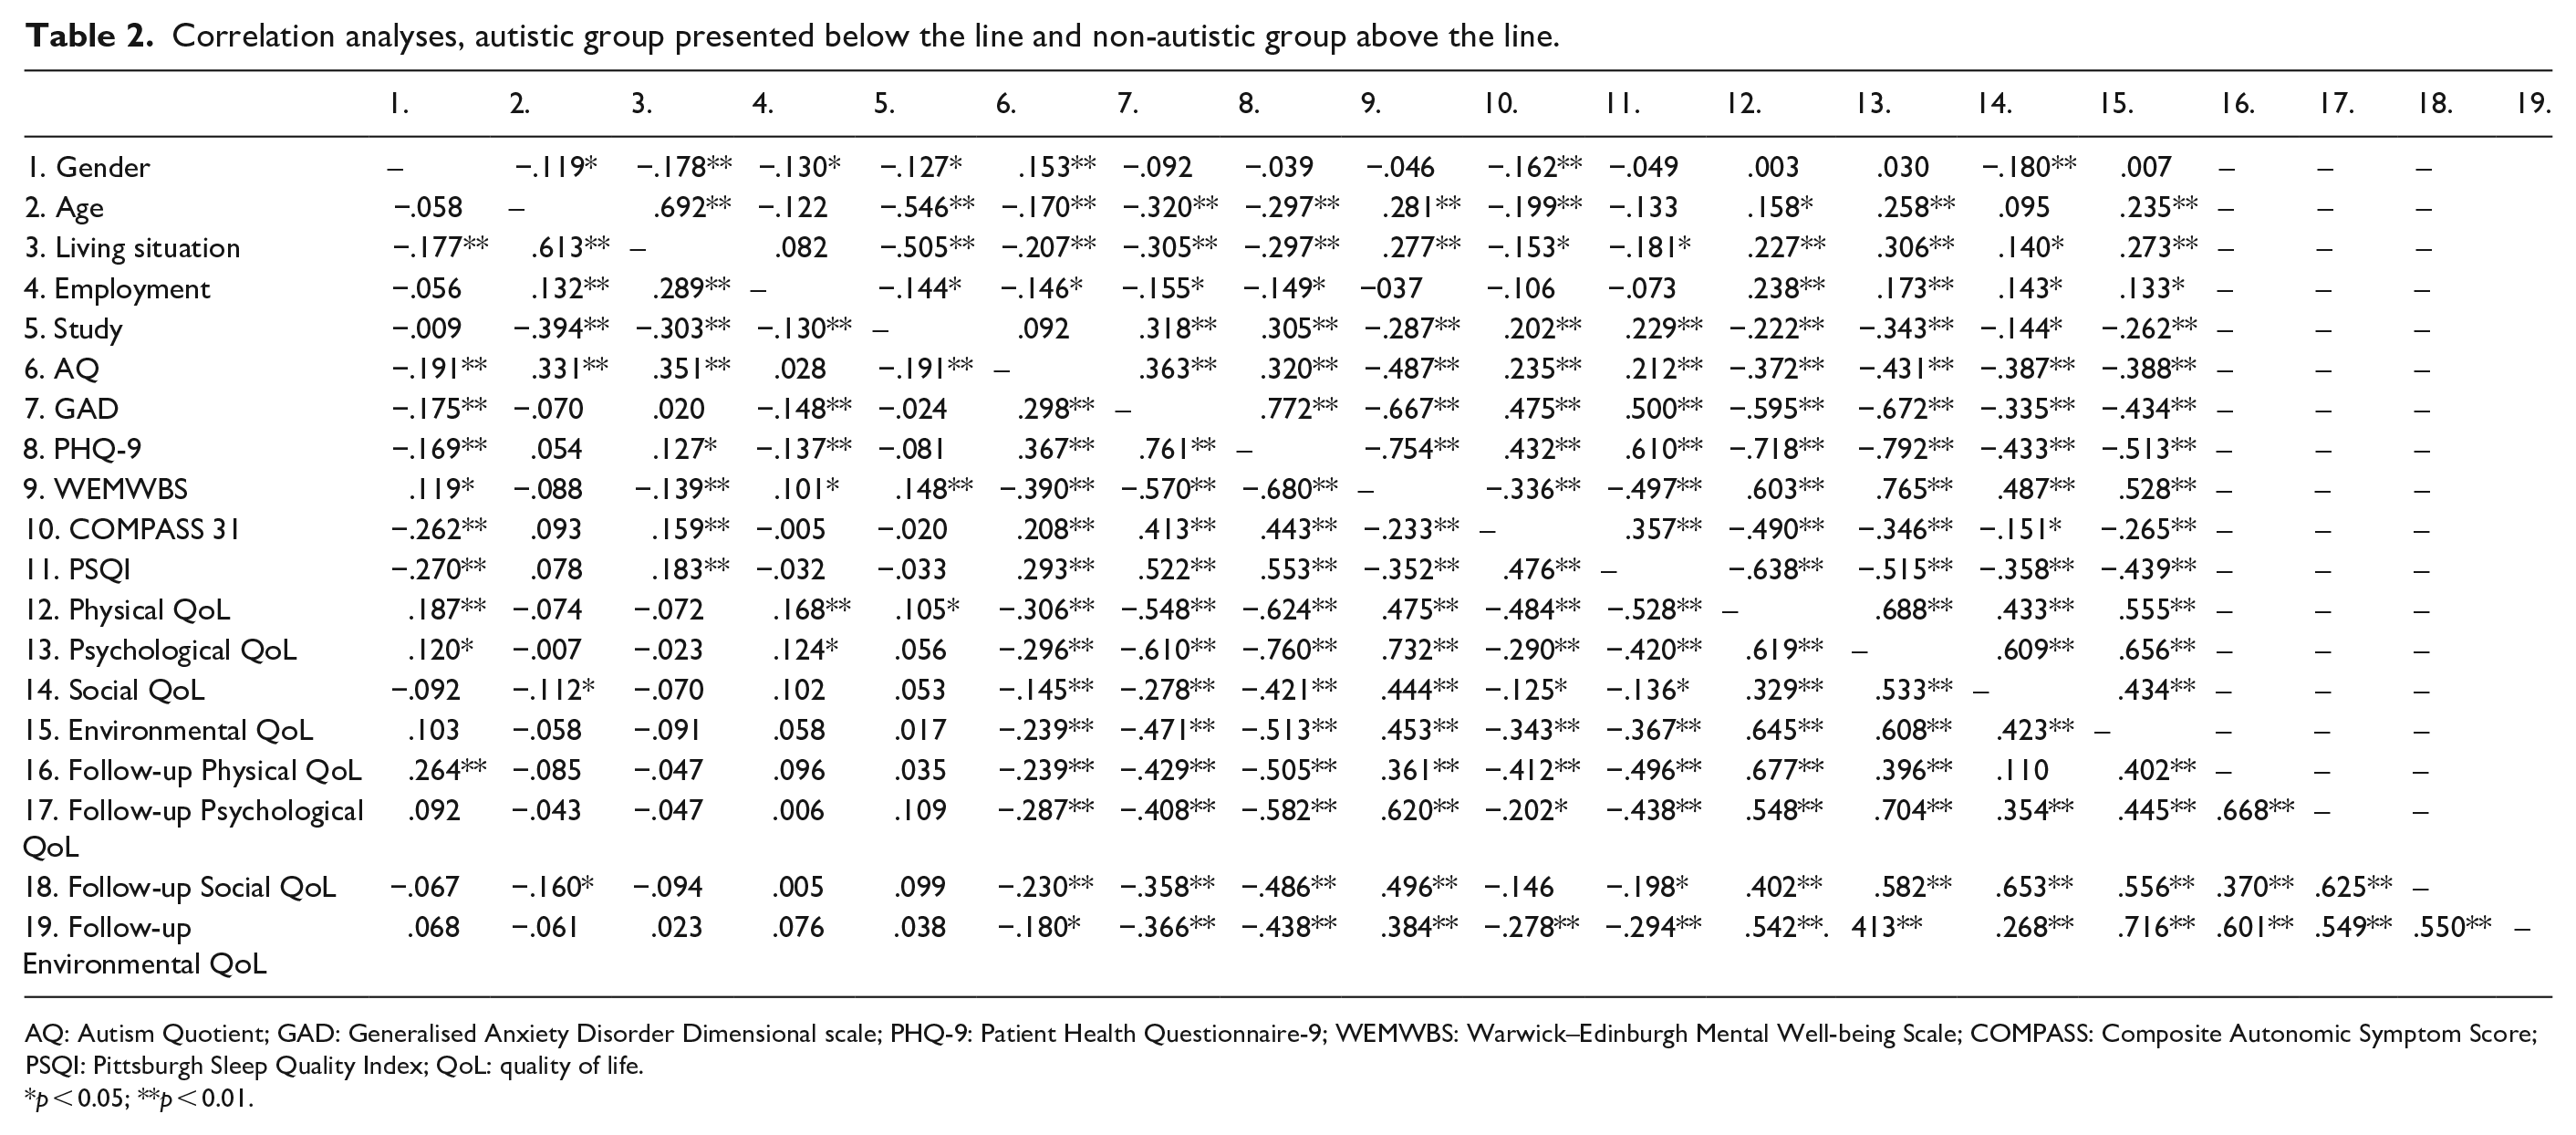
AQ: Autism Quotient; GAD: Generalised Anxiety Disorder Dimensional scale; PHQ-9: Patient Health Questionnaire-9; WEMWBS: Warwick–Edinburgh Mental Well-being Scale; COMPASS: Composite Autonomic Symptom Score; PSQI: Pittsburgh Sleep Quality Index; QoL: quality of life.
p < 0.05; **p < 0.01.
Cross-sectional analyses
The results from all cross-sectional regression models are presented in Table 3. Considering Physical QoL for both the autistic and the non-autistic groups, demographics, autistic traits, vocation, mental health and physical health all accounted for a significant proportion of the variance with the final models accounting for 52.0% and 70.5% of variance, respectively. For the autistic sample, AQ-short (Β = −0.040, SE = 0.013, β = −0.157, BCa 95% CI: (−0.065, −0.013)), PHQ-9 (B = −0.154, SE = 0.038, β = −0.353, BCa 95% CI: (−0.230, −0.070)), COMPASS 31 (B = −0.046, SE = 0.012, β = −0.235, BCa 95% CI: (−0.060, −0.023)) and PSQI (B = −0.143, SE = 0.047, β = −0.194, BCa 95% CI: (−0.242, −0.047)) were all significant unique predictors in the final model. In the non-autistic sample, gender (B = −0.738, SE = 0.319, β = −0.117, BCa 95% CI: (−1.344, −0.080)), PHQ-9 (B = −0.185, SE = 0.038, β = −0.464, BCa 95% CI: (−0.259, −0.106)), COMPASS 31 (B = −0.037, SE = 0.012, β = −0.205, BCa 95% CI: (−0.061, −0.014)) and PSQI (B = −0.165, SE = 0.039, β = −0.243, BCa 95% CI: (−0.238, −0.088)) were all significant unique predictors in the final model.
Results from cross-sectional hierarchical regression models.
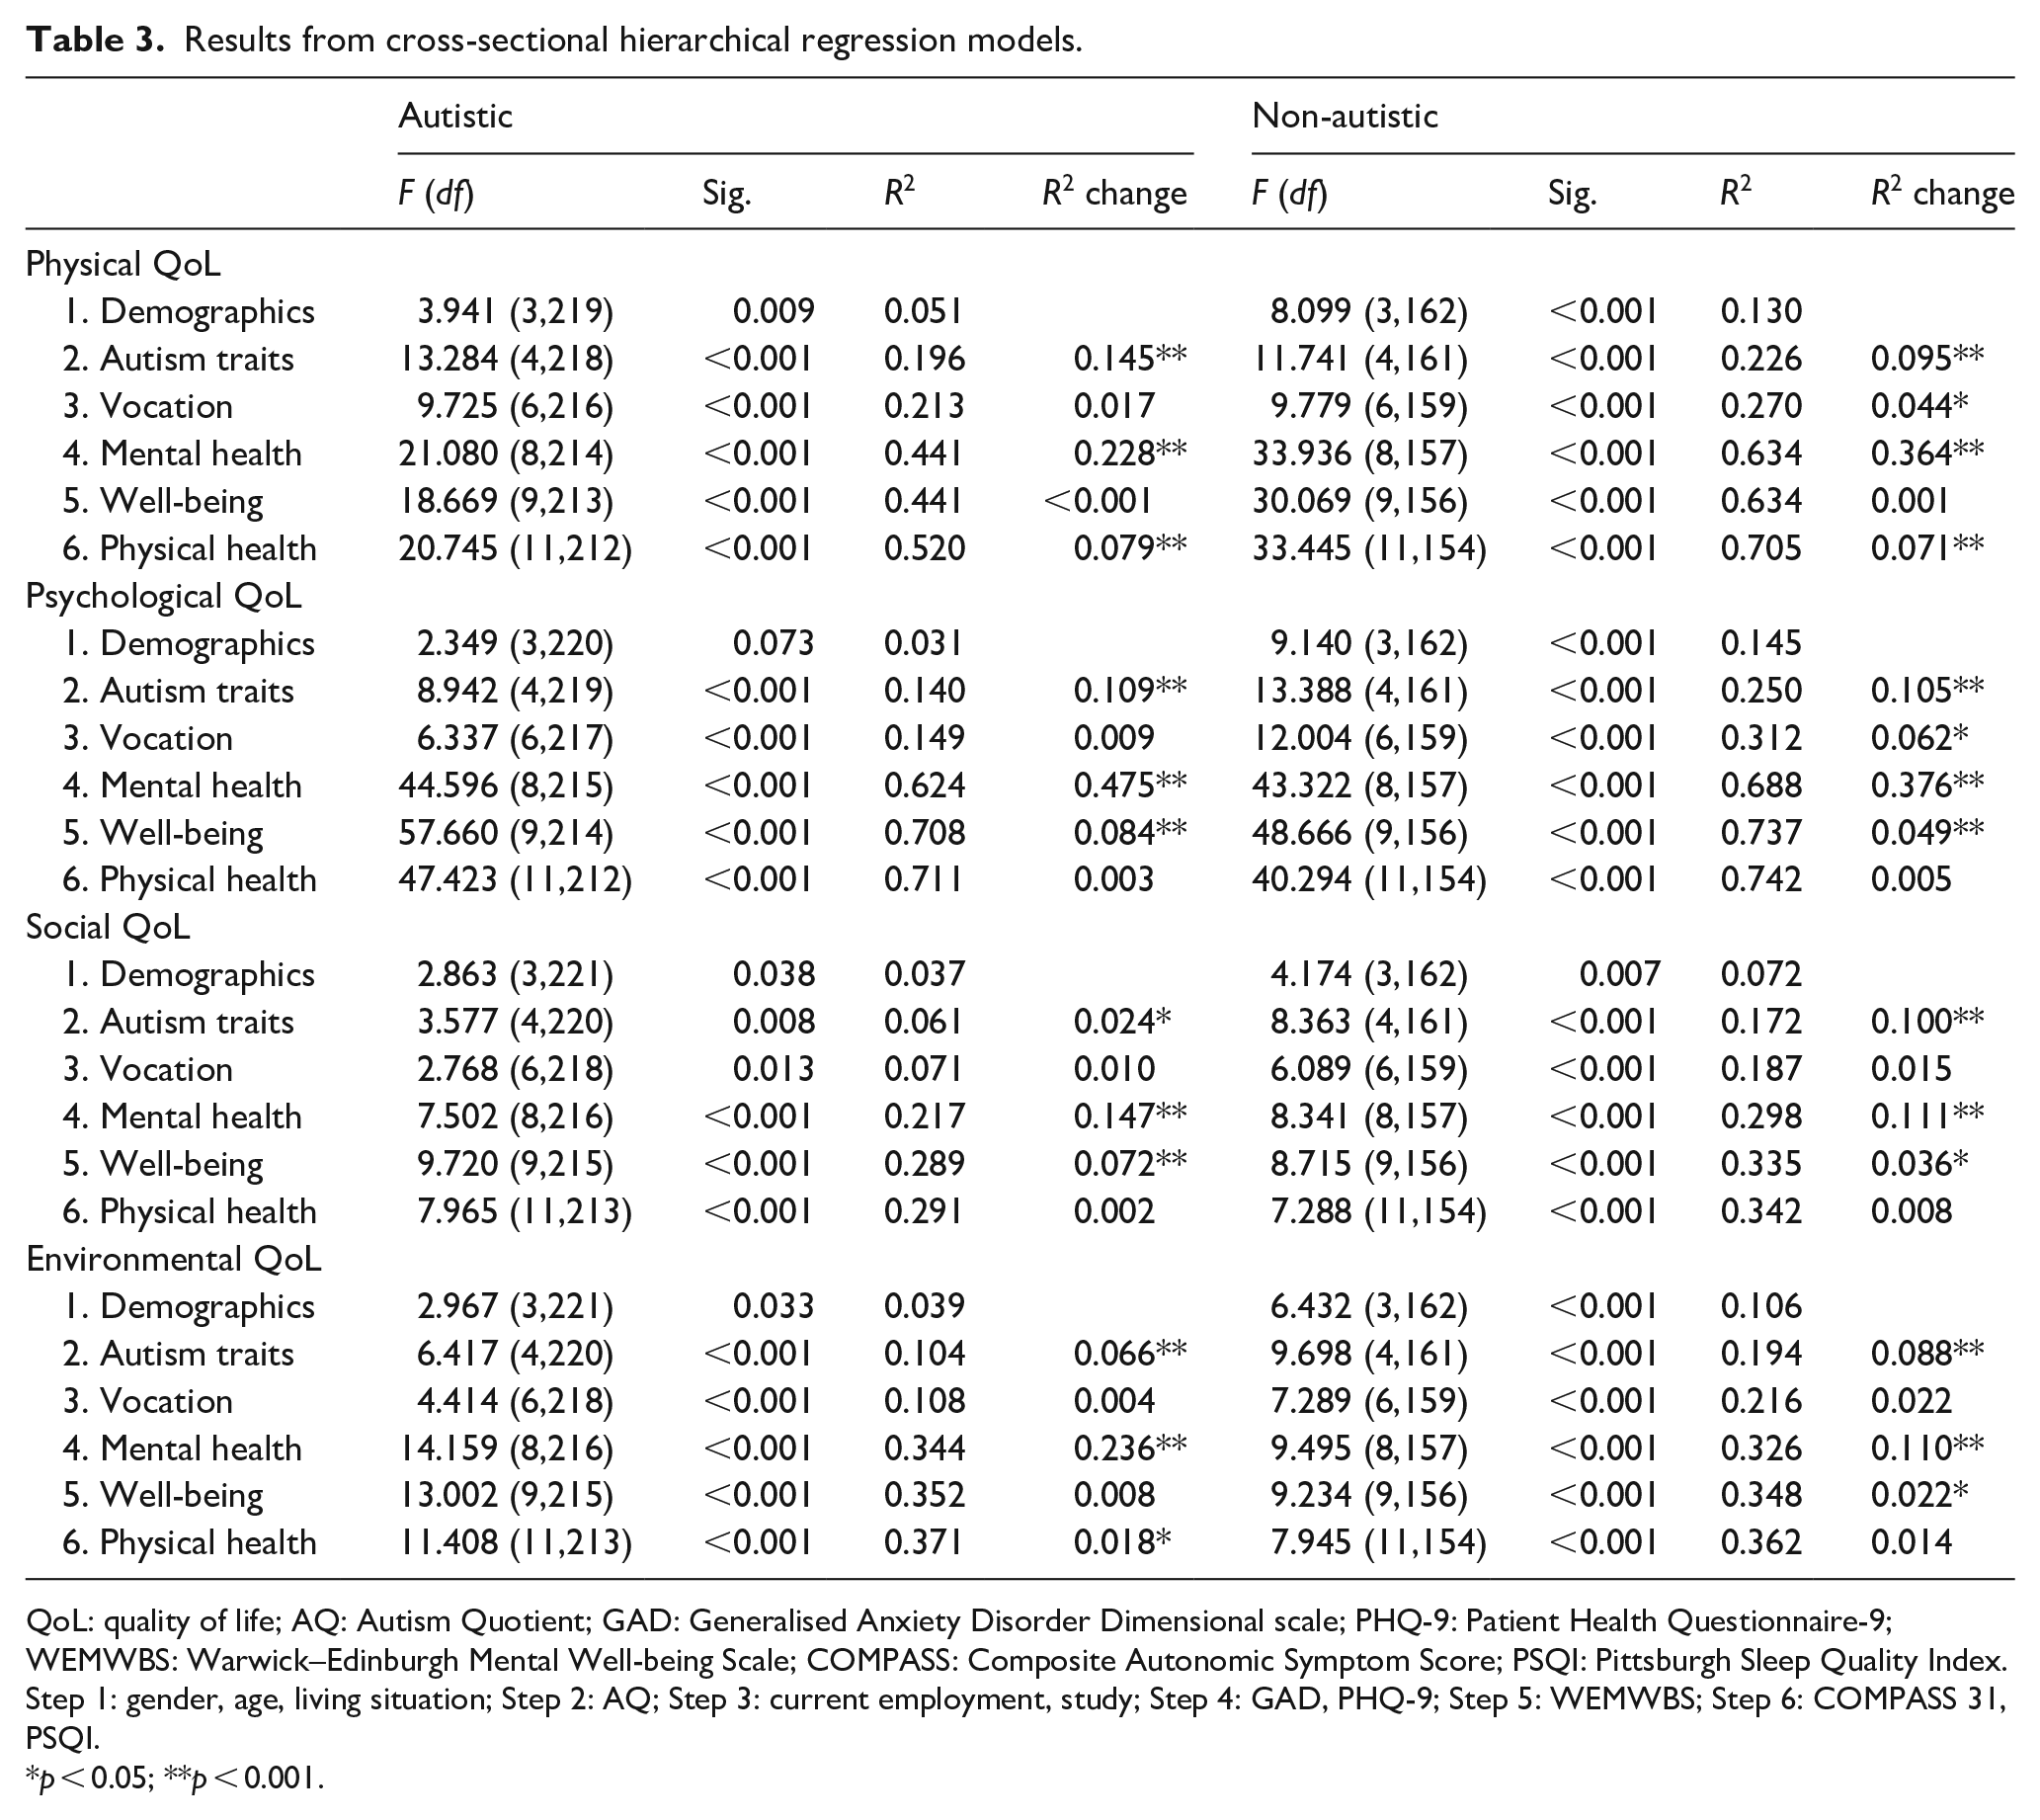
QoL: quality of life; AQ: Autism Quotient; GAD: Generalised Anxiety Disorder Dimensional scale; PHQ-9: Patient Health Questionnaire-9; WEMWBS: Warwick–Edinburgh Mental Well-being Scale; COMPASS: Composite Autonomic Symptom Score; PSQI: Pittsburgh Sleep Quality Index.
Step 1: gender, age, living situation; Step 2: AQ; Step 3: current employment, study; Step 4: GAD, PHQ-9; Step 5: WEMWBS; Step 6: COMPASS 31, PSQI.
p < 0.05; **p < 0.001.
Examining Psychological QoL in the autistic sample, autistic traits, mental health and well-being all accounted for a significant proportion of the variance. The final model accounted for 71.1% variance in Psychological QoL, and the unique predictors were living situation (B = 0.956, SE = 0.303, β = 0.151, BCa 95% CI: (0.389, 1.534)), PHQ-9 (B = −0.221, SE = 0.028, β = −0.498, BCa 95% CI: (−0.275, −0.166)) and WEMWBS (B = 0.133, SE = 0.017, β = 0.454, BCa 95% CI: (0.099, 0.165)). Among the non-autistic sample, demographics, autistic traits, vocation, mental health and well-being accounted for significant proportions of the variance. The final model accounted for 74.2% of the variance in Psychological QoL, with PHQ-9 (B = −0.277, SE = 0.047, β = −0.277, BCa 95% CI: (−0.375, −0.179)) and WEMWBS (B = 0.123, SE = 0.024, β = 0.397, BCa 95% CI: (0.075, 0.167)) being significant unique predictors.
For both the autistic and the non-autistic samples, autism traits, vocation, mental health and well-being accounted for a significant proportion of variance in Social QoL. The final models accounted for 29.1% (autistic) and 34.2% (non-autistic) of the total variance. In the autistic sample, age (B = −0.049, SE = 0.022, β = −0.192, BCa 95% CI: (−0.090, −0.009)), gender (B = −0.156, SE = 0.518, β = −0.149, BCa 95% CI: (−2.176, −0.202)), PHQ-9 (B = −0.126, SE = 0.062, β = −0.229, BCa 95% CI: (−0.250, −0.022) and WEMWBS (B = 0.148, SE = 0.034, β = 0.407, BCa 95% CI: (0.082, 0.210)) were significant unique predictors. For the non-autistic sample, WEMWBS (B = 0.110, SE = 0.047, β = 0.331, BCa 95% CI: (0.011, 0.204) was the only significant unique predictor.
For both groups, demographics, autistic traits and mental health all affected Environmental QoL. In addition, physical health in the autistic group, and psychological well-being in the non-autistic group, also influenced Environmental QoL. The final models accounted for 37.1% (autistic) and 36.2% (non-autistic) variance, respectively. Depressive symptomatology was a significant unique predictor for autistic adults (B = −0.148, SE = 0.041, β = −0.344, BCa 95% CI: (−0.229, −0.066)), while for the non-autistic group, psychological well-being was the only significant unique predictor (B = 0.055, SE = 0.027, β = 0.252, BCa 95% CI: (0.008, 0.106)).
Longitudinal analyses
Table 4 presents the results from the four longitudinal hierarchical regression models. Examining follow-up Physical QoL in the autistic sample, demographics, autism traits, mental health, physical health and baseline Physical QoL accounted for a significant proportion of the variance. At step 6, prior to the addition of baseline Physical QoL, PSQI was the only unique predictor (B = −0.226, SE = 0.098, β = −0.271, BCa 95% CI: (−0.410, −0.006)). However, in the final model, which accounted for 54.0% variance, baseline Physical QoL (B = 0.539, SE = 0.139, β = 0.472, BCa 95% CI: (0.250, 0.834)) was the only unique predictor. For 24-month Psychological QoL, autism traits, mental health, well-being, physical health and psychological QoL at baseline all accounted for significant proportion of variance. At step 6, prior to the addition of baseline Psychological QoL, WEMWBS was the only significant unique predictor (B = 0.139, SE = 0.042, β = 0.402, BCa 95% CI: (0.056, 0.231)). The final model accounted for 53.5% variance, and baseline Psychological QoL (B = 0.550, SE = 0.155, β = 0.472, BCa 95% CI: (0.251, 0.892)) was the only unique predictor.
Results from longitudinal hierarchical regression models.

QoL: quality of life; AQ: Autism Quotient; GAD: Generalised Anxiety Disorder Dimensional scale; PHQ-9: Patient Health Questionnaire-9; COMPASS: Composite Autonomic Symptom Score; PSQI: Pittsburgh Sleep Quality Index.
Step 1: gender, age, living situation; Step 2: AQ; Step 3: current employment, study; Step 4: GAD, PHQ-9; Step 5: WEMWBS; Step 6: COMPASS 31, PSQI; Step 7: Baseline QoL.
p < 0.05; **p < 0.001.
Baseline autism traits, mental health, well-being and Social QoL accounted for a significant proportion of variance in Social QoL at follow-up. At step 6, prior to the addition of baseline Social QoL, there were no unique predictors. The final model predicted 54.9% variance, and the only unique predictor was baseline Social QoL (B = 0.547, SE = 0.108, β = 0.481, BCa 95% CI: (0.333, 0.777)). For Environmental QoL at follow-up, only baseline mental health and Environmental QoL accounted for a significant proportion of variance. At step 6, prior to the addition of baseline Environmental QoL, there were no unique predictors. In the final model, 50.5% variance was accounted for, and only baseline Environmental QoL (B = 0.708, SE = 0.116, β = 0.647, BCa 95% CI: (0.484, 0.936)) was a significant unique predictor.
Discussion
This study provides the first examination of cross-sectional and longitudinal contributors to four domains of QoL (Physical, Psychological, Social and Environmental) in autistic individuals aged between 15 and 80 years. Consistent with previous reports, our autistic group had poorer mental and physical health and were more likely to be unemployed than the non-autistic group (ABS, 2017; Baker & Richdale, 2015; Croen et al., 2015; Hedley et al., 2016). As hypothesised (and concerningly), the autistic group had poorer QoL across the four domains than did the non-autistic group. The finding that QoL was poorer in autistic individuals is consistent with the literature (Knüppel et al., 2018; Mason et al., 2018; van Heijst & Geurts, 2015).
Cross-sectional predictors of QoL domains
There was a striking similarity between the autistic and the non-autistic groups in the pattern of factors affecting QoL (Table 5). First, across the four domains, demographic variables, autism traits and mental health all contributed to QoL. Second, depression symptomatology contributed uniquely to all QoL domains for the autistic individuals and to Physical and Psychological QoL in the non-autistic sample. Third, psychological well-being was a unique predictor of Psychological and Social QoL for both groups, and finally, autonomic symptomatology and sleep quality uniquely predicted Physical QoL for both groups.
Summary of significant findings from the cross-sectional regression analyses.

QoL: quality of life.
Demographics (age, gender, living situation), vocation (employment, study), mental health (anxiety, depression) and physical health (sleep quality and autonomic symptoms).
Our findings are consistent with reports that mental and physical health are associated with QoL in non-autistic (Caron et al., 2019; Mapatwana et al., 2019; Marques et al., 2017) and autistic (Knüppel et al., 2018; Mason et al., 2018) samples. However, to date, the role of psychological well-being in predicting QoL among autistic individuals has not been considered. Our results illustrate that in addition to anxiety and depression symptomatology, psychological well-being is a significant and unique predictor of Psychological, Social and Environmental QoL in autistic individuals. This suggests an additional avenue for supporting improved QoL in autistic adolescents and adults.
Our analyses showed that sleep quality and autonomic symptomatology (physical health) were significant predictors of Physical QoL in both the autistic and the non-autistic samples. This is consistent with previous work in non-autistic samples, which found sleep quality and somatisation were related to Physical, Psychological and Environmental QoL (Marques et al., 2017), and that poor sleep quality or sleep duration is associated with reduced health-related QoL (Darchia et al., 2018; Liu et al., 2018). In autistic samples, sleep difficulties have also been related to reduced QoL in adults (Knüppel et al., 2018) and health-related QoL in children (Delahaye et al., 2014). In contrast, Mason et al. (2018) found no association between the presence of a physical health diagnosis and QoL in autistic adults. However, physical health was only measured as a single dichotomous question, while our study was able to capture the variance associated with continuous measures of sleep quality and autonomic symptoms. The current findings highlight the importance of physical health in relation to Physical QoL.
We also found that autism traits on the AQ-short uniquely predicted Physical QoL in autistic but not non-autistic adults. In addition, age and gender were related to Social QoL, such that autistic males had poorer Social QoL than autistic females, and older autistic individuals had poorer Social QoL than younger autistic individuals. Finally, among autistic adults, but not non-autistic adults, living independently was associated with better Psycho-logical QoL. These results contrast with Mason et al. (2018), who found that autistic traits measured on the Social Responsiveness Scale was a unique predictor of all QoL domains, autistic females had lower QoL on three of the four domains (except Social QoL) and there was no impact of age or living situation on QoL. Furthermore, our Australian autistic adults reported higher QoL across the four domains compared to the Mason et al. (2018) sample of 370 similarly aged autistic adults in the United Kingdom. It is possible that lower QoL in the UK sample may be due to differences in service provision, supports and societal attitudes, and differences in the impact of autistic traits may be attributed to differences in measures used. However, the disparities in the role of gender and age are less easily explained; both samples had a similar age range/mean and a large proportion of females. There is a burgeoning literature on social camouflaging, suggesting that this occurs more among females (e.g. Hull et al., 2017), and data suggesting Australian autistic females have relatively high social satisfaction (Baldwin & Costley, 2016) which may relate to the higher Social QoL found in this study. Overall, the models presented in this study were able to explain more variance for all QoL domains (except Environmental QoL) than previously (Mason et al., 2018). Of interest, our Psychological QoL model explained more than double the variance than that presented by Mason et al. (2018), which may be due to our inclusion of continuous measures as predictors. Together with the results from our cross-sectional analyses, it highlights the importance of depression symptomatology, psychological well-being, sleep quality and autonomic symptomatology in QoL for both autistic and non-autistic adolescents and adults.
Longitudinal predictors of QoL in autistic adolescents and adults
Across the 2 years, there was no significant change in Psychological or Social QoL for our autistic adults, and both Physical and Environmental QoL decreased slightly. Furthermore, the best predictor of QoL at the 2-year follow-up was QoL at baseline. A recent meta-analysis across 11 countries reported that interventions that improve social, environmental and health factors can lead to measurable improvements in WHOQoL-BREF scores over time periods less than 2 years in non-autistic populations (Skevington & Epton, 2018); this suggests our autistic individuals may not be receiving appropriate supports. While autism traits and mental health influenced all QoL domains longitudinally, with well-being and physical health additionally influencing Psychological QoL, the only unique predictor of later QoL across four domains was prior QoL. This is contrary to Deserno et al. (2019), who reported that sleep problems interfering with daily function predicted subjective QoL 2 years later. However, Deserno et al. (2019) used a single question to measure subjective QoL, while our study has investigated QoL across four domains. Furthermore, Deserno et al. (2019) did not control for baseline QoL when examining longitudinal predictors.
Examining the role of sleep quality prior to the addition of baseline QoL, we found that poor baseline sleep quality predicted poor Physical QoL at 2 years. In addition, while sleep quality significantly (p < 0.05) predicted Psycho-logical QoL at 2 years, both before and after the addition of baseline Psychological QoL, the 95% BCa confidence interval just crossed zero at both steps ((−0.438, 0.005) and (−0.414, 0.015), respectively). We also expected depressive symptomatology and psychological well-being to influence later QoL, thus we examined their role prior to the addition of baseline QoL. Psychological well-being was a unique predictor of Psychological QoL prior to the addition of baseline QoL. However, while depression significantly (p < 0.05) predicted both Psychological and Social QoL, in both cases, the 95% BCa confidence interval crossed zero ((−0.311, 0.010) and (−0.449, −0.024), respectively). Therefore, our results suggest that while QoL is the best predictor of subsequent QoL, sleep quality, depression and psychological well-being are also factors of interest.
Strengths and limitations
Our study is unique in covering the age range of 15–80 years with a good sample size, measuring all QoL domains at both baseline and 2 years later, and having a comparison group at baseline. Furthermore, we were able to examine a range of variables previously reported as associated with subjective QoL in autistic or non-autistic samples. Nevertheless, our analyses did not include variables such as loneliness and social supports, and we were limited in the number of demographic variables (e.g. SES was not available for enough participants) we were able to include. In addition, our vocation variables were limited to simple presence or absence, and therefore this did not allow for exploring type, stability or quality of employment, nor person-to-job fit, each of which may affect QoL in autistic adults directly or indirectly. These factors may account for the reduced variance explained by our models for both Social and Environmental QoL, compared with the Physical and Psychological QoL models. An additional issue is that most of the non-autistic group was female, and around half the autistic group were also women. This is not representative of the expected gender ratio for either sample, but often occurs in online and questionnaire studies (e.g. Mason et al., 2018). Gender did influence Social QoL for autistic adults and Physical QoL in the non-autistic group, but it was males who were likely to have poorer QoL. The higher proportion of females in the non-autistic compared to the autistic group may also explain why there was no gender relationship observed in the non-autistic sample. Furthermore, collecting additional information about living situation (e.g. reason for present situation, barriers to change) could be helpful for a better understanding of QoL in autistic adults. Finally, due to the online nature of the studies, it was not possible to conduct an independent assessment of ASD diagnosis, but all participants in the autistic sample reported receiving a formal diagnosis from an appropriate clinician.
Conclusion
All models accounted for a large amount of variance, with the model for Psychological QoL accounting for over 70% of variance for both groups; several conclusions can thus be drawn from the results, regardless of autistic diagnosis. First, the major influence on subjective QoL across domains was depressive symptomatology. Second, psychological well-being contributed to all QoL domains except Physical QoL. Third, the physical health variables, sleep quality and autonomic symptoms, influence Physical QoL. In addition, for the autistic individuals, baseline QoL has the greatest influence on QoL 2 years later.
These findings imply that to improve QoL for autistic individuals, attention needs to be paid to improving mental health, particularly depression. Sleep quality and autonomic symptoms associated with poor physical and mental health also need to be addressed. We know that these factors are inter-related in both autistic and non-autistic populations, and evidence from the depression literature has shown that addressing both depression and insomnia generally leads to better clinical outcomes (e.g. Manber et al., 2016). Thus, interventions that target depression and insomnia symptomatology and lead to improved psychological well-being in autistic adolescents and adults are sorely needed. As well, we need a better understanding of the additional factors that influence Social and Environmental QoL.
Footnotes
Acknowledgements
The authors would like to thank the contribution of Dr Mirko Uljarević, Dr Kitty-Rose Foley and Dr Ru Cai to the original conceptualisation and early recruitment for the two databases from which the current data are drawn. They would also like to thank all the participants, with and without an autism spectrum disorder diagnosis, who contributed to this study. Finally, they would like to thank their co-author, Mr Josh Vartuli, who, as well as his other contributions to this paper, was able to comment on the findings and conclusions from the perspective of an adult on the autism spectrum.
Author contributions
L.P.L. completed all statistical analyses and wrote the Results; A.L.R. conceptualised the study and drafted the Introduction and Discussion; A.H. and R.L.F. supervised J.V.; A.H. merged and cleaned both longitudinal data files and checked the final data file and wrote the Method; J.V. hand-coded multiple variables, wrote syntax for variable calculation, calculated variables included in the final data file and contributed to the Materials, and J.V. also assisted in interpretation of the results and provided ideas of what may explain the variance that future studies could explore. All authors except J.V. are involved in the ongoing recruitment and management of the two longitudinal studies used in this paper. L.P.L., A.L.R., A.H., J.V., R.L.F. and J.N.T. provided comment on drafts of the paper. All authors read and commented on the paper prior to submission.
Declaration of conflicting interests
The author(s) declared no potential conflicts of interest with respect to the research, authorship and/or publication of this article.
Funding
The author(s) disclosed receipt of the following financial support for the research, authorship and/or publication of this article: The authors acknowledge the financial support of the Cooperative Research Centre for Living with Autism (Autism CRC), established and supported under the Australian Government’s Cooperative Research Centres Programme. The positions held by Dr Lauren Lawson, Ms Alex Haschek, Dr Rebecca Flower and Dr Samuel Arnold are funded by the Autism CRC.
