




Abstract
There is often a large time gap between caregivers’ initial concerns and the diagnosis of autism spectrum disorder. The current study aimed to identify factors associated with missed or delayed autism spectrum disorder diagnoses among children in Colorado. In a surveillance-based sample of 8-year-old children with autism spectrum disorder (N = 572), we examined differences between children who were identified with autism spectrum disorder by a community provider and/or were eligible for special education services under an autism eligibility (documented diagnosis) and children who were first identified with autism spectrum disorder through a systematic record review (newly identified). Compared to documented diagnosis children, newly identified children were more likely to be female, aggressive, and argumentative. They were less likely to have had a developmental regression, sleep abnormalities, or an autism screener or diagnostic measure in their records. Newly identified children also had a poorer quality of information in their records. Furthermore, among documented diagnosis children, variations in clinical presentations were associated with significantly different mean ages at autism spectrum disorder diagnosis; children who showed early delays, motor abnormalities, hyperactivity and attention deficits, and odd responses to sensory stimuli received a diagnosis much earlier than documented diagnosis children with other clinical presentations.
Lay abstract
Although autism can be reliably diagnosed as early as 2 years of age, many children are not diagnosed with autism until much later. We analyzed data to determine why many of the 8-year-old children who resided in Colorado and were identified as having autism through a review of their health and/or educational records did not have a documented clinical diagnosis of autism and were not eligible for special education services under an autism eligibility. We found that children who did not have a documented clinical diagnosis of autism and were not eligible for special education services under an autism eligibility were more likely to be female, aggressive, and argumentative. They had a poorer quality of information in their records and were less likely to have had a developmental regression, sleep problems, or an autism screener or diagnostic measure in their records. These results suggest that the symptoms characteristic of autism among this group of children may have been attributed to another disorder and that clinicians may be able to recognize autism more readily in children with more functional impairment and those who experience a developmental regression. We also discovered that differences in symptom presentations among children who had a documented clinical diagnosis of autism and/or were eligible for special education services under an autism eligibility were associated with different ages at autism diagnosis.
Research indicates that early intervention can place children with autism spectrum disorder (ASD) on a developmental trajectory toward improved outcomes and functioning (Fernell et al., 2013; Kuppens & Onghena, 2012; Magiati et al., 2014). Therefore, the early and accurate identification of ASD is paramount to optimize outcomes of children with ASD. Many symptoms of ASD are noticeable early in childhood and often lead caregivers to report concerns about their children’s development prior to the age of 3 years (Becerra-Culqui et al., 2018). While ASD can be reliably diagnosed in children as young as 24 months of age (Charman et al., 2005; Kleinman et al., 2008), research consistently shows that a large gap exists between the age at which children with ASD can be diagnosed and the age at which they are diagnosed, with many children not receiving a diagnosis until school age (Daniels et al., 2014; Shattuck et al., 2009). Missed diagnoses limit access to important early interventions and supports during a critical developmental period, leading to missed opportunities to maximize positive outcomes for children with ASD.
Although the reasons for a missed diagnosis are likely to be complex, several sociodemographic and clinical factors have been associated with missed ASD diagnoses (e.g. Daniels & Mandell, 2014), including sex (Begeer et al., 2013), socioeconomic status (SES; Durkin et al., 2017), racioethnicity (Angell et al., 2018), and symptom presentation (Levy et al., 2010; Ozonoff et al., 2018; Wiggins et al., 2006). For example, it is well documented that males are more likely to be diagnosed with ASD than females (Duvekot et al., 2017; Halladay et al., 2015; Mandy & Lai, 2017), with studies reporting male-to-female ratios ranging from 2:1 (Idring et al., 2015) to 5:1 (Lai et al., 2015). Prevalence studies have also reported that children from lower income families are more likely to be diagnosed with ASD later than children from families with a higher SES (Daniels & Mandell, 2014; Liptak et al., 2008; Mazurek et al., 2014). Similarly, even though there is no evidence of racial and ethnic differences in the clinical phenotype of ASD, numerous studies have reported significantly lower prevalence rates among Black and Hispanic children compared to non-Hispanic White children (Baio et al., 2018; Mandell et al., 2007; Rosenberg et al., 2011). In addition, several studies have shown that children who present with less severe ASD symptoms (Mazurek et al., 2014; Rosenberg et al., 2011) and co-occurring psychiatric conditions (Levy et al., 2010) receive a diagnosis of ASD at older ages. The differences in ASD diagnostic rates across sociodemographic and clinical factors indicate that there are considerable disparities in ASD identification; however, these disparities, particularly sociodemographic disparities, are not fully understood (e.g. Durkin et al., 2017). As such, it is imperative that the factors that underlie these disparities are better understood so interventions and practices that can reduce the disparities can be developed and implemented.
Current study
The number of 8-year-old children that are identified with ASD by the Colorado Autism and Developmental Disabilities Monitoring (CO-ADDM) Project as part of the Centers for Disease Control and Prevention’s (CDC) ADDM Network, a population-based surveillance system of ASD and other developmental disabilities (Maenner et al., 2020), tends to be lower than the average number of 8-year-old children identified with ASD across all ADDM sites. For example, in 2016 (the most current data available), the average number of children identified with ASD across all ADDM sites was 1 in 54; however, only 1 in 76 children were identified with ASD by the CO-ADDM Project (Maenner et al., 2020). Of the six ADDM sites that had an average prevalence rate that was lower than the average rate across all ADDM sites (i.e. 1 in 54), Colorado had the lowest average network site prevalence rate. Furthermore, 33% of the children identified with ASD by the CO-ADDM Project in the 2016 study year did not have either a documented clinical diagnosis or educational identification (i.e. an eligibility for special education services under an autism disability) in their health or education records, indicating that a significant number of children with ASD in Colorado may not be receiving optimal intervention services. While several factors (e.g. racioethnicity) have been associated with missed ASD diagnoses, it is unclear what other factors are associated with the disparities in the identification of children with ASD in Colorado. Therefore, the current study aimed to identify factors associated with missed or delayed ASD identification among children in Colorado. We hypothesized that compared to children who had a documented identification of ASD in their records, children who were newly identified (NI) were more likely to (1) be female, (2) be a racial or ethnic minority, (3) live in a low-income family, (4) lack an autism screener or diagnostic measure in their records, (5) have received their first developmental evaluation at older ages, (6) have fewer developmental evaluations in their records, (7) have poorer quality of information in their records, (8) only have educational records available for review, and (9) present with less symptom impairment.
Methods
Participants and procedure
The current study utilized surveillance data from the CO-ADDM Project’s 2014 study year. The CO-ADDM Project uses surveillance methodology common to all ADDM network sites to identify 8-year-olds with ASD. ADDM surveillance methods have been described in detail in other studies (e.g. Baio et al., 2018; Wiggins et al., 2009). Surveillance of children who resided in one of the 7 counties in Colorado (i.e. Adams, Arapahoe, Boulder, Broomfield, Denver, Douglas, and Jefferson counties) and turned 8 years old during 2014 was conducted by trained staff in two phases: screening and abstracting health and/or education records and a systematic review of all abstracted records by trained clinicians.
Records were screened to identify children previously identified with ASD, children suspected of having ASD, and children exhibiting ASD-specific “triggers” or behavioral descriptions strongly associated with ASD (e.g. poor eye contact, delayed or echoed speech, repetitive behaviors, etc.). Developmental evaluations of children who fell in either of these three categories were abstracted and combined into one composite record. Family and child sociodemographic information (e.g. birth certificate and census-tract data) were linked to the abstracted data. Children’s composite records included demographic information, available intelligent quotient (IQ) and adaptive behavior test scores, as well as the presence or absence of the following: each of the Diagnostic and Statistical Manual of Mental Disorders, Fourth Edition, Text Revision (DSM-IV-TR; American Psychiatric Association, 2000) criteria for ASD, developmental delays at or before 3 years of age, developmental regression or plateau, autism “discriminators” (e.g. uses others as tools, visual inspection, significant sensory preoccupation), and features associated with ASD (e.g. sleep/eating abnormalities). Composite records were reviewed by CDC-trained clinicians to determine whether the child met the ADDM ASD case definition, which, for the 2014 study year, was based on the DSM-IV-TR criteria. After a composite record review, a child’s final ASD case status was categorized as either a Confirmed Case (i.e. the child met the ADDM ASD case definition), a Suspected Case, or Does Not Qualify (DNQ). In addition, during record reviews, clinician reviewers rated the overall quality of the record using a 1–5 scale, ranging from poor to excellent based on the amount and detail of information in the record that could be used to rule out or confirm ASD.
Our sample included 572 children aged 8 years who resided in Colorado in 2014 and were categorized by ADDM as a Confirmed ASD Case. Due to missing data on one of the variables of interest (e.g. racioethnicity) in the analyses, the number of children included in our analyses varies. Children were grouped according to whether they had a clinical diagnosis or educational identification of ASD in their health or educational records (documented diagnosis; DDx) or not (NI). That is, NI children did not have a documented clinical diagnosis or educational identification of ASD in their records, but they were identified as a Confirmed ASD Case after systematic record review by CDC-trained clinicians. Sociodemographic characteristics of children within the DDx and NI groups are presented in Table 1.
Sociodemographics of confirmed ASD cases (N = 572), with (documented diagnosis; DDx) and without (newly identified; NI) a previously documented ASD diagnosis, Colorado ADDM Network surveillance site, 2014.
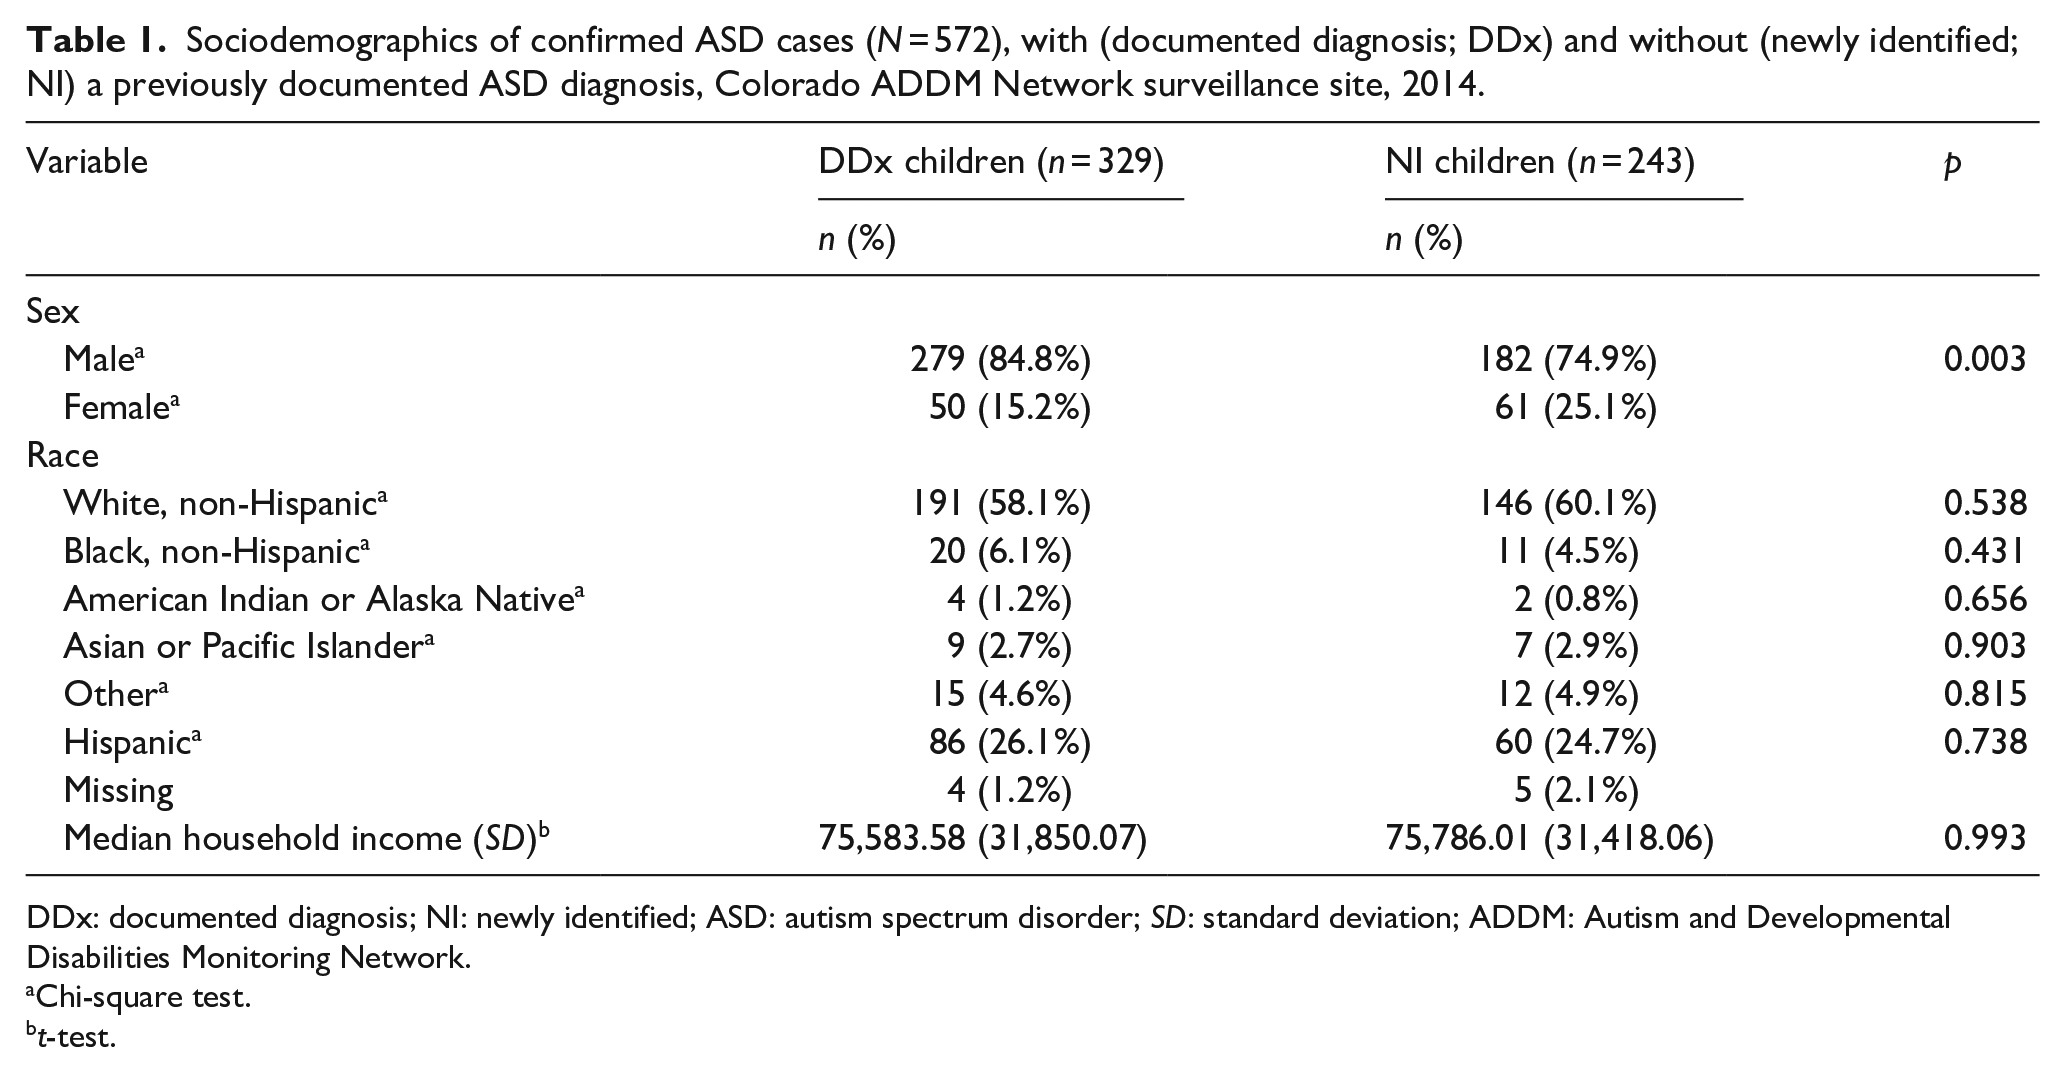
DDx: documented diagnosis; NI: newly identified; ASD: autism spectrum disorder; SD: standard deviation; ADDM: Autism and Developmental Disabilities Monitoring Network.
Chi-square test.
t-test.
Measures
Clinical presentation
Information about children’s symptom presentation are included in two sets of variables: autism discriminators and features associated with autism. Autism discriminators are specific behaviors that are more likely to be exhibited by a child with ASD than a child with another developmental disability, such as being oblivious to other children or adults or engaging in close visual inspection (Rice et al., 2007). Conversely, features associated with autism are symptoms that are often observed among children with ASD but are not exclusive to ASD (e.g. sleep or appetite disturbance). Due to the lack of variability in the autism discriminators (i.e. low rates of endorsement of the autism discriminators) in our sample, these variables were not used as categorical indicators in our analyses. The categorical indicators in our analyses included the presence/absence of social delays prior to the age of 3 years, language delays prior to the age of 3 years, and the following features frequently associated with ASD: abnormalities in eating; abnormalities in sleeping; abnormalities in mood or affect; aggression; argumentative, oppositional, defiant, or destructive behavior; motor abnormalities; hyperactivity and/or attention deficits; lack of fear; excessive fearfulness; odd responses to sensory stimuli; self-injurious behavior; staring spells; seizure-like activity; and temper tantrums.
Analytic plan
To identify factors associated with not having a previously documented ASD identification, two logistic regressions were conducted. The first examined whether the absence of a clinical diagnosis or educational identification of ASD at the age of 8 years (i.e. NI) was predicted by the following variables: sex, racioethnicity, the presence of at least one autism screener or diagnostic measure in children’s records such as the Autism Diagnostic Observation Schedule (2nd ed.; ADOS-2; Lord et al., 2012) or the Social Responsiveness Scale (SRS-2; Constantino & Gruber, 2012), the source of information in children’s records (i.e. 1: health, 2: education, or 3: health and education), the presence of developmental regression, social delays prior to the age of 3 years, language delays prior to the age of 3 years, and the aforementioned features associated with autism (e.g. sleep abnormalities), the age at earliest developmental evaluation on record, the number of developmental evaluations on record, and the quality of information in children’s records. A second logistic regression was conducted to identify factors associated with a later age of ASD diagnosis or educational identification (i.e. absence of an ASD identification by the age of 3 years) among DDx children, using the same predictor variables as in the first regression model.
Given that most of the DDx children were identified with ASD after the age of 3 years (i.e. 69.8%), latent class analysis (LCA) was used to identify clinical profiles among DDx children, with the presence/absence of social delays prior to the age of 3 years, language delays prior to the age of 3 years, and the features associated with autism (e.g. sleep abnormalities) included in the analysis as categorical indicators. That is, LCA was conducted to identify distinct, homogeneous classes of 8-year-olds for children who had a previous clinical diagnosis or educational identification of ASD. Then, the association between the latent classes and the children’s age at first known ASD diagnosis or educational identification was examined.
The following covariates were included in the latent class analyses: child sex, child racioethnicity, and the family’s within-ADDM median household income (measured as a percentile rank). The family’s within-ADDM median household income was obtained through the American Community Survey and serves as a ranking of each family’s income compared to that of other families within the entire 2014 ADDM surveillance area (i.e. across the 11 ADDM network sites). Due to the small proportion of females and children who did not identify as White, non-Hispanic/Latino in our sample, child sex and child racioethnicity were included as covariates instead of categorical indicators in the latent class analyses.
LCA analyses were conducted using Mplus 8 (Muthén & Muthén, 1998-2015). Due to the sizes of the various racial and ethnic groups in the sample, racial and ethnic differences in class membership were examined for the largest racial and ethnic groups in the sample, which were White, non-Hispanic/Latino, Black, non-Hispanic/Latino, and Hispanic or Latino, regardless of race; Children who were identified as other races were excluded from the analysis that examined potential racial differences in class membership. Dummy variables for the racial and ethnic categories were created, with Hispanic or Latino, regardless of race as the reference group.
A combination of statistical indicators of model fit (i.e. entropy, Bayesian Information Criterion (BIC), Consistent Akaike’s Information Criteria (CAIC), Approximate Weight of Evidence (AWE), and the Lo–Mendell–Rubin–adjusted likelihood ratio test (LMR-adjusted LRT)) was used to identify candidate models that fit the data well. Then, the substantive utility and meaning of the resultant classes were used to decide which of the candidate models fit the data the best. The best fitting models were examined to determine how homogeneous the classes were as well as how well the classes were differentiated. Once the classes were enumerated for the children who had a previous ASD diagnosis or educational identification, the classes were compared to identify similarities and differences in the clinical profiles within the group.
Results
The results of the logistic regression examining potential factors associated with a missed ASD identification among 8-year-old children in Colorado are summarized in Table 2. Consistent with hypotheses, the odds of being female was 2.059 times greater for children who did not have a previous ASD identification (NI children) than children who had a previous identification (DDx children). NI children were significantly less likely to have had at least one autism screener or diagnostic measure (e.g. SRS-2, ADOS-2) documented in their records than DDx children, and their records were 2.114 times more likely to have been only health records instead of health and educational records. The odds of experiencing developmental regression and sleep abnormalities were lower (0.407 and 0.567, respectively) for NI children than DDx children. Compared to DDx children, NI children were 1.846 times more likely to exhibit aggression and 2.05 times more likely to engage in argumentative, oppositional, defiant, or destructive behaviors. Clinician reviewers’ ratings of the quality of information available in the records of DDx children were significantly higher (M = 3.30, SD = 0.661) than that of NI children (M = 2.52, SD = .525), t = −14.941, p < 0.001, and as the quality of the information available in a child’s record increased, the odds of the child lacking a previous ASD identification decreased significantly. Contrary to hypotheses, racioethnicity, median household income, age at first developmental evaluation, and number of developmental evaluations did not significantly predict missed ASD identification. Furthermore, the absence of a previous ASD identification was not significantly predicted by a child exhibiting any of the following: documented social delays prior to the age of 3 years, documented language delays prior to the age of 3 years, abnormalities in eating, abnormalities in mood or affect, motor abnormalities, hyperactivity and/or attention deficits, a lack of fear, excessive fearfulness, odd responses to sensory stimuli, self-injurious behaviors, staring spells, seizure-like activity, or temper tantrums.
Summary of logistic regression analysis predicting an absence of a previous ASD diagnosis (N = 563).
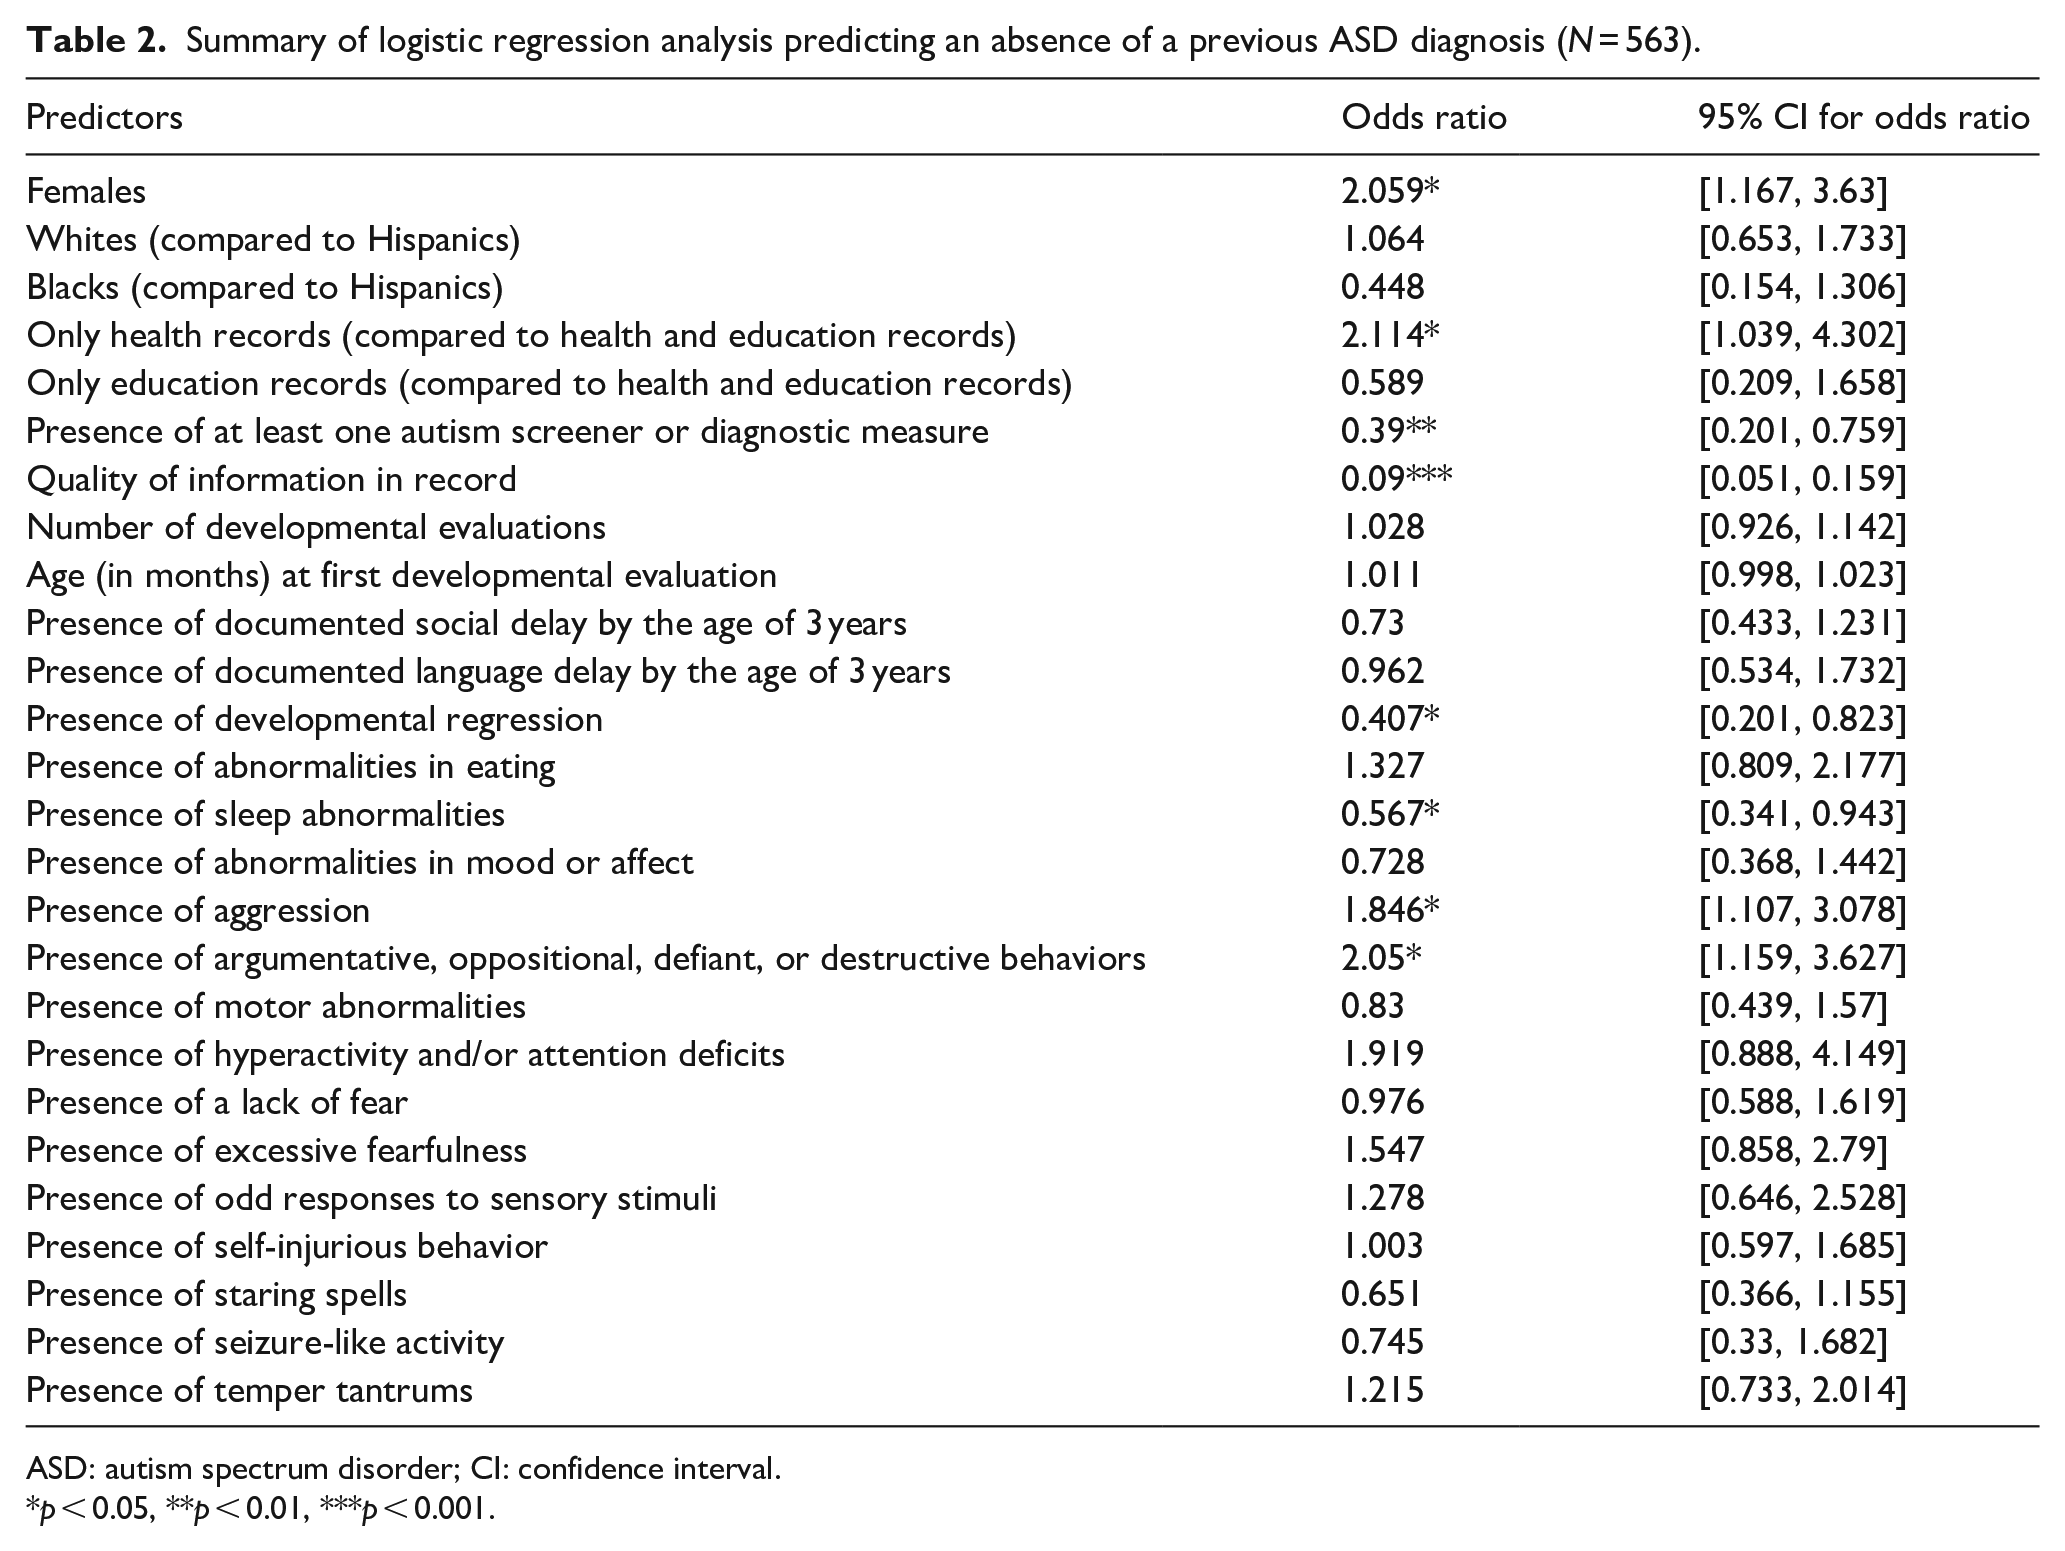
ASD: autism spectrum disorder; CI: confidence interval.
p < 0.05, **p < 0.01, ***p < 0.001.
Table 3 provides a summary of the logistic regression carried out to identify factors associated with DDx children receiving a clinical diagnosis or educational identification of ASD after the age of 3 years. Compared to children identified with ASD by the age of 3 years, the records of children who were identified after the age of 3 years were more likely to have been only health records instead of health and educational records. Children who were identified with ASD after the age of 3 years were 4.521 times more likely to have had at least one ASD screener or diagnostic measure in their record than those diagnosed with ASD by the age of 3 years. As the age at which a child received their first developmental evaluation increased, the odds of being identified with ASD after the age of 3 years increased. Children who were identified with ASD after the age of 3 years were 0.152 times less likely to have had a documented social delay prior to the age of 3 years than those identified by the age of 3 years. Compared to children who were identified with ASD by the age of 3 years, children who were identified with ASD after the age of 3 years were 2.969 times more likely to experience staring spells. No other hypothesized predictors reached significance.
Summary of logistic regression analysis predicting a DDx child receiving a diagnosis after the age of 3 years (N = 307).

DDx: documented diagnosis; CI: confidence interval.
p < 0.05, **p < 0.001.
Sociodemographic and clinical profiles of children with a previous ASD diagnosis (DDx children)
Based on fit indices and the utility and interpretability of the resultant classes, the three-class solution emerged as the best fit for DDx children (see Table 4). Class-specific item response probabilities for the categorical indicators, which are presented in Table 5 and shown graphically in Figure 1, were used to identify distinguishing characteristics between the three classes.
Model fit statistics for latent class analysis of DDx children.

DD: documented diagnosis; BIC: Bayesian information criterion; CAIC: Consistent Akaike’s Information Criteria; AWE: approximate weight of evidence; LMR: Lo–Mendell–Rubin; LRT: likelihood ratio test.
Boldface indicates best fit. The LMR-adjusted LRT indicates that the three-class solution provided a better fit than the two-class solution. Entropy values close to 1.0 indicate higher classification precision.
Item probabilities and odds ratios for DDx children (n = 324).
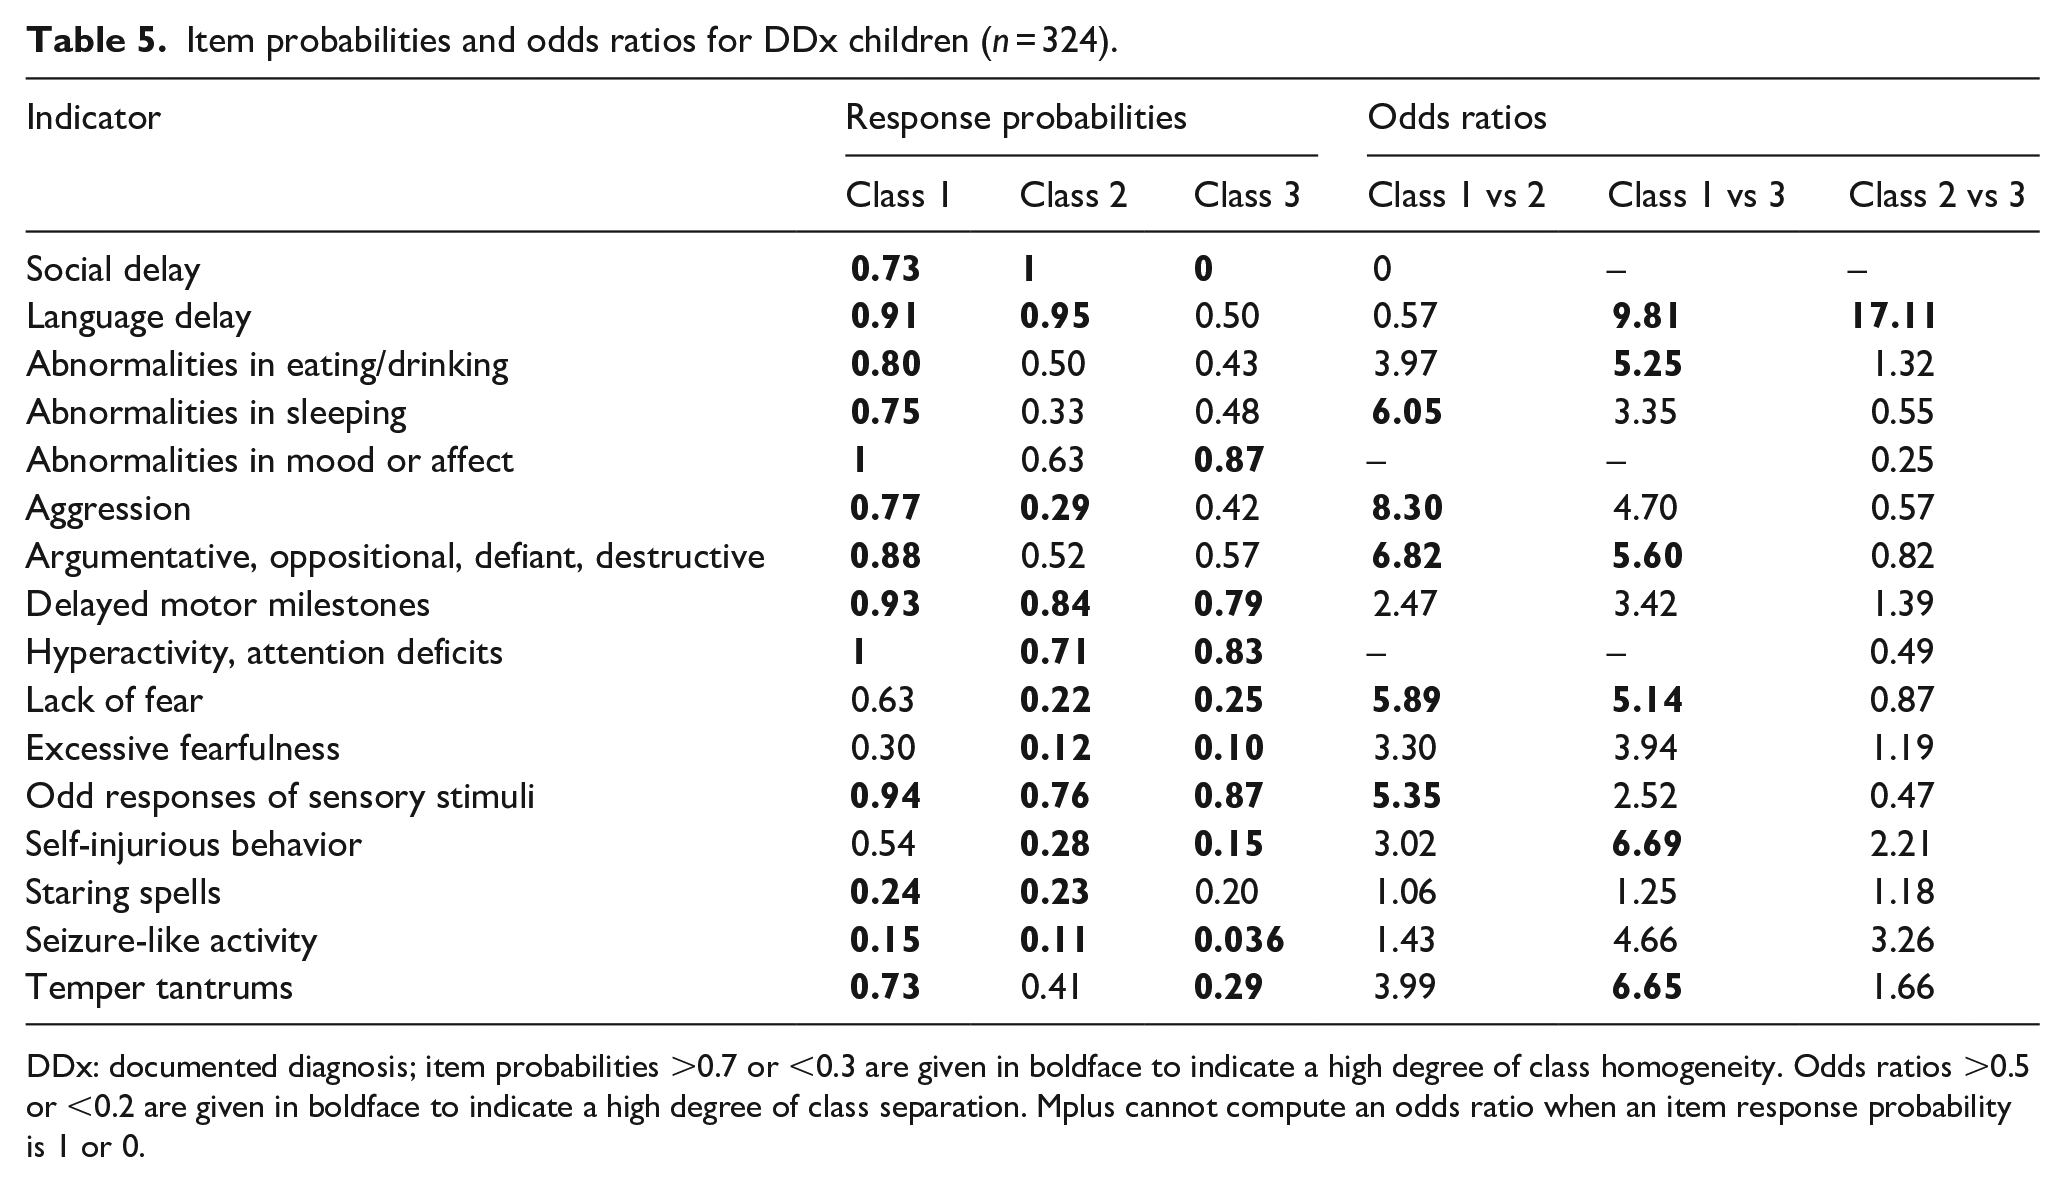
DDx: documented diagnosis; item probabilities >0.7 or <0.3 are given in boldface to indicate a high degree of class homogeneity. Odds ratios >0.5 or <0.2 are given in boldface to indicate a high degree of class separation. Mplus cannot compute an odds ratio when an item response probability is 1 or 0.

Clinical features of DDx children.
Class 1 (n = 136), the most prevalent class, represents a group of children who were likely to have documented social and language delays prior to the age of 3 years in their records. Furthermore, children in Class 1 were likely to present with a significant number of features associated with ASD such as abnormalities in eating, sleeping, and mood or affect; motor abnormalities; hyperactivity and/or attention deficits; and odd responses to sensory stimuli.
Class 2 (n = 110) is similar to Class 1 as the children were likely to have documented social and language delays prior to the age of 3 years in their records; however, children in Class 2 were more likely to have documented delays than children in Class 1, particularly a documented social delay. Children in Class 2 were most likely to present with motor abnormalities, hyperactivity and/or attention deficits, and odd responses to sensory stimuli. However, overall, they presented with fewer features associated with ASD (e.g. aggression) than children in Class 1; the odds of children in Class 2 presenting with many of the features characteristic of children in Class 1 were significantly lower, with notably greater odds for children in Class 1 versus children in Class 2 on the following features: abnormalities in sleeping; aggression; argumentative, oppositional, defiant, or destructive behaviors; lack of fear; and odd responses to sensory stimuli.
Unlike children in Classes 1 and 2, children in Class 3 (n = 78), the least prevalent class, did not have a documented social delay prior to the age of 3 years in their records and were significantly less likely to have a documented language delay. Generally, children in Class 3 and those in Class 2 presented with similar features associated with ASD (e.g. abnormalities in mood or affect and motor abnormalities); however, children in Class 3 had slightly higher item response probabilities on many of the associated features (e.g. abnormalities in mood or affect and hyperactivity and/or attention deficits) than children in Class 2. Compared to children in Class 1, the odds of children in Class 3 having abnormalities in eating and sleeping, showing a lack of fear and opposition and defiance, and engaging in self-injurious behavior and temper tantrums were strikingly lower. Conversely, even though the odds of endorsement for many of the ASD associated features were significantly lower for children in Class 3 than children in Class 2, none of the differences in odds across the two classes were noteworthy.
Sociodemographic characteristics of children in the three DDx classes
There were no sex or racial/ethnic differences in class membership for the DDx children. However, median household income had a significant and striking effect on latent class membership (see Figure 2). Specifically, given membership in Class 1 or Class 2, children from lower income families were more likely to be in Class 1 than children from more affluent families. The probability of being in Class 3 did not differ across median household incomes.
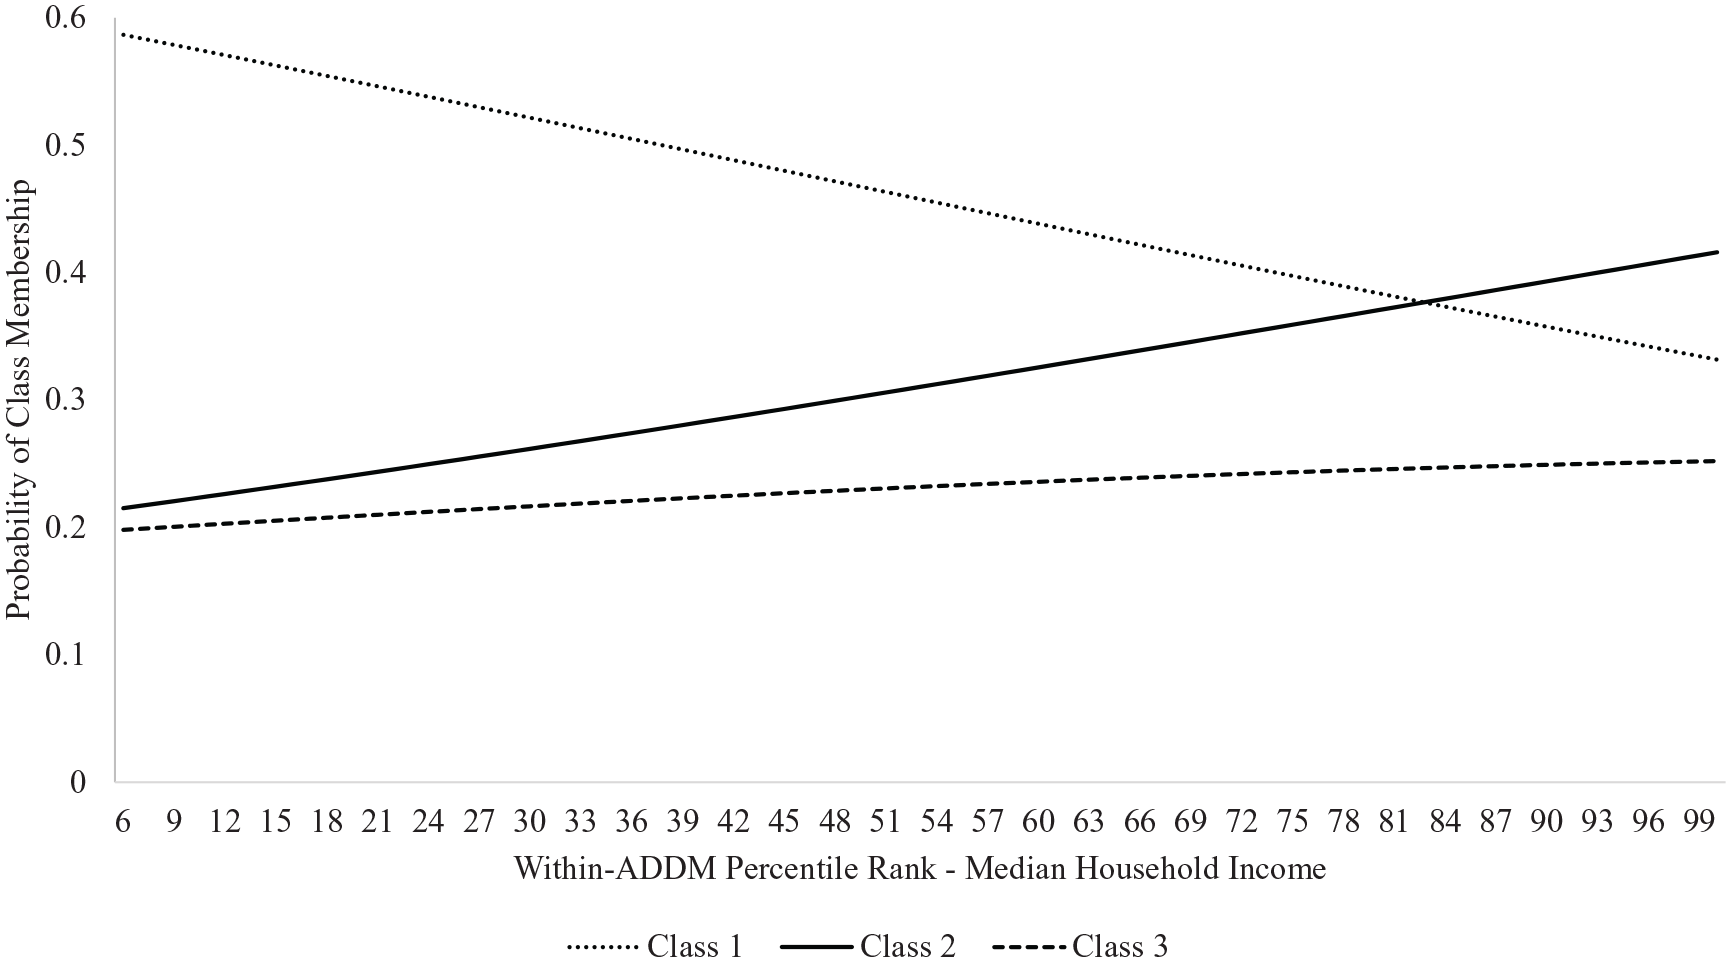
Effect of median household income on class membership for DDx children.
Finally, significant differences in the mean ages at first known ASD identification were found across the three classes. On average, children in Class 2 had the earliest age (in months) of ASD diagnosis (M = 44.81 months) compared to children in the other two classes. Children in Class 1 had a mean age at first known ASD diagnosis of 52.68 months. Children in Class 3 had, on average, the oldest age at first known ASD diagnosis (M = 65.73 months).
Discussion
Consistent with previous studies that have reported sex disparities in ASD prevalence (Baio et al., 2018; Fombonne, 2009; Maenner et al., 2020), our results indicated that girls were significantly less likely to have had a previous ASD diagnosis than boys. The ever-present sex disparity between females and males with ASD has led to the suggestion that there are phenotypic sex differences in ASD, and our current diagnostic approach may be biased toward the phenotypic male presentation (Lai et al., 2015; Van Wijngaarden-Cremers et al., 2014). Currently, research examining phenotypic sex differences between females and males with ASD have used a variable-centered approach (e.g. Hiller et al., 2016; Rivet & Matson, 2011); however, the use of a person-centered approach such as LCA may better elucidate the phenotypic differences between females and males with ASD, which has implications for better ascertainment of females with ASD. This could be an opportunity for future research, perhaps using data from the entire ADDM network in order to get the sample sizes for females high enough to conduct the analyses.
The findings from the current study revealed that NI children were significantly less likely than DDx children to have experienced developmental regression or present with sleep abnormalities. However, NI children were significantly more likely than DDx children to engage in aggressive and argumentative, oppositional, defiant, or destructive behaviors. Several developmental trajectories have been identified in children with ASD (Landa et al., 2013), with some children exhibiting obvious developmental abnormalities in infancy, while other children show a period of typical development followed by a loss of previously established skills (Barger et al., 2013; Boterberg et al., 2019). Previous studies have found that children with co-occurring intellectual disability or developmental regression have a greater likelihood of being diagnosed with ASD at a younger age (e.g. Jónsdóttir et al., 2011; Shattuck et al., 2009). In addition, greater symptom severity has consistently been associated with an earlier age at diagnosis (Daniels & Mandell, 2014). Sleep disturbances, which are common among children with ASD (Mazurek et al., 2019), may exacerbate core symptoms of ASD (e.g. stereotyped behavior) and non-ASD-specific symptoms (e.g. anxiety), resulting in greater functional impairment (Sannar et al., 2018). Thus, these findings indicate that clinicians may be able to recognize ASD more readily in children with more functional impairment and those who experience a developmental regression. Conversely, the presence of aggressive and argumentative, oppositional, defiant, or destructive behaviors in NI children may have masked their symptoms of ASD (Soke et al., 2018), leading to a missed ASD identification.
Our results also indicated that NI children were significantly less likely to have had an autism screener or diagnostic measure in their records, had a lower quality of information in their records, and were more likely to have had only health records rather than both health and educational records than DDx children. It is important to note that the strong association between the quality of information in a child’s record and a child being NI is likely inherent to ADDM surveillance methods, as clinicians rely on the information in a child’s record to confirm or rule out ASD if a child does not have a clinical diagnosis or educational identification of ASD in her records. However, several factors may have contributed to the other group differences, including differences in the attribution of symptoms characteristic of ASD (Daniels & Mandell, 2014), and a lack of adequate developmental monitoring and screening. Moreover, the healthcare system in the United States is complex, which can result in difficulty navigating the system and limited knowledge of available resources for families, particularly families from disadvantaged backgrounds (e.g. children from non-English speaking families). Given the complexity of the healthcare system in the United States, schools serve as a critical source of ASD identification for children, particularly those from disadvantaged backgrounds (Pettygrove et al., 2013). The increased likelihood of NI children having only health records instead of health and education records may be due to CO-ADDM’s limited access to educational records. Therefore, it is important to examine systems-level factors in addition to child- and family-level factors that may influence age at ASD diagnosis (Angell et al., 2018).
In addition to identifying significant differences between NI and DDx children, our results also revealed significant differences between DDx children who were identified with ASD after the age of 3 years and those identified with ASD by the age of 3 years. Children who were identified with ASD after the age of 3 years were more likely to have had an autism screener or diagnostic measure in their records, to receive their first developmental evaluation at later ages, and their records were more likely to have been only health records instead of health and educational records than those identified with ASD by the age of 3 years. Also, children who were identified with ASD after the age of 3 years were less likely to have had a documented social delay prior to the age of 3 years than children who were identified with ASD by the age of 3 years. However, children who were identified with ASD after the age of 3 years were more likely to engage in staring spells than those who received an earlier ASD identification. One possible explanation for the differences between children who were identified with ASD after the age of 3 years and those who were identified by the age of 3 years is that symptoms associated with seizures may mimic certain ASD-specific symptoms (El Achkar & Spence, 2015). For example, staring spells could be interpreted as unusual eye contact or failure to respond to one’s name. As such, children who engage in staring spells may receive a diagnosis of ASD at later ages, particularly those with ASD and epilepsy, due to the challenges associated with differentiating between symptoms of ASD and epilepsy (Turk et al., 2009).
To further examine how potential differences in clinical presentation among DDx children influence age at ASD identification, we utilized LCA to identify distinct classes of 8-year-old children who had a previously documented clinical diagnosis or educational identification of ASD in their records. The findings from the LCA revealed three mutually exclusive classes of DDx children in Colorado. The predictive power of these three classes of children on their age at first known ASD diagnosis was examined.
Caregivers of children with ASD often first report concerns about their child’s language and communication deficits (Becerra-Culqui et al., 2018; Zablotsky et al., 2017). The caregivers of children in Class 2 may have been particularly concerned about their child’s language development, which may have contributed to children in this class having a mean age of diagnosis (i.e. 52.68 months) that was similar to the median age of ASD diagnosis in the United States (Maenner et al., 2020), and significantly lower than the mean age of diagnosis for children in Class 1 and children in Class 3. Although the caregivers of children in Class 1 were likely also particularly concerned about their child’s language development, as previously mentioned, the presence of multiple non-ASD-specific, co-occurring difficulties (e.g. sleep abnormalities, behavioral issues) likely complicated the diagnostic process, leading this group of children to have an average age of ASD diagnosis that was later than that of children in Class 2.
Children in Class 3 may represent a group of children who fail to show obvious signs of ASD early in development. Rather, more obvious signs of ASD may only be noticed later in development (e.g. during school age), when their environmental demands exceed their abilities, resulting in a missed ASD diagnosis. Given that children in Class 3 had a mean age of diagnosis of 65.73 months, the lack of obvious signs of ASD early in development (i.e. a documented language or social delay prior to the age of 3 years) may have made the diagnostic process more difficult and led to an older age at diagnosis.
While the current study did not find a difference in SES (i.e. median household income) between DDx and NI children, there was a significant effect of SES on class membership among children who had a previous diagnosis. For DDx children, low-income children were more likely to be in Class 1, which represented a group of children who would likely require higher levels of support due to their abnormalities in mood or affect and high levels of externalizing behaviors (e.g. aggression and temper tantrums), than in Class 2. This finding suggests that there may be meaningful differences in the presentation of children from disadvantaged and more affluent families, which may account for some of the variability in the age of diagnosis across SES that have been reported.
There are some important limitations that should be considered when interpreting the results of this study. First, the children in the current study resided within a circumscribed seven-county surveillance area within Colorado; therefore, these findings may not be generalizable to locations outside of the surveillance area. Second, the CO-ADDM Project had limited access to children’s educational records, and caregivers could request that their child’s educational records be excluded from the record review. As such, some of the children whose health records did not include a documented clinical ASD identification may have had an educational identification of ASD, potentially resulting in different findings. Third, the categorical indicators used in this study (i.e. the presence of delays and features associated with ASD) were based on secondary data rather than direct observation. Fourth, due to the pattern of missing IQ data, intellectual disability, which has been associated with an earlier age of ASD identification (Shattuck et al., 2009), was not included as a predictor in our analyses.
Despite these limitations, the results of this study support previous findings that indicate that considerable sociodemographic disparities in the diagnosis of ASD exist. Moreover, these findings support the need and the utility of early screening and monitoring for ASD. Given that a high degree of variability exists in the presentation and outcomes of children with ASD, using child- and family-level factors to identify distinct classes of children with ASD may be useful in reducing the gap between caregivers’ concerns and the age of ASD diagnosis, particularly among children who are most vulnerable to receiving a delayed diagnosis. Furthermore, the findings of the current study have implications for the development and implementation of policies and practices that aim to improve screening, early identification, and intervention services, thereby increasing the likelihood that health disparities are reduced among individuals with ASD.
