
Abstract
The minimal group paradigm has consistently shown that people will discriminate to favor their own group over an out-group, even when both groups are created arbitrarily by an experimenter. But will people actually form groups that are so arbitrary? And could something as trivial as a randomly assigned name tag color serve as a fault line during group formation? In this study, we use in vivo behavioral tracking (IBT) to precisely and unobtrusively track samples of participants as they assort repeatedly into groups. We find that participants do form groups on the basis of their randomly assigned name tag colors, but that name tag homophily emerges over time, becoming stronger in subsequent groups. Our results suggest that people are unconsciously or consciously biased toward group similarity, even when similarities are essentially meaningless. Our study has implications for theories of intergroup relations and social identity. It also demonstrates the utility of applying real-time tracking to study group formation.
Almost 50 years ago, Tajfel (1970) found that people show bias against out-group members even when their group membership is entirely arbitrary. In this often replicated minimal group paradigm, an experimenter assigns participants to one of two groups based on an arbitrary or random criterion, such as similarity in art preferences (Tajfel, Billig, Bundy, & Flament, 1971), tendency to over- or underestimate dots on a screen (Tajfel et al., 1971), or the result of a coin flip (Billig & Tajfel, 1973). Even when participants are aware of the arbitrariness of their group membership, they favor in-group over out-group members when distributing resources.
These results offer a sobering view of how even the shallowest of group identities can nevertheless produce prejudice and discrimination. However, there is surprisingly little evidence that individuals actually belong to such superficial groups. The minimal group paradigm allows participants, perhaps automatically, to take advantage of group distinctions created by the experimenter, but it is not clear that they would have made those distinctions themselves. If not, then the minimal group paradigm represents a warning to those seeking to impose arbitrary social categories, but says nothing about whether those arbitrary categories are a basis on which individuals themselves assemble in real life. In the current study, we provide the first test of minimal group formation—as opposed to minimal group bias—using a new paradigm in which strangers, assigned arbitrary traits, are tracked in real time as they interact and form groups within a large enclosed area.
Homophily in Group Formation
Some evidence is consistent with the idea that people do form assortative groups based on superficial traits. When people make friends (Bahns, Crandall, Gillath, & Preacher, 2017; Poteat, Espelage, & Green, 2007), form romantic relationships (Kalick & Hamilton, 1986; Kerckhoff & Davis, 1962), or decide whether to continue living with roommates (Bahns, Crandall, Canevello, & Crocker, 2013; Berg, 1984), they appear to show homophily—grouping on the basis of (sometimes superficial) shared traits.
To explain the prevalence of homophily, many theorists have argued that people are attracted to similar others—even arbitrarily similar others—for one or more of several well-studied reasons. From an evolutionary perspective, favoring similar others in the context of romantic relationships increases the chances that attraction will be reciprocated (the matching hypothesis; Walster, Aronson, Abrahams, & Rottman, 1966), and similarity more generally may signal safety, or even kinship (Smith, 1964). From a more proximate motivational perspective, similar others are more likely to reinforce our existing beliefs about ourselves and the world, satisfying a desire for self-verification (Swann, 1983). Consistent with these ideas, similarity-driven affiliation has been reported in diverse contexts, from dating (Berscheid, Dion, Walster, & Walster, 1971) to liking for strangers (Byrne, Clore, & Worchel, 1966) to “free-range data harvesting” (Bahns et al., 2017; Bahns, Pickett, & Crandall, 2011) to computer modeling (Gray et al., 2014; Roberts, 1989).
However, past research suffers from at least two limitations. First, most studies sample from existing relationships. This sampling method runs the risk of mistaking a similarity preference for social influence: it could be that we form relationships with similar others or it could be that people make us more like them as time passes (Anderson, Keltner, & John, 2003). Similarity in existing relationships is also confounded with propinquity—people are more likely to associate with others who are geographically or functionally near to them (Segal, 1974), and such people are likely to be similar for other reasons (e.g., because neighborhoods may be socioeconomically segregated).
Studies that sample emerging relationships with a high degree of choice (Bahns et al., 2017; Halberstadt et al., 2016) address issues related to propinquity and social influence, but remain susceptible to a second confound: the social inferences participants draw from similarity. For example, Jackson, Halberstadt, Jong, and Felman (2015) found that participants preferred romantic partners who shared their religious beliefs, but that the preference was in fact a consequence of the inferences they made about religiosity (i.e., that religious individuals are less open-minded), rather than religiosity per se. In the context of group formation specifically, Jackson, Lemay, Bilkey, and Halberstadt (2017) found that similarity-based inferences concerning attachment insecurities could simultaneously produce homophily and heterophily (a preference for dissimilar others) in the same sample. Perhaps because individuals with high attachment avoidance desire the traits that they inferred from avoidance in others (e.g., low intimacy), these participants showed similarity-based grouping. Yet exactly the opposite occurred in participants high on attachment anxiety, most likely because they dislike the traits they inferred from others’ anxiety (e.g., low warmth and high insecurity). Taken as a whole, these studies raise doubts as to whether homophily occurs because people desire similarity rather than because people make positive inferences about similar others.
Real-Time Tracking of Social Groups Over Time
Resolving the ambiguities associated with social influence, propinquity, and inference requires a paradigm in which people who differ on an arbitrarily and randomly manipulated trait are free to associate with others, with the resulting grouping observed with great precision. Past research has not met these conditions because of the difficulty in tracking group formation in real time, not to mention controlling for people’s previous relationships, backgrounds, and dimensions of similarity.
However, a new method termed in vivo behavioral tracking (IBT; Halberstadt et al., 2016) allows researchers to precisely gather spatial data from groups of people as they interact and form groups in real time, while also permitting the manipulation of contextual features of their environment (Jackson, Bilkey, Jong, Rossignac-Milon, & Halberstadt, 2017). In IBT, ceiling-mounted cameras capture participants’ freely chosen social interactions and movement as they associate and disassociate in a large, open space (a fully enclosed sports stadium, in our previous studies), allowing researchers to quantify the formation and constitution of groups that form over time from unaffiliated crowds. Past studies have used IBT to simulate large-scale rituals’ effects on cooperation (Jackson et al., 2018), investigate how securely and insecurely attached individuals form groups (Jackson, Lemay, et al., 2017), and document homophily on the basis of gender and attractiveness (Halberstadt et al., 2016).
IBT also allows for tracking over long periods of time, making it possible to test if homophily grows stronger or weaker as participants form subsequent groups. Research on residential segregation (e.g., Schelling, 1971; Zhang, 2004), emergent adolescent friendships (Kandel, 1978), and online networks (Yardi & Boyd, 2010) suggests that homophily increases over time. This dynamic may occur because people come to enjoy in-group interactions more—and therefore seek out in-groups more as time passes—or because social networks become more malleable over time, such that people show more willingness to move farther to fulfill their desire for similar others. Although self-categorization theory suggests, conversely, that superficial social grouping is strongest in the absence of richer information and therefore should decrease as familiarity increases (Boutyline & Willer, 2017; Hogg, 2000), studies of groups in naturalistic settings show little direct evidence for this prediction (e.g., Hinds, Carley, Krackhardt, & Wholey, 2000). In addition, our paradigm—in which participants do not communicate—does not involve deep familiarization. Given these parameters, social categorization does not make a clear prediction concerning how groups should change over time, and may even predict greater homophily over time as grouping divisions become more salient.
The Current Study
In this study, we apply IBT to study the formation of groups of strangers that differ on a minimal trait—the color of their name tag. In this first pure test of similarity-based grouping, we simply analyzed whether people form groups with more name tag color similarity than would be expected by chance. We also examined grouping dynamics, testing whether name-tag-based grouping decreases or increases over time. We first hypothesized that we would observe similarity-based grouping. Second, we hypothesized that homophily would increase over time, consistent with the related aforementioned research.
Method
Participants
Eighty-seven University of Otago students (46 women, 41 men; Mage = 23.16, SD = 6.29; 65 White/ethnic majority, 22 non-White/ethnic minority) volunteered in exchange for NZ$30.00 to cover their travel expenses. Participants were randomly assigned to one of two experimental sessions, which took place on separate, consecutive days (NDay 1 = 42, NDay 2 = 45). Participants were explicitly instructed not to sign up with friends, and participants who indicated knowing another individual in their session were reassigned prior to participation. All participants gave written, informed consent before participation and were fully debriefed after completing the study. They were also given the option (which nobody chose) to have their data deleted from the sample.
Venue and Software for In Vivo Tracking
The study was conducted at the Forsyth Barr Stadium, Dunedin. An Elphel NC535 network camera was mounted 25 m overhead, and continuously captured video of the 30 m × 20 m experimental area for the duration of the study, at 30 frames/second at its maximum resolution of 2592 × 1944 pixels. The Theia SY110 lens used provides a 120o view with almost 0% distortion. Following data collection, individual participants were tracked using custom proprietary software developed by Animation Research Ltd (see Halberstadt et al., 2016, for more detail concerning this software, and Jackson, Bilkey, et al., 2017, for a detailed overview of the IBT software and the procedures common to IBT experiments).
Experimental Procedure
Upon arrival at the stadium and registration of attendance, participants were given a name tag with a participant number on it. They were informed that the experiment was an exploration into the feasibility of using Forsyth Barr Stadium as a research site for human subject experimentation and that they would be completing a variety of behavioral tasks. Participants were then led into the bleachers and asked to fill out a number of paper-and-pencil questionnaires, which were designed to test other hypotheses. When they finished their questionnaire packet, participants raised their hand and an experimenter collected the packet. The experimenter also affixed a small sticker to the corner of their name tag ostensibly to indicate that they had finished their questionnaire packet. The color of this sticker—blue or yellow, randomly determined—represented our manipulation of a minimal group distinction. According to the verbal reports of hypothesis-blind research assistants, no participant indicated any interest in or awareness of the color of their sticker.
When all participants had completed their pretest questionnaire packet, they were led into a 30 m x 20 m area, which was directly under the camera. Participants completed several activities over the course of the experiment, some of which were designed to test other hypotheses. 1 The activity that was relevant to the current study was a group formation task. Participants began this task by assembling themselves—in order of their participant number—around the perimeter of the experimental area, with equal space between each participant. Once participants had assembled themselves around the experimental area, they were instructed to “take five steps in and form groups of any size and composition,” raising their hands when their group was established. Once stable groups were formed, participants were asked to form new groups, from their current positions, two more times, and then to repeat the entire process twice over, creating nine total observations (i.e., three replications of three trials). Participants did not speak to each other during the group formation process, and all participants followed instructions during the task. It took approximately 10–15 seconds for participants to form groups each trial.
Data Preparation
Following data collection, we used custom software to extract participants’ locational coordinates throughout the course of the experiment. This software—described in detail in Jackson, Bilkey, et al. (2017)—tracked participants within the offline video feed using the contrast of participants’ clothing with the frame’s background. By tracking this contrast through computer vision techniques such as template- and histogram-based matching, we could estimate with centimeter precision participants’ positions in the experimental space. In addition, the entire computer tracking process was supervised by the second author, who ensured that the positional trackers did not stray from the participants (e.g., in cases of low participant–background contrast). This procedure produced 30 x–y coordinates per second for each participant, which corresponded to participants’ physical location for the entirety of the experiment.
After obtaining participants’ locational information, we used a custom MATLAB (Version 8.1) routine to extract data on the groups that participants formed during the study’s grouping phase. To do this, we used a k-cluster means procedure coupled with a silhouetting algorithm to quantitatively derive discrete social groups based on the ratio of participants’ proximity to group members versus nongroup members. This routine produced a series of potential grouping constellations along with fit coefficients. The paper’s second author—who oversaw this procedure—assigned groups based on these fit recommendations, overriding the recommendations in rare cases when they clearly did not map onto participants’ intended groupings (see Jackson, Bilkey, et al., 2017, for more details).
After groups had been assigned, we used a custom R script to aggregate the proportion of participants with yellow name tags within each group, such that a value of 1 would represent a group where all members had yellow name tags and a value of 0 would represent a group where all members had blue name tags. Participants’ own name tag color was dummy-coded, such that participants with yellow name tags received a value of 1 and participants with blue name tags received a value of 0. Given this coding, a significant positive correlation between participants’ own name tag color and the aggregate name tag colors of their groups would be evidence of group homophily, suggesting that people stood with a greater number of same-name-tag peers than would be expected by chance. Importantly, participants’ own name tag color was not included in their aggregate grouping coefficients, to avoid biasing our tests in favor of homophily.
Analysis Plan
Given that our data represented nine trials nested within three triads, in turn nested within 86 participants, we analyzed grouping behavior using a multilevel model examining name-tag-based grouping. In our first model, group size and trial (mean centered) were entered as Level 1 predictors since they varied across trials, while name tag color was entered as a Level 2 predictor since it varied across participants. In our second model, the interaction between name tag color and trial number was entered as a cross-level interaction term. In all models, intercepts were modeled as randomly varying across participants and triads in order to account for the nested data structure, and parameters were estimated using a restricted maximum likelihood algorithm. The method we propose here is the most common and widely accepted approach to analyzing this form of grouping data (see Cole, Bassett, Power, Braver, & Petersen, 2014, for further discussion), and is generally preferable to other, matrix-based approaches (Guillot & Rousset, 2013).
Results
Participants formed a total of 113 groups, with a mean and median size of eight members. Group size increased over trial number, b = 0.09, SE = 0.04, t = 2.31, p = .02, and so we chose to control for group size in each of our analyses, although the results replicate regardless of such control. We also explored several other covariates in our analyses, including (a) gender, (b) attractiveness, (c) Caucasian versus non-Caucasian racial status, and (d) grouping diversity—the total number of people that an individual grouped with over the course of the study. None of these variables is associated with name tag or grouping effects, however, and all results replicate regardless of whether they are included as covariates in the models.
Model Outcomes
Main effects model
In our first model, participants with yellow name tag colors were more likely to group with other yellow-name-tag participants (52% vs. 49%). However, this tendency was small and only marginally significant. Table 1 displays all fixed effects.
Fixed effects of main effects model.
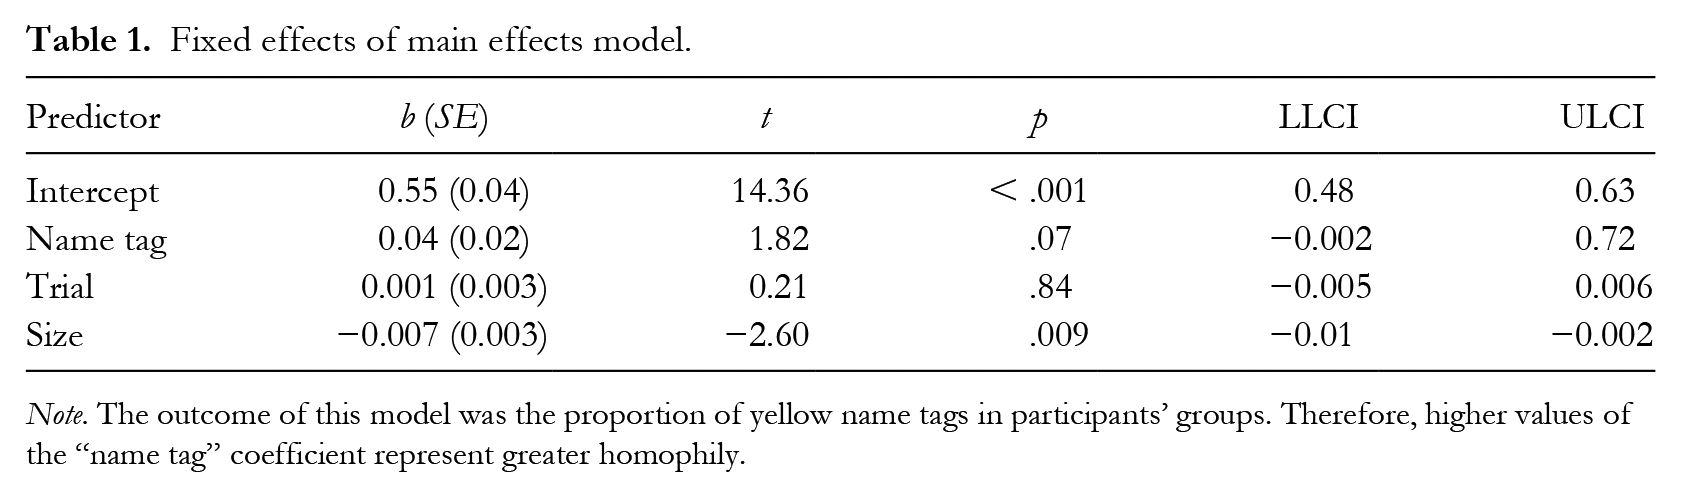
Note. The outcome of this model was the proportion of yellow name tags in participants’ groups. Therefore, higher values of the “name tag” coefficient represent greater homophily.
Interaction model
Our second model revealed a positive Name Tag x Trial Number interaction term, indicating that participants were increasingly likely to group with similar-name-tag peers over time (see Table 2). Our marginal main effects from the previous model remained unchanged.
Fixed effects of interaction model.
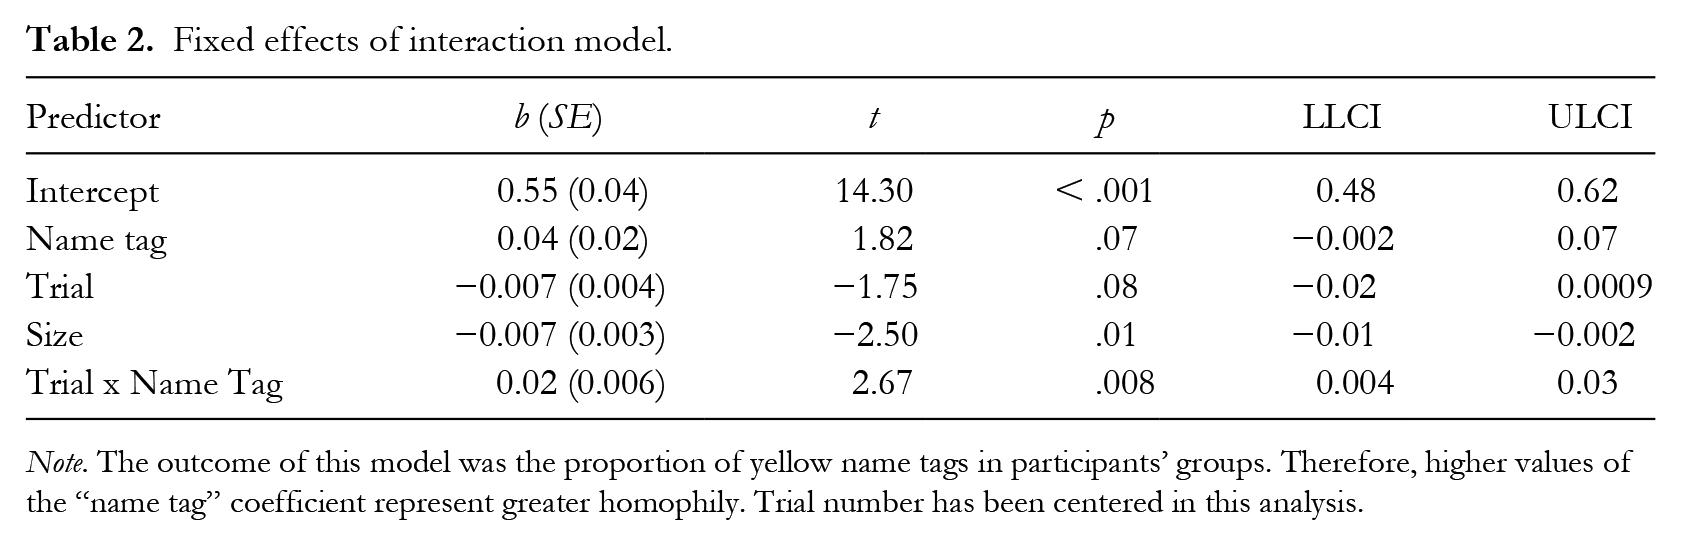
Note. The outcome of this model was the proportion of yellow name tags in participants’ groups. Therefore, higher values of the “name tag” coefficient represent greater homophily. Trial number has been centered in this analysis.
Grouping by Triad
We next estimated the effect of name tag matching at the first triad, the second triad, and the third triad. Consistent with our observed interaction, participants name tag color negatively and nonsignificantly predicted their group’s name tag composition for the first triad, b = −0.02, SE = 0.03, t = −0.67, p = .50; positively and nonsignificantly predicted group name tag composition for the second triad, b = 0.02, SE = 0.03, t = 0.52, p = .60; and positively and significantly predicted group name tag composition for the final triad, b = 0.10, SE = 0.03, t = 3.20, p = .001. In sum, our model predicted that in later trials, people with yellow name tags were joining groups with 8% higher yellow name tag composition compared to people with blue name tags. Figure 1 shows grouping patterns for each triad.
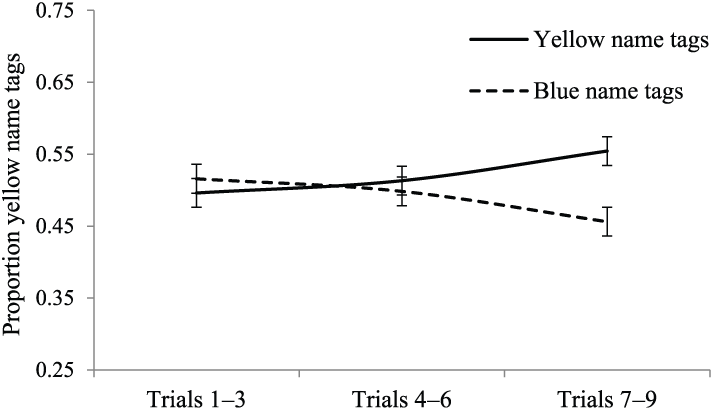
Likelihood of name-tag-based grouping as a function of trial triad.
Discussion
People in groups are capable of selfless cooperation, but also prejudice and conflict, and both phenomena have close ties to group identity. Tajfel’s (1970) minimal group paradigm provides the most dramatic evidence that individuals are significantly biased toward their own groups at the expense of out-groups, even when that distinction is self-evidently meaningless. But as important as these findings are, they only speak to the way people exploit their existing group memberships, without sufficient regard for their etiology. They show that existing groups, however arbitrary, can shape people’s behaviors—but not whether arbitrary traits are a sufficient basis on which to form groups in the first place. It is quite possible that individuals are willing to accept and act on arbitrary group assignments (perhaps because they imbue them with meaning post hoc), but if given the choice, would be unlikely to associate with others on the basis of those same dimensions.
In the current research, we examined this possibility by randomly assigning participants to wear either yellow or blue name tags as they formed iterative groups, then tracking their movements with an unobtrusive ceiling-mounted camera. Our results suggest that while participants did not originally group on the basis of shared name tag color, they increasingly did so over the course of the study. These results suggest that even subtle interpersonal distinctions can emerge as functional group fault lines over time.
Although previous research has hinted at this result, it has been limited by confounds inherent in observing natural groups, as well as by the complementary methodological problem of scaling experimental groups and observing them in an unobtrusive way. By tracking randomly tagged strangers’ freely chosen group affiliations, we have largely eliminated these issues to provide a clear demonstration of minimal group formation.
Our study’s primary limitation is that we could not gauge why participants increasingly associated with similar others over time. We consider two general alternatives for why this may have happened: First, similarity-based grouping could have been unconscious; participants could have gravitated towards similar others without being aware of doing so, based on evolved impulses for homophily or even familiarity (see Fu et al., 2012). Alternatively, participants may have consciously chosen to group with those who shared their name tag color, either because they assumed that same-name-tag participants would be more likely to reciprocate their affiliative overtures (Walster et al., 1966) or because they assumed that same-name-tag participants were more desirable in some way than the other name tag alternatives. The fact that homophily emerged over time does rule out certain accounts. For example, participants only interacted minimally, so it was unlikely that homophily emerged because people enjoyed their interactions with same-name-tag individuals more than their interactions with different-name-tag individuals.
Unfortunately, we are not in a position to further test these accounts with the current data. However, future research could test, for example, whether grouping homophily is more pronounced under time pressure—which would support an unconscious preference for similarity. Alternatively, future research could test whether grouping homophily is more pronounced when participants are forming groups for an instrumental purpose (e.g., assembling teams for a subsequent cooperative task). If grouping homophily was especially pronounced for instrumental groups, this would suggest that people actually attribute favorable traits to similar others, consistent with a social inference account of group formation (Jackson, Lemay, et al., 2017).
Even without mechanistic evidence, however, this study makes a significant contribution to the understanding of group formation. We show—for the first time—that arbitrarily manipulated features can predict grouping patterns in large groups of strangers. Our findings suggest that groups’ origins may be shallower and more random than previously believed. Something as simple as a name tag color could determine with whom we decide to associate, and thereby sow the seeds of future in-group biases.