
Abstract
Racial prejudice is a pervasive and pernicious form of intergroup bias. However, a mounting number of studies show that recategorization—even into minimal groups—can overcome the typical consequences of racial and other group classifications. We tested the effects of minimal grouping on implicit prejudice and infrahumanization using a paradigm in which race was orthogonal to group membership. This allowed us to examine whether knowledge of group membership overrides obvious category differences. We found that participants infrahumanized and showed implicit bias toward the minimal outgroup, despite the cross-cutting presence of race, and in fact did not show any of the usual implicit racial bias. In addition, event-related potentials (ERPs) showed an early race effect followed by distinct reactions on the basis of group as processing continued. This is evidence that arbitrary social classifications can engender ingroup preference even in the presence of orthogonal, visually salient categorizations.
Racial bias remains a pervasive and powerful factor in American society, but complex modern social environments require people to build group affiliations that transcend racial categories. The long history of inequality and the physical dissimilarities between racial groups make race a psychologically salient classifier that would seem difficult to overcome. In contrast, minimal groups draw distinctions between sets of people with no historical, social, or physical differences. When minimal groupings are pitted against established social categories like race, however, they can override automatic racial biases shown in neural and implicit reactions (e.g., Van Bavel, Packer, & Cunningham, 2008). Investigating how and when novel, top-down social categorization affects social processing in the presence of more established and ostensibly more salient and stable categories is an important step toward understanding the complexity of group categorization in an ever-changing social environment.
The current research aimed to conceptually replicate and extend previous findings regarding the effects of minimal groups in a cross-categorization paradigm in which minimal group assignment is orthogonal to racial category. To understand multiple levels of bias, we used measures that tap into complex and reflective processes and into early perceptual and attentional processes, none of which had been previously used in this paradigm. These tests included an explicit measure of infrahumanization, a less extreme form of dehumanization; implicit dehumanization and group bias measured with Implicit Association Tests; and early neural processing indexed with event-related potentials (ERPs) and neural motor resonance, which indicate bias in early attention and processing over time. These contributions will further our knowledge not only of whether arbitrary yet salient categorizations predict behavior despite more important orthogonal classifications, but when these categories are processed thanks to the temporal specificity of electroencephalography (EEG). We seek to understand whether bias will follow arbitrarily salient categorizations (minimal groups) in the presence of societally ingrained categorizations (racial groups), including looking for the effect of both groupings in neural processing.
Minimal Groups and Categorization
People instinctively categorize others, creating well-documented social boundaries that result in intergroup bias (Brewer, 1979; Hewstone, Rubin, & Willis, 2002; Mullen, Brown, & Smith, 1992). Categories like age, gender, and race are almost instantly perceived (Cikara & Van Bavel, 2014; Fiske & Neuberg, 1990; Freeman & Johnson, 2016; Ito & Bartholow, 2009), and ingroups, however minimal, can receive favoritism (Brewer, 1979; Pinter & Greenwald, 2011; Ratner, Dotsch, Wigboldus, van Knippenberg, & Amodio, 2014). At the same time, top-down self and social categorization dynamically interact with bottom-up perception to determine our categorization of and response to others (Freeman & Ambady, 2011, 2014; Freeman & Johnson, 2016; Macrae & Bodenhausen, 2000; Ratner et al., 2014). For instance, studies have linked the top-down processes of group categorization to automatic neurological responses (Cunningham, Van Bavel, Arbuckle, Packer, & Waggoner, 2012; Decety, 2011; Gutsell & Inzlicht, 2013; Hackel, Looser, & Van Bavel, 2014; Ito & Urland, 2005; Ratner & Amodio, 2013) and implicit biases (Ashburn-Nardo, Voils, & Monteith, 2001; Capozza, Andrighetto, Di Bernardo, & Falvo, 2012; DeSteno, Dasgupta, Bartlett, & Cajdric, 2004; Pinter & Greenwald, 2011; Van Bavel & Cunningham, 2010), emphasizing the effect of social categorization on our perception of those around us.
If categorization is automatic, what happens when targets have multiple relevant group memberships? Sometimes one category dominates the others, sometimes categories are hierarchically ordered, and sometimes there are additive and independent effects of the categories (Brewer, Ho, Lee, & Miller, 1987; Hewstone, Islam, & Judd, 1993; Klauer, Ehrenberg, & Wegener, 2003). One category can be more salient while another category is still meaningful, and there can, in addition, be emergent properties of their conjunction (Bodenhausen & Peery, 2009; Hehman, Stanley, Gaertner, & Simons, 2011). Crossing categories, moreover, reduces intergroup bias as common identities can be found (Crisp & Hewstone, 2007). Using multiply categorized targets allows us to test the intractability of prejudices, crossing charged racial grouping with arbitrary minimal grouping to pit one of the most historically important category biases against a novel classification.
The minimal group paradigm (Tajfel, Billig, Bundy, & Flament, 1971) allows us to create experimental social categories that participants have never met, cannot influence, and have no history with, allowing researchers to control for variation in individual experiences, opinions, and motives. Favoritism toward these minimal ingroup members—despite participants’ knowledge that these groups are new and arbitrary—is prime evidence for how fundamental ingroup/outgroup distinctions are to social cognition. Such biases have been shown on a variety of behavioral and neural measures, including distribution of rewards (Demoulin et al., 2009; Tajfel et al., 1971), implicit prejudice (Ashburn-Nardo et al., 2001; Capozza et al., 2012; Van Bavel & Cunningham, 2009), facial attention and recognition (Bernstein, Young, & Hugenberg, 2007; Van Bavel & Cunningham, 2010, 2012), mental images (Ratner et al., 2014), neural face processing indexed by the amplitude of the N170 ERP component (Ratner & Amodio, 2013), and differential activation in a variety of brain regions involved in social perception and social cognition (e.g., Molenberghs & Morrison, 2014). In sum, participants in minimal group studies show many of the biases usually found for more salient and established group distinctions. These effects seem to be driven by favoritism for the minimal ingroup, perhaps motivated by identity enhancement concerns (Ashburn-Nardo et al., 2001; Pinter & Greenwald, 2011).
Minimal group research has found that multiple categorizations are simultaneously encoded but that behavior follows the most salient membership, including minimal groups over racial classifications (Ratner, Kaul, & Van Bavel, 2013; Van Bavel & Cunningham, 2009). Moreover, distinguishing between in- and outgroup, even with multiple competing categories, produces ingroup favoritism rather than outgroup derogation (Brewer, 1979; Scroggins, Mackie, Allen, & Sherman, 2016; Van Bavel, Packer, & Cunningham, 2011). Interestingly, minimal group effects can be elicited despite using mixed-race minimal groups, suggesting that minimal group categorization can overturn race-based biases (Van Bavel & Cunningham, 2009, 2012). Such cross-categorization of race and minimal groups has been shown to override race bias in various domains including neural processing of faces (Van Bavel et al., 2008, 2011), attention to and memory of faces (Van Bavel & Cunningham, 2012), and implicit evaluation (Van Bavel & Cunningham, 2009, 2012). We will extend these results by using the Implicit Association Test (IAT; Greenwald, McGhee, & Schwartz, 1998), the best-known measure of implicit bias. While there is significant debate over the behavioral correlates of the IAT (e.g., Greenwald, Banaji, & Nosek, 2015; Oswald, Mitchell, Blanton, Jaccard, & Tetlock, 2013), it is a useful measure for our purposes because its popularity gives us a benchmark of typical bias. Insofar as the IAT indexes automatic associations (Nosek, Greenwald, & Banaji, 2007), we can test whether an arbitrary categorization can engender an automatic positivity bias despite the presence of a known stigmatized categorization.
We also evaluate orthogonal categorization’s effect on dehumanization, an important and distinct form of bias (Kahn, Goff, & McMahon, 2015), which can also be measured implicitly. Moreover, to better understand the time course of such biases, we look at neural signatures of reflexive and controlled processing in response to multiply categorized targets.
Dehumanization
Researchers have tested the effects of multiple categorization on dehumanization by crossing ethnic or immigrant categorization with individuating descriptions including religion, age, nationality, and other classifications (Albarello & Rubini, 2012; Prati, Crisp, Meleady, & Rubini, 2016). But no one has used the strongest contrast of a minimal group versus a socially important classification. Dehumanization is distinct from prejudice (Kahn et al., 2015; Wilde, Martin, & Goff, 2014) as it does not require antipathy (Haslam & Loughnan, 2012). This makes it a valuable test of whether grouping affects ingroup preference rather than outgroup dislike as it assesses attitude differences without inherently measuring animosity. The present work therefore measures implicit dehumanization to expand our understanding of the extent of the effects of crossed categorizations. Can an arbitrary categorization affect automatic associations with humanness, in addition to engendering a positivity bias?
Work using other measures of dehumanization suggests that minimal outgroup members are perceived as less human (Capozza, Boccato, Andrighetto, & Falvo, 2009; Hackel et al., 2014) and that multiple categorization of outgroup targets reduces dehumanization (Albarello & Rubini, 2012; Prati et al., 2016), but these approaches have not been combined. We investigated not whether multiple categorization overcomes typical biases, but if minimal groups can elicit dehumanization even in the presence of historically important orthogonal classifications. To do so we used two measures, infrahumanization and implicit dehumanization, asking participants to assess both groups’ emotional capacities and testing their unconscious associations with each.
Infrahumanization is the perception of outgroup members as less human than ingroup members (Leyens et al., 2001). Infrahumanization exists independent of outgroup derogation and ingroup favoritism, instead suggesting a literally impersonal form of bias, operationalized to index intergroup denials of humanity (Haslam & Loughnan, 2014). The measure was developed to assess implicit attitudes (Leyens et al., 2000) and telling participants to purposefully bias their responses in either direction does not change its results, suggesting that infrahumanization is difficult to fake (Eyssel & Ribas, 2012). Implicit Association Tests (IATs) have been used multiple times to assess dehumanization implicitly (Goff, Eberhardt, Williams, & Jackson, 2008; Mekawi, Bresin, & Hunter, 2016; Rudman & Mescher, 2012), but the only minimal group study primarily manipulated disgust (Buckels & Trapnell, 2013). We seek to show implicit dehumanization and infrahumanization 1 due only to minimal grouping, which would show that the mere label of “other” is sufficient to cause differential assignment of humanity.
Neural Processing
Numerous studies have endeavored to find the neurological components of social processes, including grouping, face perception, empathy, and action perception (see Cikara & Van Bavel, 2014, for a review). This literature aims to illuminate the interplay of bottom-up perceptions and top-down knowledge to better understand how we interact with the world. Multiple group memberships are a perfect test, pairing a visual categorization with a memorized, arbitrary one. We used ERPs to test the effects and time course of these complex social stimuli. We also preregistered and measured neural resonance as the suppression of mu band oscillations in the sensorimotor cortex—which is thought to show simulation of observed actions within the observer’s own sensorimotor system (Fox et al., 2015)—but results were inconclusive and can be found in the supplemental material along with additional information on this measure.
Visual and attentional differences are reflected very quickly after a stimulus is presented. Facial race and gender are differentiated in the brain as early as 122 ms after stimulus onset (e.g., Ito & Urland, 2003), though face sensitivities prior to 170 ms have been shown to be due to low-level visual cues such as stimulus amplitude and color (Rossion & Caharel, 2011). The N170 is thought to be selective to face stimuli, in that it is typically larger in response to human faces compared to objects and nonhuman faces and is thus thought to be involved in face processing (Bentin, Allison, Puce, Perez, & McCarthy, 1996; Eimer, 2011; Eimer, Kiss, & Nicholas, 2010; Rossion & Jacques, 2008). It is also affected by race (e.g., Balas & Nelson, 2010; Gajewski, Schlegel, & Stoerig, 2008; Ito & Urland, 2005) and minimal ingroup (Ratner & Amodio, 2013), although the direction of these effects seems to be context-specific (Ito & Senholzi, 2013; Senholzi & Ito, 2013) and the two have not been juxtaposed. The P200, thought to reflect the orientation of attention to relevant and salient features (Czigler & Gexcy, 1996; Eimer, 1997; Kenemans, Kok, & Smulders, 1993), is usually stronger in response to other-race and outgroup as opposed to own-race and ingroup faces (Hehman et al., 2011; Ito & Urland, 2003), while the N200 is usually larger in response to same-race faces as opposed to other-race faces (Ito & Urland, 2003).
Later processing does not respond solely to visual differences. The P3 is considered to indicate the allocation of processing resources to motivationally relevant stimuli and also seems to be affected by race (Ito & Urland, 2003). We do not know whether it responds more to visually apparent or memorized groupings; perhaps the longer time frame allows for more complex target representations or more influence of top-down self-categorization. Looking at the event-related neural responses in this study allows us to test whether, in addition to affecting implicit attitudes, crossed categorizations alter the neural processing of social categories.
Current Research
The current research aims to contribute to the literature on social recategorization by making race orthogonal to minimal groups, which we induced using a group memorization paradigm (Van Bavel et al., 2008). We chose this paradigm because it engenders strong grouping effects while creating true minimal groups that do not interact, share history, or choose their affiliations (Hewstone et al., 2002; Pinter & Greenwald, 2011; Van Bavel et al., 2008). We tested its effects on well-established measures of implicit and explicit bias, as well as neural processing. As outlined in our preregistration of this study (https://osf.io/73h6n/), we predicted that assigning participants to an arbitrary minimal ingroup that included own-race and other-race individuals and having them memorize the faces of both the minimal in- and outgroups would produce infrahumanization of, implicit bias toward, and less motor resonance with the minimal outgroup, with no effect of target race. The motor resonance results are reported in the supplemental material along with an exploratory moderation analysis testing whether, in accordance with social identity theory, participants who identify more strongly with their minimal group would show more implicit bias, infrahumanization, and implicit dehumanization towards the minimal outgroup.
To gain a more fine-grained differentiation of the independent effects and interactions of race and minimal group dimensions on early stimulus processing over time, we performed an exploratory ERP analysis, going from early attentional processes that have previously been shown to reflect racial and gender biases (the N170 up to the N200; Hehman et al., 2011; Ito & Urland, 2003) to more reflective, motivation-driven processing (e.g., the P3; see Willadsen-Jensen & Ito, 2006, for a similar approach).
Methods
Participants
Seventy-five White university students participated in the study for either money or course credit. Twelve participants were excluded due to computer (n = 4) or experimenter error (n = 3), or because they did not self-identify as White (n = 1) or did not meet the 70% correct threshold on the target group memorization task (n = 4). Another was excluded for not remembering the group assignment (n = 1). This left a final sample of 62 participants (32 female; Mage = 21.65, range: 17–56), just below our preregistered sample size of 65, chosen from power analysis of our infrahumanization pilot data, which suggested it to be sufficient for a power of .80. The subjects were distributed evenly into two minimal groups called the Asteroids (n = 32; EEG n = 19) and Comets (n = 30; EEG n = 20). Of these, a subset (n = 39; 20 female; 37 right-handed; Mage = 20.46, range: 17–30) completed the within-subjects EEG portion of the study in addition to the behavioral measures. The Brandeis University Institutional Review Board approved the study.
Measures
Implicit Association Test (IAT)
Participants took three IATs, testing their association of memorized photos of minimal ingroup and outgroup members with human and animal traits to assess implicit dehumanization, with positive and negative words to assess implicit prejudice, and with self and other concepts. The self–other IAT was included as a manipulation check, always came third, and showed the same general pattern of results as the other two (see supplemental material). Scores on the positivity bias IAT were correlated with scores on the self–other IAT (r = .51, 95% CI [0.30, 0.68], p < .001), but dehumanization IAT scores were unrelated to either positivity bias (r = −.01, 95% CI [−0.26, 0.24], p = .94) or self–other scores (r = .05, 95% CI [−0.20, 0.30], p = .68), suggesting that dehumanization is indeed a distinct form of bias.
Each IAT had the standard seven blocks (Nosek et al., 2007), including three sets of 20 trials introducing faces or concepts (Blocks 1, 2, and 5), two practice blocks of 20 trials (Blocks 3 and 6), and two test blocks of 40 trials (Blocks 4 and 7). The order of blocks in each IAT was counterbalanced across participants, and the IATs were scored using the D-algorithm (Greenwald, Nosek, & Banaji, 2003) to compare reaction times in associating in- and outgroup faces with the concepts presented. On the positivity bias IAT we doubled the standard number of test trials in order to look at sub-D scores for face stimuli so that there were 80 rather than 40 trials in Blocks 4 and 7.
Positivity bias
The positivity bias IAT used the standard set of positive (joy, love, peace, wonderful, pleasure, glorious, laughter, happy) and negative words (agony, terrible, horrible, nasty, evil, awful, failure, hurt; Nosek et al., 2007), testing participants’ preferences for minimal group faces (see Figure 1). It has been shown to have satisfactory test–retest reliability (median r = .56; Nosek et al., 2007). Participants categorized words as “good” or “bad” and faces as “Asteroid” or “Comet.”
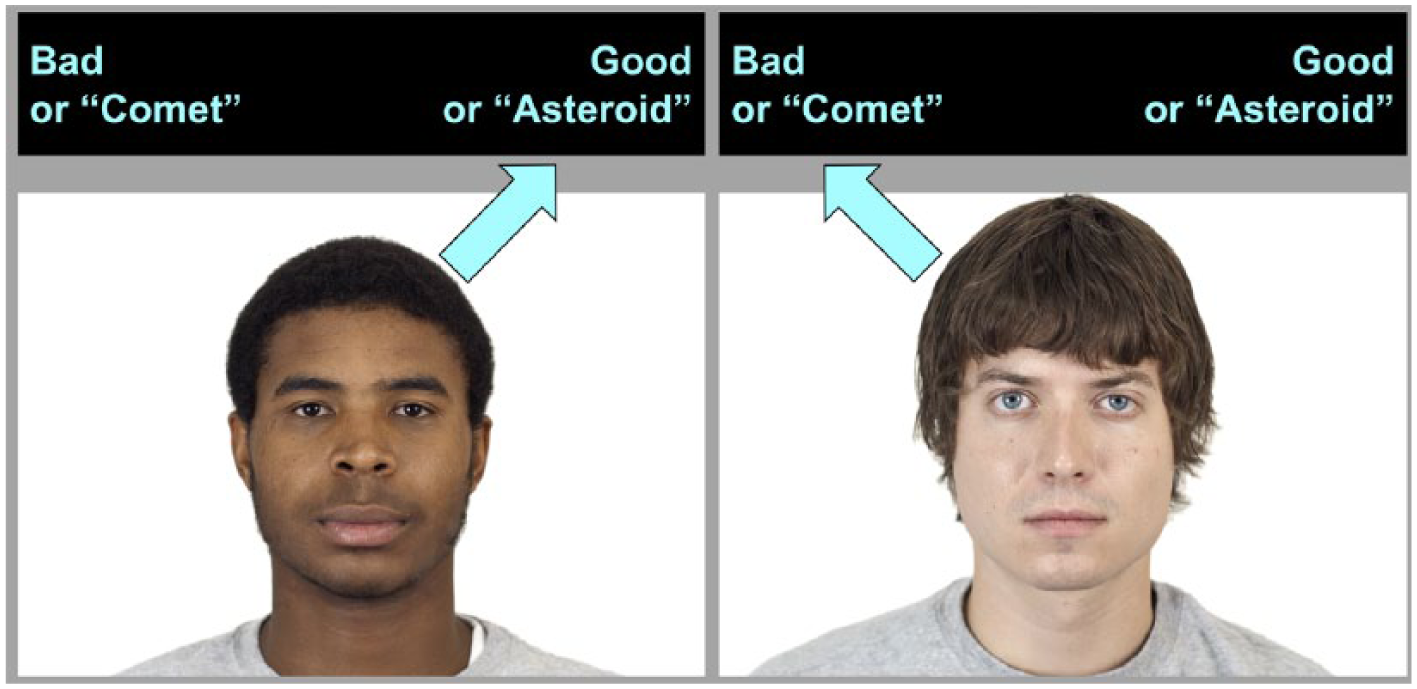
Representative trials of positivity bias IAT (faces are from the Chicago Face Database).
Dehumanization
The dehumanization IAT tested the association of in- and outgroup photos with words related to animals (animals, nature, instinct, physical, bodies) and words related to humans (culture, society, mind, symbols, monuments; Rudman & Mescher, 2012). We predicted that this would provide convergent evidence with the infrahumanization measure described in what follows. Participants categorized words as “animal” or “human” and faces as “Asteroid” or “Comet.”
Emotional Attribution Task
Infrahumanization is operationalized as the differential attribution of secondary emotions to ingroup rather than outgroup members (Demoulin et al., 2004). Secondary emotions—sentiments in French—like love and hope are uniquely human, while primary emotions—émotions—like anger and fear are also attributed to nonhuman agents like animals (Leyens et al., 2000; Leyens et al., 2001).
During this task, participants read a list of 20 adjectives and were asked to pick every word they thought was characteristic of the minimal ingroup or of the minimal outgroup. They were then presented with the same list and asked to choose again for the other group. The order of groups was randomized between participants. The 20 adjectives included 14 filler words related to warmth and competence, three primary emotions (happiness, surprise, pleasure) and three secondary emotions (tenderness, love, hope). The emotion words were chosen based on their similar valences and consensus among raters (Cortes, Demoulin, Rodriguez, Rodriguez, & Leyens, 2005; Demoulin et al., 2004). Only positive emotions were used to more closely replicate Demoulin et al.’s (2009) work.
Procedure
After signing the consent form, participants were told they would be learning about two groups, the Asteroids and the Comets, and that they had been assigned to one of the two. They were then photographed in front of a blank wall at a standard distance and zoom intended to maximize the photographs’ similarity to the stimuli. For EEG participants, recording was set up at this point, as detailed in the following sections. Participants completed two learning tasks on the computer in which they were shown 16 faces (plus their own to enhance their sense of affiliation) split into two groups labeled Asteroids and Comets. Both the Asteroids and the Comets were always made up of four Black and four White faces, but the assignment of faces to groups was randomized such that all participants saw the same 16 faces with unique group assignments. The learning task consisted of participants seeing this presentation of 17 faces—eight in their minimal ingroup plus their own on one side of screen, eight in their outgroup on the other side of the screen—and having 3 minutes to memorize them. The side of the screen on which each group was presented was counterbalanced across participants, and the position of each face within the two grids was random. The sorting task presented the faces one at a time in the center of the screen without group labels, and participants were asked to sort them into the proper minimal group by pressing the “E” and “I” keys on the keyboard. Incorrect responses produced an “X” on the screen and required participants to click the correct key to proceed. This served to confirm participants’ knowledge of the groups; on average, participants were correct on 90.85% of trials and participants who scored below 70% were excluded from analysis.
Participants then took the IATs, which comprised the same images of minimal group members’ faces as the learning tasks, again without any indication of group membership. Because we were concerned about the efficacy of repeated IATs, the group-identification test—the least theoretically important—was always presented last, and the order of the first two was randomized. Next, participants completed several questionnaires described in the Additional Measures section.
At this point, participants in the EEG version of the study watched four 3-minute blocks of videos of right hands squeezing stress balls. The memorized faces were paired with hand videos to suggest that the hands belonged to the target minimal group members. ERPs were computed for each face presentation. The stress ball squeezes were used to calculate motor resonance.
Lastly, all participants filled out a brief demographic questionnaire before finishing with the final manipulation check asking them to report which minimal group was theirs. Participants were then debriefed, compensated, and dismissed.
Stimuli
Target images were of males photographed in grey T-shirts on white backgrounds with only their heads and shoulders visible. These were obtained from the Chicago Face Database (Ma, Correll, & Wittenbrink, 2015), and were chosen by eliminating all targets who were not between 18 and 25 years old and labeled as White or Black by 100% of raters. We then standardized the attractiveness and threateningness ratings for the remaining faces and selected eight of each race that were within 1 standard deviation of the mean on both measures.
EEG task
The order of stimulus presentation was as follows: 2,000 ms of white noise followed by a jittered fixation cross for between 500 and 800 ms, a 1,500 ms presentation of a memorized face, another jittered 500–800 ms fixation cross, and then three repetitions of a 2,000 ms video of a hand squeezing a stress ball, with jittered fixation crosses between each presentation (see Figure 2). The intertrial period was between 10 and 1,000 ms. The white noise and videos covered 20% and 19% of the screen, respectively, while the images covered 4%. All stimuli were presented centered on 1,920 x 1,080 pixel monitors. Each of the 16 memorized faces was presented once per block and there were four blocks. These face presentations were used for ERP calculation.
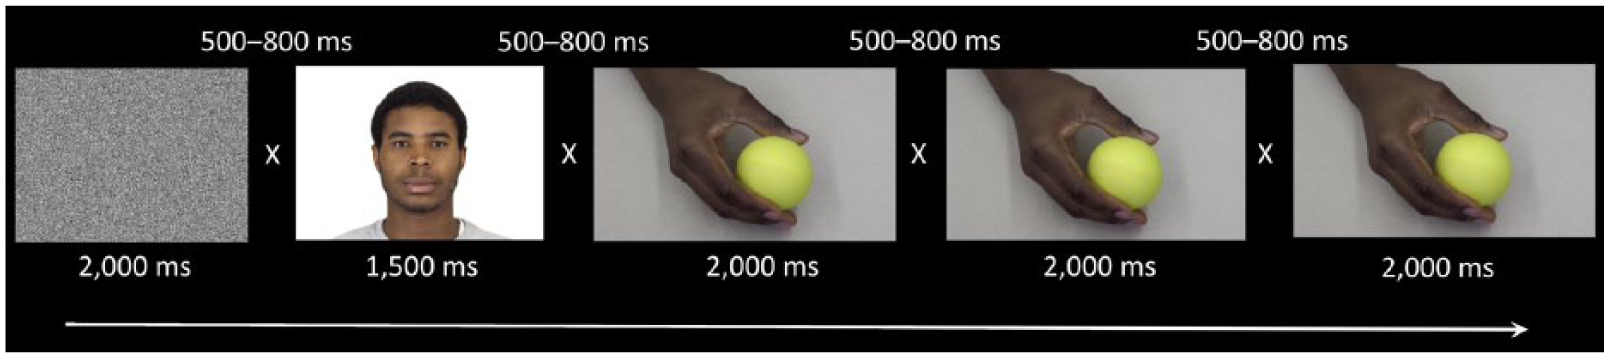
Order and duration of stimulus presentation in one trial. Numbers above indicate interstimulus time with a fixation “x” on the screen (times varied randomly between 500 and 800 milliseconds). Each face was presented in random order once per block. There were four blocks.
Presentation order was randomized within blocks and each face was paired with a hand video of the same race. We made the videos in lab, recording people squeezing a stress ball at 1 Hz and cutting the videos into 2-second clips (see Figure 2, for a still image). We used eight clips of Black hands and eight clips of White hands, and told participants there were multiple videos for each face, allowing hands and faces to be matched randomly within race. We have used similar stimuli in other studies (Hager, Yang, & Gutsell, 2018).
EEG recording and processing
EEG was recorded from 33 active electrodes embedded in a stretch-Lycra cap (ActiCap, BrainProducts GmbH, Munich, Germany) arranged according to the 10–20 system with impedances kept below 20 kΩ. The EEG was digitized at 500 Hz using BrainAmp amplifiers and BrainVision recorder software (BrainProducts GmbH, Munich, Germany) with an initial reference at FCz and re-referenced offline to the average of all EEG electrodes. The data were filtered through 30 Hz low-pass and 0.01 Hz high-pass zero-phase Butterworth filters (24 dB), and ocular artifacts were corrected using the VEOG channel 2 and an ICA-based procedure for isolating and removing ocular artifacts (Croft & Barry, 2000). Remaining artifacts exceeding ± 100 μV in amplitude, with a voltage step larger than 200 μV between sample points, or a maximum voltage difference of less than 0.5 μV within a 100 ms interval were rejected for individual channels in each trial.
For the ERP analysis, we created artifact-free epochs from 200 ms pre-stimulus onset to 1,500 ms post-stimulus onset for each face presentation. The N170 was evaluated as the average activity in a 150 to 250 ms window at left posterior electrodes TP9, P7, and P09 and at right posterior electrodes TP10, P8, and PO10; for P200 we computed mean amplitudes between 150 and 250 ms at Cz; the N200 was evaluated as the average activity between 200 and 350 ms at central electrode Cz; and the P3 was evaluated as the average activity between 350 and 700 ms at Pz.
Additional Measures
Participants also completed a four-item Likert scale measure of their identification with both their racial and minimal groups (e.g., “I identify with being an Asteroid”; 1 = strongly disagree, 7 = strongly agree; Postmes, Haslam, & Jans, 2012); the Symbolic Racism 2000 Scale (Henry & Sears, 2002), an eight-item measure of prejudice toward African Americans; and an exploratory visual measure of perceived conflict between groups. We also preregistered a final manipulation check but a programming mistake misreported its data for most participants.
Results
There were no significant differences between participants assigned to be “Asteroids” and participants assigned to be “Comets” in age, gender, expressed commitment to minimal group, expressed commitment to racial group, symbolic racism, perception of conflict between the two groups, or IAT D-scores on any of the three IATs (all ps > .27). We also found no significant differences between male and female participants on any of our dependent variables, including resonance (all ps > .10). Therefore, neither participant gender nor specific minimal group membership was considered in the following analyses. Confirming our manipulation, participants implicitly associated themselves more strongly with their minimal ingroup than with the minimal outgroup, according to the self/other IAT, D = .42, 95% CI [0.31, 0.52].
Implicit Bias
IATs were scored using the D-algorithm (Greenwald et al., 2003), which measures the effect size of the response time difference between stimulus pairings ([ingroup and good + outgroup and bad] versus [ingroup and bad + outgroup and good]). In accordance with our preregistration and the recommendation of Nosek et al. (2007), we excluded trials over 10,000 ms as well as the participant for whom more than 10% response times were under 300 ms. For the dehumanization and group-identification IATs, practice and task blocks were scored separately, then averaged, but due to the doubling of task trials on the positivity IAT we did not separate practice and task scores, instead simultaneously computing a single D-score for all trials. This is not standard practice, but it gave us more power to tease apart the effects of race and minimal group. We would expect that, if anything, the added trials would decrease bias scores due to practice effects.
To test whether a particular combination of race and minimal group membership was driving our effects, we ran a 2 (race: Black or White) x 2 (group: in- or out-) repeated measures ANOVA using mean response time difference scores (bad minus good, animal minus human, other minus self). The positivity bias IAT and group-identification IAT response times were inverse rooted and the dehumanization IAT response times were inverted to normalize the data, as these response times are positively skewed. 3 Transformed values were used in statistical models; reported D-scores and means were calculated with untransformed data.
Participants had a mean D-score of .35, 95% CI [0.26, 0.43] on the positivity bias IAT, indicating a preference for the minimal ingroup relative to the minimal outgroup. We also calculated D-scores using only trials in which participants categorized target faces. These trials, unlike the word stimuli trials, contain information about both race and minimal group—one memorized, one visually apparent—allowing us to directly compare response times. This unorthodox approach, aided by the doubled number of trials, showed no bias on the basis of race (D = .03, 95% CI [−0.02, 0.08]) and similar minimal group bias (D = .34, 95% CI [0.25, 0.42]), although it is important to note that we did not include a condition that required participants to sort faces according to race, so we cannot truly compare minimal group bias to racial bias.
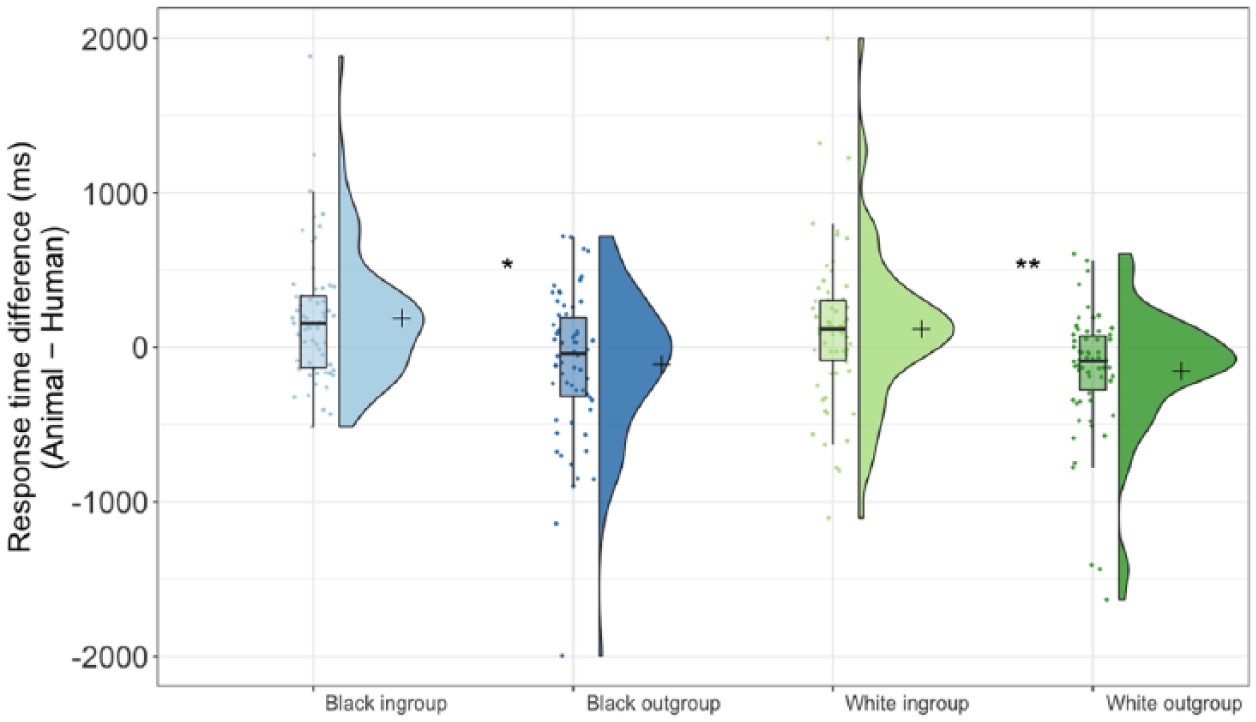
The ANOVA showed a significant main effect of minimal group, F(1, 61) = 52.24, p < .001, η2 = .46, 95% CI [0.27, 0.59], 4 and no main effect of race, F(1, 61) = 1.18, p = .28, η2 = .02, 95% CI [0, 0.13], nor interaction of minimal group and race, F(1, 61) = 2.86, p = .096, η2 = .05, 95% CI [0, 0.18] (see Figure 3). Preplanned simple comparisons found a significant difference between response times for White ingroup (M = 229.60 ms, SD = 379.53 ms) 5 versus White outgroup targets (M = −188.79 ms, SD = 267.12 ms), F(1, 61) = 42.51, p < .001, η2 = .41, 95% CI [0.22, 0.55]; and for Black ingroup (M = 173.04 ms, SD = 259.23 ms) versus Black outgroup targets (M = −174.59 ms, SD = 311.22 ms), F(1, 61) = 39.61, p < .001, η2 = .39, 95% CI [20, 0.54]. The difference in response times between White ingroup members and Black ingroup members was outside the traditional threshold of significance, F(1, 61) = 3.79, p = .056, η2 = .059, 95% CI [0, 0.20], and the racial difference for outgroup members was also nonsignificant, p = .56.
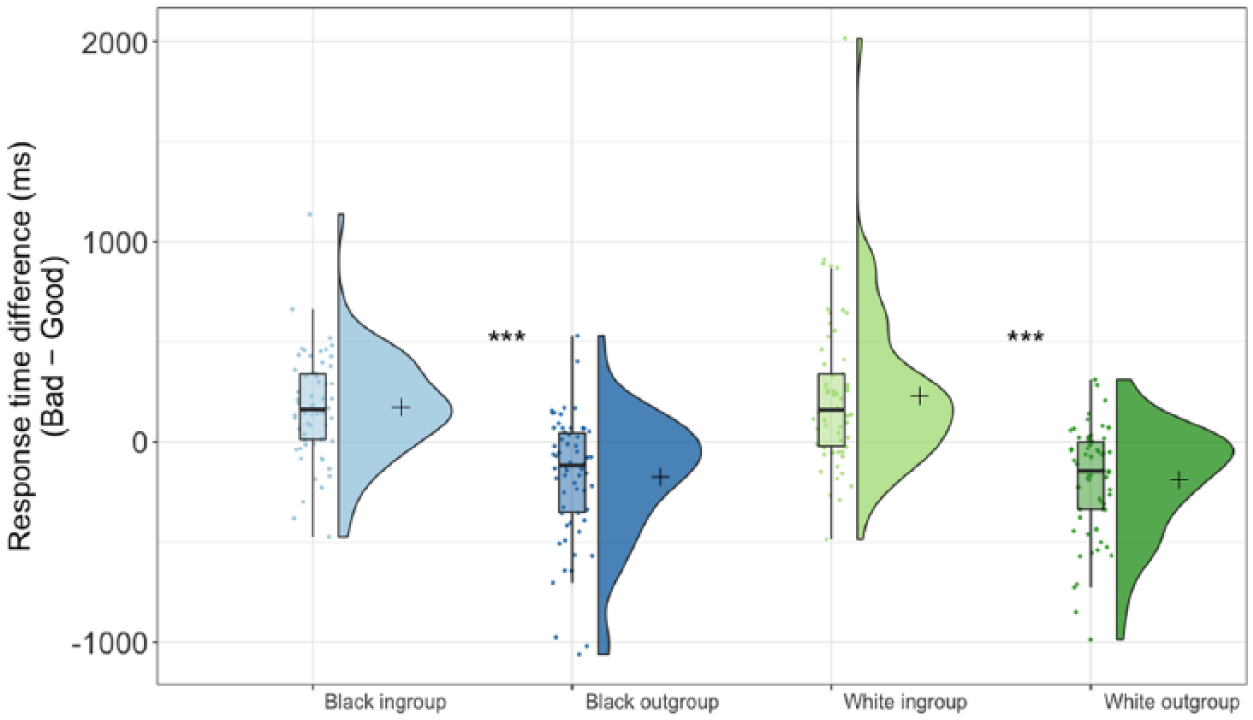
Difference scores between response times, with higher values indicating greater association of that stimulus with positive concepts. Figure created using Raincloud Plots (Allen, Poggiali, Whitaker, Marshall, & Kievit, 2018).
Dehumanization
Infrahumanization
To assess condition effects on infrahumanization we ran a 2 (group: in- or out-) x 2 (emotion: primary or secondary) repeated measures ANOVA, which revealed a main effect of minimal group, F(1, 61) = 4.81, p = .032, η2 = .07, 95% CI [0, 0.22]. There was no effect of emotion, F(1, 61) = 1.00, p = .32, η2 = .02, 95% CI [0, 0.12], nor was there an interaction, F(1, 61) = .14, p = .71, η2 < .01, 95% CI [0, 0.08]. Preplanned simple comparisons of emotion showed a significant difference between ingroup (M = 0.77) and outgroup attribution (M = 0.53) of secondary emotions, F(1, 61) = 4.67, p = .035, η2 = .07, 95% CI [0, 0.21], confirming our preregistered hypothesis. The difference in primary emotion attribution was not significant (p = .13; see Figure 4). This suggests that ingroup members were seen as having more complex emotions than outgroup members: outgroup members were infrahumanized. Other work has similarly reported infrahumanization results through planned comparison of secondary emotions in the absence of a significant interaction (Cehajic, Brown, & González, 2009), but it is possible that the outgroup was simply attributed fewer emotions of all kinds.
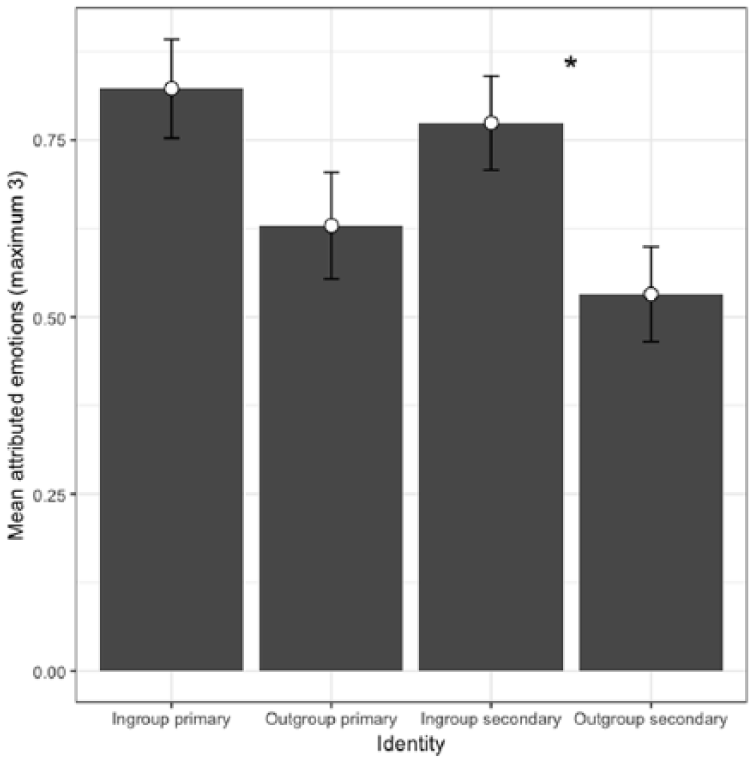
Attribution of primary and secondary emotions to the minimal ingroup and minimal outgroup.
IAT
The dehumanization IAT showed the same pattern of results as the positivity bias IAT. Participants were quicker to associate the ingroup rather than the outgroup with human versus animal concepts, D = .22, 95% CI [0.12, 0.33], and there was no race effect in the face stimuli trials, D = −.03, 95% CI [−0.10, 0.04].
The ANOVA showed the expected significant main effect of minimal group, F(1, 61) = 10.51, p = .002, η2 = .15, 95% CI [0.02 0.31], no effect of race, F(1, 61) = 3.13, p = .082, η2 = .05, 95% CI [0, 0.18], and no interaction between group and race, F(1, 61) = 1.06, p = .31, η2 = .02, 95% CI [0, 0.12] (see Figure 5). Although the difference was not significant, Black targets (M = 37.28 ms, SD = 474.24 ms) elicited less dehumanization bias than White targets (M = −18.95 ms, SD = 477.00 ms). Simple comparisons found a significant difference between response times for White ingroup (M = 117.04 ms, SD = 498.13 ms) versus White outgroup targets (M = −154.95 ms, SD = 408.79 ms), F(1, 61) = 10.42, p = .002, η2 = .15, 95% CI [0.02, 0.30], and for Black ingroup (M = 186.74 ms, SD = 418.85 ms) versus Black outgroup targets (M = −112.18 ms, SD = 476.32 ms), F(1, 61) = 5.63, p = .021, η2 = .08, 95% CI [
Difference scores between response times, with higher values indicating greater association of that stimulus with human concepts. Figure created using Raincloud Plots (Allen et al., 2018).
Exploratory Analyses
ERP analysis
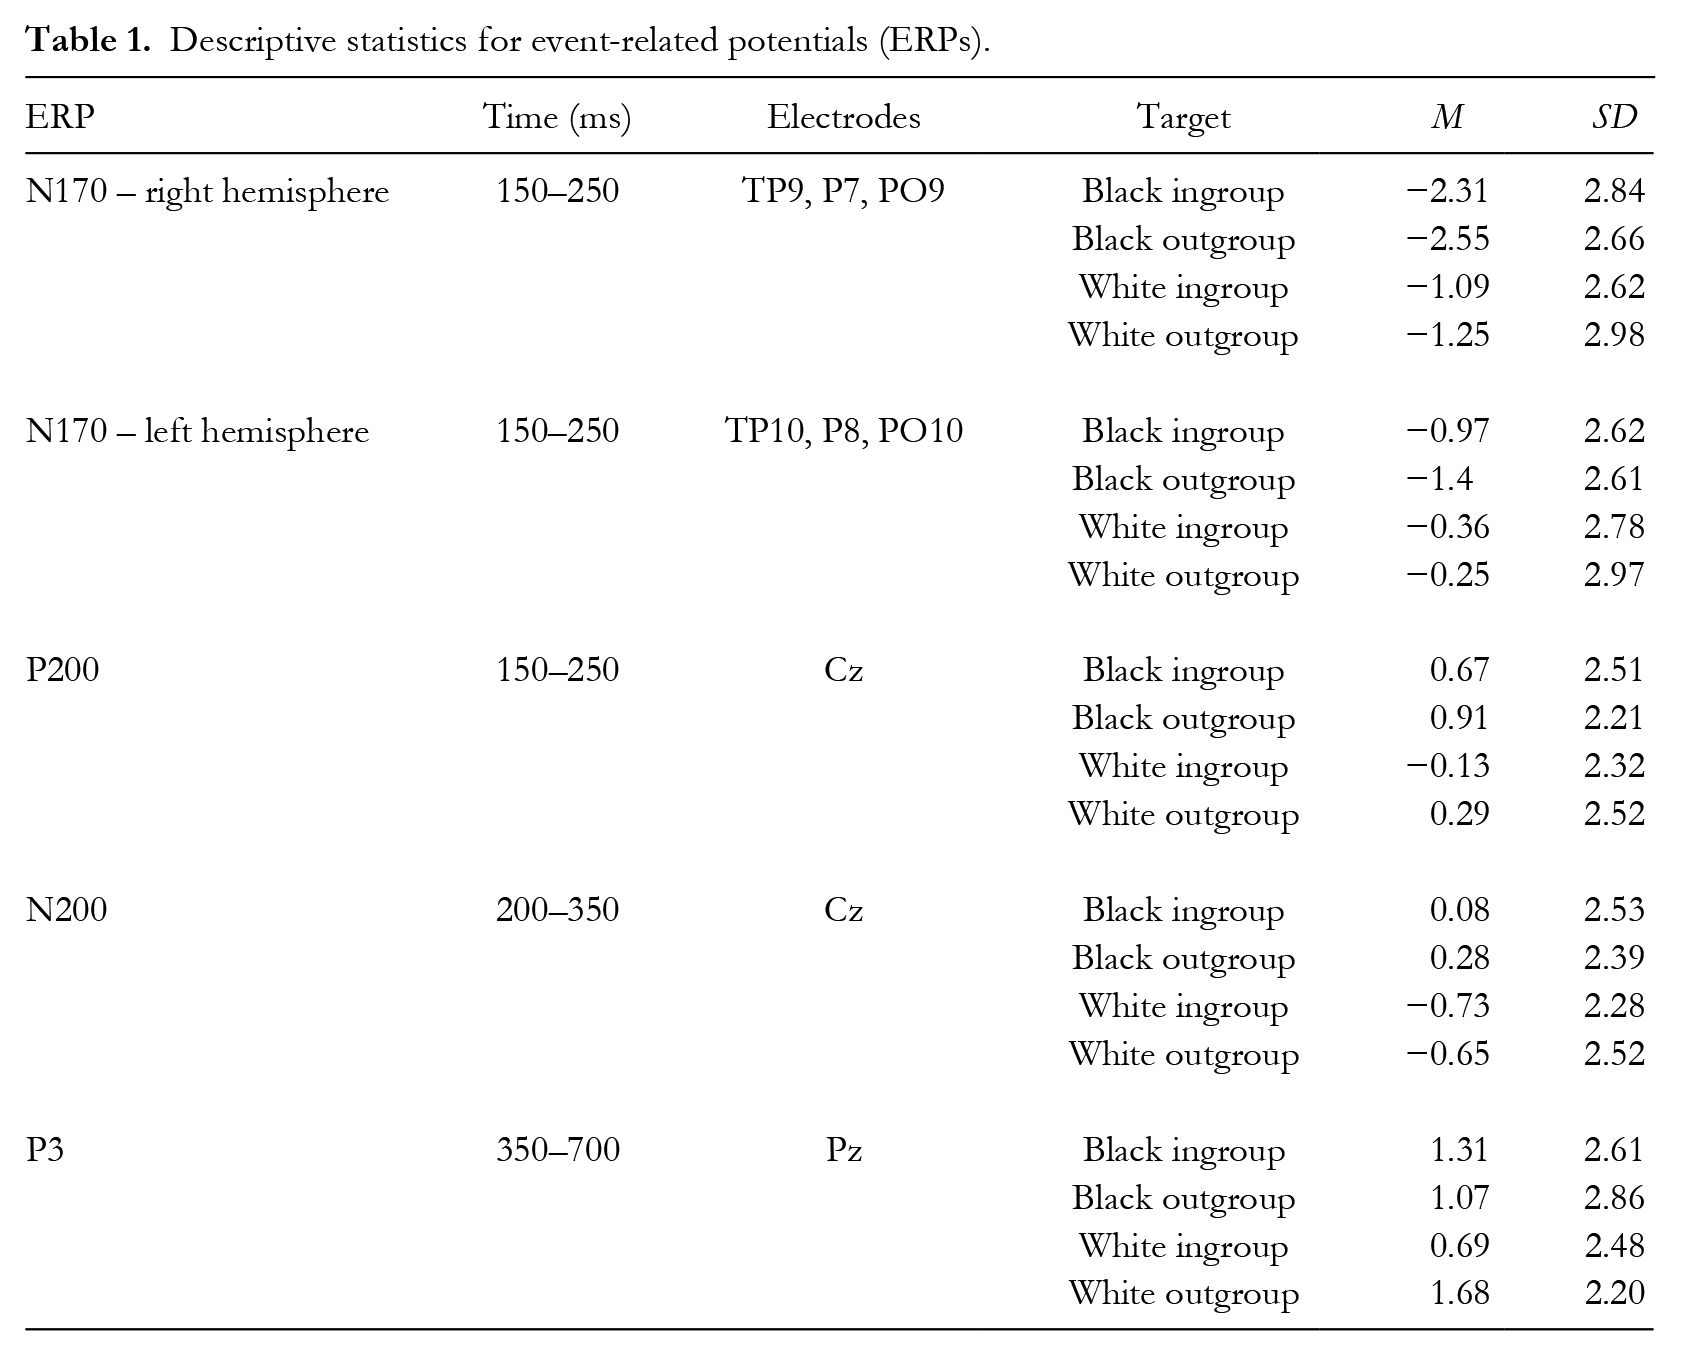
To assess the effects of minimal group membership and race on ERPs related to early attention and motivated processing, we conducted a series of 2 (minimal group: in- or out-) x 2 (race: Black or White) ANOVAs on ERP mean amplitudes (see Table 1 for means and standard deviations and Figure 6 for a depiction of the ERP waveforms). ERPs related to early visual face processing and attention—N170 in both right and left hemispheres, P200, and N200—all showed the expected main effect of race (all ps < .008), no main effect of minimal group (all ps > .21), and no interaction between group and race (all ps > .27). P200 and both N170s responded more strongly to the Black targets and N200 responded more strongly to White targets. These robust results (all η2s > .18) match research showing early potential responses to only racial categorization in multiply categorized targets (Alonso-Prieto et al., 2015; Cassidy, Boutsen, Humphreys, & Quinn, 2014; Hehman et al., 2011; Wiese, 2012).
6
Interestingly, a different pattern emerged for the P3 reflective of motivated selective processing: the ANOVA revealed no significant main effect of race, F(1, 37) < .01, p = .99, η2 < .01, or minimal group F(1, 37) = 1.44, p = .24, η2 = .04, 95% CI [0, 0.20], but did show an interaction between race and minimal group, F(1, 37) = 4.44, p = .042, η2 = .11, 95% CI [0, 0.30]. Post hoc simple comparisons found only a significant simple effect of minimal group for White targets, F(1, 37) = 5.77, p < .021, η2 = .14, 95% CI [
Descriptive statistics for event-related potentials (ERPs).
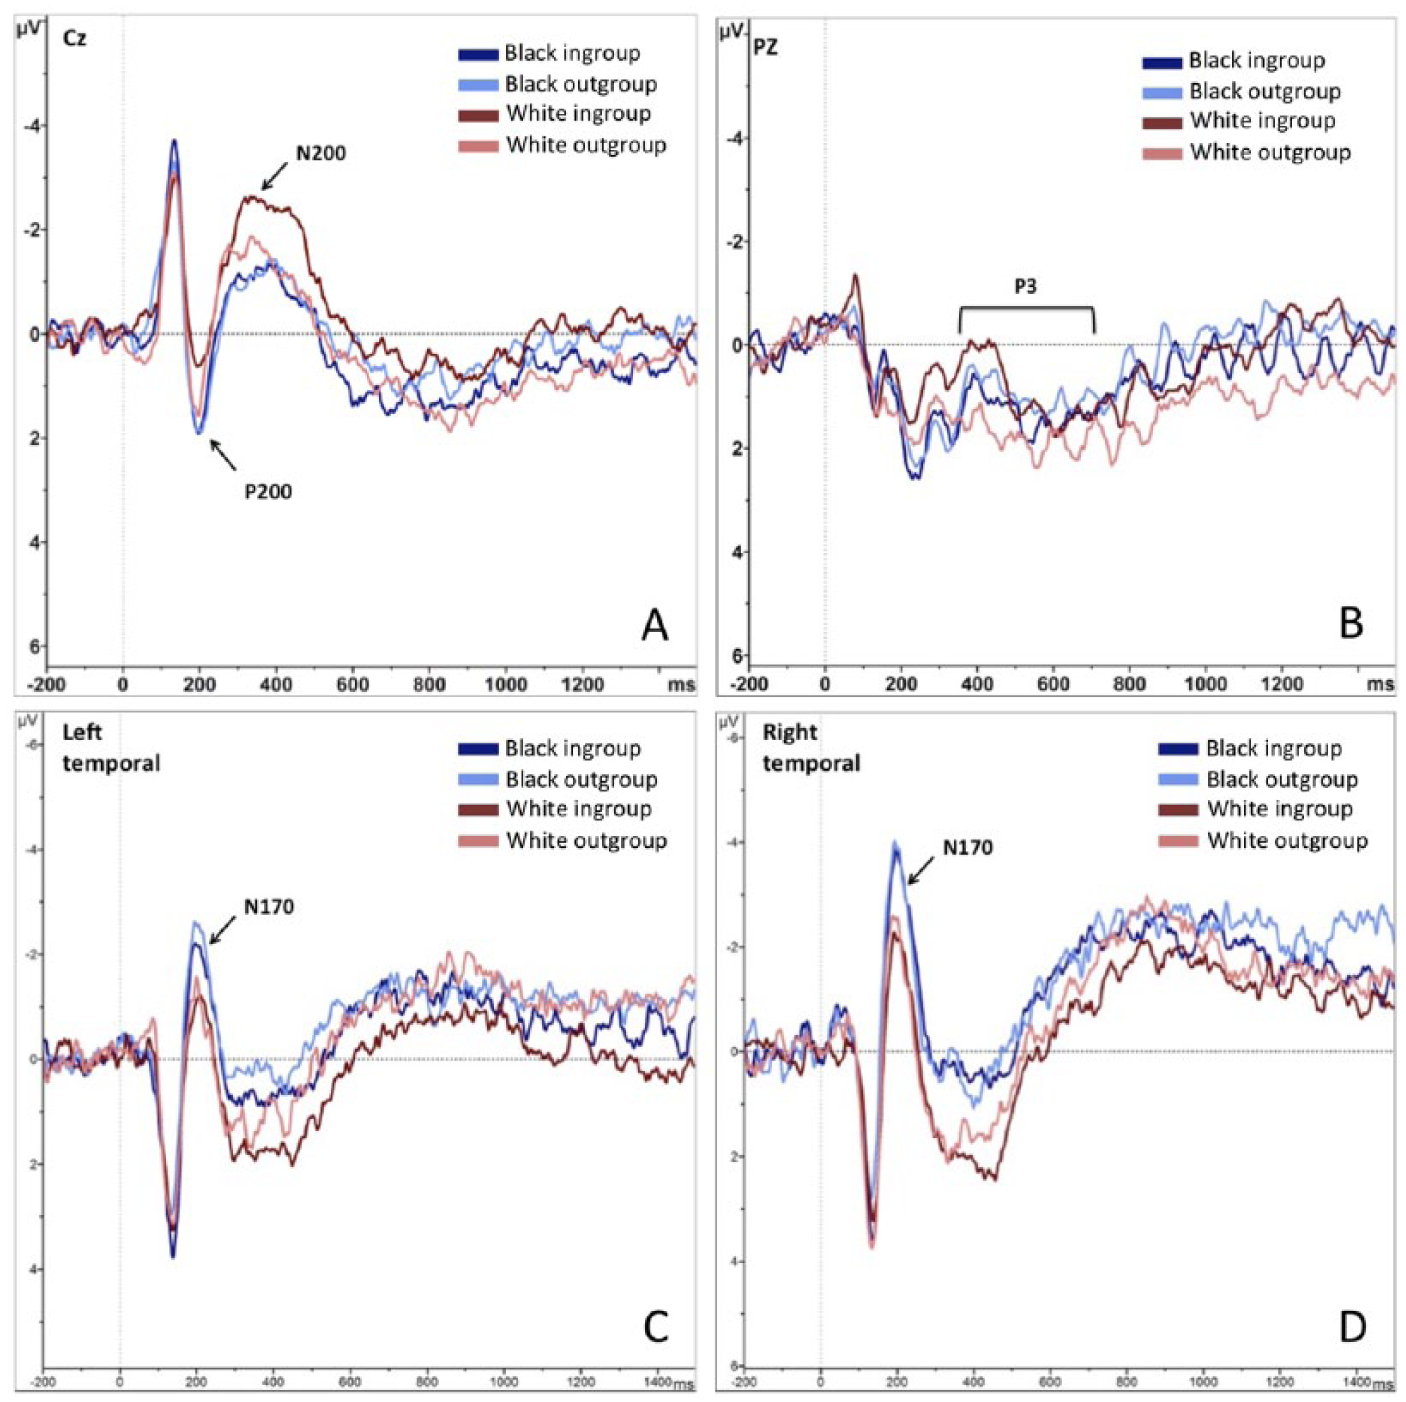
Grand averaged ERP waveforms at electrode Cz, Pz, as well as left and right posterior electrodes and electrode Oz for all group–race combinations.
Group identification
Finally, participants reported stronger identification with their racial groups (M = 4.23, SD = 1.02) than with their minimal groups (M = 3.88, SD = 1.31) on the four-item group commitment measures, t(61) = 2.01, p = .048, d = 0.30, and this identification correlated with symbolic racism, r = .29, 95% CI [0.05, 0.51], t(60) = 2.38, p = .02—higher White identifiers evinced more modern racism. Minimal group identification also correlated with positivity bias IAT scores, r = .35, 95% CI [0.11, 0.55], t(60) = 2.87, p = .0057, such that higher minimal group identifiers showed more implicit bias for their minimal group. See Table 2 for selected correlations between our variables. See the supplemental material for exploratory moderation analyses showing minimal group bias was stronger among participants who identified more strongly with their minimal ingroup, consistent with social identity theory and previous work (Van Bavel & Cunningham, 2012, Study 2).
Means, standard deviations, and correlations with confidence intervals.
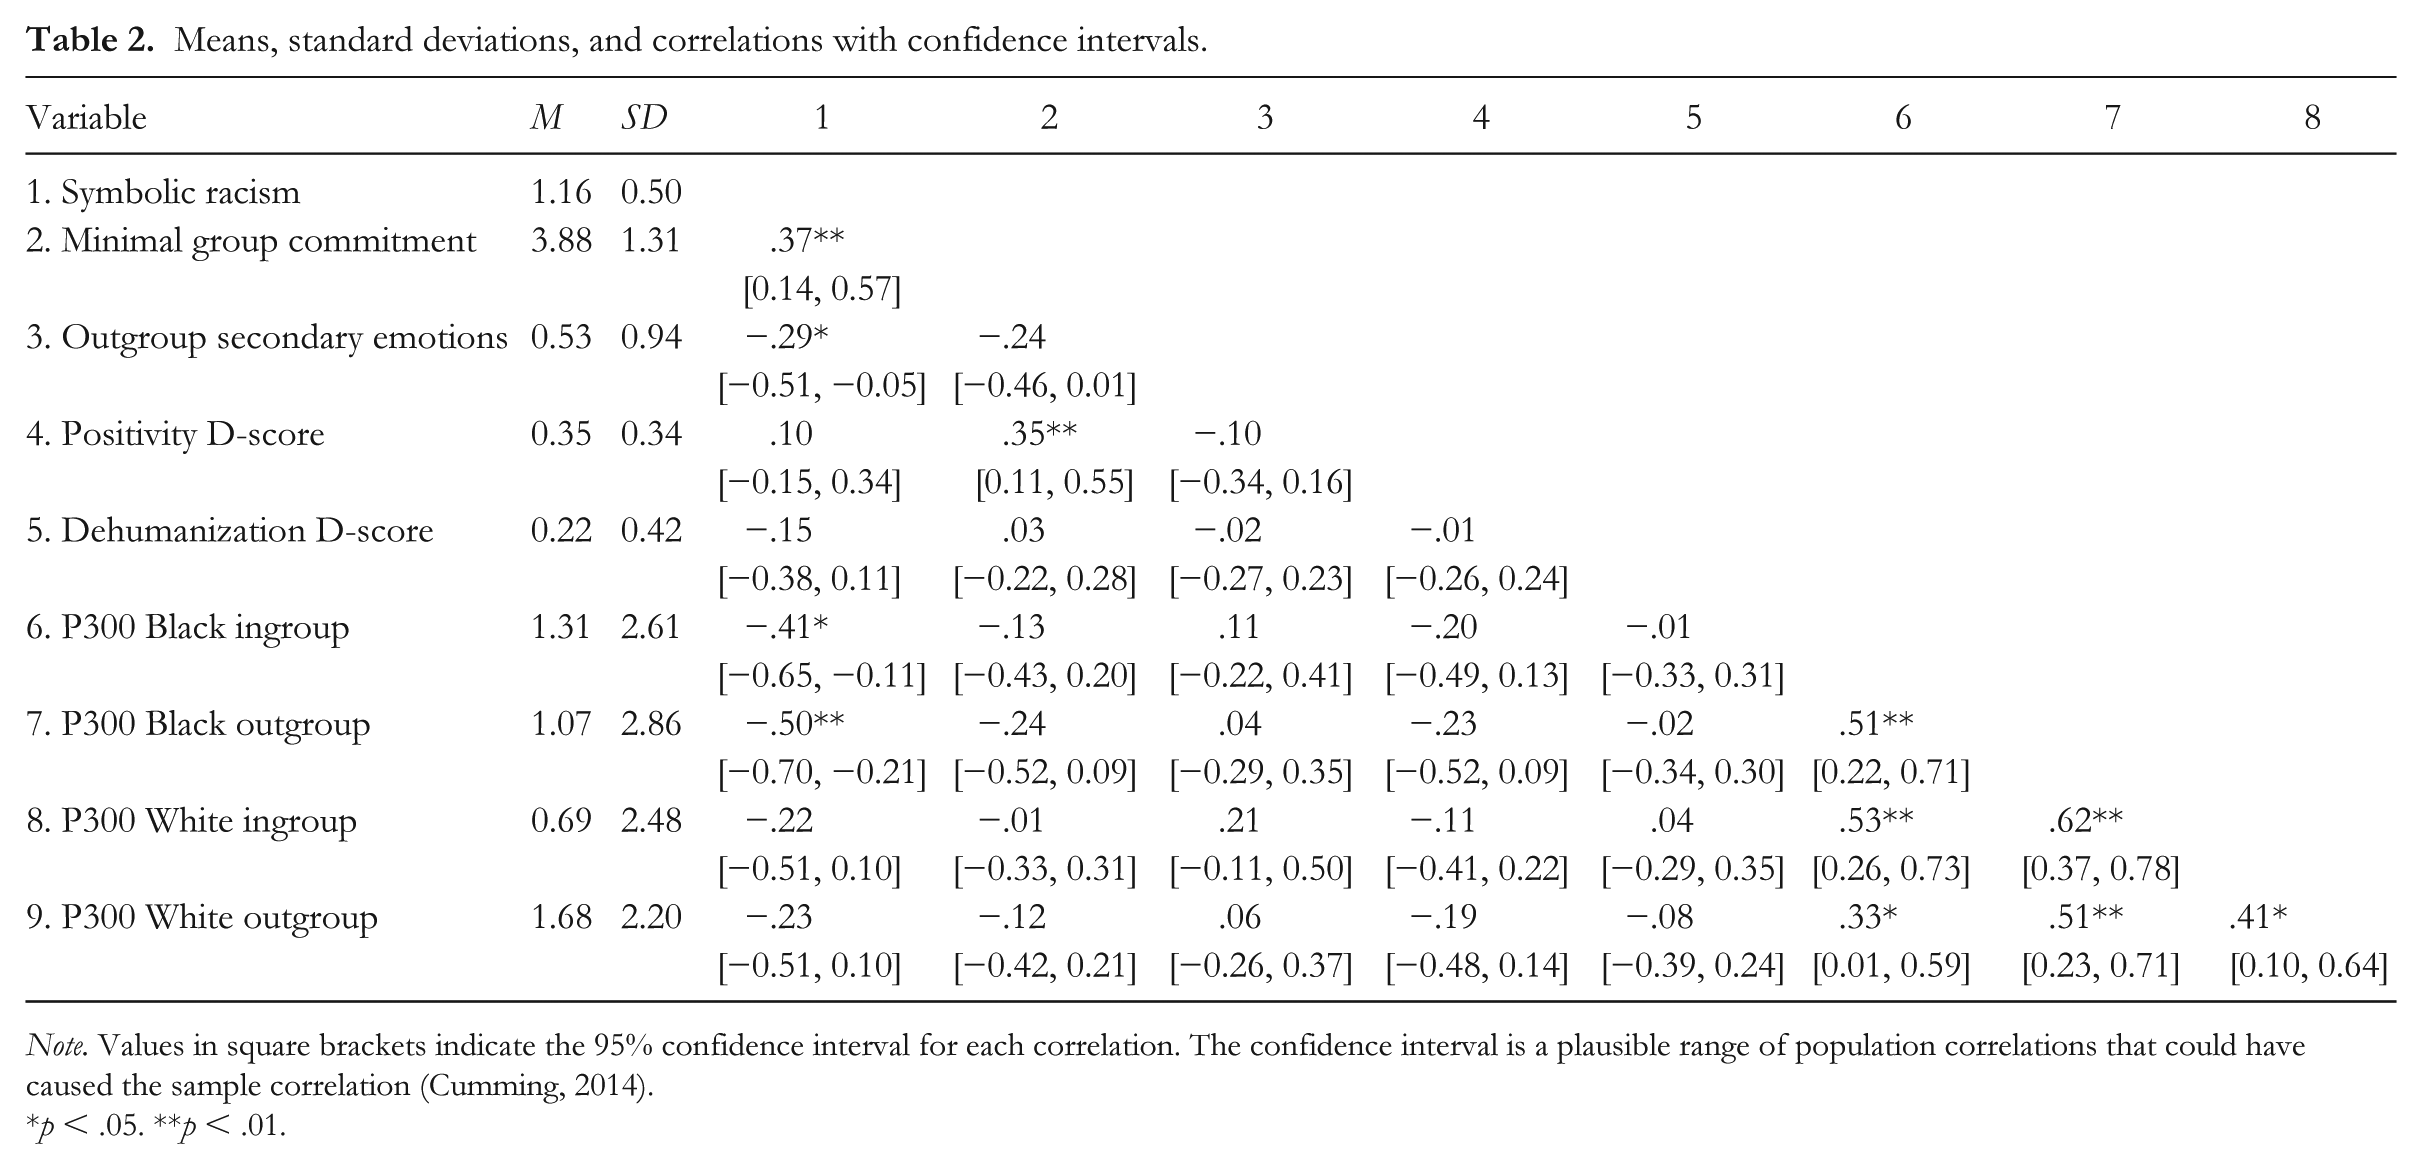
Note. Values in square brackets indicate the 95% confidence interval for each correlation. The confidence interval is a plausible range of population correlations that could have caused the sample correlation (Cumming, 2014).
p < .05. **p < .01.
Discussion
These results add to the existing evidence that intergroup bias is influenced by salient social categorization, not only visual markers of group membership. In a paradigm where the only information given about two groups was their names and the participant’s assignment to one, participants associated more strongly with their new ingroup, showed implicit bias in favor of their ingroup, and, for the first time, infrahumanized the minimal outgroup. All of this occurred despite the presence of race, a visually salient, orthogonal social category. Interestingly, in contrast to this behavioral and self-reported focus on the minimal group, early neural processing was primarily driven by race. Early components of the ERP (the N170, P200, and the N200) were solely affected by target race. While these early ERP components are often influenced primarily by simple stimulus and task factors, later ERPs such as the P3 are influenced by more complex stimulus factors and contextual information (Willadsen-Jensen & Ito, 2006), including, in this study, minimal group membership. Race no longer drove processing at the time of the P3 and we saw a trending interaction effect suggesting that minimal group membership might come into play at this time, potentially giving rise to implicit and explicit behavioral responses, such as infrahumanization. Moreover, the simple effect showing a stronger response to White outgroup than White ingroup targets is consistent with P3 responding to complexity, but this is an interpretation requiring further research.
Implications
Minimal groups engender dehumanization
Two measures provided evidence that the minimal outgroup is seen as less human than the ingroup. For the first time, participants infrahumanized a minimal outgroup, ascribing fewer uniquely human emotions to them despite the arbitrariness of the assignment and the orthogonal presence of multiple racial groups. Participants also implicitly dehumanized the minimal outgroup, again despite the presence of a more traditionally meaningful social classifier. These results suggest that a small, salient categorization can cause a target to be perceived as less than fully human, an important finding given that dehumanization has been shown to uniquely predict societal issues like police violence (Goff, Jackson, Di Leone, Culotta, & DiTomasso, 2014; Kahn et al., 2015). Recent work has found an unexpected willingness on the part of participants to endorse blatant dehumanization of outgroups (e.g., Kteily, Bruneau, Waytz, & Cotterill, 2015; Kteily, Hodson, & Bruneau, 2016). Whether such explicit attitudes could be found toward minimal outgroups—let alone in the presence of orthogonal categories—remains to be seen, but the finding that minimal outgroups are infrahumanized and implicitly dehumanized raises the possibility that they could be blatantly dehumanized as well.
In addition, the infrahumanization results combined with theoretical suggestions that dehumanizing others is “default” (Waytz, Schroeder, & Epley, 2014) suggest that the label of “ingroup” might increase perceptions of humanity. Future research should differentiate whether grouping causes the ingroup to be considered more human, the outgroup to be considered less human, or both. Consensus holds that ingroup favoritism predominates over outgroup derogation in determining biased behaviors (Brewer, 1979; Hewstone et al., 2002; Kurzban, Tooby, & Cosmides, 2001), even in minimal group paradigms (Ratner et al., 2014). It is possible that perceptions of humanity are similarly partial to the ingroup rather than biased against the outgroup.
Additionally, participants showed implicit bias on the basis of minimal group (D = .35) similar to the typical racial bias found in hundreds of thousands of online participants (Mproject implicit = 0.28, 95% CI [0.281, 0.283]; Xu et al., 2016), meaning that just-introduced, just-memorized faces engendered at least as much bias as the historically and visually salient category of race, even though race differences were present. This conceptually replicates findings using other measures, supporting recategorization as a powerful method to combat unconscious bias (e.g., Van Bavel & Cunningham, 2009, 2012).
Early processing was driven by race
The early ERP results match literature suggesting that race is quickly differentiated (see Ito & Bartholow, 2009) and extend literature confirming that race remains the driving factor of early perceptual processing even in the presence of an orthogonal minimal group category. Minimal group categorization has been shown to be reflected as early as 170 ms (Ratner & Amodio, 2013) in the absence of race differences, suggesting a potential disruptive effect of a culturally ingrained group category on minimal group categorization. Since minimal group membership does drive our behavioral effects, it must be processed eventually, but the exact timing remains unclear. The P3 was no longer modulated by race and we found a nonsignificant trend suggesting that minimal group might interact with race as early as 400 ms into processing. Since these effects are the result of exploratory, nonpreregistered analyses, more research is needed to conclusively pinpoint the first time point of modulation by group membership in cross-categorization designs.
Limitations
While we used symbolic racism as a measure of participants’ prejudice, there is a possibility that our sample was not racially biased to begin with. Symbolic racism does not have a known mean, but online samples from our laboratory report more bias than the students in this study. Our design also lacks an IAT condition during which participants would have to sort based on race rather than group membership. Although race was implicit in our face stimuli, only group membership was made salient. Therefore, we cannot directly compare participants’ racial bias to their minimal group bias. Previous research using response-window priming found that minimal group preference overrode racial bias for the ingroup, but not for the outgroup or for novel Black and White faces (Van Bavel & Cunningham, 2009). Given that our participants were never asked to categorize by race, we do not know whether they would have shown bias. However, we can still see minimal group bias and dehumanization despite the presence of orthogonal racial categorizations, including on measures not previously used in this paradigm.
Finally, our design did not include measures of discriminatory behavior, which would have allowed us to explore the connection of ecologically valid behaviors to these biases. It is one thing for an orthogonal categorization to erase widely seen biases on widely used measures. It is another for that sort of recategorization to have an effect on real-world prejudice. Multiple categorization research (e.g., Albarello & Rubini, 2012; Crisp, Turner, & Hewstone, 2010) suggests ways of crossing actual rather than minimal categories, and shows promise as a means of changing cognition around stigmatized social groups. This research reinforces this effort to overturn biases with subtle manipulations which can hopefully be expanded into realistic interventions.
Conclusion
This study was the first to look at early representations of multiply categorized targets and to measure infrahumanization of those targets. Our findings suggest that intergroup bias is not inherently tuned to concrete prejudices toward specific groups, but rather follows salient social distinctions, even in the presence of notable orthogonal differences. We showed that participants were biased toward a minimal outgroup, even infrahumanizing its members, despite the presence of racial outgroup members in both minimal groups, and that while racial group membership seems to be coded within the first 200 ms of neural processing, minimal group membership may be processed in the next 200 ms. Clearly, ingroup favoritism is alive and well, but it seems to be easily drawn even to the most arbitrary of groups. Invisible, novel categorizations can be as powerful as visually, historically important differences—at least on laboratory measures of implicit prejudice and infrahumanization—and in some cases seem able to override them. This suggests that category salience may be an effective means of combating prejudice.
Supplemental Material
Supplementary_Materials – Supplemental material for Effects of minimal grouping on implicit prejudice, infrahumanization, and neural processing despite orthogonal social categorizations
Supplemental material, Supplementary_Materials for Effects of minimal grouping on implicit prejudice, infrahumanization, and neural processing despite orthogonal social categorizations by Jeremy C. Simon and Jennifer N. Gutsell in Group Processes & Intergroup Relations
Footnotes
Acknowledgements
We would like to thank Jay Van Bavel and Stéphanie Demoulin for their materials and advice; Leslie Zebrowitz for her comments on a draft of the manuscript; John Ksander and Yanyi Jiang for technical support; and Omar Igeh, Mai Le, and Amanda Zhou for their assistance with data collection.
Funding
The authors disclosed receipt of the following financial support for the research, authorship, and/or publication of this article: This work was supported by a grant from the National Institutes of Health, USA (NIH Grant 5T32GM084907-09).
Supplemental Material
Supplemental material for this article is available online.
Notes
References
Supplementary Material
Please find the following supplemental material available below.
For Open Access articles published under a Creative Commons License, all supplemental material carries the same license as the article it is associated with.
For non-Open Access articles published, all supplemental material carries a non-exclusive license, and permission requests for re-use of supplemental material or any part of supplemental material shall be sent directly to the copyright owner as specified in the copyright notice associated with the article.