
Abstract
A new type of threaded-sleeve connection, which shares excellent characters including efficient fabrication and good bearing capacity, together with convenient construction or deconstruction, has been proposed in this article, and it can be utilized in mid-span space grid structures. To evaluate the performance of threaded-sleeve connection, both theoretical analysis and numerical simulations are conducted. Apart from material strength of the connector itself, the effect of other factors such as pitch and rounds of the thread, diameter of the ball of connector, and wall thickness of the joints and the threaded sleeve on the performance of threaded-sleeve connection is discussed as well. Then, the formulas for the bearing capacity and stiffness of threaded-sleeve connection are developed and proposed. In addition, the performance test of full-scale connector is carried out to verify these formulas. It is illustrated that the experimental results are in good agreement with numerical ones which verified the effectiveness of the theoretical calculation method. Thus, the formulas enable to determine the strength and stiffness of the proposed connectors.
Keywords
Introduction
In the past decades, a large number of spatial structures such as stadiums, convention centers, railway stations, airport terminals, and industrial buildings have been built in China, and space grid structure is one of the most popular structural systems for large span roofs. Space grid structures may be defined as those in which the repetitive application is adopted for prefabricated members and joints with standard shape and size forming three-dimensional skeletal frames usually to resist any applied loading (Lan, 1999).
Completed space grid structures may be possibly realized using a rather moderately small number of joint types involving several thousand members. The concept of such framing system is a highly economical one with respect to material, labor, and time savings. Individual units, members and joints, can be mass produced in the workshop, easily transported, and readily constructed on site, even by unskilled labor. Thus, this kind of space grid structures will be a candidate for portable and recyclable systems for large span structures. For mid-span spatial structures, its typical span is between 30 and 60 m, thus the single-layer cylindrical reticulated shell or latticed shell will be a good structural system for such buildings. The removable, reusable, and recyclable mid-span spatial structure named 3RMSS structure can easily be erected and dismantled. Tube members and connectors are two kinds of components classified in 3RMSS structures. Figure 1 presents the schematic drawings of the 3RMSS building systems, and if the connection, being a key component, becomes simple, then the entire 3RMSS structure will be effective to fabrication, construction, dismantle, and re-erection.

3RMSS system: (a) schematic diagram of structure and (b) a grid unit constituted with TSC.
In order to meet the requirements of architectural modeling and mechanical behavior, lots of types of connection forms, such as nodular, modular, and composite jointing systems, have been used in spatial structures (Allen, 1982; Lan, 1999), in which the nodular system is the most popular one.
The basic components of a nodular system are composed of nodes and members. Based on the components of the joints and connection mechanisms, the nodular system can be categorized into ball jointing systems, socket jointing systems, plate jointing systems, slot jointing systems, shell jointing system, and other nodular systems (Hanif, 1988). The ball jointing system consists of a ball, connectors, and members. The MERO jointing system is one of the oldest proprietary ball jointing systems which developed in Germany in 1940 (Allen, 1982). For the jointing only connected by a high tensile bolt, the connector has almost no ability to resist bending, which are restricted to be used in double-layer or multi-layer space grid structures (Alamdari et al., 2014), but with an exception of the semi-rigid joint system (Fan et al., 2012). As for connection in single-layer curved structures, the joints between members must resist bending.
Nowadays, ball joint, which includes welded spherical joint and screwed bolt spherical joint, is still the most popularly used connection for space grid structures. Zhang et al. (2005) and Fan et al. (2011) summarized the characteristic of such connections and illustrated that the welded spherical joint shares the advantage of simplicity as joints and easy fabrication. However, its on-site welding construction makes the erection inconvenient and the labor for construction would be of technical high level as well. The screwed bolt spherical joint is constructed easily. However, it involves too many components and parts, the shortage of which is the vulnerability to be “fake tightened-up” (Ding, 2004; Wang et al., 2013b). Although Wang (2013b) raised a visual bolt-ball joint to avoid such side effect, this kind of joint is still short of ability to resist the bending moments (Ibramhim and Pettit, 2005; Yee and Melchers, 1986).
In order to satisfy the demands of the 3RMSS structure with resistance to bending moments, it is of great significance to develop a new type of connector which is prefabricated, constructed, and deconstructed easily as well as to realize the efficiently standardized products for the joints. A new type of threaded-sleeve connection called TSC has been invented and presented in this article. The connector demonstrates excellent characters such as simple fabrication, excellent bearing capacity, and convenience in construction and deconstruction. The TSC, as shown in Figure 2, consists of a ball welded to a tubular section with threaded connection at the other end realizes the space connection for the grid structures. The length of the threaded part of Part 1 is equal to that of the sleeve and twice of Part 2. After assembling, the sleeve is equally allocated to Part 1 and Part 2. Because of its special composition, TSC is easy to check the erection quality and enables to avoid the “fake tightened-up” phenomenon. The previous research illustrated that TSC demonstrates good bending performance, which demonstrated the possibility of application in the 3RMSS structure (Li et al., 2014).
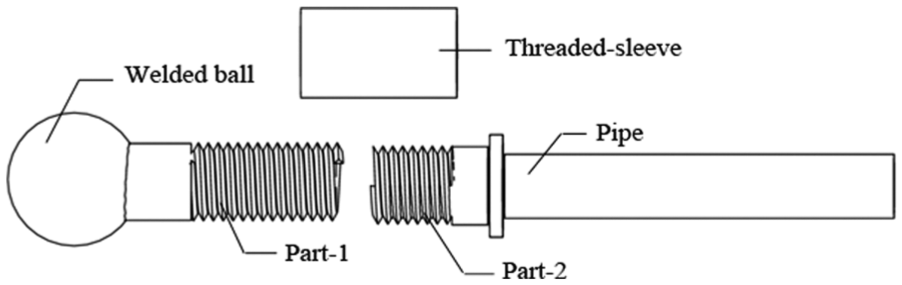
Schematic of TSC.
A similar threaded joint was studied through an assembling test and a static loading test by Wang (2013a), which proves that space grid structures connected by threaded joints can be easily and quickly constructed and shares fine stability and strong bearing capacity as well. Such excellent characteristics provide good theoretical guide for the upcoming research of TSC.
To better learn the tension and compression performance of TSC for multi-directional joint, the theoretical analysis and experimental test were conducted. The effect of other factors such as pitch and rounds of the thread, diameter of ball of connector, and wall thickness of joints and threaded sleeve on the performance of TSC is discussed as well. Then, the formulas for the bearing capacity and stiffness of TSC are developed and proposed; meanwhile, the performance test of full-scale connector is conducted to verify its reasonableness.
Theoretical analysis of TSC connector
Derivation of theoretical formula for axial strength
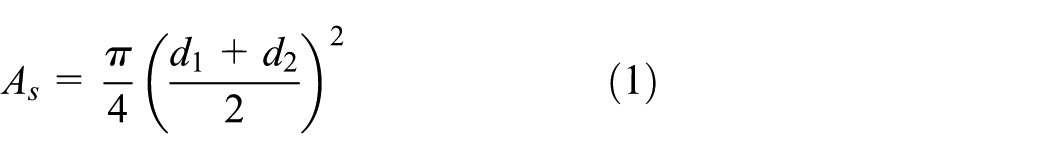
The mechanical performance of TSC involves tension, compression, and bending. The strength of the connector is evaluated by an approximate mathematical calculation. Normally, the bearing area or contact area has a great effect on the strength of the connector. The failure area will be the thread root section (section 1-1 shown in Figure 3), and its effective working area, denoted by As, can be described by equation (1) (Duan et al., 2008)
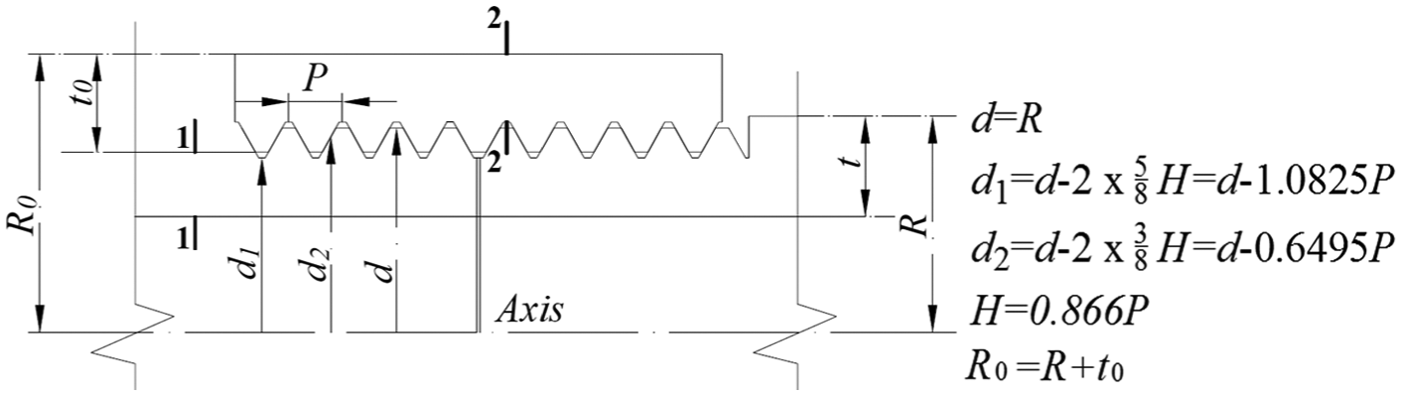
Schematic of screw parameters.
In equation (1), d1 is the less diameter of the thread, and d2 is the larger diameter.
The tensile/compressive stress of the effective section is described as
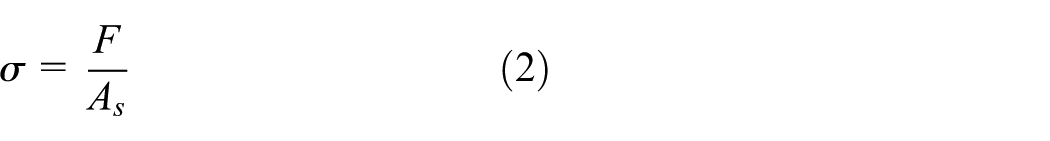
where F represents the failure axial force, and the thread is subjected to shear and axial forces. Since the sleeve and the joint are produced of the same material, the strength capacity of the internal threads is the same as the external ones. Herein consider the strength of just the external thread (Duan et al., 2008). For the effect of small helix angle on the thread is minor, the thread can be extended along the diameter d. The bearing mechanics of the thread is quite similar as a cantilever girder with width

where b is the thickness of the thread teeth and n is the number of thread rounds.
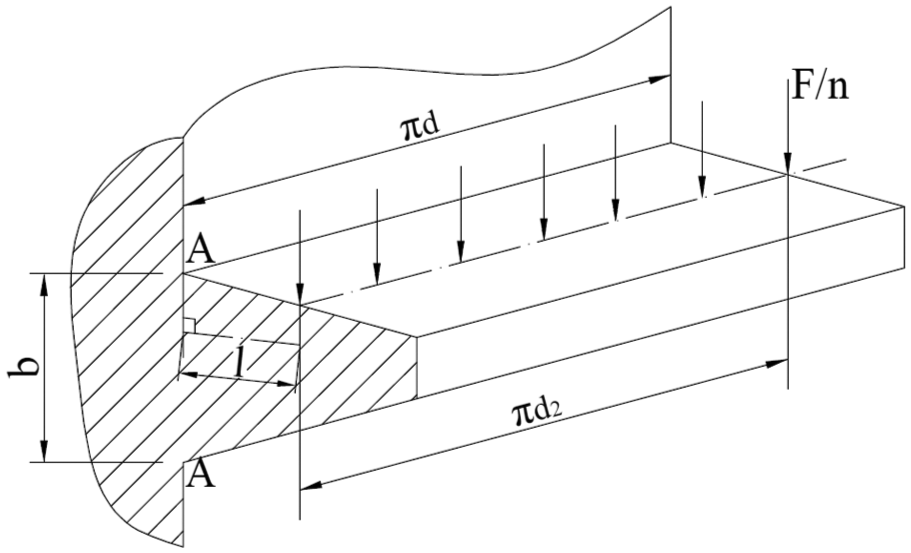
Mechanical model of thread teeth.
Meanwhile, the bending stress of the section A-A is
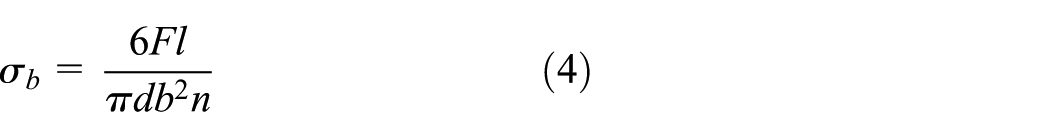
in which l is the length of bending.
Once the connector of TSC is loaded, there exist four possible failure scenarios of the connector: (1) extended part of the threads, (2) shear failure of the thread teeth, (3) bending failure of the thread teeth, and (4) failure of the threaded sleeve. Thus, the axial capacity of the connector should be the minimum one for such conditions. The axial capacity calculation functions can be concluded as follows.
Failure of extended part of the threads
According to equation (2), the tensile/compressive capacity for failure of extended part of the threads can be illustrated as

where R and t are the radius and thickness of the connector, respectively, and
Shear failure of the thread teeth
It is shown from equation (3) that the bearing capacity of the connector can be described as

In equation (6), τ represents the allowable shear stress of the material.
Bending failure of the thread teeth
The capacity of bending failure can be deduced from equation (4), and it is

in which σb is the allowable bending stress of the material. Comparison between F2 and F3 shows that the apparent inequality holds as F2 < F3, which means that the thread shear failure occurs later than bending failure.
Failure of the threaded sleeve
The failure of the threaded sleeve occurs in Part 1 or Part 2. Such area bears axial loads and the sleeve lacks restraint. For threaded sleeve failure condition, the capacity can be illustrated as
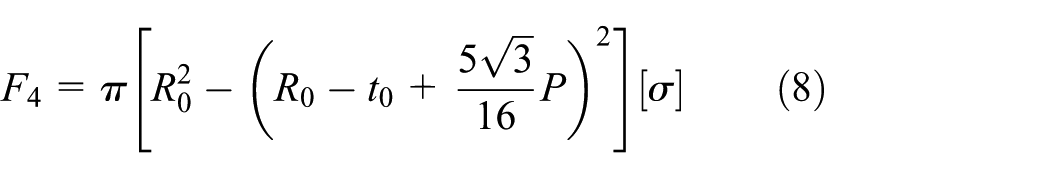
In equation (8), R0 and t0 represent the radius and wall thickness of the sleeve, respectively. Then, let
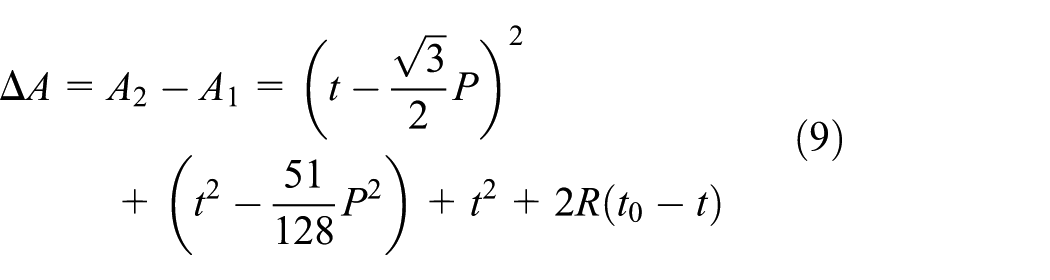
To make sure of thread to be processed smoothly, t0 is not smaller than t, and t is larger than P, thus
According to the above discussion, it is concluded that there are two kinds of failure modes that are likely to appear, that is, damage of the extended part or thread teeth on the threads. Thereafter, the initial bearing capacity formula for TSC can be summarized as

Stiffness of threaded connector
Aki Yamamoto ([1970] 1984) put forward an equivalent elastic stiffness formula for threaded connection
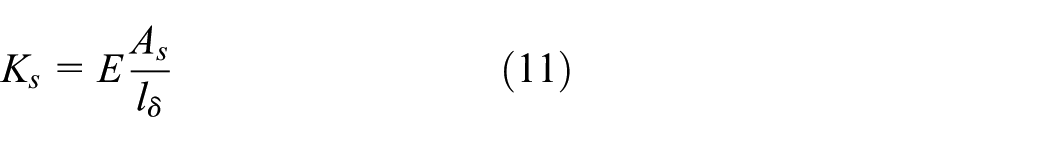
where lδ is the equivalent length for the elastic deformation of the threaded connection and As is the effective area of the threaded connection.
Since the axial mechanism TSC connector is quite similar to the connection mentioned by Yamamoto, the threaded connector of TSC can be treated as six-series spring, shown in Figure 5. Then, the equivalent stiffness formula for the threaded connector will be described as


in which l5 = l6, k5 = k6 = ks.

Schematic of spring series of TSC.
Thus, the displacement of the connection tip will be described as

Finite-element simulation for rigidity and strength
Finite-element models
According to the theoretical strength and stiffness formula for TSC connector, shown in equations (10) and (12), the key parameters relative to the mechanical performance involve diameter, thickness, sleeve, thread pitch, and thread rounds. To validate the theoretical calculation method, finite-element (FE) simulations are carried out in this section for the performance of TSC. Since the body of the connector is symmetrical, a 1/2 part three-dimensional analytical model is built to simplify the model so as to reduce the quantity of computing units. The models are created by taking a two-dimensional (2D) cut along a radial plane through the wall of the sleeve as illustrated in Figure 6(a). The configuration for the threads is created according to GB/T 192-2003 (2003), and it is simplified as horizontal zigzags (Liu and Bu, 2009; Tanaka et al., 1981).
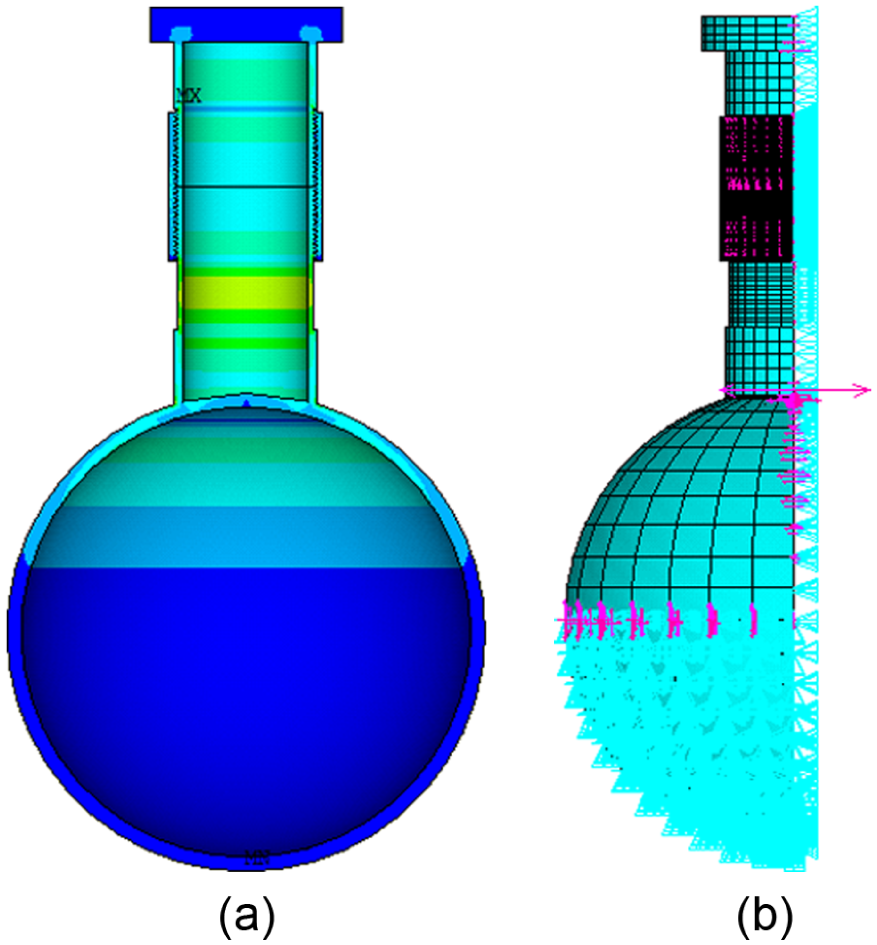
FE model and boundary conditions: (a) axisymmetric 3D solid FE model used for analyzing tension performance and (b) elements and boundary conditions.
The models are meshed with hexahedral solid elements (SOLID185 elements as designed in ANSYS FE program) and contact elements (TARGE170 and CONTA174) to simulate the contact pairs between threads. All FE analyses are performed with ANSYS using the nonlinear geometry option.
In order to simulate the features of TSC, nodes of half ball are fixed and the whole connection is axi-symmetrically fixed in the ring direction, as seen in Figure 6(b).
For grid structures with span of 30–60 m, pipes with wall thickness of 3–6.5 mm and external diameter of 40–80 mm are most commonly used. In this article, joints with external diameter of 60 mm are analyzed. The analysis parameters of the TSC are shown in Figure 7, including wall thickness of joints and sleeve and pitch and rounds of threads.
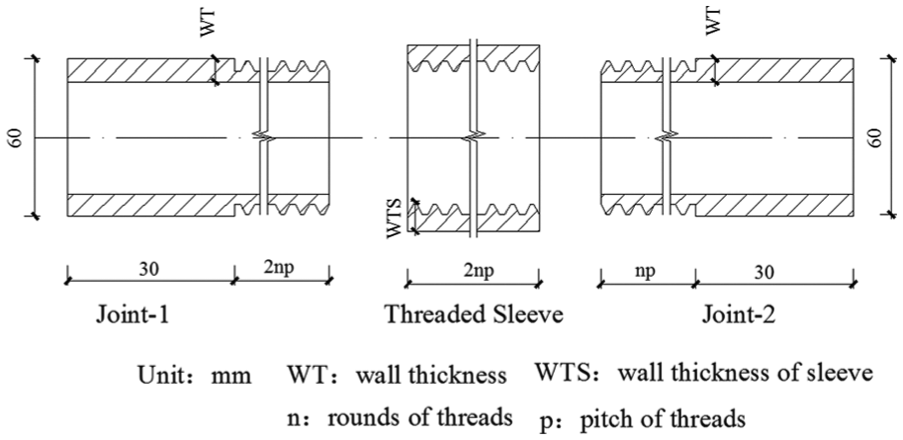
Analysis parameters of the TSC.
The material is assumed to be Q345 (GB/T 700-2006, 2006), with elastic modulus of 2.06 × 10⁵ MPa, Poisson’s ratio of 0.3, and yield strength of 345 MPa. The material is anisotropic bilinear hardening material, with strain-hardening modulus of 0.02 and steel–steel coefficient of static friction of 0.12 (Chen, 2001; Li, 1996).
Numerical example
One connection is selected as a numerical example to show its mechanical characteristics, of which external diameter is 60 mm, wall thickness of the joints and the sleeve is 4 mm, pitch of the threads is 2 mm, and rounds of threads are 15.
Figure 8 shows the von-Mises stress nephogram of the numerical example under tensile/compressive force of 100 kN.

Stress nephogram of numerical model: (a) stress of the model under tension, (b) stress of Joint 1 under tension, (c) stress of Joint 2 under tension, (d) stress of sleeve under tension, (e) stress of the model under compression, (f) stress of Joint 1 under compression, (g) stress of Joint 2 under compression, and (h) stress of sleeve under compression.
As illustrated in Figure 8(a) and (e), the high stress region of the connection under axial force lies in the threaded part. Figure 8(b) shows the stress of Joint 1 under tensile force. The maximum stress situates at the threads which are not engaged with the sleeve. The stress of the first 4 rounds of threads is obviously larger than any other threads (left to right). It indicates that the first 4 rounds of threads bear more tensile force. Figure 8(c) presents the stress of Joint 2 under tensile force. The last 4 rounds of threads bear more tensile force (right to left). Figure 8(d) shows the stress of the sleeve, of which the threads located at the middle and both ends are large. Except for the stress concentration, the maximum stress lies in the threads which are not engaged with the sleeve. Figure 8(e) to (h) illustrates the stress of the numerical model under compressive force. The distribution of the stress regularities is similar to the model under tension except the sleeve. Under compression, the stress of the sleeve is smaller than that under tension. This is because under compression, Joint 1 and Joint 2 are in contact and the load is transferred from Joint 2 to Joint 1 directly without conveying through the sleeve.
In order to show the property of TSC under axial force clearly, the load–displacement curves of the connection tip were obtained, shown in Figure 9(a). The parameters of the curves are defined in Figure 9(b), where Fi is the initial capacity (elastic stage), Fu is the ultimate capacity, di is the initial displacement of the connection tip, and dr is the arbitrary displacement. The initial stiffness is defined by Rki = Fi/di. As shown in Figure 9(a), the Fi of the model under tensile/compressive force is 100 kN m/rad, θi is about 0.21 mm (tension) or 0.24 mm (compression), and Rki is 477 kN/mm (tension) or 414 kN/mm (compression).

Load–displacement curves of the numerical example. (a) load-displacement curves of the numerical model and (b) parameters definition of the curve.
Parameter analysis
In order to catch the influence of structural parameters on the bearing capacity of the TSC under axial force and determine the structure of TSC, eight groups of models are analyzed, shown in Table 1. The parameters include wall thickness of the joints (WT), wall thickness of the sleeve (SWT), rounds of the threads (n), and pitch of the threads (P). The influence curves are shown in Figures 10 and 11. Also, both simulation results and formula results are compared in these figures to verify the formulas.
Analysis case of TSC.

WT: wall thickness of the joints; SWT: wall thickness of the sleeve.

Influence of structural parameters under tensile force: (a) influence of wall thickness of joints on capacity, (b) influence of wall thickness of joints on displacement, (c) influence of wall thickness of sleeve on capacity, (d) influence of wall thickness of sleeve on displacement, (e) influence of connection rounds on capacity, (f) influence of connection rounds on displacement, (g) influence of pitch on capacity, and (h) influence of pitch on displacement.

Influence of structural parameters under compressive force: (a) influence of wall thickness of joints on capacity, (b) influence of wall thickness of joints on displacement, (c) influence of wall thickness of sleeve on capacity, (d) influence of wall thickness of sleeve on displacement, (e) influence of connection rounds on capacity, (f) influence of connection rounds on displacement, (g) influence of pitch on capacity, and (h) influence of pitch on displacement.
Figure 10 shows the influence of the structure parameters under tension. Case 1 studies the influence of wall thickness of the joints on tension properties. In this case, three groups of curves are obtained with different kinds of pitches (2, 2.5, and 3 mm). The other parameters in this case are as follows: wall thickness of the sleeve is 5 mm, the thread rounds are 20, and the wall thickness of the joints ranges from 3.5 to 6 mm. As illustrated in Figure 10(a) and (b), the tensile bearing capacity increases with increasing of wall thickness of the joints. The simulation and formula results agree well with relative error ranging from 0.2% to 11.8%.
Case 2 discusses the influence of wall thickness of the sleeve on tension properties. In this case, two groups of curves are obtained with different kinds of wall thickness of the joints and the pitches. The wall thickness of the sleeve ranges from 3.5 to 6.5 mm. As illustrated in Figure 10(c) and (d), the wall thickness of the sleeve has almost no effect on the capacity. The relative errors of capacity are less than 2.4%, and the maximum relative error of displacement is 8.3%.
Case 3 illustrates the influence of thread rounds on tension properties. The thread rounds range from 10 to 20. As illustrated in Figure 10(e) and (f), the tensile capacity increases with the thread rounds. When the rounds reach 15, the bearing capacity keeps stable and reaches the maximum value, and the relative errors drop to below 8%. That means n should be not less than 15 to ensure the tensile capacity of TSC.
Case 4 gives the influence of the thread pitch on tension properties. As illustrated in Figure 10(e) and (f), the tensile bearing capacity of the connection increases first and then decreases with the increasing of pitch. When the pitch is about 1/2 of the wall thickness of joints (3 mm), the results agree well, and the relative errors drop to below 10%.
Figure 11 describes the influence of the structure parameters under compression. Case 5 studies the influence of wall thickness of the joints on compression properties. As illustrated in Figure 11(a) and (b), the compressive bearing capacity increases with increasing of wall thickness of the joints. The simulation and formula results agree well with relative error ranging from 0.4% to 13.3%.
Case 6 presents the influence of wall thickness of the sleeve on compression properties. As shown in Figure 11(c) and (d), the wall thickness of the sleeve also has almost no effect on the capacity. The relative errors of capacity are less than 2.2%, and the maximum relative error of displacement is 8.1%.
Case 7 studies the influence of thread rounds on compression properties, the variation of threads of which is similar to that in tension. When the rounds reach 10, the bearing capacity keeps stable and reaches the maximum value.
Case 8 studies the influence of thread pitch on compression properties, which is also similar to that under tension.
Simplified theoretical calculation formula for TSC
Based on a series of simulations, conclusions are drawn that the axial bearing capacity of TSC reaches the maximum if the number of threads reaches 15 and the pitch of threads is half of the wall thickness of joints. Meanwhile, the simulation results and formula results are in good agreement. According to the theoretical and simulation analysis, the simplified strength calculation formula for TSC is concluded as follows
The values of the simplified formula are as follows, that is, t≈1/2P, n = 15, and t0 = t. Meanwhile, the failure pattern of the threaded connection is the failure of the extended part of the threads.
Experiments and verification of proposed formula for performance
In order to illustrate the effectiveness and applicability of the simplified strength calculation formula and the analytical model of the TSC, full-scale tension and compression tests are compared with the simplified formulas and finite-element model (FEM) simulations.
Specimens for experiment
According to the simulation of the numerical example, it is shown that the stress of the ball of TSC is much less than that of the threaded part. It implies that the threaded part is the key part of TSC. Thus, in experiments, the influence of the ball was ignored. The connector specimens for experiment were fabricated based on Figure 7, the material of which is Q235B (GB/T 700-2006, 2006), external diameter is 20 mm, wall thickness of joints is 4 mm, pitch is 2 mm, and thread rounds are 15.
Figure 12 shows the details in size of tested specimens, which consisted of four parts: mandrel, Joint 1, threaded sleeve, and Joint 2. The length of specimens is 170 mm in total. The mandrels are used to avoid the squeezing flat of the pipe under loading.

Dimensions and photo of specimen: (a) dimensions of tested specimen and (b) photos of tested specimen.
Experimental setup and tested cases
The equipment for the testing connection specimens is a Z100 universal testing machine made by Zwick/Roell Company as shown in Figure 13. Axial load was measured by X-force, an in-line load cell attached to the end of the hydraulic ram, which was in turn attached to the specimen through a load beam. Axial displacement of the specimens under tensile/compressive loading was measured by a high-precision extensometer to make sure of the accuracy of the experimental data. The tensile/compressive load was applied by a displacement controlled beam. The displacement was applied in a velocity of 3 mm/min (the equivalent strain rate is 0.0003/s). To avoid the buckling of the compression specimens, restraint devices were used during loading as shown in Figure 13(c).

Test equipment: (a) loading equipment, (b) tensile photo, and (c) compressive photo.
Verification test
FE simulation was performed to compare with the test results using the measured material characteristics curves. The measured average yield strength of materials is 245 MPa, with average elastic modulus of 198 GPa.
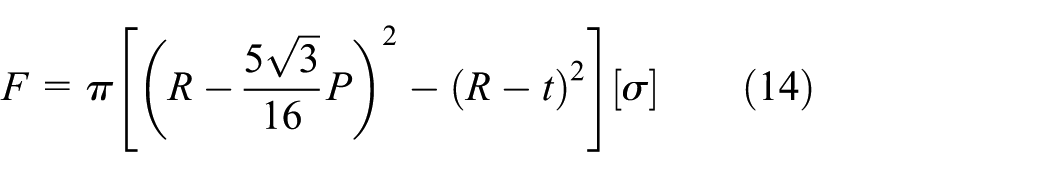
The load versus displacement curves for specimens, respectively, under axial tension or compression and for FE simulation models are presented in Figure 14. The FEM results closely follow the experimental results. The tension specimens respond in a linear elastic manner up to an average limit load of 30.5 kN. The initial elastic capacity of compression specimens is about 32 kN. The result from the simplified strength calculation formula is 33.5 kN (equation (14)), which is close to the test results.
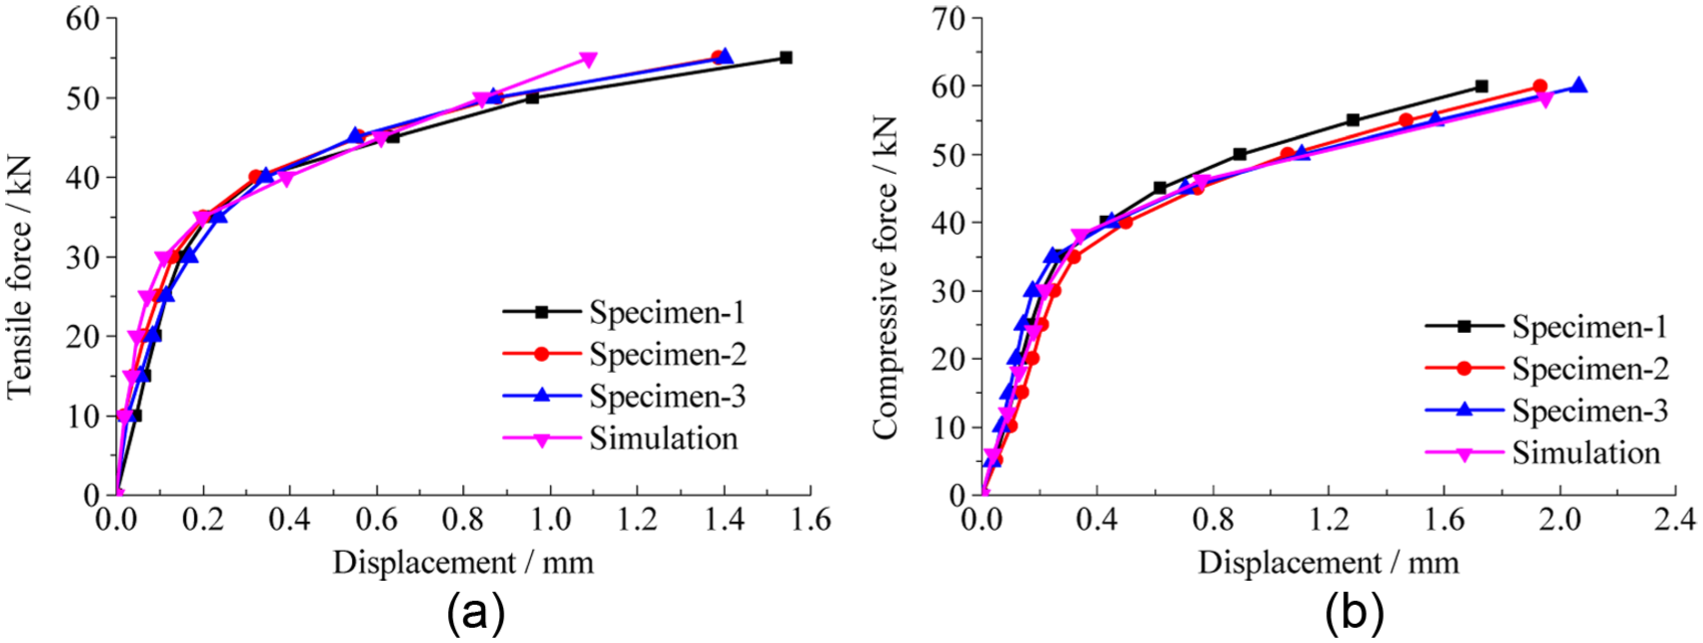
Load versus displacement curves for specimens, simulation model.
Figure 15 compares the theoretical failure pattern and the factual failure pattern. As shown in the FEM of Figure 15(a) and (c), the maximum stress area lies in the extended part of Joint 1 under axial load. Figure 15(b) and (d) shows the factual damage area of the connection (except the stress concentration areas), which also lies in the extended part. In other words, there is a favorable agreement between analytical and test results.
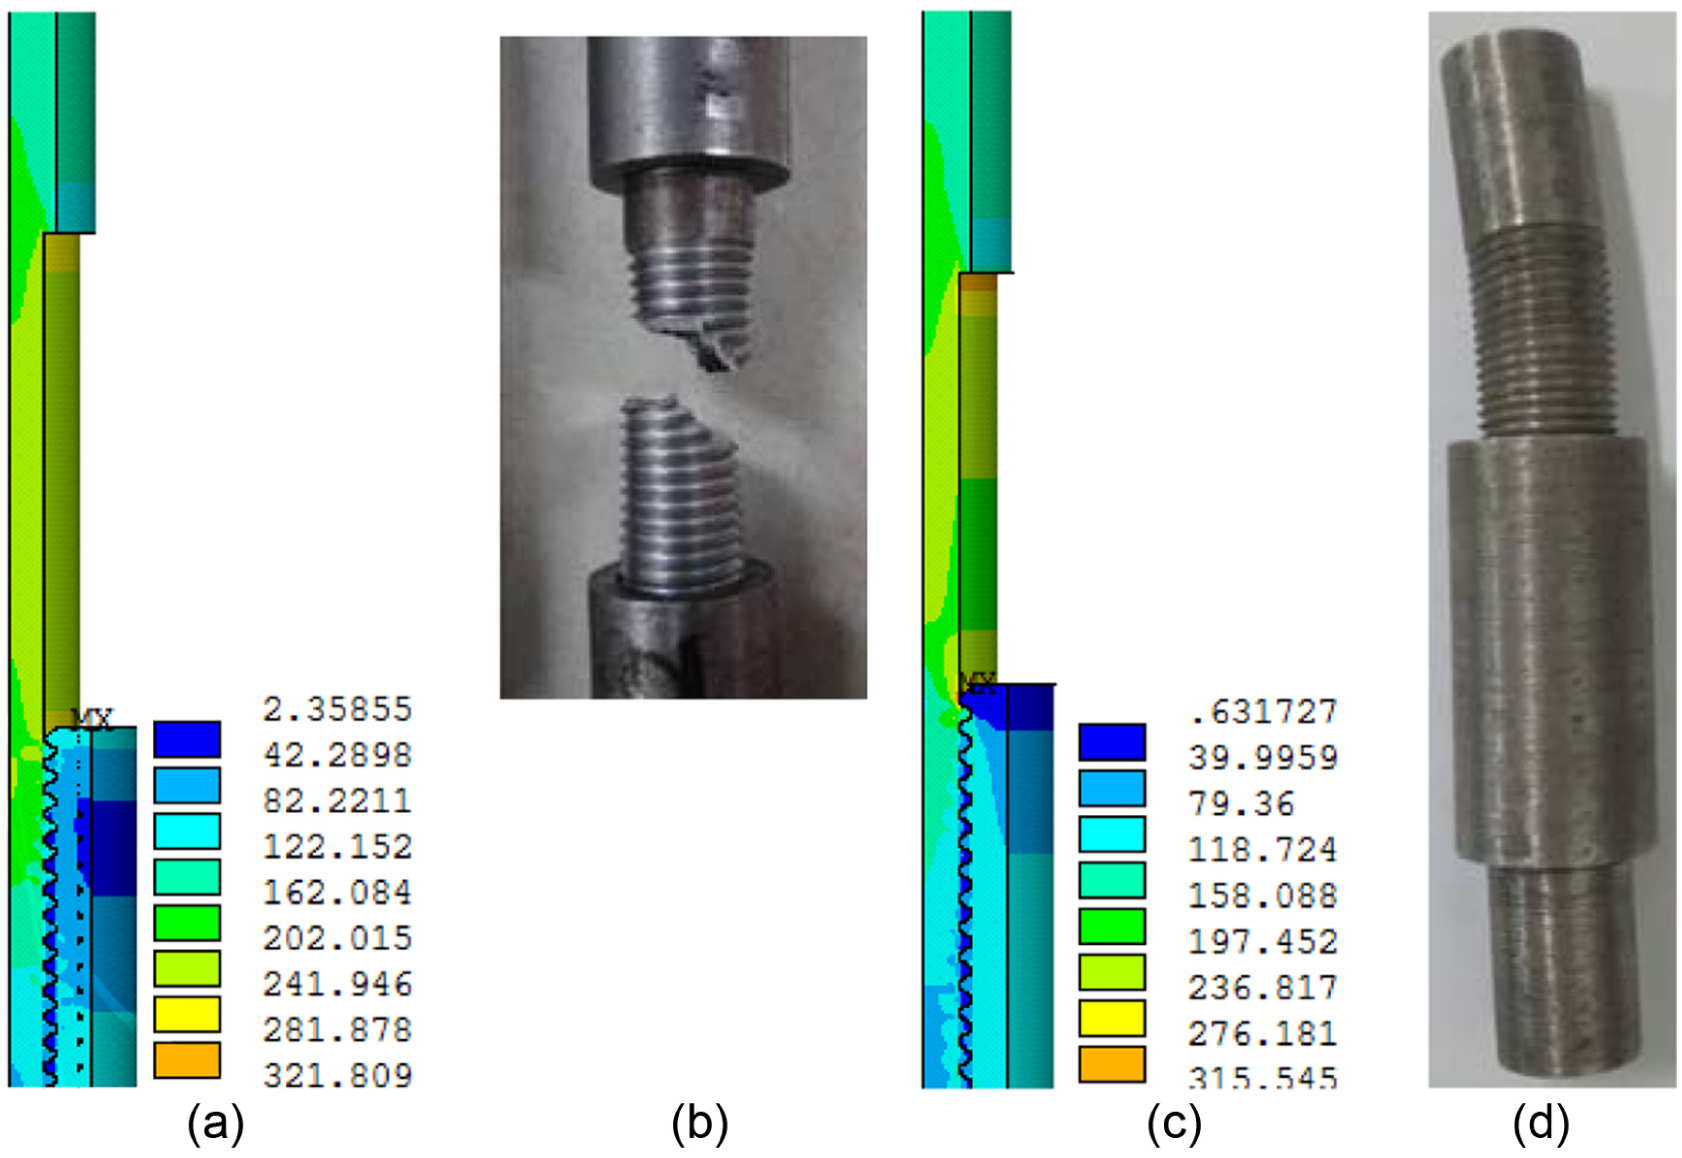
Comparison of failure pattern: (a) stress nephogram of model under tension, (b) failure pattern of axial tension specimen, (c) stress nephogram of model under compression, and (d) failure pattern of axial compression specimen.
Discussion of the test
The results of the full-scale tension or compression tests are presented and compared with the simulation results and simplified strength calculation formula results. It is shown that the experimental results are in good agreement with the theoretical model, which illustrates the effectiveness and the applicability of analytical model and the simplified strength calculation formula.
Conclusion
The study focused on the strength performance of TSC. Theoretical analysis and FE simulation are presented to show the relationship between the bearing capacity and the parameters such as wall thickness of the joints, pitch, and rounds of the threads. And the simplified strength calculation formula is developed. Meanwhile, full-scale tests were performed to verify the reasonability of the theoretical formula and FEMs. The analysis results are as follows:
Through parametric analysis, it is found that the axial bearing capacity of TSC increases with the increasing of wall thickness of the joints and thread rounds, increases first and then decreases with the increasing of pitch. The wall thickness of the sleeve has little effect on the capacity of TSC. The strength of TSC reaches the maximum if the thread rounds are 15 and the pitch of the threads is half of the wall thickness of the joints.
The experimental results are in good agreement with the theoretical formula and the FEM with maximum error of 9.8%, which verifies the effectiveness and the applicability of the analytical model. FEM and test results indicate that the failure of the connection is triggered at the extended threads.
Footnotes
Acknowledgements
The authors express their appreciations to Professor Ian G. Buckle in University of Nevada at Reno and Professor Shiro Kato in Toyohashi University of Technology for their good advice and help to this paper.
Declaration of Conflicting Interests
The author(s) declared no potential conflicts of interest with respect to the research, authorship, and/or publication of this article.
Funding
The author(s) disclosed receipt of the following financial support for the research, authorship, and/or publication of this article: This paper is principally funded by the National Natural Science Foundation of China (51578019), Beijing Natural Science Foundation (8152006), and Key Laboratory of Urban Security and Disaster Engineering of MOE (USDE201401).