
Abstract
This article presents a new method for structure assessment based on weigh-in-motion data and simulation analysis. The focus is particularly on the simply supported hollow slab bridges and extra-heavy truck (gross truck weight ≥ 80 t) from the right tail of weigh-in-motion data. The dynamic models of truck types are refined, and the coupling relationship between truck and multi-girder bridge are determined. A self-developed bridge–truck analysis system is established by separate iteration and is used in the simulation analysis of extra-heavy truck load cases. The truck load effect is first analyzed by a comparison with code values. The load rating index is introduced for the structure safety assessment; meanwhile, the key parameters, for example, the dynamic amplification factor, are optimized. The results show that the maximum load effect level of extra-heavy truck is obviously higher than the design vehicle load effect, and the average level is approximate to or a little higher than the latter. The displacements due to extra-heavy truck are seriously transfinite, while the structural stiffness can meet the requirement of serviceability. Both the proposed method and Chinese code method are used to assess the structure safety of hollow slab bridges. The maximum value of load rating index ranges from 0.69 to 0.78 and the average value is 0.53–0.67. The hollow slab bridges have not yet reached the ultimate limit state and have a safety redundancy under the extra-heavy truck load. The loading indices of MOCAT are close to the average values of load index of this study, but lower than those of the maximum values. Some extreme loading conditions may be thoughtless in the proposed safety assessment method by MOCAT.
Keywords
Introduction
Heavy traffic stimulated by the transport cost and efficiency is more and more inevitable in many regions of China, which will definitely magnify the deviation between design vehicle load and actual traffic load. Thus, the operational safety of bridge structures can hardly satisfy the requirement from the design level. In fact, the long-term heavy traffic load is indeed pernicious to bridge structure and it can even lead to the collapse accident (Sasaki et al., 2010; Xu et al., 2016). Therefore, adequate safety assessments on bridge structures are crucial to eliminate catastrophic failures and serviceability problems for providing a safe driving environment to the motorists.
Currently, many assessment methods have been specified by national codes (e.g. American Association of State Highway and Transportation Officials (AASHTO), 2011; Canadian Highway Bridge Design Code (CHBDC; CSA International, 2006)) and are widely used to assess the present performance of bridges. In China, Ministry of Communications and Transportation (MOCAT, 2011) also published the technical manual used for bridge assessment, in which the adopted traffic load and partial factors are exactly same as those in the design code. The traffic load models given in design code are intentionally made to be valid for the design of a wide range of bridge types and loading conditions. In consideration of the deviation of design traffic load and actual traffic load, the assessment method specified by MOCAT (2011) may need an enhancement to understand the present structural performance more accurately.
Many researchers proposed to use structural health monitoring (SHM) system to assess the bridge structure via serviceability and safety indices (Frangopol et al., 2008a, 2008b; Liu et al., 2009; Orcesi and Frangopol, 2013; Strauss et al., 2008; Sung et al., 2016). It is quite robust and reliable; however, so far, only a few important or large-span bridges have installed the SHM system due to the high cost. The wide application of SHM on medium- and small-span bridges is still under investigation. Meanwhile, some other researchers carried out the structure assessment on the basis of field test (Bell et al., 2013; Brownjohn et al., 2003; Deng et al., 2016; Movaghati and Abdelnaby, 2016; Zhang et al., 2011). Besides, methods including reliability analysis (Liu et al., 2016; O’Connor and Enevoldsen, 2007; Val and Melchers, 1997; Xie et al., 2015), variable weight synthesis (Liu, 2016), and finite element crack analysis (Wang et al., 2013) have also been used in the structure assessment.
In recent years, advances in weigh-in-motion (WIM) technology have led to the increasing availability of accurate and unbiased site-specific traffic records (Haugen et al., 2016; Ren et al., 2014; Yu et al., 2016). These records have been successfully applied in the derivation of site-specific loading models (Getachew and Obrien, 2007; O’Connor and O’Brien, 2015; Ruan et al., 2016; Schmidt et al., 2016; Sivakumar and Ibrahim, 2007), calculation of load effects (Enright and O’Brien, 2013; O’Brien et al., 2011a, 2011b), and also the truck weight regulation (Jacob and Cottineau, 2016). Meanwhile, the past decade has also witnessed remarkable progress in structural computational simulation (Qureshi and Warnitchai, 2016; Wang et al., 2016). Hence, it can be feasible and economical to investigate the structure safety assessment based on WIM data and simulation analysis. One key to this method is the accurate simulation of the actual condition of bridge structure (Roschke and Pruski, 2000). Many researchers, including the authors of this article, have conducted a series of researches in this field (Brownjohn et al., 2003; Han et al., 2011; Li, 2010; Movaghati and Abdelnaby, 2016). Another key is the establishment of simulation analysis system. Tremendous studies have also focused on this field (Deng and Cai, 2010; Nassif et al., 2003; Xiang et al., 2007). Nevertheless, further optimization is still in demand, such as the coupling relationship between vehicle and multi-girder bridge and the refining of dynamic vehicle types.
This article is organized as follows. Seven typical simply supported hollow slab bridges are first selected as the research objects according to Chinese bridge construction condition. In all, 549 extra-heavy truck (EHT) scenarios are extracted from the right tail of WIM data collected in Shaoxing segment of G104 highway. The dynamic simulation analysis of these scenarios is conducted in the following by a self-developed bridge dynamic analysis system (BDANS). Then, the truck load effects are analyzed and compared with the code value. Finally, the load rating index of carrying capacity is introduced to assess the safety of hollow slab bridges, and the value of dynamic amplification factor (DAF) is optimized to improve the accuracy of assessment result.
Traffic monitoring
The traffic monitoring site is located at the Zhong-jiawan viaduct of Shaoxing City, which is a segment of the G104 highway in China. The information of the viaduct and monitoring equipment was introduced by Han et al. (2016).
The time precision of WIM data used in this study is 0.1 s. A precision of 0.01 s or higher is applicable when recording vehicle data, nevertheless a lower precision of 0.1 s is still acceptable (Enright and O’Brien, 2013). The time length of the processed traffic data records in this study is 10 months from April 2013 to January 2014, approximately 300 days covering different seasons, working days, and weekends. Totally, 871,719 sets of vehicle load data were collected.
To investigate the structure safety under heavy traffic, only a portion of trucks from the right tail, namely, EHT, will be considered. Therefore, a reasonable gross truck weight truncating point is needed. Some researchers have proposed to take the top 30% or top
Figure 1 shows the gross weight distribution of all monitored vehicle and the truncation process. Totally, 549 EHTs are extracted. It can be found that the gross vehicle weight of tailed EHT is bimodal. The first peak is around 93 t and another is 130 t. The detailed characteristics of these EHTs have been analyzed (Han et al., 2016) and will not be repeated here due to the space limitation.

Histograms of gross vehicle weight.
Load cases of EHT
For the vehicle load effect analysis of long-span bridges, random traffic flow is the optimal choice for simulating the vehicle load. Nevertheless, for small-span bridges, EHT load case from monitored traffic flow can also meet the requirement of accuracy. It should be noted that the heavy traffic means traffic with heavy trucks involved in this study. Specifically, the EHT load case will be used to quantify the effect of heavy traffic on bridge structure. The EHT load case is a group of vehicles moving along the bridge, in which at least one EHT involved. The extraction of load case is based on the information of arrival time, vehicle speed, and span length. The acceleration, deceleration, and lane changing will not be considered because the span length is pretty small.
Totally, 549 EHT load cases were extracted from the recorded database and classified into two types as follows. Case I: only one EHT is included and 542 cases can be classified into this type, occupying 98.7% of the gross. Case II: one EHT and one common vehicle are included simultaneously.
Typical bridges and analytical model
The simply supported hollow slab bridge amounts for a high percentage of Chinese existing bridges. For example, in Hebei province, this bridge type occupies more than 70% of the total amounts (Hebei Provincial Communications Planning and Design Institute (HPCPDI), 2009). The span length of simply supported hollow slab bridge is usually less than 20 m. The design ratio of live load effect to dead load effect is higher than other bridge types. As a result, its safety operation is more sensitive to the evolution of traffic load. In this study, the simply supported hollow slab bridges will be taken as the research object.
Simply supported hollow slab bridges
In China, the design and construction of hollow slab bridges are mainly based on the standard drawing for bridge superstructure. In this study, seven hollow slab bridges were selected from the standard drawing. The width of subgrade is 24.5 m. All the structures are separate bridge with left and right parts. The key geometrical parameters of the seven bridges are given in Table 1, where RC means the reinforced concrete structure and PC means the prestressed concrete structure. Correspondingly, the RC-6m denotes the referenced concrete slab bridge with a span length of 6 m. Figure 2 shows the arrangement of cross section of RC-10m and PC-20m.
Key parameters of hollow slab bridges.
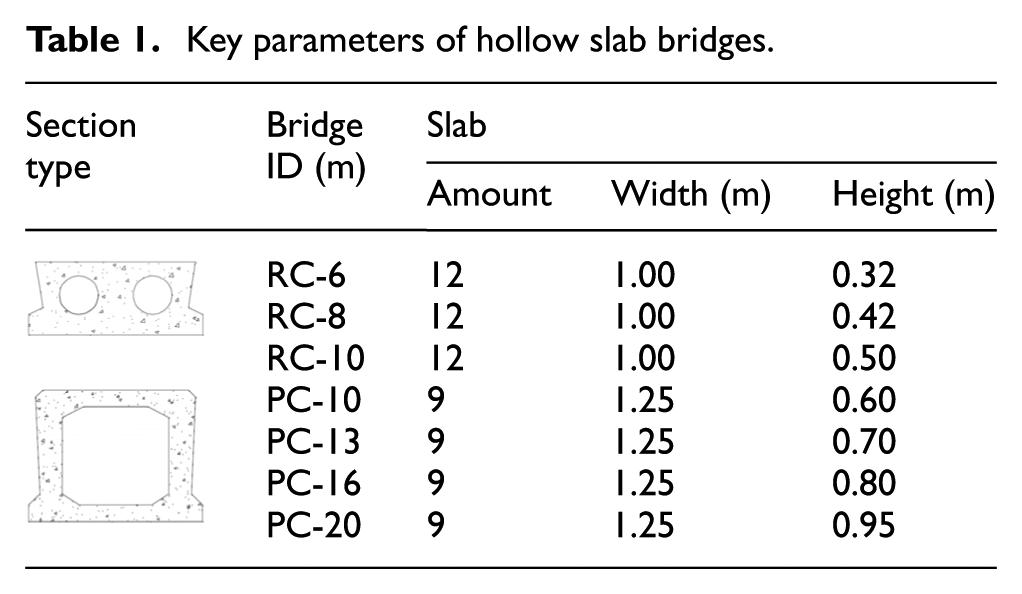

The arrangement of cross section: (a) RC-10m and (b) PC-10m.
It should be noted that this study will focus on the majority part of slab bridges. Therefore, the defects on a specific bridge (e.g. cracking of connections) will not be considered in detail. The selected bridges are assumed to have a good structural integrity.
Analytical model and updating
As mentioned before, the model accuracy is important for the structure analysis of multi-girder slab bridge, especially the accuracy of lateral distribution of internal force. The grillage models were preliminarily established by ANSYS 12.0 as shown in Figure 3(a). The selected element type is beam4. The connection of hinge joint was simulated by releasing rotational degrees of freedom (DOFs) and coupling the translational DOFs.
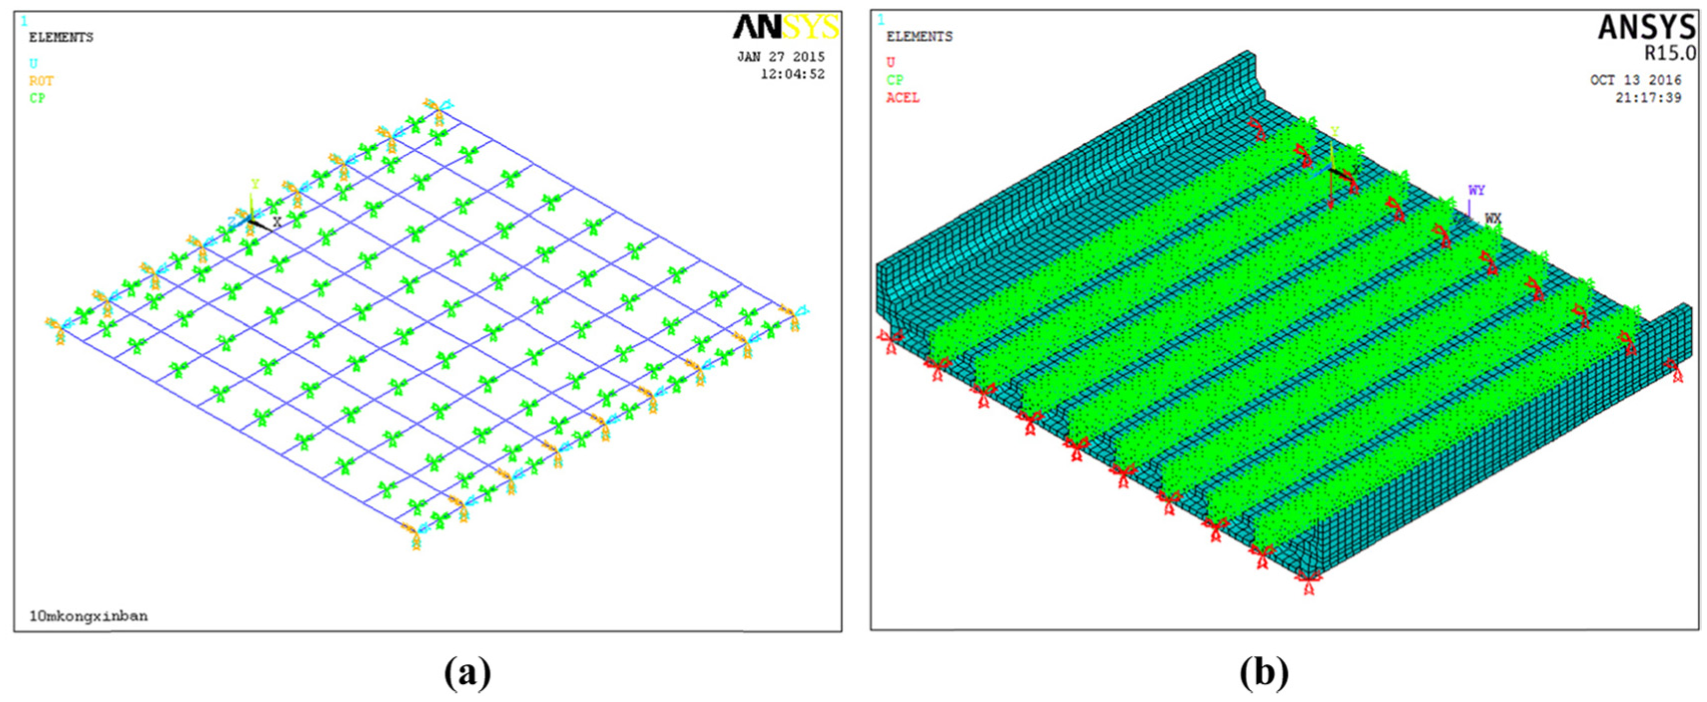
Finite element model of PC-10m: (a) grillage model and (b) entity model.
The initial model usually needs to be updated. Model updating based on field test is regarded as the most reliable method, while the results may be very peculiar. The entity finite element models, which are assumed to have a higher accuracy of lateral distribution of internal force, were used to update the grillage models to meet the requirement of general analysis. Figure 3(b) shows the entity finite element of PC-10m, in which the slab, bridge deck, and hinge joint were simulated by element type solid65. The connections between slab and hinge joint were simulated by coupling the DOF of nodes. In the process of coupling DOF, the rotational DOFs were released and the translational ones were coupled, which corresponds with the grillage models.
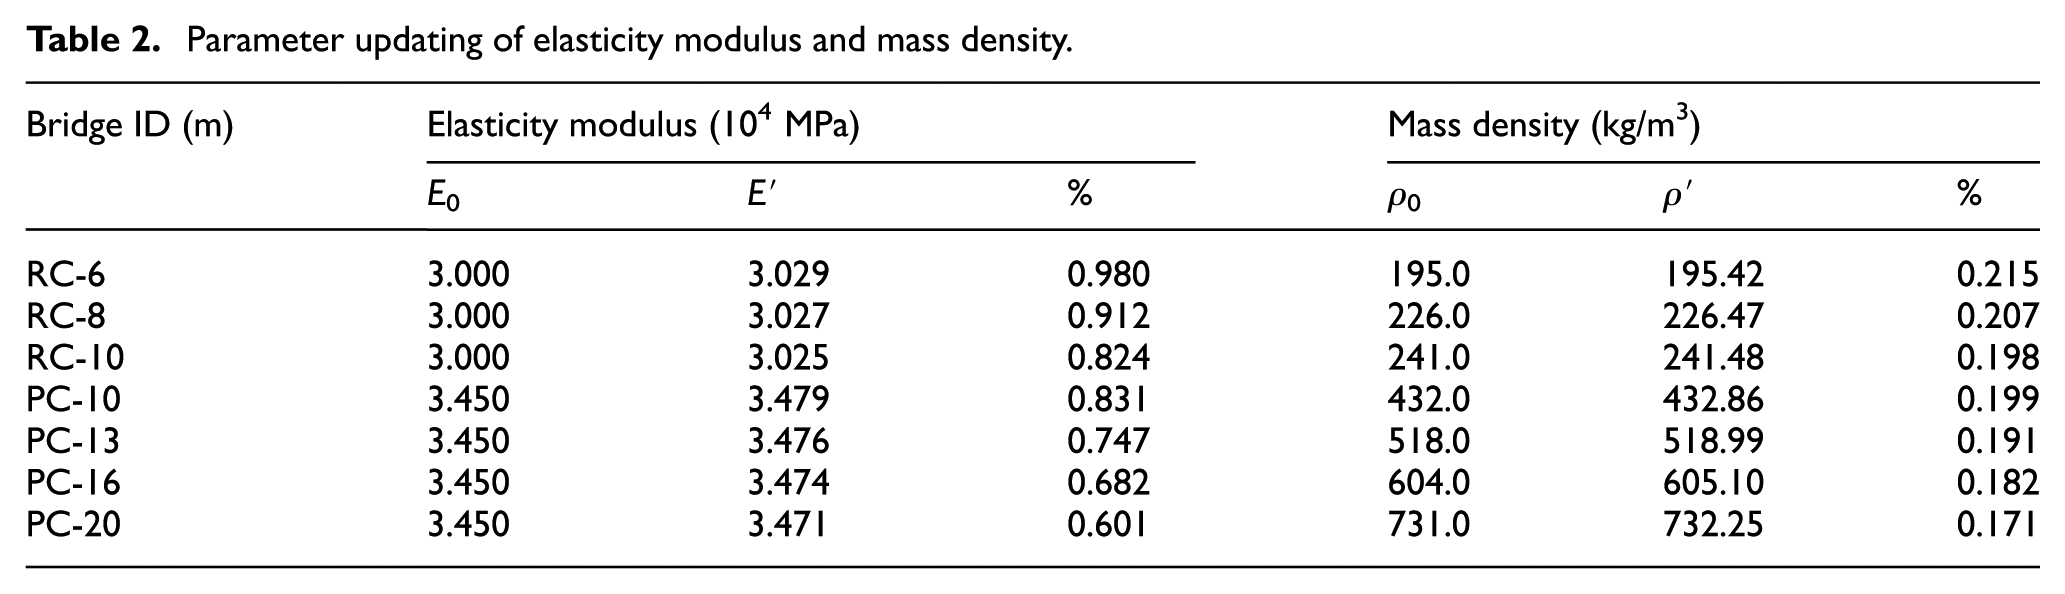
The elasticity modulus and mass density of cross-girder have a significant influence on the lateral distribution of internal force and thus are chosen as target parameters of model updating. The static target function can be shown as (Li, 2010)

where
Parameter updating of elasticity modulus and mass density.
Furthermore, a comparison was conducted between the lateral distribution of internal force of updated grillage model and that of entity finite element model. The load case information and positive moment results are shown in Figure 4. It can be known from Figure 4 that the maximum relative error of positive moment is 7.51%, so the modified grillage models will be used in the following analysis.
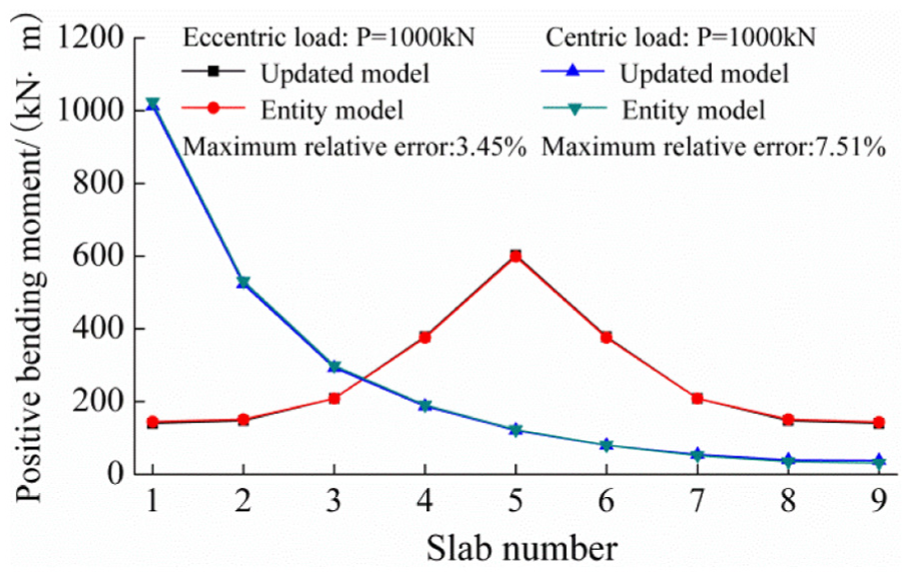
Comparison of lateral distribution of internal force.
Truck and bridge interaction analysis
Dynamic models of trucks
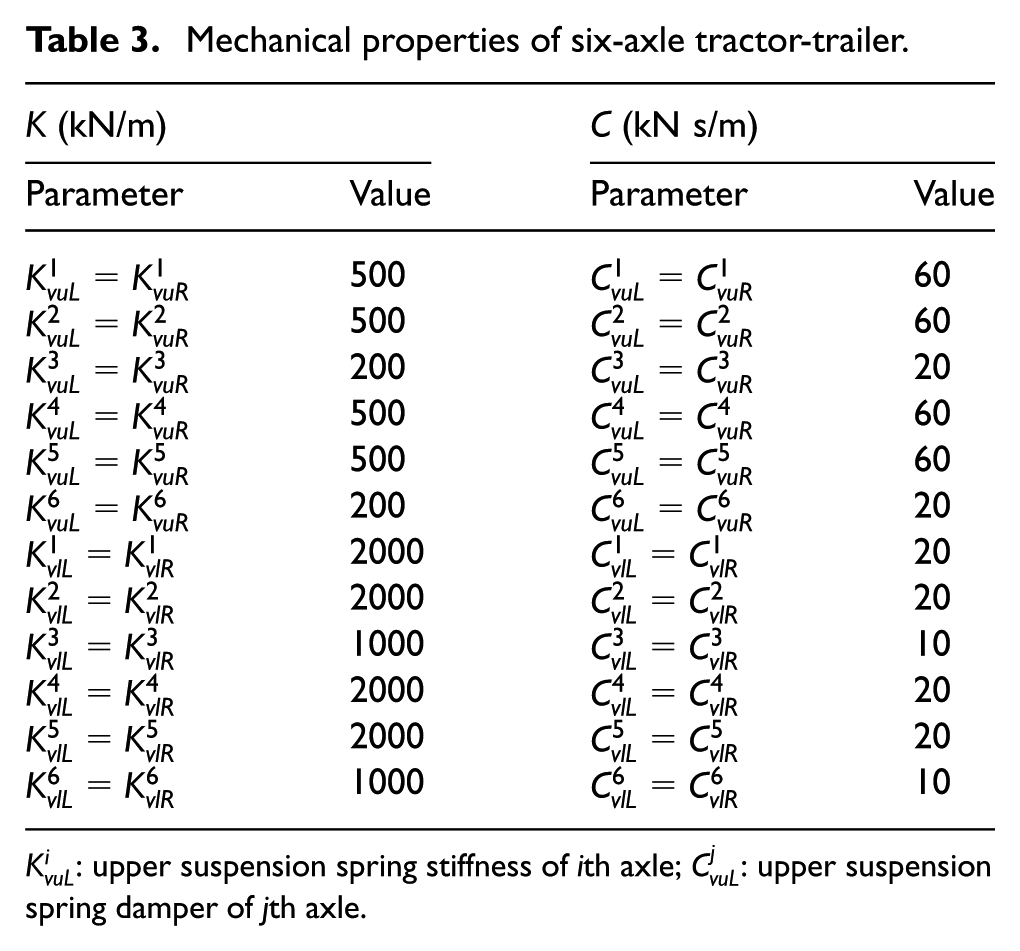
To cover all the vehicle types of the monitored segment, the dynamic truck models, from biaxial to six-axle, were established. Figure 5 only shows the models of six-axle tractor-trailer, which is the predominant type of EHT. The
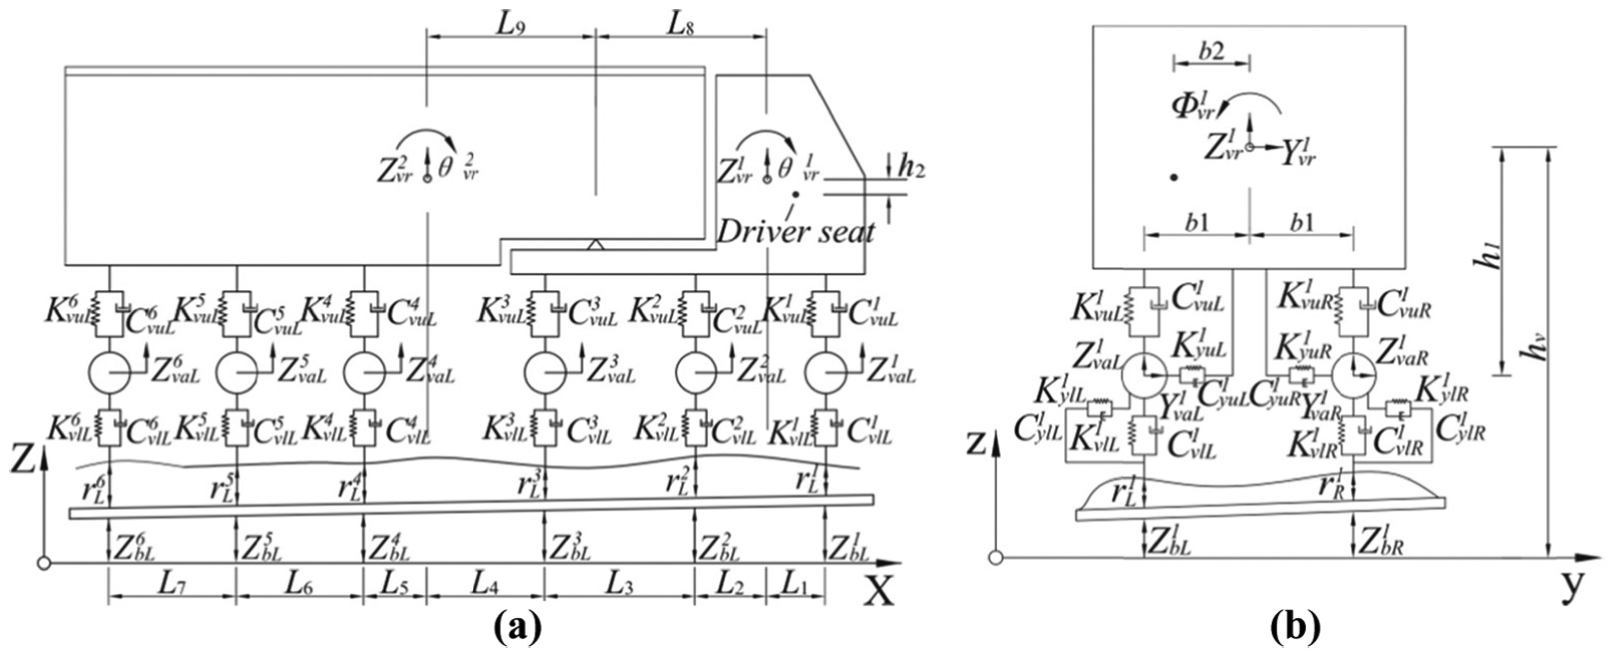
Dynamic model of six-axle tractor-trailer: (a) side direction and (b) crosswise.
Mechanical properties of six-axle tractor-trailer.
Road surface roughness
The road surface irregularity is regarded as a main cause of the dynamic effect of moving trucks. An artificial road profile is generally represented by a zero-mean stationary random process that can be expressed by a power spectral density (PSD) function. A modified PSD function was used in this study (Huang and Wang, 1992)
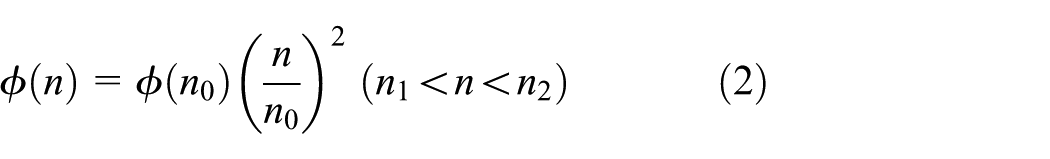
where n is the spatial frequency (cycle/m), n0 is the discontinuity frequency of π/2 (cycle/m),
With the PSD function, the road surface profile can be generated by an inverse Fourier transform as follows

where
Coupling relationship between truck and multi-girder bridge
The coupling relationship of existing research is mainly for signal girder. The applicability may be very poor for the multi-girder bridges and truss structure. Figure 6 shows the interpolation relationship of contact point and adjacent nodes of multi-girder structure.
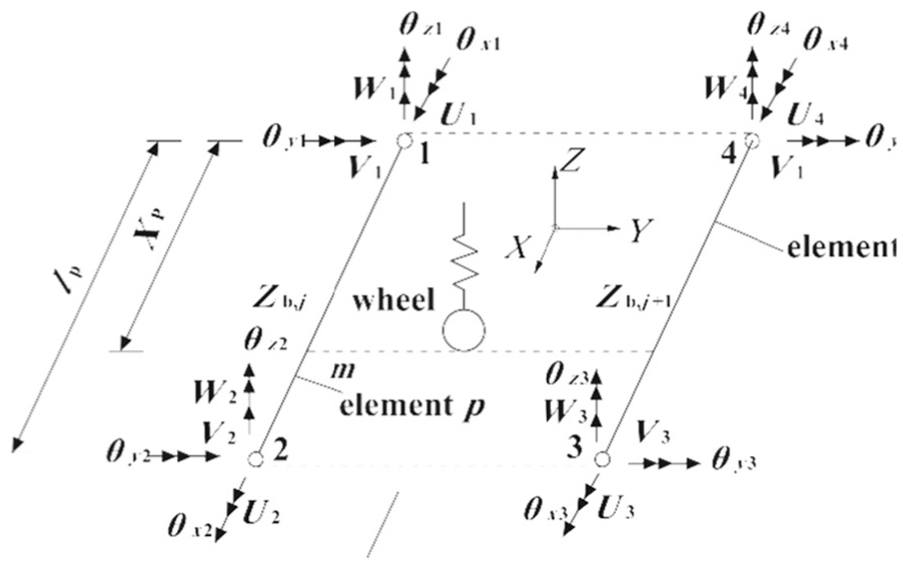
Interpolation relationship of contact point and adjacent nodes.
The vertical displacement of contact point can be expressed as
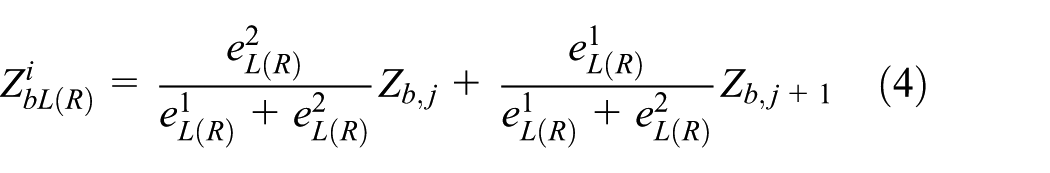
The meaning of the symbols of equation (4) can be inferred from Figure 6. The vertical displacement of points m and n can be interpolated based on the vertical displacements and angular displacements of Node1–Node4


where
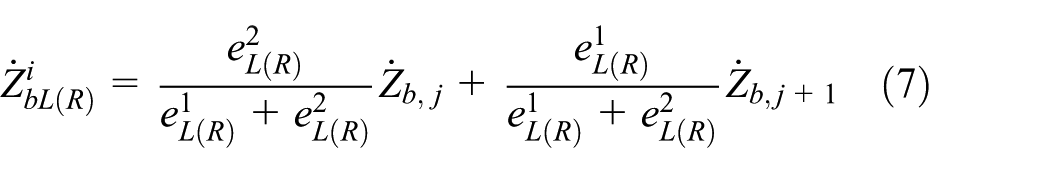
Then, the velocity of contact point can be expressed as
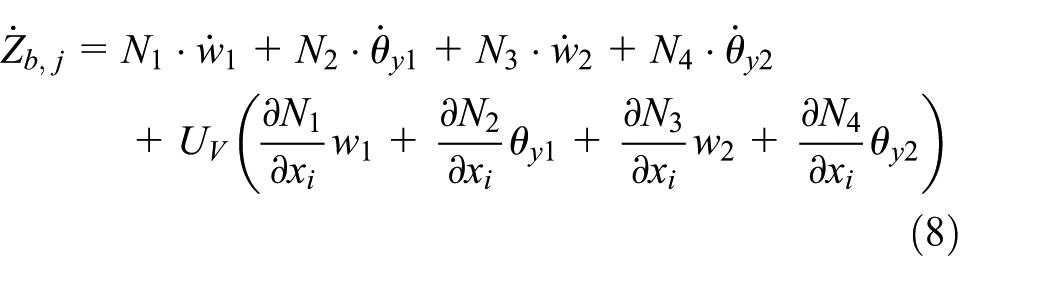

Vertical force assigned to jth girder and (j + 1)th girder from the contact force of wheel of ith axle can be further expressed as

Interaction equation of the bridge and truck
The interaction equation of the bridge and truck can be written in matrix form as follows

where
To conduct the interaction analysis of the bridge and truck system as defined in equation (11), the BDANS software was developed by FORTRAN language. The accuracy and reliability of BDANS have been verified by Han, Wu, and Cai, et al. (2015).
Dynamic simulation analysis of EHT load cases
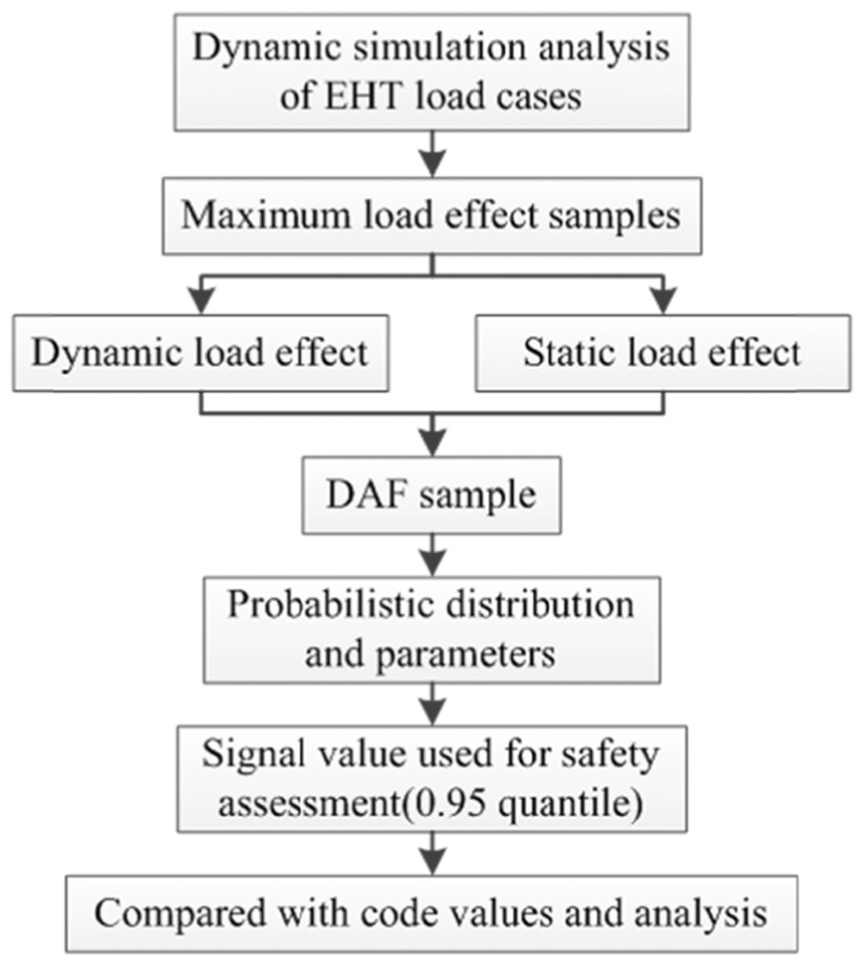
Figure 7 shows the flowchart of dynamic simulation analysis conducted in this research. The load case included in Figure 7 belongs to Case I. The truck weight is 81.7 t, and the truck can travel at carriageway of PC-20m in a speed of 40.7 km/h. Both the dynamic and static responses of the bridge can be obtained, and also, the DAF involved in this load case.
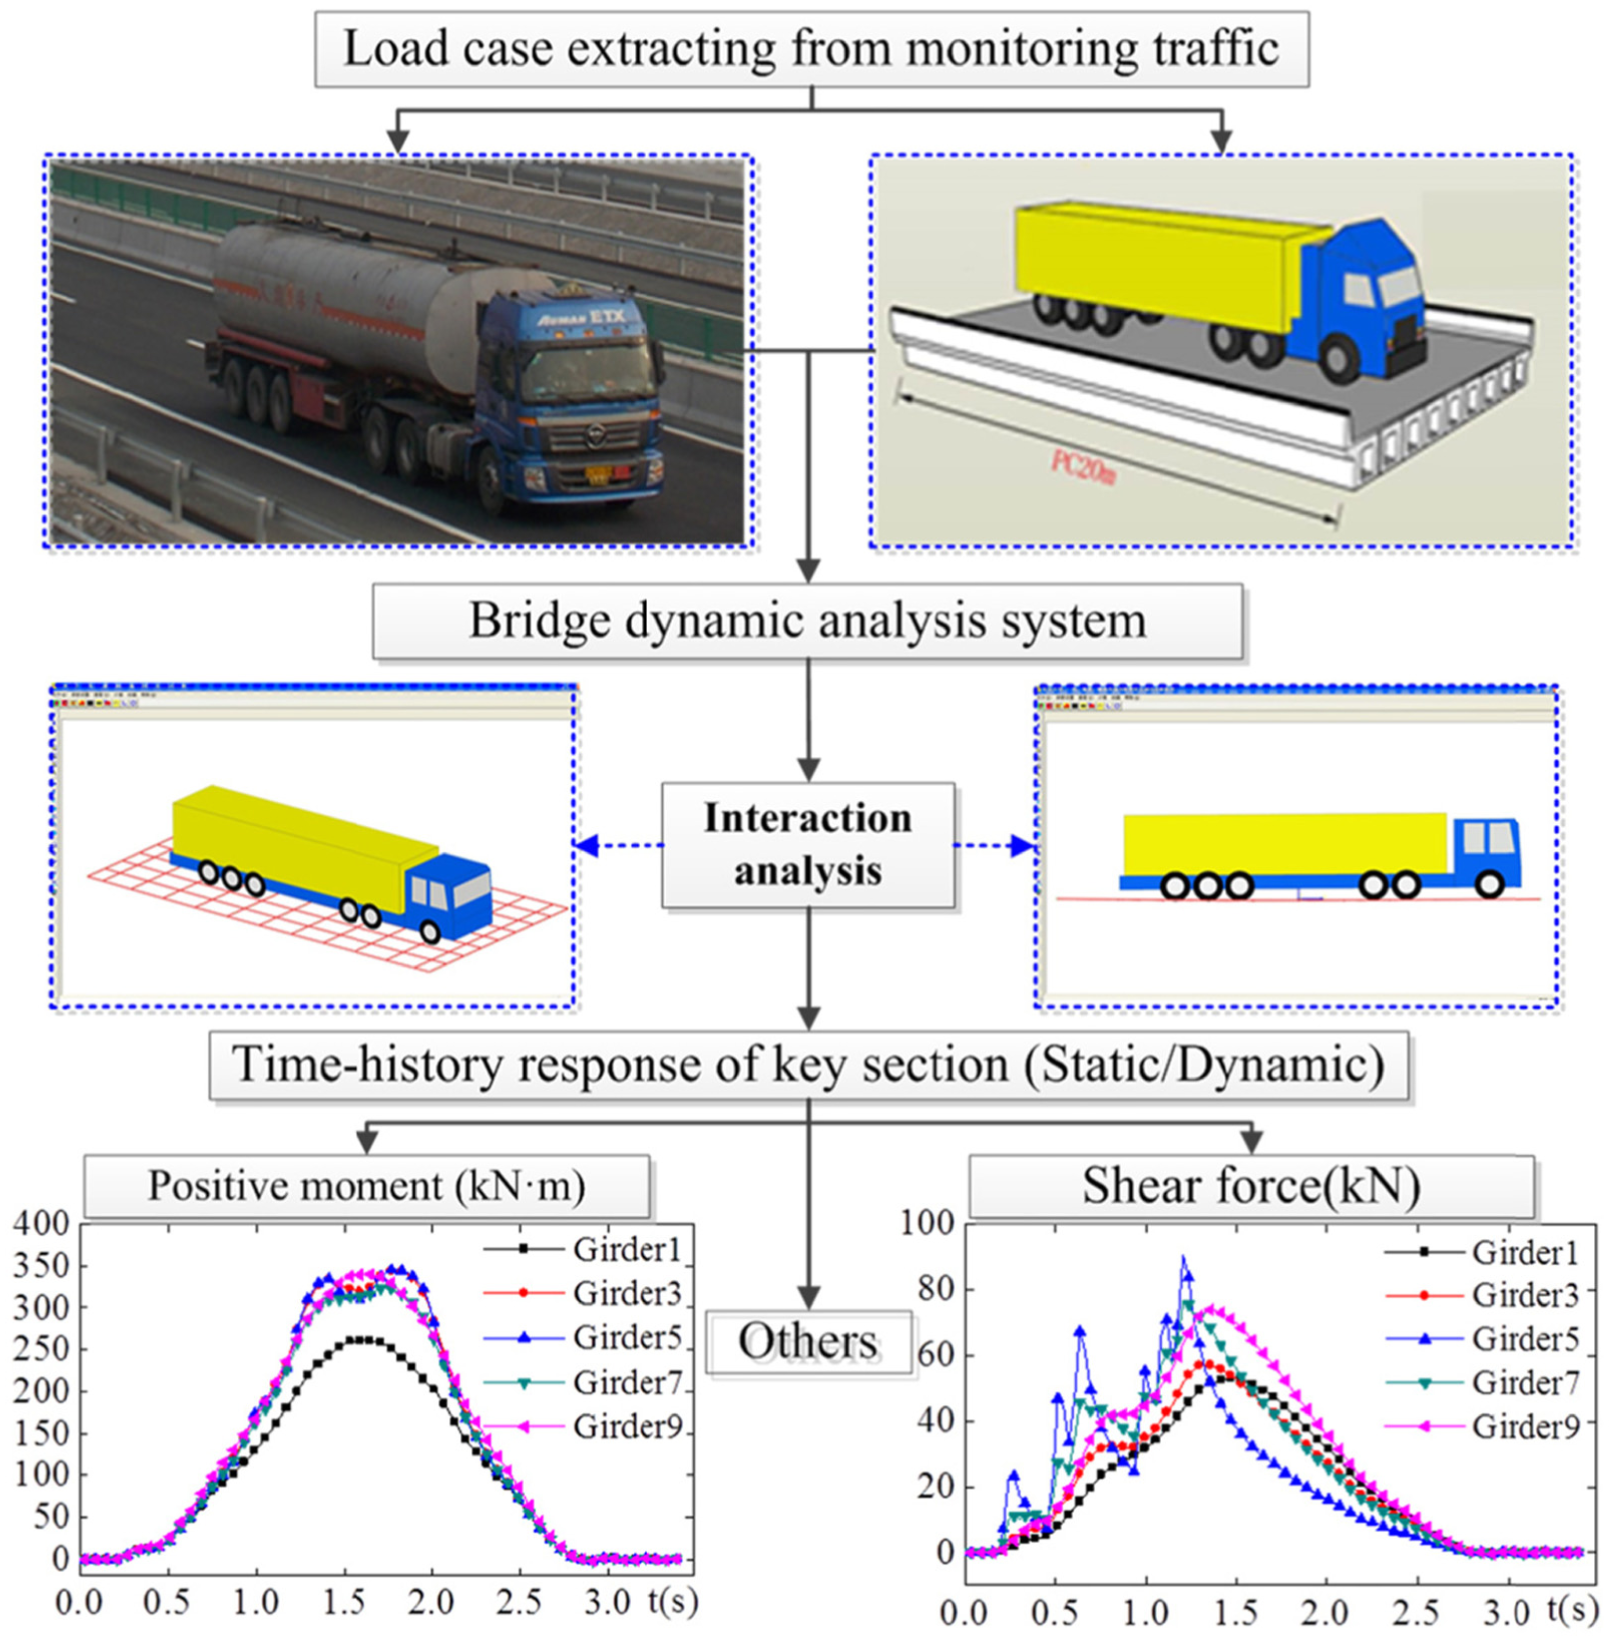
Flowchart of dynamic simulation analysis.
When the RSC is categorized as “good”, the comparison of dynamic effect and static effect of positive moment is shown in Figure 8. The two peaks of time-history correspond to the loading of tandem and tridem at the mid-span. The maximum value of both dynamic effect (360.2 kN m) and static effect (345.3 kN m) is obtained from girder5#, and the DAF of the EHT load case is 1.043.
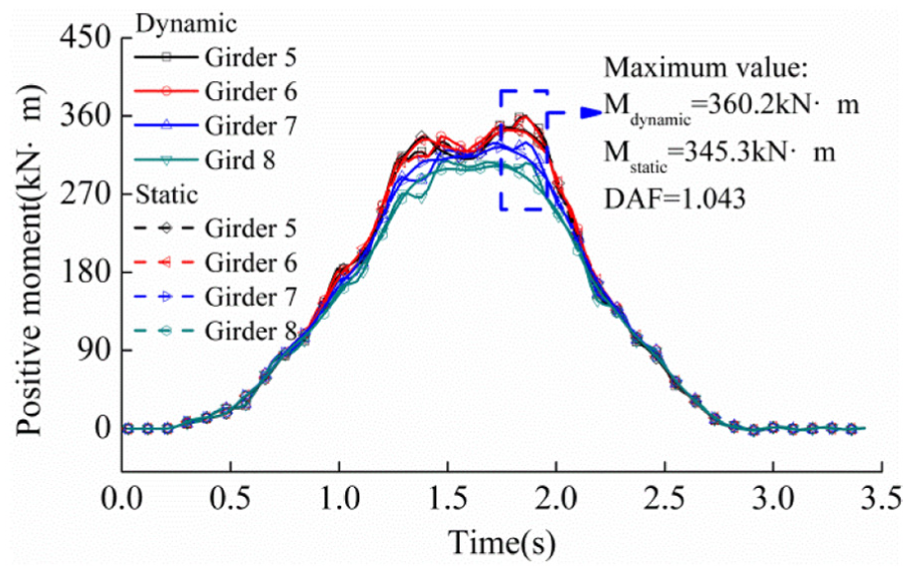
Analysis results of extra-truck load case.
Truck load effect analysis
Maximum truck load effect
The maximum truck load effect is defined as the maximum peak value of the time-history response curve of all the slabs. For each slab bridge, the maximum positive moment, maximum shear force, and maximum vertical displacement can be obtained based on the dynamic simulation analysis. Figure 9 shows the maximum positive bending moment of RC-10m. It should be noted that the impact effect will not considered in the analysis of this part.

Maximum positive bending moment of RC-10m.
Compared with the code value
The EHT load is extracted from the right tail of WIM data, so a significant difference may be existed between EHT load and design vehicle load. A comparison will be made in this section to assess the EHT load effect.
The first step is to determine the design traffic load. The AASHTO (2012) vehicle load HL-93 is a combination of the design load of 9.3 kN/m and the design truck or design tandem. The design vehicle load specified in the Chinese code (MOCAT, 2004b) is composed of a distributive lane load of 10.5 kN/m along the whole span of the bridge and a concentrated moving load P (determined by the span length of the bridge). Then, regarding the load layout along the transverse direction of the bridge, the loading, lanes, and selection of loading lanes are then determined according to the principle that the layout should produce the most unfavorable load effect.
Load effect ratios
The load effect ratio, which is the ratio of maximum truck load effect to the design vehicle load effect, can quantitatively show the relationship between EHT load effect and design vehicle load effect. Some statistical analysis of the sample of load effect ratio, including the maximum value and average value, was conducted. The results were plotted in Figure 10.
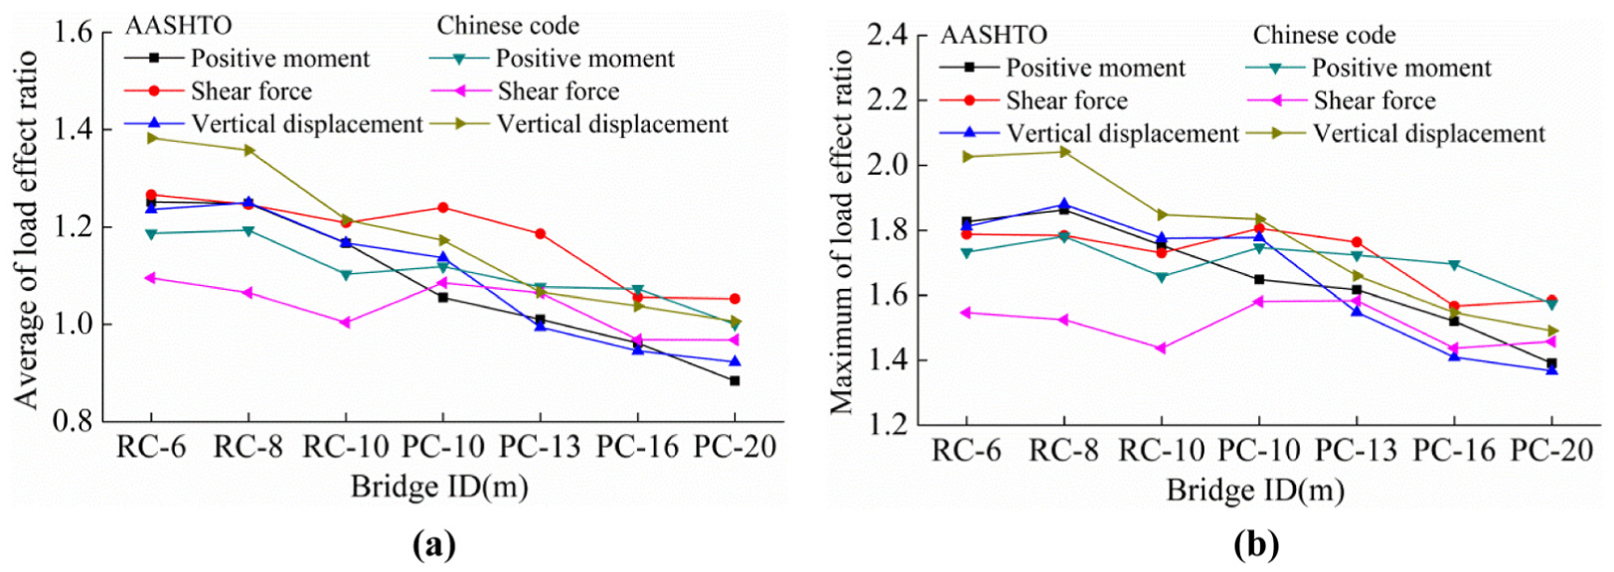
Statistical analysis of load effect ratio: (a) average value and (b) maximum value.
For the hollow slab bridges, Figure 10(a) shows that the average value is mainly between 0.90 and 1.40. Most of the average values are higher than 1.0, which indicates that the average level of EHT load effect is approximate or a little higher than the design vehicle load effect of Chinese and American Association of State Highway and Transportation Officials (AASHTO).
Figure 10(b) shows that the maximum value of load effect ratio is mainly between 1.40 and 2.10, and the maximum value of internal force effect is around 1.80. This indicates that the maximum level of EHT load effect is obviously higher than the design vehicle load effect of Chinese and AASHTO. So, some further assessments are necessary for the serviceability and safety of slab bridges.
Stiffness analysis
As can be found from Figure 10, the vertical displacements of EHTs have exceeded the code value obviously. So, it is meaningful to investigate the serviceability of structural stiffness by a further comparison. L/600 is the upper limit value of vertical displacement stipulated by Chinese standard (MOCAT, 2004a), where L is the bridge span length. So, the ratio of vertical displacement, extreme value of maximum vertical displacement to L/600, will be used to evaluate the serviceability of stiffness.
The results of vertical displacements and corresponding ratios are given in Table 4. It can be found that the ratio of average displacement to design value is from 1.006 to 1.383, and the ratio of extreme displacement is from 1.491 to 2.027, which indicate that the vertical displacements of slab bridges under EHT load have also exceeded the code value obviously. However, it can also be found that all the ratios of extreme displacement to limited value are lower than 0.3. So, it can be regarded that the stiffness of hollow slab bridges can meet the requirement of serviceability.
Comparison of vertical displacements.

DA and DE: average and extreme values of maximum displacement; Dd: design value; DL: limited value.
Safety assessment of slab bridges
Bending is the main mechanical behavior of slab bridges. It can be found from Figure 10 that the positive bending moment needs to be paid more attention than shear force. So, the safety assessment of hollow slab bridges will target on the bending bearing capacity.
Assessment method
In order to take advantage of the abundant WIM data and efficient simulation analysis, the Chinese specified assessment method will be optimized by referencing the AASHTO load and resistance factor rating (LRFR) method. AASHTO LRFR is a method of Level II and has been widely used in America. The revised assessment equation, focusing on the vehicle load, can be expressed as
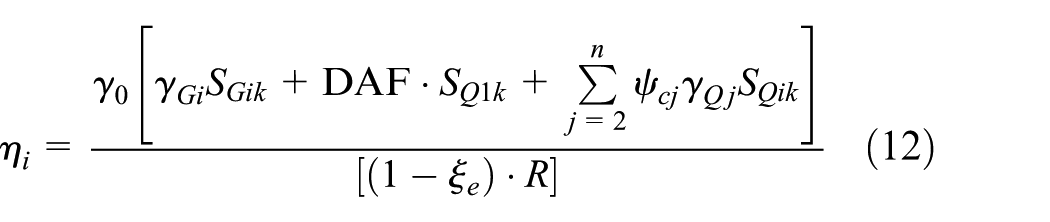
where
A generalized value of 0.05 is used in this study instead of derive
The material deterioration of the structure as the service time passes and the corresponding influence on structural resistance (Xiao, 2011);
The potential defect existed in bridge structure;
The uncertainty of assessment model used in this study.
However, the generalized value can ensure the applicability of the analysis results of this study and helps to understand the overall safety conditions of Chinese hollow slab bridges. Thus, the result sample
Optimization of DAF
As had been mentioned by many existing researches, the DAF is closely related to the gross vehicle weight (Deng and Cai, 2010; Moghimi and Ronagh, 2008). The weight of EHT and the load effect are obviously higher than common vehicle, so the value of DAF of EHT will affect the reliability of evaluation results distinctly. The current standard has specified the DAF values for structure design, while they may be very conservative for the structure safety assessment under EHT load. So, an optimization toward DAF will be conducted in this section. The flow of the optimization of DAF is shown in Figure 11.
Optimization of DAF used for safety assessment.
In this study, the optimization of DAF is based on the statistical analysis. The DAF sample of each hollow slab bridge can be obtained based on the dynamic simulation analysis of EHT load case, in which the RSC was set to be “good” in view of the high-speed requirements of Chinese highway. In the next step, the fitting analysis was conducted to determine the distribution type and parameters. Table 5 shows the Kolmogorov–Smirnov (K-S) test results of DAF samples when the significance level is 0.05. It can be seen that the observed values of K-S test are all less than the critical values, and the minimum value of R2 is 0.8416. Therefore, the DAF sample of the hollow slab bridge can be described by lognormal distribution. Figure 12 only shows the fitting analysis results of RC-10m and PC-20m due to the space limitation.
Results of K-S test.

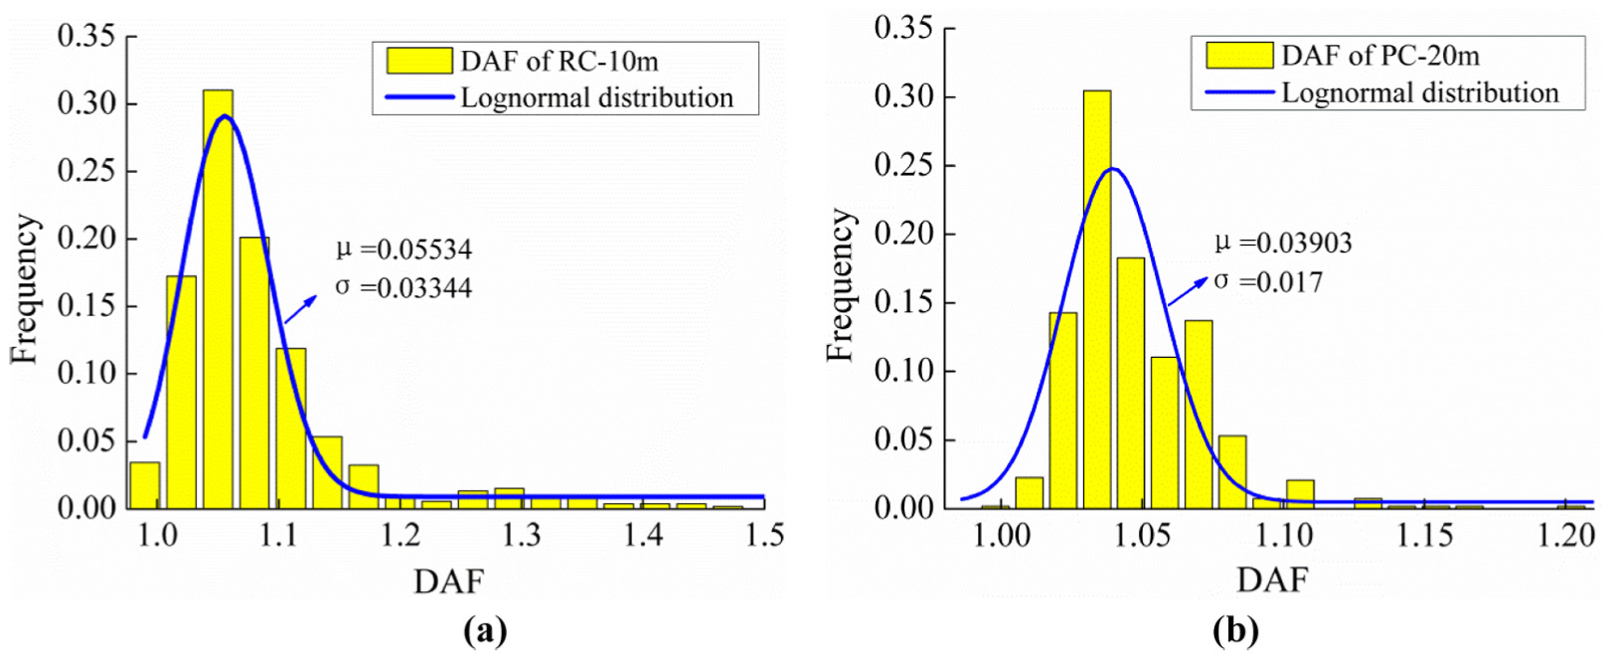
Fitting analysis of distribution of DAF: (a) RC-10m and (b) PC-20m.
The value of DAF will directly affect the assessment result, especially for the EHT that owns a high level of static load effect. The principle of the conservation, as we all know, has been widely used in the design of new structure. However, the conservative assessment should not be adopted in the engineering practice because it will lead to the unreasonably increasing structure maintenance cost. The DAF of a specific load scenario is a random variable. The dynamic load effect of EHT may be underestimated if the calculated DAF for each loading case is directly used. A certain confidence level, between 0.95 and 0.99, is usually chosen to determine the single DAF value used for the structure safety assessment (Deng and Cai, 2010). For this study, the 0.95 quantile of DAFs of EHT load scenarios is used to fully consider the dynamic impact and also avoid the conservative assessment. The 0.95 quantiles of the DAF distributions and the comparison with the code value are plotted in Figure 13.
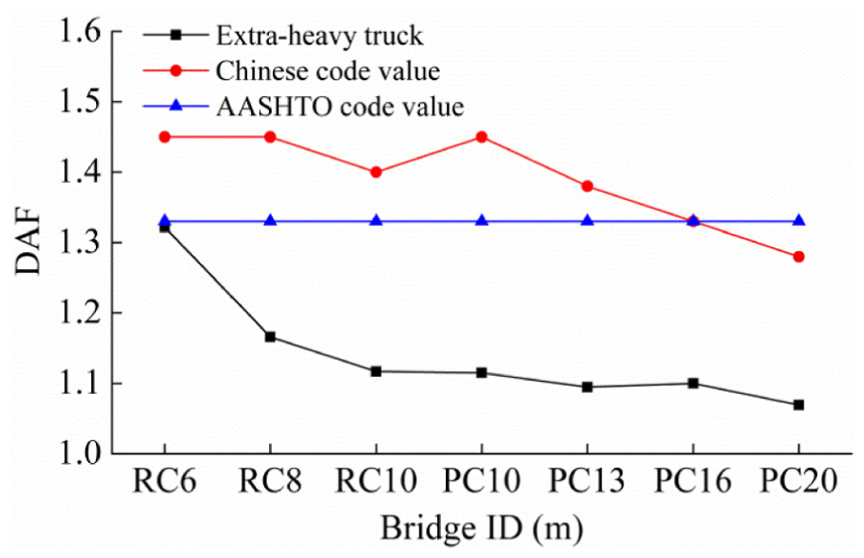
0.95 quantile of the DAF distributions.
It can be found from Figure 13 that the 0.95 quantile of DAF decreases with the increasing span length. In addition, the DAFs are obviously lower than the code values of Chinese and AASHTO code. This can mainly be attributed to the high gross weight and low speed of EHT because the DAFs usually decrease with the increasing truck weight and the decreasing truck speed. As a result, the DAFs own a gentle variation trend when the span length is greater than 10 m, which can also be found from Figure 13.
Assessment method by MOCAT (2011)
In China, the technical code, namely, Specification for Inspection and Evaluation of Load-bearing Capacity of Highway Bridges (MOCAT, 2011), is used to conduct the safety assessment of bridge structures. The inequation of safety assessment specified by MOCAT (2011) is

where
In addition, three coefficients, namely,
Values of real traffic correction factor.

In Table 6, Qm and Qd are the typical characteristic traffic volume and design traffic volume, respectively, and Qm can be obtained by WIM data and passenger car equivalent coefficient (PCEC) specified by MOCAT (2015). The values of PCEC are specified in Table 7. The specified Qd (annual average daily traffic (AADT)) is 15,000 for motorway and first-class highway. α is the mixed rate of truck with a gross weight higher than 55 t and β is the percentage of axles with a weight higher than 14 t (MOCAT, 2011, 2015).
Values of PCEC.
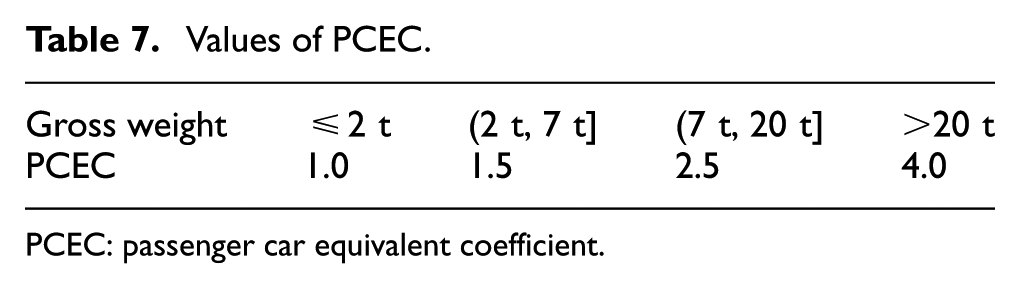
PCEC: passenger car equivalent coefficient.
To compare the safety assessment results of this study with those of MOCAT (2011), equation (13) will be rewritten as

The PCEC will be determined based on WIM data. To ensure the applicability of PCEC value, WIM data with a time length of 544 days from Xuan-da expressway will be used, besides that of G104 highway. Xuan-da is a heavy-duty expressway of north China, which is mainly used for the coal transportation from Shanxi province to Beijing and Hebei province. The traffic load characteristics of Xuan-da are totally different from those of G104. The collection and analysis of WIM data of Xuan-da had been provided in a former publication of the author of this article (Han et al., 2015).
The gross vehicle weight and axle weight of G104 and Xuan-da are shown in Figure 14 in a descending order. The Qm of these two segments are 4017 and 1630, respectively, both of them are obviously lower than Qd. So, the
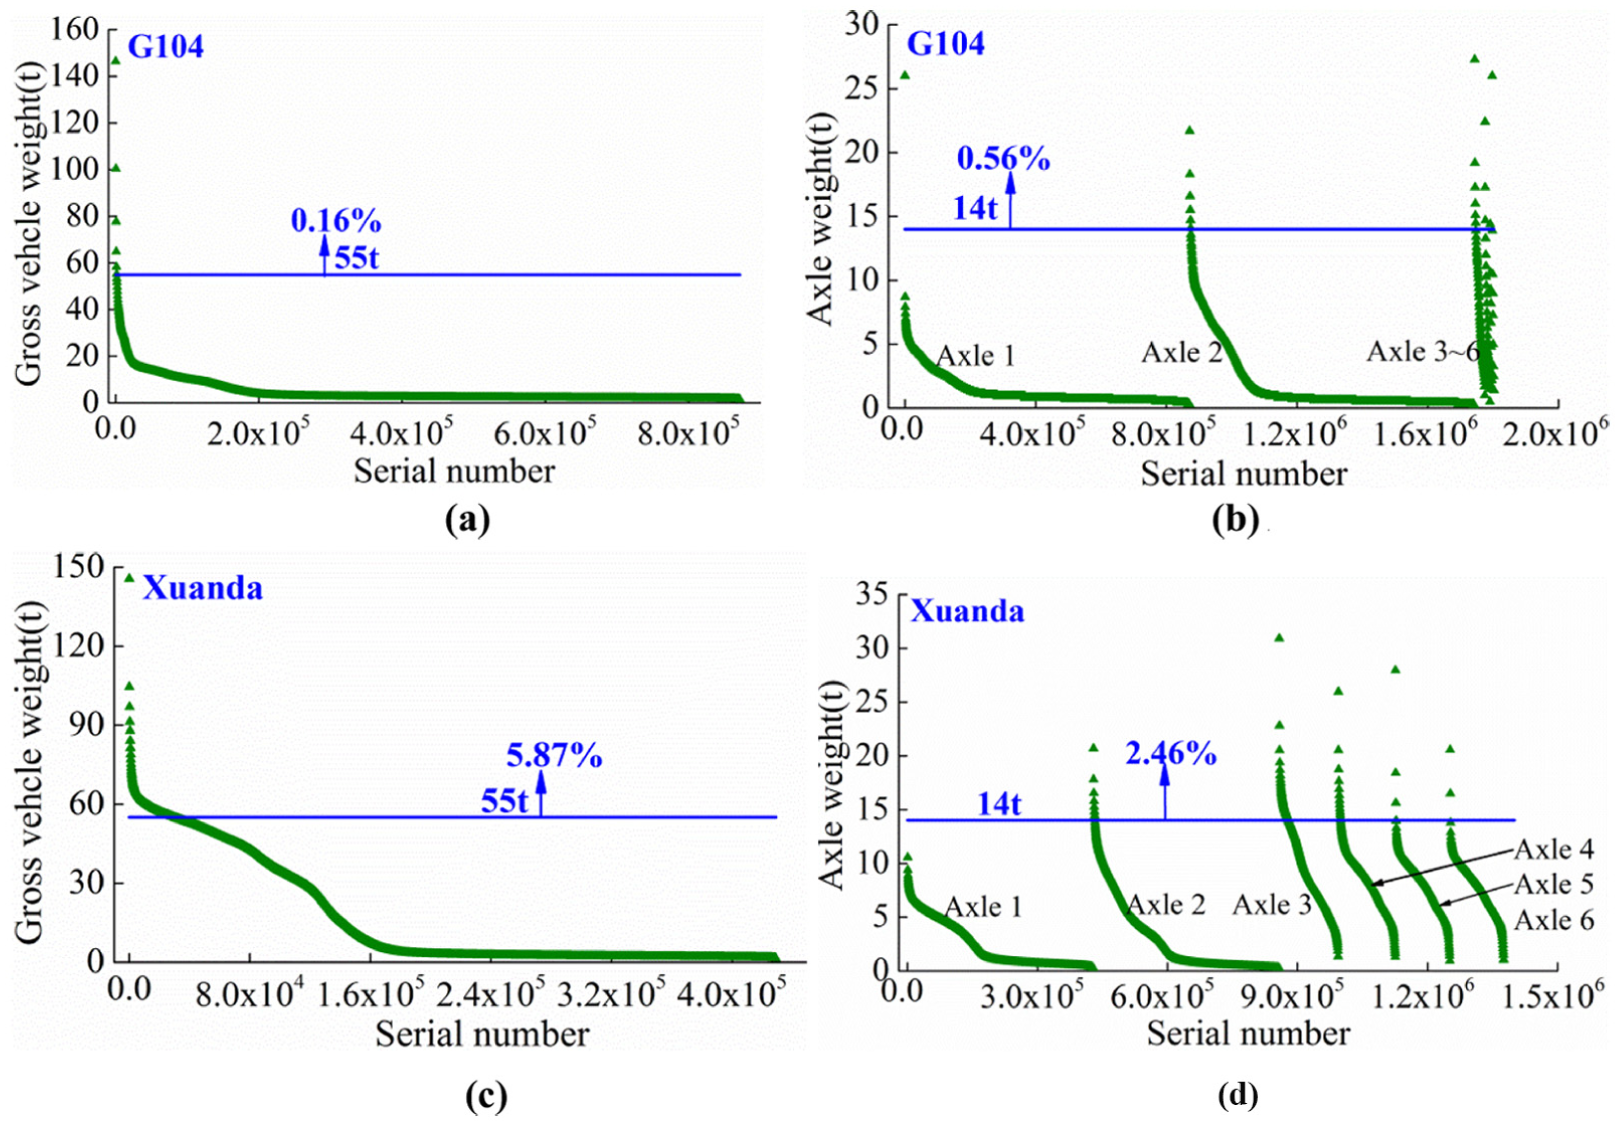
GVW and axle weight from WIM data: (a) GVW of G104 highway, (b) axle weight of G104 highway, (c) GVW of Xuan-da expressway, and (d) axle weight of Xuan-da expressway.
Safety assessment and result analysis
All the selected slab bridges are statically determinate. Only the resistance, gravity effect, and truck load effect will be considered in the assessment. Table 8 shows the positive bending moment effect of gravity, resistance, and design traffic load of the slab bridges and also the design DAF.
Positive moment of gravity and resistance (kN m).
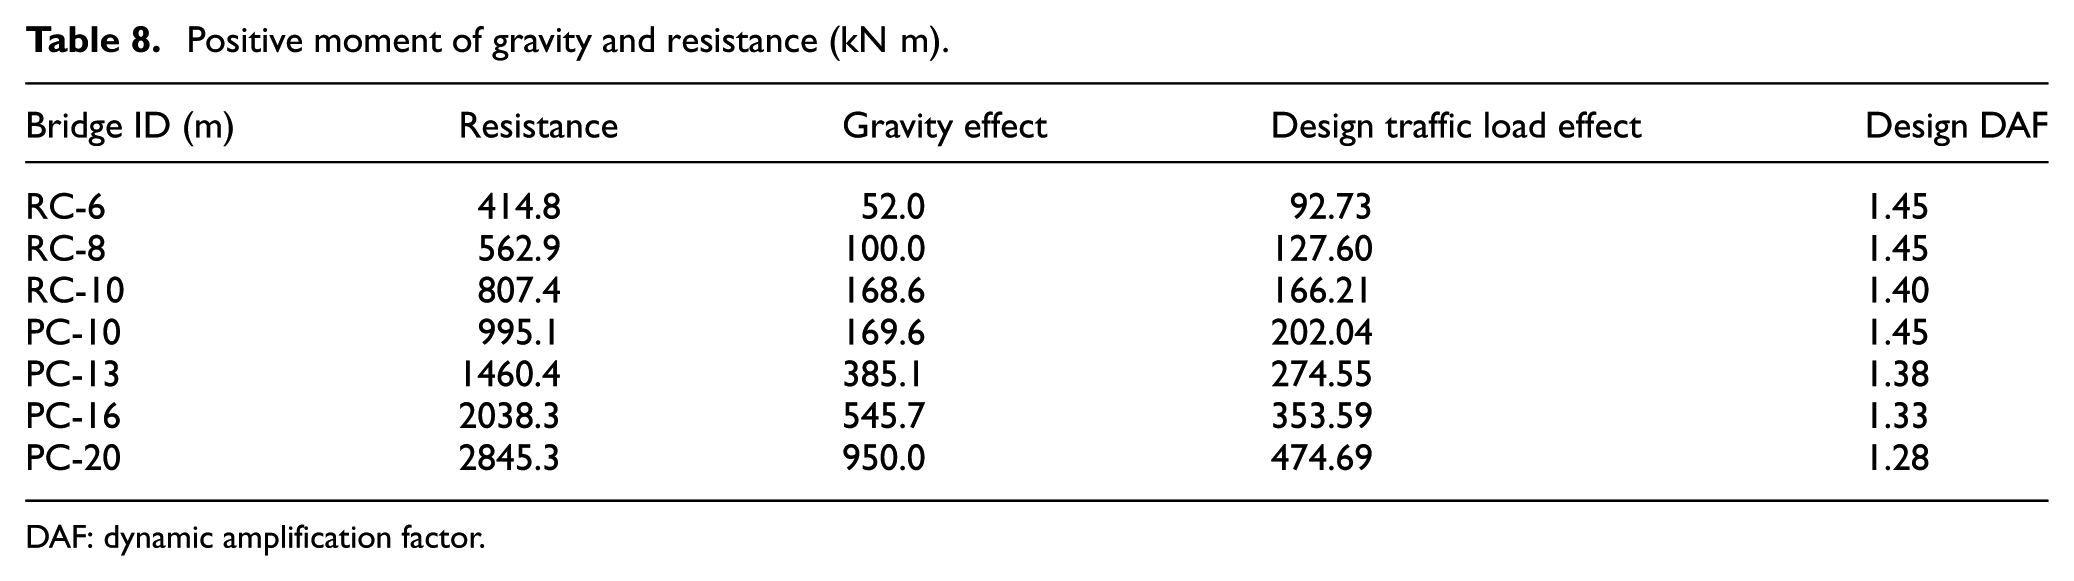
DAF: dynamic amplification factor.
Figure 15(a) shows the diagram of

Load rating indices and result comparison: (a) result sample of RC-10m and (b) result comparison.
It can be seen from Figure 15(b) that the maximum values of
Conclusion
The structure safety assessment method based on WIM and simulation analysis was investigated. Seven simply supported hollow slab bridges were selected and taken as the research object. The long-term WIM data were used to extract EHT load cases. The original finite element methods (FEMs) of slab bridges were updated based on the static target function, and the target parameters are the elasticity modulus and mass density of cross-girder. The dynamic models of trucks and the coupling relationship between truck and multi-girder bridge were determined, and the oscillation equations were established by a separate iteration. The simulation analysis of EHT load cases was then conducted using the established bridge–truck interaction analysis system. An optimized rating method was then proposed and was used in the safety assessment of hollow slab bridges. The following conclusions can be drawn from this study.
The maximum level of EHT load effect is obviously higher than design vehicle load effect and the average level is approximate or a little higher than the latter.
The displacements due to EHT are seriously transfinite, while the extreme value is still far below the threshold value specified by Chinese standard. The structural stiffness can meet the requirement of serviceability.
On the premise of a good structural integrity, the maximum value of RF of hollow slab bridge ranges from 0.69 to 0.78 and the average value is between 0.53 and 0.67. The hollow slab bridges have not yet reached the ultimate limit state and have a safety redundancy under the EHT load.
The loading indices of MOCAT (2011) are close to the average values of load index of p, but lower than those of the maximum values, which indicate that some extreme loading conditions may be thoughtless in the proposed safety assessment method by MOCAT (2011).
Footnotes
Declaration of Conflicting Interests
The author(s) declared no potential conflicts of interest with respect to the research, authorship, and/or publication of this article.
Funding
The author(s) received no financial support for the research, authorship, and/or publication of this article.