



Abstract
Wind tunnel tests of synchronous measurements of the buffeting lifts and moments on six separated strips of a motionless 1:45 scale sectional model of a flat closed-box bridge deck were carried out in three turbulent flow conditions. The longitudinal and vertical components of turbulent wind speed were also measured synchronously with the buffeting forces at the positions just over the windward edges of the six strips. Three typical methods, including the auto-spectral method based on the measured auto-spectrum of buffeting force (auto-spectrum method), the cross-spectral method based on the measured cross-spectra between buffeting force and fluctuating turbulence components (cross-spectrum method), and the colligated least square method based on a colligated residue of the above-mentioned auto- and cross-spectra (colligated least square method), were then used, respectively, to identify the aerodynamic admittance functions of the flat closed-box deck. The aerodynamic admittance function components of a buffeting force with respect to the longitudinal and vertical components of fluctuating wind speed were effectively separated using the colligated least square method while only a weighted average value, often called the equivalent aerodynamic admittance function, was obtained using the auto-spectrum method. Meanwhile, the reproduced auto-spectra of the buffeting forces had very high accuracies when the aerodynamic admittance functions identified with the colligated least square method were employed, but deviated significantly from the measured ones when the aerodynamic admittance functions identified with the cross-spectrum method were used. Furthermore, the influence of the span-wise position of the wind probe on the values of aerodynamic admittance function module was confirmed to be very small. Finally, the aerodynamic admittance function components with respect to the longitudinal and vertical fluctuating wind speeds were found to be significantly affected by both the intensities and integral scales of the oncoming turbulence wind.
Keywords
Introduction
In buffeting analyses of long-span bridges, aerodynamic admittance functions (AAFs) are often adopted to consider the effects of the spatial variation and incomplete correlation of the turbulent wind speeds surrounding the cross section of bridge deck and to correct approximately the unsteadiness on the quasi-steady model of buffeting forces. On this account, the coefficient spectra of the wind-induced buffeting force on a bridge deck have conventionally been expressed with equations (1) to (4) (Chen et al., 2001; Tubino, 2005; Zhu, 2002)


where
In some literatures (Davenport, 1962; Davenport et al., 1992; Larose, 1997; Scanlan, 1993, 2000), approximate expressions about
Actually, AAFs measure the ratios of the aerodynamic forces in fluctuating flows to their quasi-static values which are commonly obtained through wind tunnel test in smooth flow for a bridge deck (Davenport, 1962). Liepmann approximation of Sears function is the most common form of the lift and moment AAFs for thin airfoils or flat plates in fully correlated vertical gusts with sinusoidal fluctuations (Liepmann, 1952). Because of the bluff body feature of bridge decks and the complicacy of turbulence wind in the atmospheric boundary, AAFs of bridge deck cannot be simply expressed by the Sears function, but must be measured through wind tunnel test or computational fluid dynamics (CFD) simulation in conjunction with a proper identification algorithm. Up to now, there have been several algorithms for the AAF identification based on tested fluctuating aerodynamic forces and wind velocities, such as the auto-spectrum method (ASM) based on the measured auto-spectra of buffeting forces which is also called the equivalent AAF method (Gu and Qin, 2004), the zero-separation method (ZSM; Chen et al., 2009), the separated frequency-by-frequency method (SFFM) based on tests in vibrating grid–generated turbulent flows (Han et al., 2010), the cross-spectrum method (CSM) based on the measured cross-spectra between buffeting force and fluctuating wind speed components (Zhao and Ge, 2015), and the colligated least square method (CLSM) based on a colligated residue of the above-mentioned auto- and cross-spectra (Xu et al., 2014; Zhu et al., 2016). To identify AAFs, it is necessary to measure simultaneously buffeting forces acting on a sectional model and fluctuating velocity components of oncoming turbulent wind in a wind tunnel.
Buffeting forces can be obtained in wind tunnel tests through various ways, such as direct measurement of fluctuating forces with dynamic force balances, fluctuating pressure measurement in conjunction with pressure-integral technique, and systematic identification based on random displacement or acceleration responses of the sectional model to the turbulent wind. The third way is an indirect method compared with the first two ways (Gu and Qin, 2004), and the stability of the results obtained through this way is deemed to be uncertain (Zhao and Ge, 2015). Since the aerodynamic forces can be obtained by integrating the distributed pressures on a cross-sectional strip, the AAFs could also be identified through a pressure measurement test (Davenport et al., 1992; Haan, 2000; Larose, 1997; Ma et al., 2013). However, the pressure measurement approach has a few disadvantages compared with the force measurement approach, especially for bridge decks with wind barriers, crash barriers, and other ancillaries, on which the pressure measurement can be hardly conducted.
In traditional wind tunnel tests for AAF identification, the total fluctuating buffeting forces acting on the entire sectional model or a fairly long segment of the model are usually measured with a proper dynamometric system (Cigada et al., 2001; Diana et al., 2002, 2004, 2015; Hatanaka and Tanaka, 2002; Jancauskas and Melbourne, 1986; Matsuda et al., 1999; Sankaran and Jancauskas, 1992; Sarkar, 1992; Zhao and Ge, 2015). Then the distributed buffeting forces acting on cross-sectional strips of the model, needed in calculating AAFs, are often regarded to be equal to the measured total buffeting forces divided by the length of the model or the measured segment. This obviously implies an assumption that the distributed buffeting forces on different strips are fully correlated within the whole model or measured segment. However, this assumption is not strictly true because the fluctuating wind speeds as well as the fluctuating buffeting forces are stochastic, thus are actually partially correlated along the model span. In this connection, Xu et al. (2014) and Zhu et al. (2016) derived relevant formulae to consider the behavior of the span-wise partially correlation of the distributed buffeting forces when calculating the auto-spectra of the distributed buffeting forces and the cross-spectra between the distributed buffeting forces and the fluctuating wind speeds of the oncoming turbulence. Nevertheless, an additional synchronous measurement of pressures on multi-strips of another identical model is needed to obtain approximately the span-wise correlation information of the distributed buffeting forces. To avoid the additional pressure measurement test, a new technique of synchronous measurements of buffeting forces on narrow strips using a kind of miniature three-component dynamic force balances (Gao and Zhu, 2016) was elaborately developed by Zhu and his cooperators (Yan et al., 2017). The span-wise length of each deck model strip was only 30 mm and was notably smaller than the span-wise integral length scale of turbulence; therefore, the distributed buffeting forces could be considered to be fully correlated within such a small length. Thus, the AAFs could be directly identified from the measured buffeting force on the measured narrow strips. The purpose of carrying out the multi-strip force measurement in that test was to investigate the span-wise correlation of buffeting forces and will not be discussed in this article.
Jancauskas and Melbourne (1986) and Sankaran and Jancauskas (1992) measured the AAFs for a range of rectangular cylinders in smooth flow and grid-generated turbulent flows with different turbulence intensities, pointing out that the AAFs of rectangular sections rely on the chord-to-thickness ratio of the section and the turbulence intensity. Some other research results also show that the turbulent intensity of grid-generated turbulent wind field exerts a certain influence on the identified AAFs (Wen, 2008; Zhao and Ge, 2015). Larose (1997) directly measured the AAFs for typical closed-box girder bridge decks similar to the Great Belt East Bridge. Four different width-to-depth ratios and three turbulent flow fields with similar turbulence intensities but three different integral scales of turbulence were considered in his research. Hui (2006) studied the AAFs of typical twin-deck box girder sections similar to the Stonecutters Bridge. Five different gap widths and two grid-generated turbulent wind fields with similar turbulence intensities but different integral scales of turbulence were taken into account in his tests to investigate the influence of gap width and integral scale of turbulence on AAFs. The research results presented by both Larose and Hui demonstrated that the AAFs depend on the shape of bridge deck as well as the integral scale of turbulence. As a summary, the AAFs mainly depend on the aerodynamic shape of bridge deck, while they also influenced by the turbulent intensity and the integral length scale of turbulence (Li et al., 2016; Tomasini and Cheli, 2013).
Nowadays, passive grid-generated turbulent wind field is still the prevailing one in wind tunnel tests for AAF identification. However, as well known, it has evident disadvantages that its integral length scale of turbulence is often small and is difficult to be adjusted. Hence, research results about the influence rules of the integral scale and intensity of turbulence on AAFs are still insufficient and need to supplement further. This work will be very useful for improving the prediction accuracy of buffeting responses of long-span bridges and is a major task of this study. However, a proper method for identifying AAFs should be selected heretofore from the currently prevailing methods by comparison analyses.
Brief description of identification approaches
The ASM for AAF identification is only based on the measured auto-spectrum of buffeting force and needs an assumption that the admittance of a buffeting force due to the longitudinal fluctuating velocity (u) is as the same as that due to the vertical fluctuating velocity (w), that is

where
Thus,

where the influence of the cross-spectrum between u and w on the auto-spectrum of buffeting forces is neglected, and the error of this neglect is about 5%–7% as reported by Kumarasena (1989).
To distinguish

The two AAF components can then be calculated with the following expressions

where
However, the correlation between the buffeting force and the fluctuating wind is usually fairly weak and thus the identified AAFs show rather strong random behavior. Therefore, the auto-spectra of the fluctuating force reproduced using the identified AAFs often deviate far away from the measured ones (Hui, 2006; Xu et al., 2014). This will significantly reduce the analysis accuracy of buffeting responses of long-span bridges.
To distinguish the AAF components with respect to u and w, that is,


where

where
Equation (15) is often rewritten with the following form

where


Experimental setup
The cross section of a flat closed-box deck is shown in Figure 1. All the wind tunnel tests were carried out in the TJ-2 Wind Tunnel, and they were typically conducted at a mean wind speed of 12 m/s. The sectional model was constructed at a length scale of 1:45. Its whole length (L), width (B), and depth (D) were 1740, 775.6, and 77.8 mm, respectively; thus, the width-over-depth ratio (B/D) was 9.71. The schematic layout of the experimental model in the wind tunnel is shown in Figure 2. Further details about the modeling, the instrumentation, the grid setup, the force balance, and the measurement strip arrangement are available in Yan et al. (2017).

Cross section of the flat closed-box deck (mm).
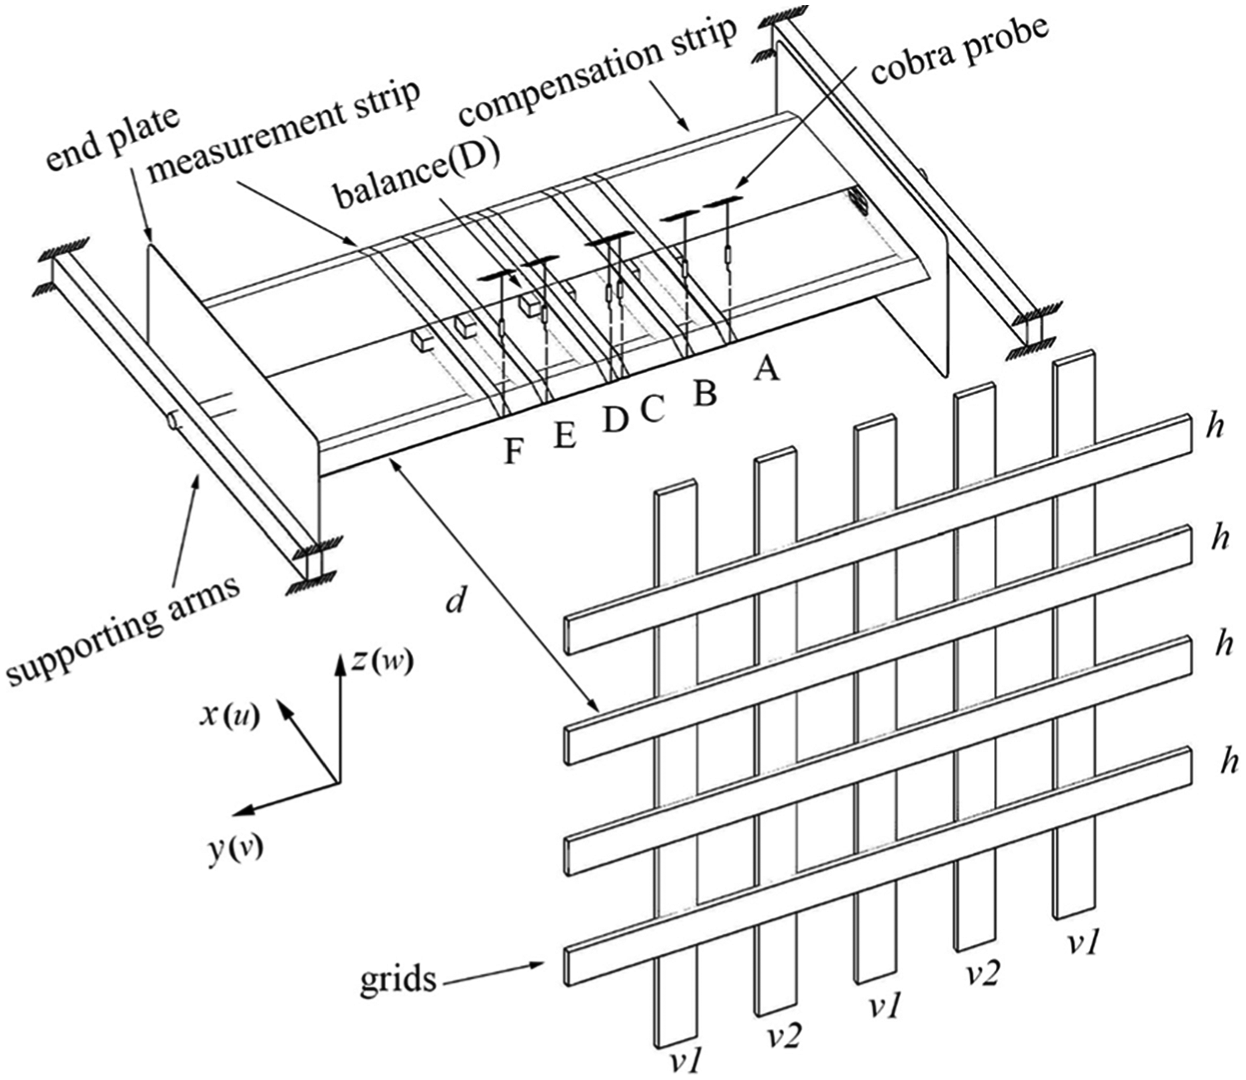
Schematic diagram of the experimental setup (model, force balances, grids, wind speed probes).
Three types of grid-generated turbulent wind fields were employed in the tests. They were achieved by adjusting the strip width of the grids and the distance between the grid section and the front wind fairing of the deck. As shown in Table 1, the turbulent wind fields generated by Grid B and Grid C possessed similar integral length scales of turbulence but different turbulent intensities, while those generated by Grid B and Grid D had similar turbulent intensities but different integral length scales. An isotropic turbulence model based on the von Karman spectrum (Mann, 1994) is used here for fitting the measured spectra of u, v, and w components of turbulent wind. A detailed discussion of the applicability of isotropic turbulence model in wind engineering can be found in the literatures (Larose, 1997; Mann, 1994).
Parameters of turbulence over Section D in three kinds of wind fields generated by Grids B–D.

The spectrum for u component can be expressed as

And that for both the v and w components is as follows

Here,
The following relationships exist between


Based on equations (19) and (20), the measured data of normalized auto-spectra of wind turbulence,

Normalized auto-spectra of wind turbulence over Section D in Grid B turbulence flow: (a) longitudinal component, (b) lateral component, and (c) vertical component.
Major test results
The tests focused on measuring the fluctuating lifts and torsional moments acting on the six strips of the motionless bridge deck model using six miniature five-component force balances. The tests were carried out in the three types of grid-generated turbulence wind fields with a mean wind speed of about 12.0 m/s. Both the fluctuating forces and wind speeds were acquired at a sampling frequency of 200 Hz, and the sample length was 131,072 data points corresponding to 655 s. The MATLAB software and Welch’s averaged modified periodogram method were adopted to estimate the power spectral densities of the measured fluctuating forces and wind speeds. The piecewise smoothing method was then applied to the spectral analysis of the measured data of both the fluctuating forces and wind speeds. Every acquired data sample was divided into 16 segments with an overlap length being a half of the segment. The block size for the fast Fourier transform (FFT) was equal to 8192. The Hamming window was also used in the spectral analyses of every data segments to reduce the leakage of signals in the frequency domain from one band to another.
Identified AAFs with different approaches
The measured fluctuating buffeting lift
The aerodynamic coefficients of the static lift and torsional moment of the bridge deck obtained by Zhu and Guo (2009) through force measurement test of sectional model were used here for the AAF identification. This is because the miniature five-component miniature dynamic force balances used in this study are of piezoelectric type and can measure only the dynamic component of forces and moments without the mean component. The static aerodynamic coefficients at the zero attack angle of wind were
Figure 4 shows the lift and moment AAFs with respect to the longitudinal component of turbulent wind speed u (

Aerodynamic admittances with respect to the longitudinal component of fluctuating wind velocity u: (a) lift AAFs in Grid B wind field, (b) moment AAFs in Grid B wind field, (c) lift AAFs in Grid C wind field, (d) moment AAFs in Grid C wind field, (e) lift AAFs in Grid D wind field, (f) moment AAFs in Grid D wind field.

Aerodynamic admittances with respect to the vertical component of fluctuating wind velocity w: (a) lift AAFs in Grid B wind field, (b) moment AAFs in Grid B wind field, (c) lift AAFs in Grid C wind field, (d) moment AAFs in Grid C wind field, (e) lift AAFs in Grid D wind field, (f) moment AAFs in Grid D wind field.
It can be seen from Figure 4 that
From Figure 5, it can be found that the value of
The
Figure 6 shows comparisons among the coefficient spectra of buffeting lift and moment on Section D measured in the three types of grid-generated turbulent wind fields and those reproduced with the AAFs identified with CSM and CLSM. It can be seen that although CSM can separate the AAF components with respect to the fluctuating wind velocity components of u and w, the auto-spectra of buffeting lift and moment coefficient reconstructed based on CSM deviate from the measured ones remarkably. This occurrence may be caused by the fact that the auto-spectral equations of buffeting forces are not included in CSM, and the correlation between the buffeting forces and the fluctuating wind velocities is generally rather weak, which may result in significant randomness and low accuracy of the identified AAFs. The auto-spectra of buffeting lift and moment coefficients reproduced based on CLSM agree with the measured ones very well because not only the equations of the cross-spectra between buffeting forces and fluctuating wind velocities but also the equations of the auto-spectra of buffeting forces are considered in CLSM.

Comparison among the reproduced and measured spectra of buffeting force coefficients: (a) lift coefficient spectra in Grid B wind field, (b) moment coefficient spectra in Grid B wind field, (c) lift coefficient spectra in Grid C wind field, (d) moment coefficient spectra in Grid C wind field, (e) lift coefficient spectra in Grid D wind field, (f) moment coefficient spectra in Grid D wind field.
It is then evident that the CLSM of auto- and cross-spectra is the most suitable one among the three compared methods for AAF identification. Therefore, CLSM is going to be adopted in the next step.
Influence of span-wise relative position between force and wind measurements
How to select a proper measurement position of fluctuating wind speed in wind tunnel tests of synchronous measurement of fluctuating force and wind speed for AAF identification is always a perplexing task. This is because a too close position of wind probe to the model will lead to the measured wind speed disturbed significantly by the model, while a too far position from the model may result in a notable difference between the measured wind speed and the ideal incident wind speed in the case without the model.
Considering the flows over the center of the deck model is disturbed generally more severely than the flow over the windward edge of the model and the longitudinal interval between these two positions is only 377.8 mm, the wind measurement position in this study was then set right over the windward edge of the model. To determine a reasonable vertical distance between the wind measurement position and the model surface, a pretest on turbulent wind was carried out over the windward edge of the model within a range of the vertical distance from 220 to 420 mm. The details of the pretest are not presented here for space limitation. It was found through the pretest that wind characteristics did not vary significantly within the range of the vertical distance from 320 to 420 mm. On this account, the distance of 320 mm (4.11 times of the deck model depth) was finally chosen for the wind measurement or cobra probe position over the windward edge of the model, and the turbulent wind at this position was regarded to be able to represent the oncoming one approximately.
Furthermore, there were six measurement strips on the sectional model as shown in Figure 2, which were originally for investigating the span-wise correlation of buffeting force. Each of them was supported by a force balance fixed on the internal metal frame of the sectional model. The span-wise intervals (along with the y-axis) between two neighboring measurement sections were 120, 180, 31, 180, and 120 mm, respectively. Correspondingly, six cobra probes were set at the positions right over the windward edges of the measurement strips at a distance of 320 mm to measure the incident turbulent wind speeds over the six strips. The measured fluctuating wind velocities by four of these six wind probes (Probes A–D) and the measured fluctuating forces on Strip D by Balance D in the turbulent wind field of Grid B are then used in this section to investigate the influence of the span-wise relative position between the force and wind speed measurements on the identified results of AAFs. The purpose of this work is just to check whether the turbulent wind needs to be measured only at one position in such a kind of force measurement test on multi-strips.
Figure 7 shows the modules and phases of the identified

Modules and phases of lift AAFs identified based on the measured data using four combinations of Balance D with each of probes A–D in Grid B wind field: (a) module of AAF with respect to u, (b) module of AAF with respect to w, (c) phase of AAF with respect to u, (d) phase of AAF with respect to w.
From Figure 7, one can also find that both the phase functions of the identified
Figure 8 displays the modules and phases of the identified

Modules and phases of moment AAFs identified based on the measured data using four combinations of Balance D with each of probes A–D in Grid B wind field: (a) module of AAF with respect to u, (b) module of AAF with respect to w, (c) phase of AAF with respect to u, (d) phase of AAF with respect to w.
Influences of turbulence characteristic parameters
By inspecting the AAFs’ curves, either obtained from analytical calculations or direct measurements, Larose (1997) proposed an empirical relationship between AAFs and turbulence parameters expressed as equation (23) for the lift and moment AAFs

where
Zhou (2011) proposed another more generalized empirical model expressed as equation (24) for the AAFs

where
The parameters in the two empirical models were fitted using the MATLAB software through a direct NLSF to the AAF data identified using CLSM. The target residue functions in NLSF were defined as follows:
For Larose’s model

For Zhou’s model

where
Figure 9 displays the fitted results of the identified

Lift and moment aerodynamic admittance components with respect to u in three grid-generated turbulences: (a) lift AAFs in Grid B wind field, (b) moment AAFs in Grid B wind field, (c) lift AAFs in Grid C wind field, (d) moment AAFs in Grid C wind field, (e) lift AAFs in Grid D wind field, (f) moment AAFs in Grid D wind field.
Figure 10 shows the fitted results of the identified

Lift and moment aerodynamic admittance components with respect to w in three grid-generated turbulences: (a) lift AAFs in Grid B wind field, (b) moment AAFs in Grid B wind field, (c) lift AAFs in Grid C wind field, (d) moment AAFs in Grid C wind field, (e) lift AAFs in Grid D wind field, (f) moment AAFs in Grid D wind field.
As a result, the fitted AAFs with Zhou’s model are chosen in the next study. Figure 11 gives a comparison among the fitted AAFs with Zhou’s model with respect to the fluctuating wind velocities of u and w over Section D, obtained, respectively, in the three types of the simulated turbulent wind field, where all the other test parameters were kept unchanged. The shapes of

Fitted AAFs with respect to the fluctuating velocities of u and w over Section D in the three types of turbulent wind fields: (a) fitted lift AAF with respect to u, (b) fitted moment AAF with respect to u, (c) fitted lift AAF with respect to w, (d) fitted moment AAF with respect to w.
As a summary, the lift and moment AAFs are not only dependent on the turbulent intensities of the oncoming flow but also affected by its integral length scales of turbulence.
Conclusion
The CLSM based on a colligated residue function of buffeting force auto-spectrum and cross-spectra between buffeting forces and turbulent wind speeds has been proved to be able to separate effectively the aerodynamic admittance components with respect to the longitudinal and vertical components of turbulent wind speed. It can also ensure the accuracy of the auto-spectra of buffeting forces at the same time.
The influence of span-wise relative position between the force and wind measurements on the module of AAFs has been confirmed to be very small.
The AAFs were found to significantly depend on the turbulent intensity and the integral length scale of turbulence of the incident wind.
Footnotes
Declaration of Conflicting Interests
The author(s) declared no potential conflicts of interest with respect to the research, authorship, and/or publication of this article.
Funding
The author(s) disclosed receipt of the following financial support for the research, authorship, and/or publication of this article: the National Natural Science Foundation of China (grant nos 51478360, 51323013, and 91215302). Any opinions and concluding remarks presented in this article are entirely those of the writers.