
Abstract
In current seismic design, earthquake-induced forces in secondary structures are estimated from the acceleration of the primary structure at the support of the secondary structure. However, recent studies had shown that the response of the secondary structure can significantly affect that of the primary structure, which will simultaneously modifies that of the secondary structure. To accurately estimate the response of the secondary structure, the interaction at the interface of the two structures needs to be considered. In this study, a scaled model consisting of primary and secondary structures was designed to capture the interacting forces. The degree of fixity of the secondary structure was varied. Two types of dynamic loading, that is, impact and harmonic loads, were applied to the model structures. The relationship between the interacting force and the response of the secondary structure is discussed. Empirical formulae for predicting the maximum displacement of the secondary structure based on the displacement spectrum at its base were proposed. The formulae provided more accurate prediction of the top displacement of the secondary structure considered, in comparison with that obtained from a conventional floor response spectrum.
Keywords
Introduction
Secondary structures are the non-load bearing elements in a structural system. They are not commonly designed to resist external loads such as those from earthquakes or impact loads. Hence, they are prone to damage even during minor earthquakes in which main structures are likely to survive (Chen et al., 2013; Chen and Soong, 1988; Naito and Chouw, 2003; Villaverde, 1997).
Previous studies had estimated that the cost of damage to the non-structural components of buildings can easily exceed that of the primary structure, both in terms of monetary and non-monetary loss (Ferner et al., 2014). Consequently, recent development in earthquake engineering research has included considerable effort towards understanding the seismic behaviour of secondary structures. Nevertheless, the current methods of preventing damage to secondary structures during earthquakes are still either inadequate or computationally costly.
In practice, if at all, the floor response spectrum approach (Biggs and Roesset, 1970; Ferner et al., 2014; Kapur and Shao, 1973; Penzien and Chopra, 1965; Sackman and Kelly, 1978) is often adopted, that is, the response spectrum of the primary structure is applied as the loading of secondary structures in the same manner as the ground motion spectrum to the primary structure. With this approach, however, the primary–secondary structure interaction (PSSI) is neglected and hence results in inaccurate predictions of the response of the secondary structure (Gillengerten and Naeim, 2001; Sackman and Kelly, 1979).
During an earthquake, secondary structures interact with the primary structure and induce forces at the interface between the subsystems (Lim and Chouw, 2015). Many past numerical studies have brought to light the significant correlation between these interacting forces and the response of the subsystems (Asfura and Kiureghian, 1986; Igusa and Kiureghian, 1985a, 1985b, 1985c).
Because of the complexity in involving all the influencing factors, it is almost impossible to determine the actual forces using numerical analysis alone. It is thus the aim of this research to quantify the interacting forces between the primary and secondary structures through physical experiments. The relationship between the interacting force and the response of the secondary structure is showcased. Using the experimental data, an empirical solution is proposed. The objective is to propose a prediction of the response of the secondary structure that takes into account its interaction with the primary structure.
Performed experiments
A series of experiments using an impact hammer and a shake table were carried out on a scaled model of a primary–secondary structure. The model is designed so that the interacting forces can be obtained. These forces depend heavily on the boundary condition of the secondary structure. In the experiments, the boundary condition is defined by the connection between the primary and secondary structures. Using different horizontal stiffness values of the connection, the effects of different boundary conditions of the secondary structures on the interacting forces and structural response are explicated.
Prototype and scaled model
The primary structure was a simple elastic fixed-base single-degree-of-freedom (SDOF) frame model. It is an approximate of the fundamental mode of a four-storey building, scaled by 15 in length. The frame model has an effective height hp of 575 mm and mass mp of 57 kg. The beam of the primary frame structure is considered rigid; thus, the frequency of the structure is governed only by the bending stiffness of the columns. The fundamental frequency fp and damping ratio ξp were 1.55 Hz (T = 0.65 s) and 4.8%, respectively. fp and ξp were the average values obtained from five free vibration tests without the secondary structure.
A secondary structure with a restrained roller support was located on the beam of the primary structure (Figure 1(a)). The sliding mechanism of the support was simulated using a set of near-frictionless linear guide rails. A small carriage, on which the secondary structure is bolted, was able to slide freely on top of the guide rails. The horizontal flexibility of the support was constrained using compression springs. The springs were installed between the ends of the carriage and at fixed points on the primary structure (Figure 1(b)).
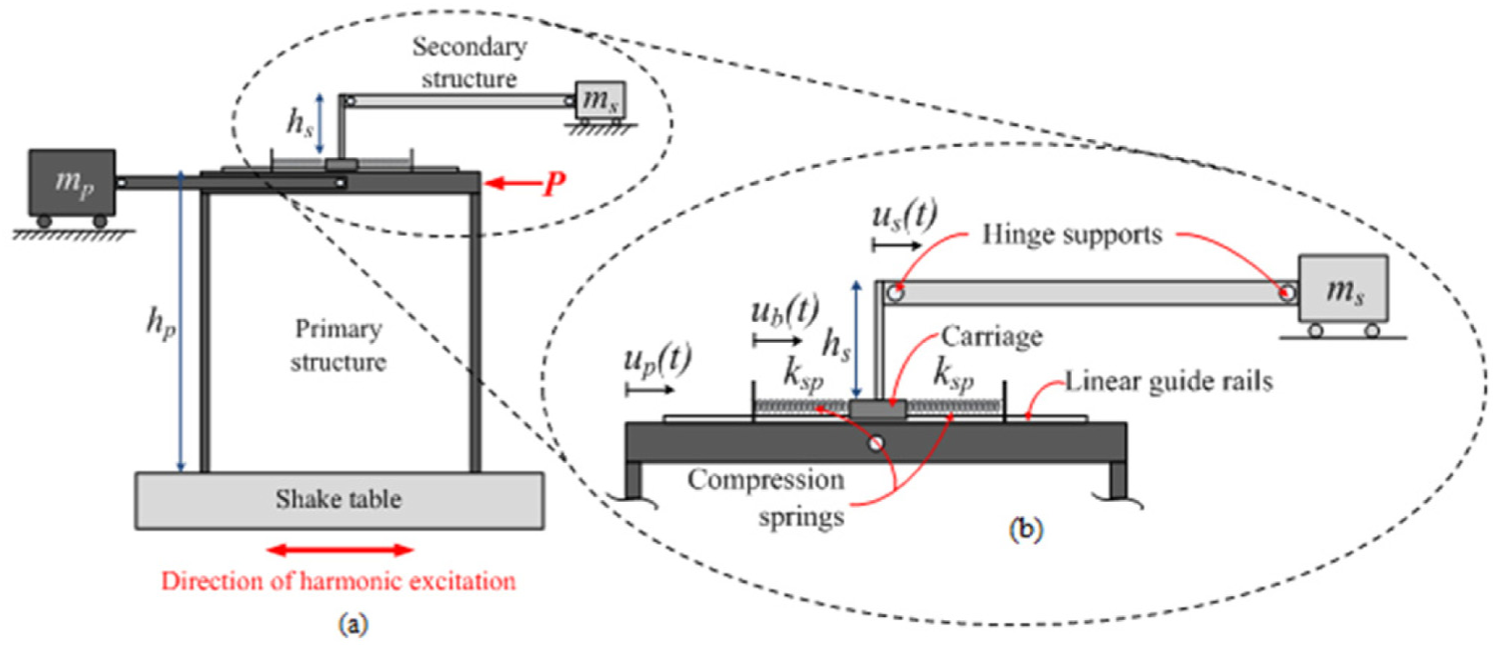
Sketch of the primary–secondary system: (a) whole setup and (b) details of the secondary structure.
This configuration was designed to allow alteration of the boundary condition of the secondary structure to obtain the horizontal forces at the primary–secondary structure interface. The actual setup of the spring connection is shown in Figure 2. The total displacement of the springs relative to the primary structure ub(t) was measured using a laser transducer (indicated by ‘×’ in Figure 2). The stiffness of each spring (ksp) was calculated using equation (1) and experimentally validated
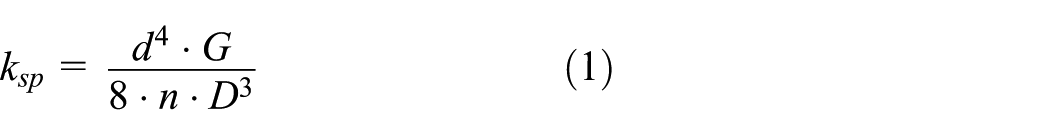
d refers to the diameter of the wire, D is the ring diameter of the spring, n denotes the number of coils and G is the shear modulus of the material which the springs are made of.
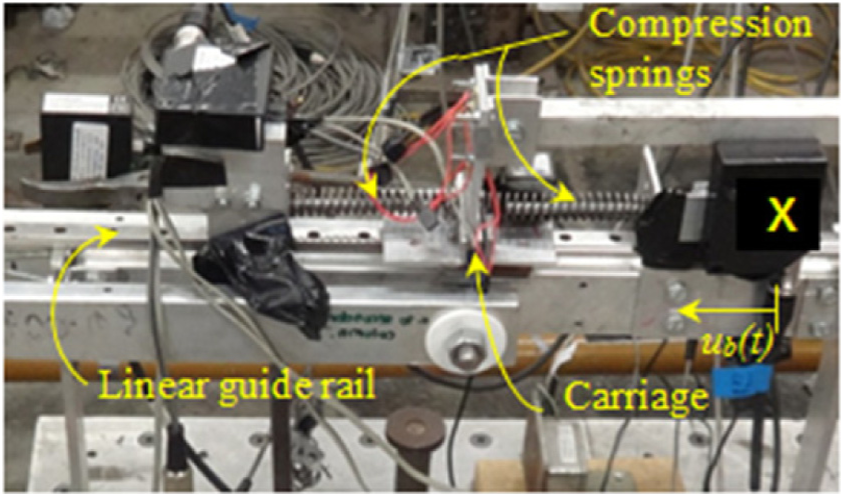
Details of the spring connection in experimental setup.
The force at the primary–secondary structure interface, denoted herewith as the interacting force Fh(t), can be calculated using the following equation

The secondary structure has a total height hs of 45 mm and mass ms of 1.89 kg. The fundamental frequency fs and damping ratio ξs were 10 Hz (T = 0.08 s) and 9.23%, respectively, obtained from five free vibrations of the secondary structure fixed at its base without the primary structure.
The mass ratio μ and frequency ratio η of the primary to secondary structures are calculated using equations (3) and (4)
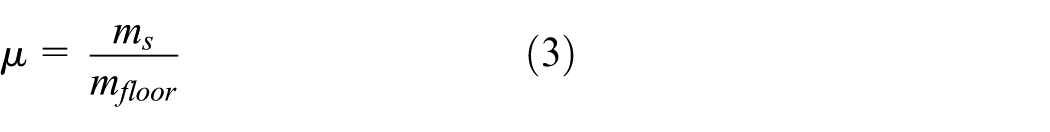
mfloor is the mass of the floor where the secondary structure was attached. When scaled down directly from the prototype, the mass of each floor would be 16.25 kg
Previous numerical studies stated that for PSSI to have a significant effect on structural response, μ must be at least 10% (Chen and Soong, 1988; Taghavi and Miranda, 2008). The mass and frequency of the secondary structure were selected so that μ is 12% and η is 6.06. These ratios represent substantial non-structural components such as generators, data acquisition system and communication equipment.
The bending moments of the primary and secondary structures were calculated from the strain measured at the lower end of the respective columns. The accelerations at the footing and top of both the primary and secondary structures were also recorded.
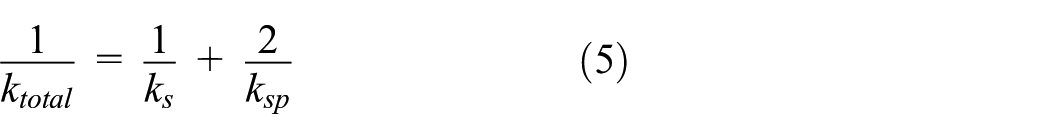
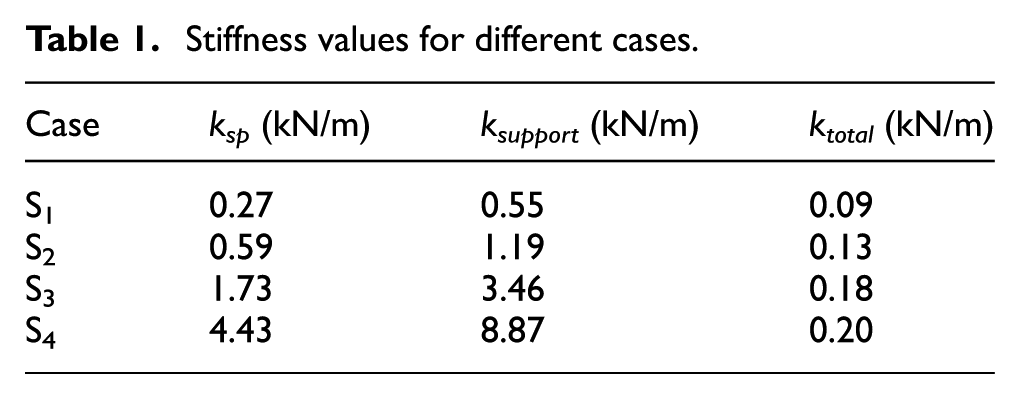
Two different configurations were considered: primary structure without secondary structure (Case S0) and those with a secondary structure. Four sets of springs with different stiffness values (Cases S1, S2, S3 and S4) were considered. Each couple of springs provides a collective stiffness of two springs (ksupport = 2ksp). The total stiffness ktotal of the secondary structure was calculated from the contribution of both the compression springs and the column of the secondary structure ks as illustrated in Figure 3.
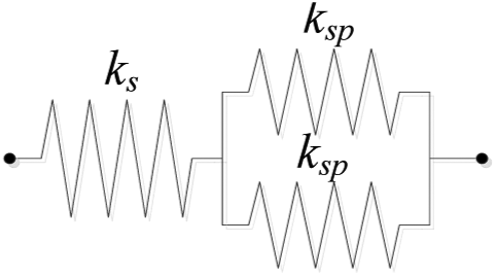
Total stiffness of the secondary structure.
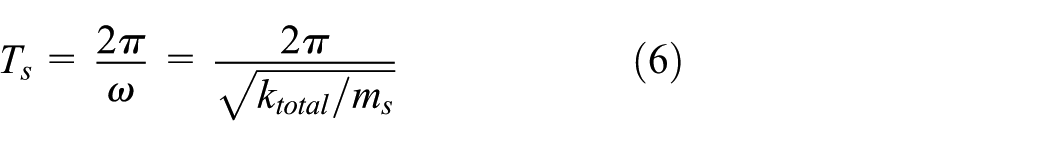
Thus, the total stiffness and period of the secondary structure can be expressed using equations (5) and (6), respectively
The spring stiffness
Stiffness values for different cases.
The conclusions from this research will complement those obtained from previous research performed by the authors for the secondary structure with fixed support, that is, no sliding allowed (Lim and Chouw, 2014, 2015). In this article, this configuration will be referred as Case S5.
Loading
Two different types of dynamic loading were considered, that is, impact and harmonic loads. ‘P’ in Figure 1(a) indicates the location where the impact is applied. The direction of the harmonic excitation at the base of the primary structure was also indicated in the same figure. In all load cases, the primary structure was bolted onto the shake table to ensure a fixed-base condition.
Each loading subjected to the system was controlled to ensure that the primary and secondary structures are within the elastic limit of the structure. A bending moment–displacement (up) relationship of the primary structure, as shown in Figure 4, was plotted following each test to confirm the linearity of the system and ensure that the system has similar damping in each test. The graph shown in Figure 4 was obtained from one of the impact tests for Case S1.
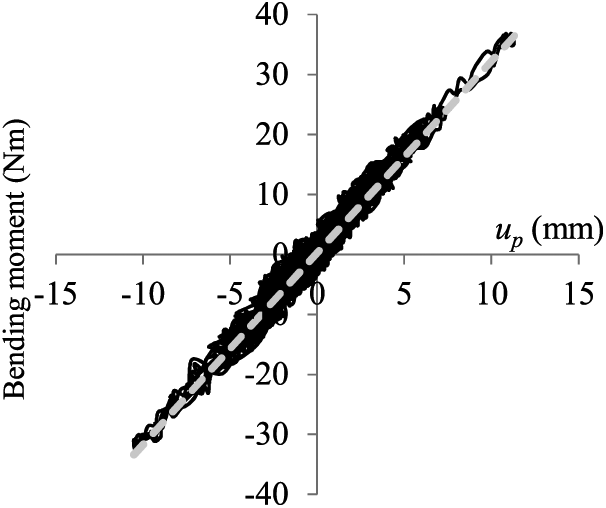
Linearity check of the primary structure.
Impact load
Impact was selected as the loading because the response of the structure following the impact is simply free vibrations of the structure at its natural frequency. Hence, the actual behaviour of the primary–secondary interaction can be clearly observed. Eight impact tests were performed on each configuration to ensure a consistent result. The impact hammer allowed the impact load to be measured, hence permitting comparable results across different tests.
The load and structural response for different impacts was scaled so that all impacts have the same maximum force. In the cases considered, all the impact forces after the scaling have very similar time histories. The corresponding scale factor is used to scale the response to allow for comparison. Figure 5 shows an example of the scaled impact force (Test 2) for Case S1. The area under the curve indicates the momentum applied to the structure due to the impact. All the results and conclusions presented in section ‘Response due to impact load’ are scaled to have the same maximum force and similar time history.
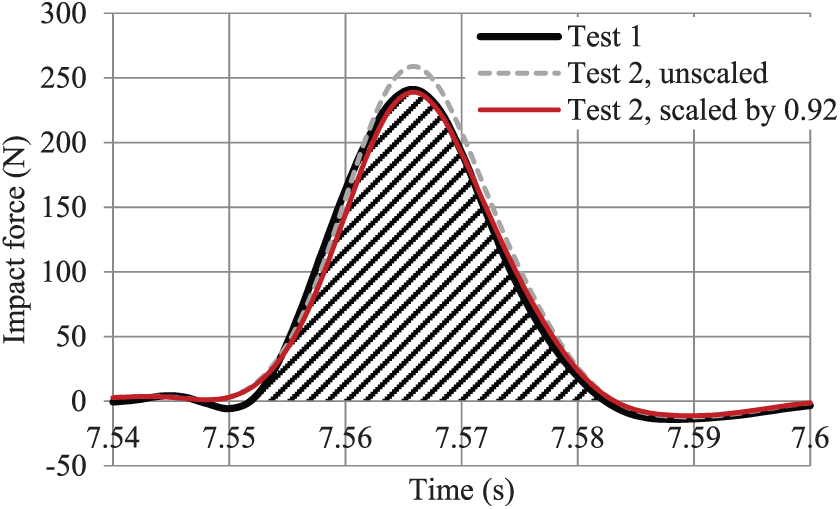
Scaled impact force to allow for comparison of the results obtained from different impact tests.
Harmonic load
The harmonic load used in this experiment was in the form of sinusoidal waves simulated using the shake table. The direction of excitation is shown in Figure 1(a). Equations (7) and (8) are the basic sine wave equations used to generate the load


A constant amplitude of acceleration Aω2 was selected, while the frequency was varied: 1, 1.25, 1.5, 1.65, 1.75, 2, 2.5 and 3–13 Hz with a 1-Hz increment.
Response due to impact load
To have a good clarity, only results from one out of eight tests performed for each configuration were shown in each graph. However, it was confirmed that all the eight tests of each configuration produced very similar results.
Interacting forces
The interacting forces Fh(t) calculated for all spring-based secondary structures shown in Figure 6(a) to (d) indicated that the maximum force is larger when the spring is stiffer (Case S4 > S3 > S2 > S1). The high-frequency component in the response is also more prominent as the stiffness of the spring increases. Comparison of the corresponding Fourier spectra presented in Figure 6(e) to (h) proved the presence of stronger high-frequency response of secondary structures with stiffer springs. The range of the high-frequency response was noticeably increased from Cases S1 to S4 (showcased in the circled regions in Figure 6(e) to (h)). This is likely due to the lower period of the secondary structure with stiffer springs.
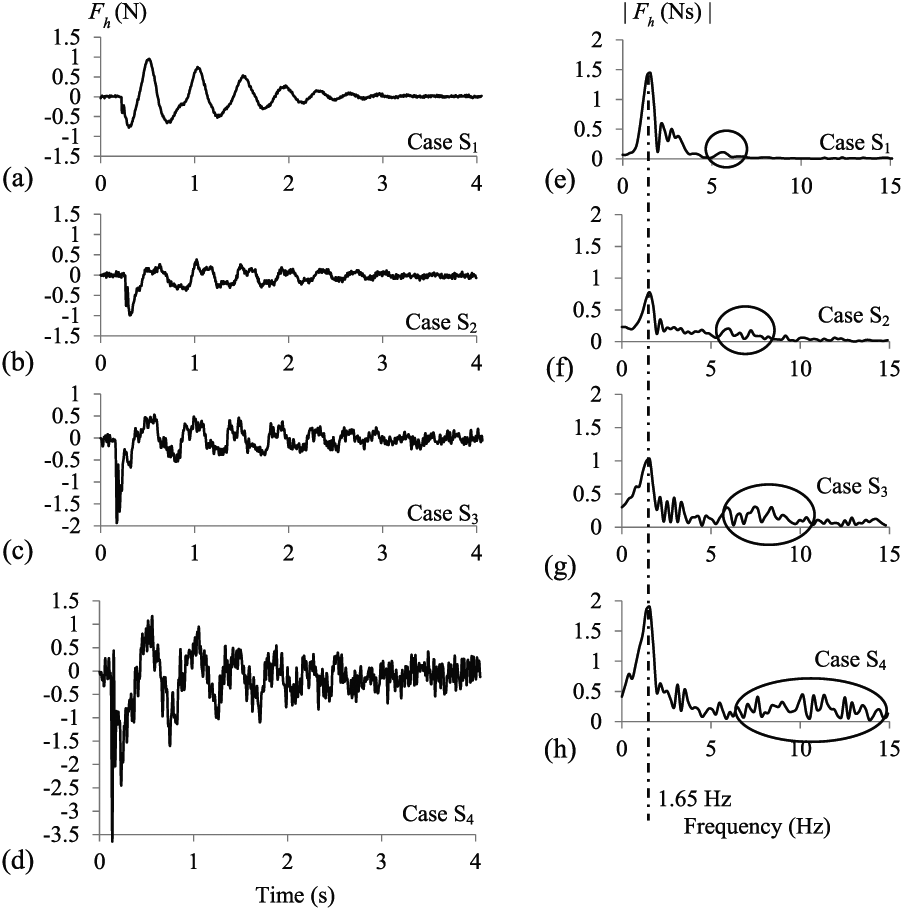
Interacting forces with more high-frequency content observed for stiffer springs: (a) to (d) time histories and (e) to (h) Fourier spectra in Cases S1–S4.
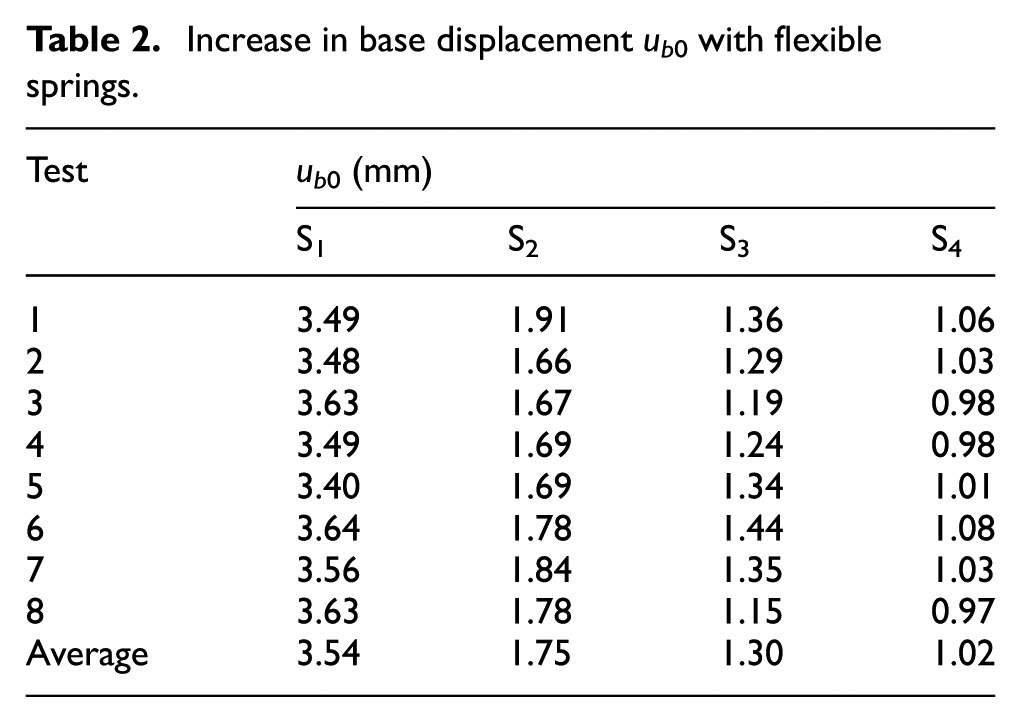
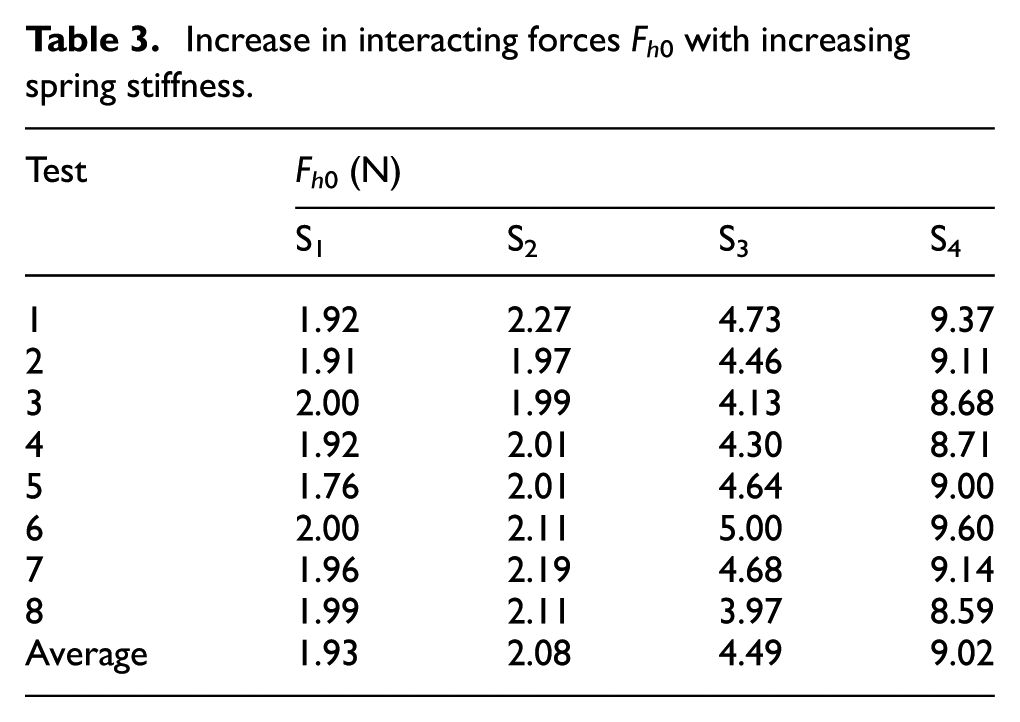
The maximum displacement at the base ub0 and the maximum interacting force Fh0, as well as the average values for each case are listed in Tables 2 and 3. As the stiffness increases, ub0 becomes smaller, whereas the average interacting force becomes larger.
Increase in base displacement ub0 with flexible springs.
Increase in interacting forces Fh0 with increasing spring stiffness.
Acceleration of the secondary structure
The time histories of the acceleration üs presented in Figure 6(a) to (d) were recorded at the top of the secondary structure. With a similar amount of impact energy transferred in the system (see Figure 5), the acceleration at the top of the secondary structure with stiffer springs was larger than those with more flexible springs. The impact energy transferred to the secondary structure was less due to the larger displacement of the flexible base. Hence, the effect of the impact load is more severe when the base springs of the secondary structure are stiffer. In all the tests performed, the dominant frequency of the response was the same, that is, 1.65 Hz. The value was slightly higher than the natural frequency of the primary structure (fp = 1.55 Hz). This is consistent with the findings proposed by the same authors for fixed-base secondary structures (Lim and Chouw, 2015), that is, the presence of the secondary structure increases the dominant frequency of the response of the primary structure.
In this work, the dominant frequency of the response due to the presence of the secondary structure will be labelled as fps. In the cases considered, fps was always 1.65 Hz whenever a secondary structure is present, independent of the stiffness of the springs.
Since the secondary structure itself is the same throughout all tests, the amplitude of the free vibration following the impact appeared to be similar (see the amplitude between the two horizontal dashed lines in Figure 7(a) to (d)). However, the high-frequency content of the free vibration shifted to a higher range as the spring stiffness increases (see the frequency range marked by circles in Figure 7(e) to (h)). This behaviour is consistent with that observed in the interacting forces presented in Figure 6(a) to (d).
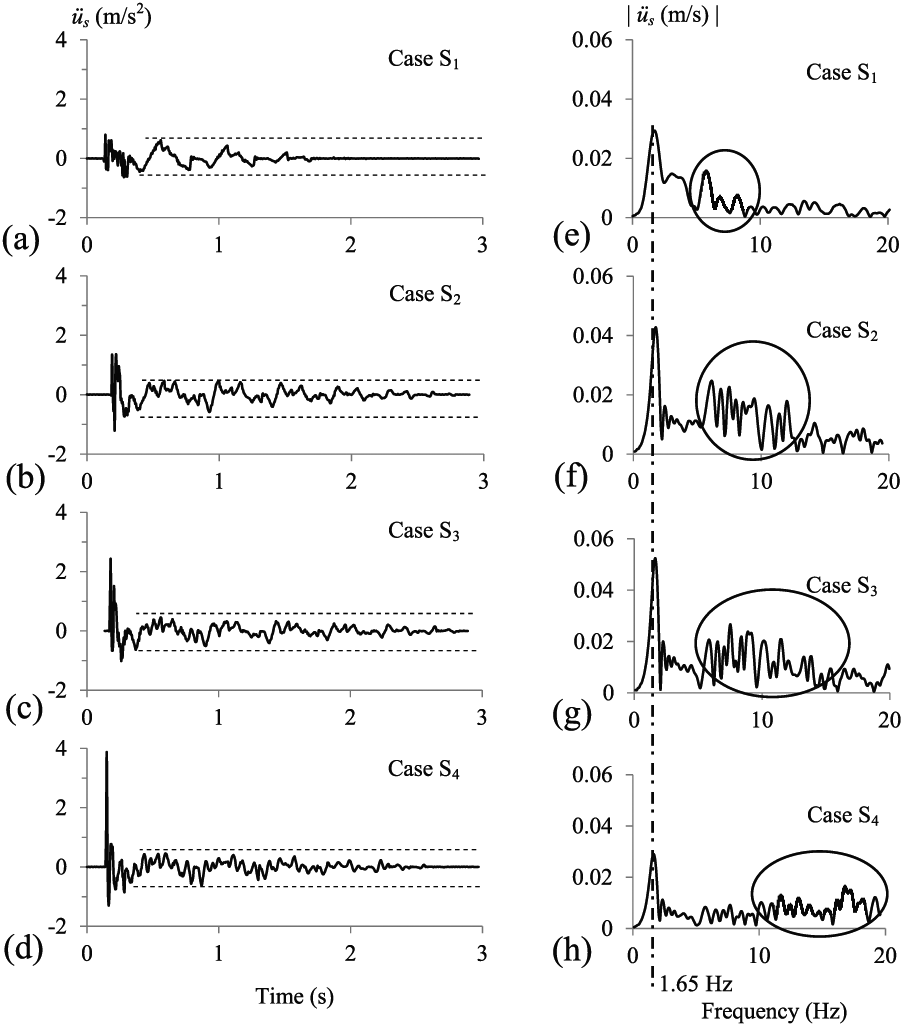
Stronger acceleration with stiffer springs: (a) to (d) time histories and (e) to (h) the corresponding Fourier spectra of Cases S1–S4.
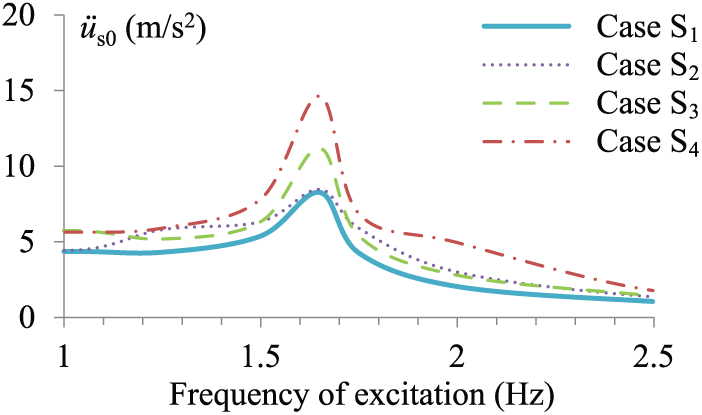
Table 4 presents the maximum acceleration at the top of the secondary structure. The values increase proportional to the stiffness of the springs.
Effect of the support stiffness of the secondary structure on üs0.
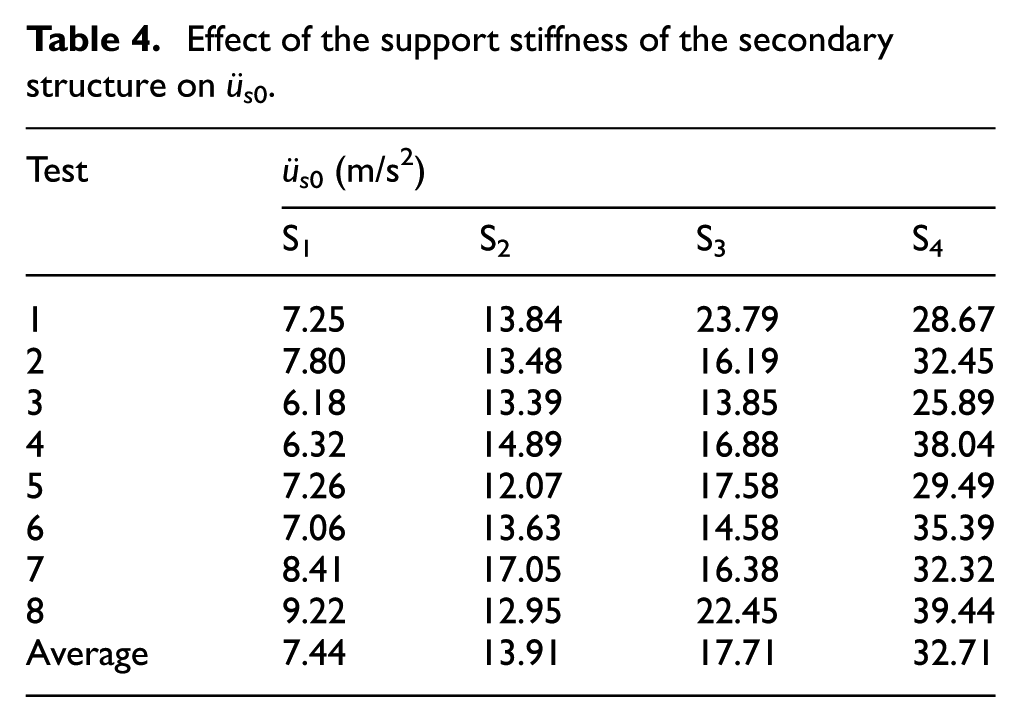
Based on the trend of the results in Tables 2 and 4, it can be concluded that more flexible supports (represented by springs with lower stiffness) result in smaller accelerations and larger displacements. Thus, it is recommended that acceleration-sensitive secondary structures are designed to have more flexible supports, whereas in the case of displacement-sensitive secondary structures, fixed supports should be selected.
Acceleration of the primary structure
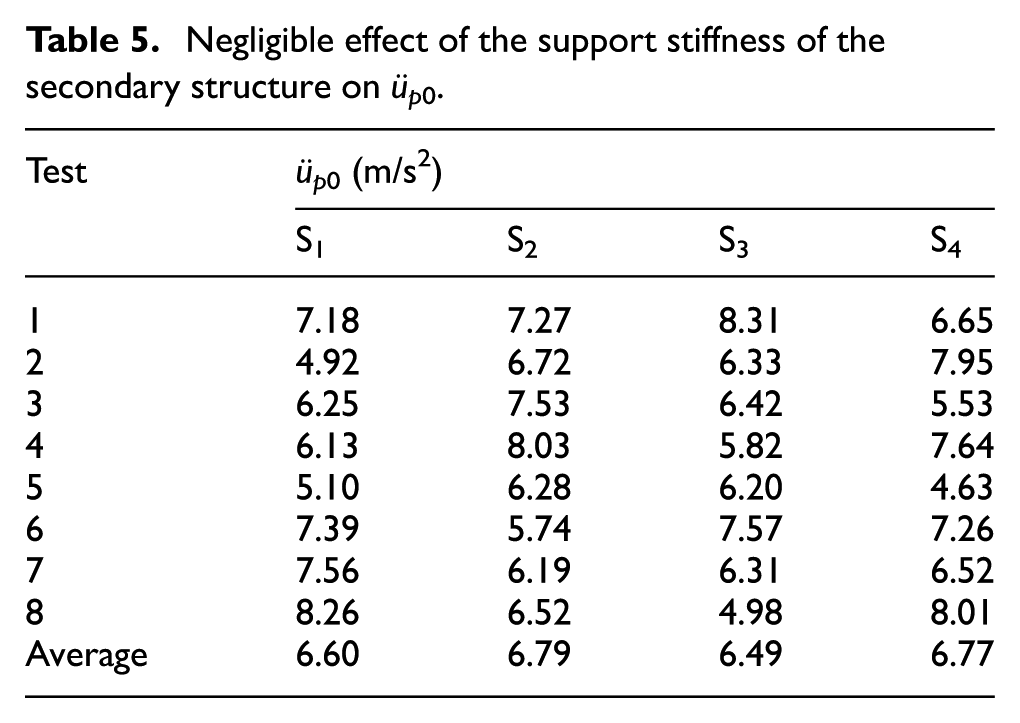
Due to the impact load, the initial acceleration of the primary structure immediately after the impact was a sharp peak characterising a very high-frequency response. The maximum acceleration of the primary structure due to each impact varied slightly throughout different tests and cases, as shown in Table 5. The average value for different cases is between 6.5 and 6.8 m/s2.
Negligible effect of the support stiffness of the secondary structure on üp0.
Following the impact, the primary structure experienced free vibration. For all four cases, these free vibrations are very similar in terms of amplitude and frequency, implying that the influence of the secondary structure support was negligible, that is, the free vibration of the primary structure is mainly determined by the frequency of the combined primary and secondary structure system (fps) (see Figure 8).
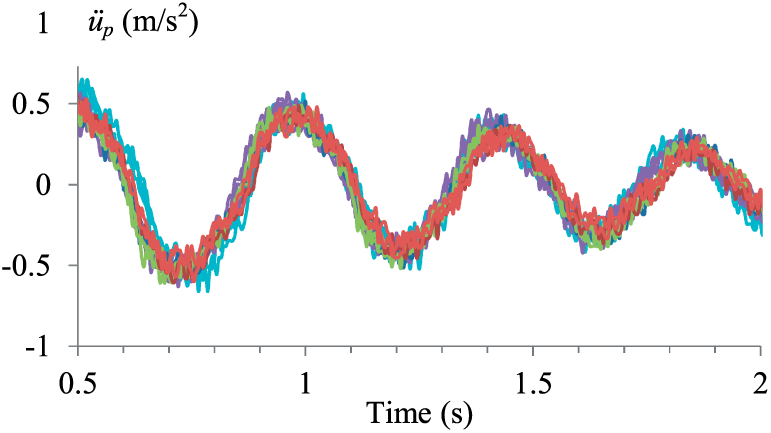
Negligible effect of different fixities of the secondary structure on the free vibrations of the primary structure following the impact.
Response due to harmonic load
Acceleration at the top of the primary and secondary structures
Since the amplitude of the excitation was the same, the different response in each test is purely due to the relationship between the frequency of the system and that of the harmonic load.
Figure 9(a) to (d) shows the comparison between the measured maximum accelerations of the primary and secondary structures for each case. The graphs focus only on the response up to 3 Hz because the amplitude decreases asymptotically when the frequency of the load is larger than 3 Hz.
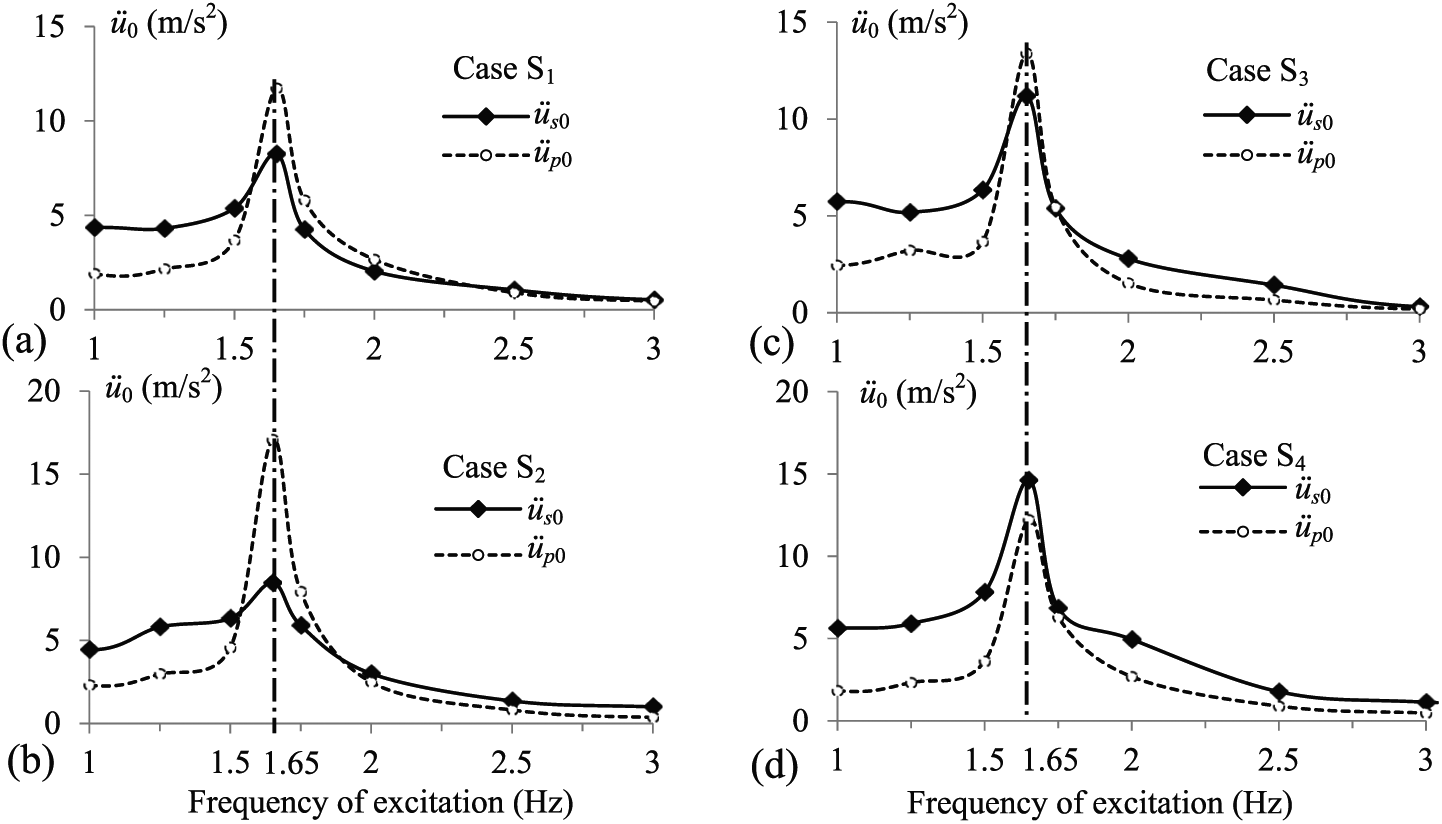
Comparison between the maximum acceleration of the primary and secondary structures: for Cases (a) S1, (b) S2, (c) S3, and (d) S4.
When the frequency of the excitation is closest to the natural frequency of the primary structure (including the secondary structure), that is, at 1.65 Hz, the maximum accelerations of the primary structure were always larger than the acceleration of the secondary structure for all cases except for that of Case S4 (with the stiffest spring). Case S4 involved a secondary structure with very stiff springs, hence the response showed similar behaviour to that of a fixed-base case. This finding agrees with conclusions from previous experimental studies performed by the same authors for fixed-base secondary structures (Lim and Chouw, 2014). In that study, the secondary structure was not allowed to slide, that is, fixed base, and the excitation used was simulated earthquakes.
In terms of the effect of the spring stiffness on the response of the primary structure, the maximum acceleration is highest in Case S2; followed by Case S3, S4; and the lowest was Case S1 (see Figure 10). This behaviour agrees with the finding from the impact test shown in Table 5.
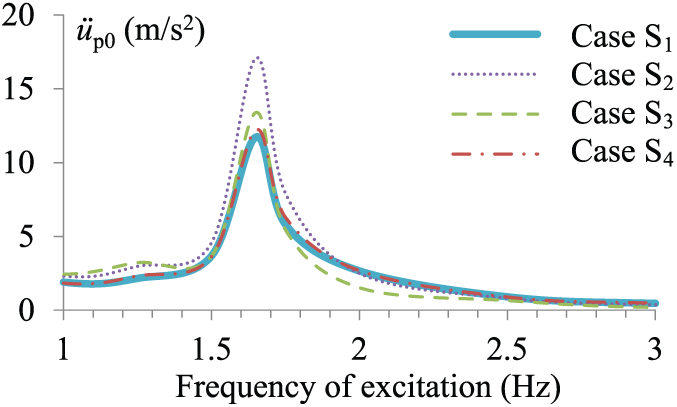
Maximum acceleration of the primary structure.
However, the maximum acceleration of the secondary structure is increasing with the stiffness of the springs, as shown in Figure 11. The same conclusion was drawn when impact load was considered (Table 4).
Maximum acceleration of the secondary structure.
Comparison with numerical calculations
Prediction of the response of the secondary structure using a numerical approach
Using conventional design method (Penzien and Chopra, 1965; Sackman and Kelly, 1978), the response of the secondary structure under any loading can be calculated based on the following equations of motion


mp, cp and kp denote, respectively, the mass, damping and stiffness of the primary structure.
Equation (10) can be rewritten so that the input load of the secondary structure is expressed in terms of displacement rather than acceleration

Since the base of the secondary structure is allowed to displace relative to the primary structure, the displacement of the base of the secondary structure relative to the primary structure ub(t) is used

The calculated displacement spectra of ub(t) due to impact for the considered cases are presented in Figure 12. The damping ratio used was 9.23% to match that of the secondary structure. In Case S5, the secondary structure was fixed directly onto the beam of the primary structure (no sliding). The frequency of the secondary structure fixed at its base without the primary structure was 10 Hz and is indicated in Figure 12 with a vertical dashed-dotted line.
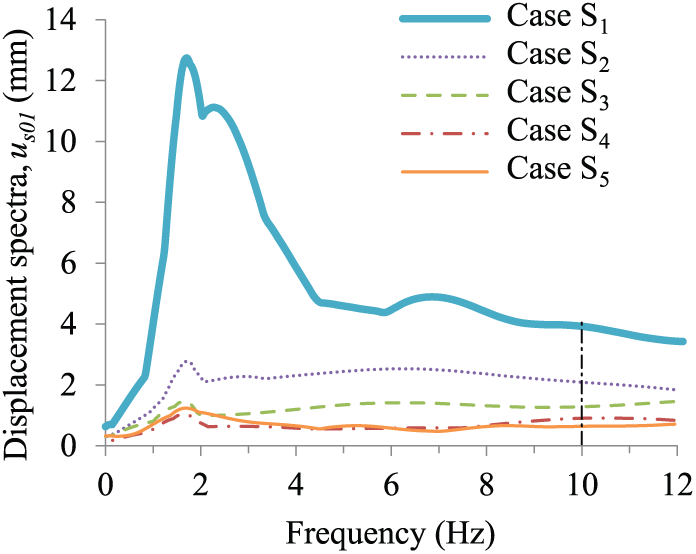
Displacement spectra us01 calculated from ub(t).
The maximum displacements of the secondary structure (fs = 10 Hz), predicted using up(t) and ub(t) were compared to the measured maximum displacement, as shown in Figure 13.
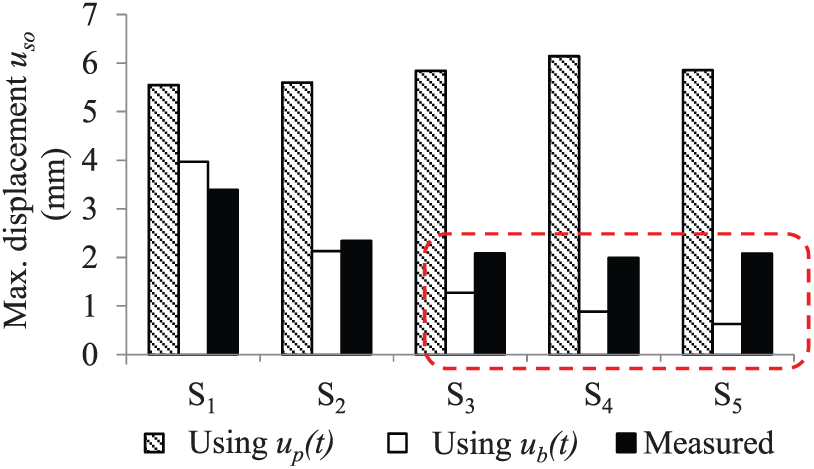
Accuracy of the predicted maximum displacement using up(t) and ub(t).
As anticipated, ub(t) predicted the actual displacement better than up(t). Note that the measured maximum displacements of the secondary structure remained almost constant when the base is less flexible (S3, S4 and S5), whereas the predicted displacement decreases with the support stiffness (indicated by the dashed region).
Empirical formula derived from the impact tests
Using the ratio of the predicted and measured displacements due to impact, an empirical formula is derived (see Figure 14 and equation (14)).
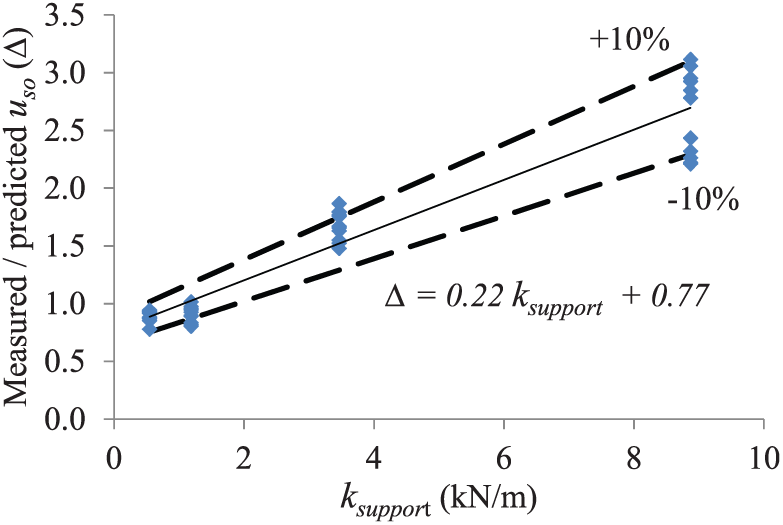
Empirical correction factor Δ for predicting us0.
If the stiffness of the support ksupport and the displacement at the base of the secondary structure ub(t) are known, the maximum displacement at the top of the secondary structure ucorrected can be predicted

us01 is the predicted maximum displacement of the secondary structure using the displacement spectrum of ub(t). Δ is the correction factor derived empirically from the impact tests performed with different degrees of fixity of the secondary structure. The correction factor Δ can be determined from equation (14) and was proved satisfactory for a standard deviation of ±10%

Effectiveness of correction factor Δ
To evaluate the effectiveness of the correction factor Δ, equations (13) and (14) were applied to estimate the displacement of the secondary structure due to harmonic loads. Figure 15 presents the displacements due to harmonic loads, predicted using equation (13) (ucorrected) and those measured (us0). The corresponding predicted maximum displacement obtained from displacement spectra of the base (us01) were also displayed for comparison.
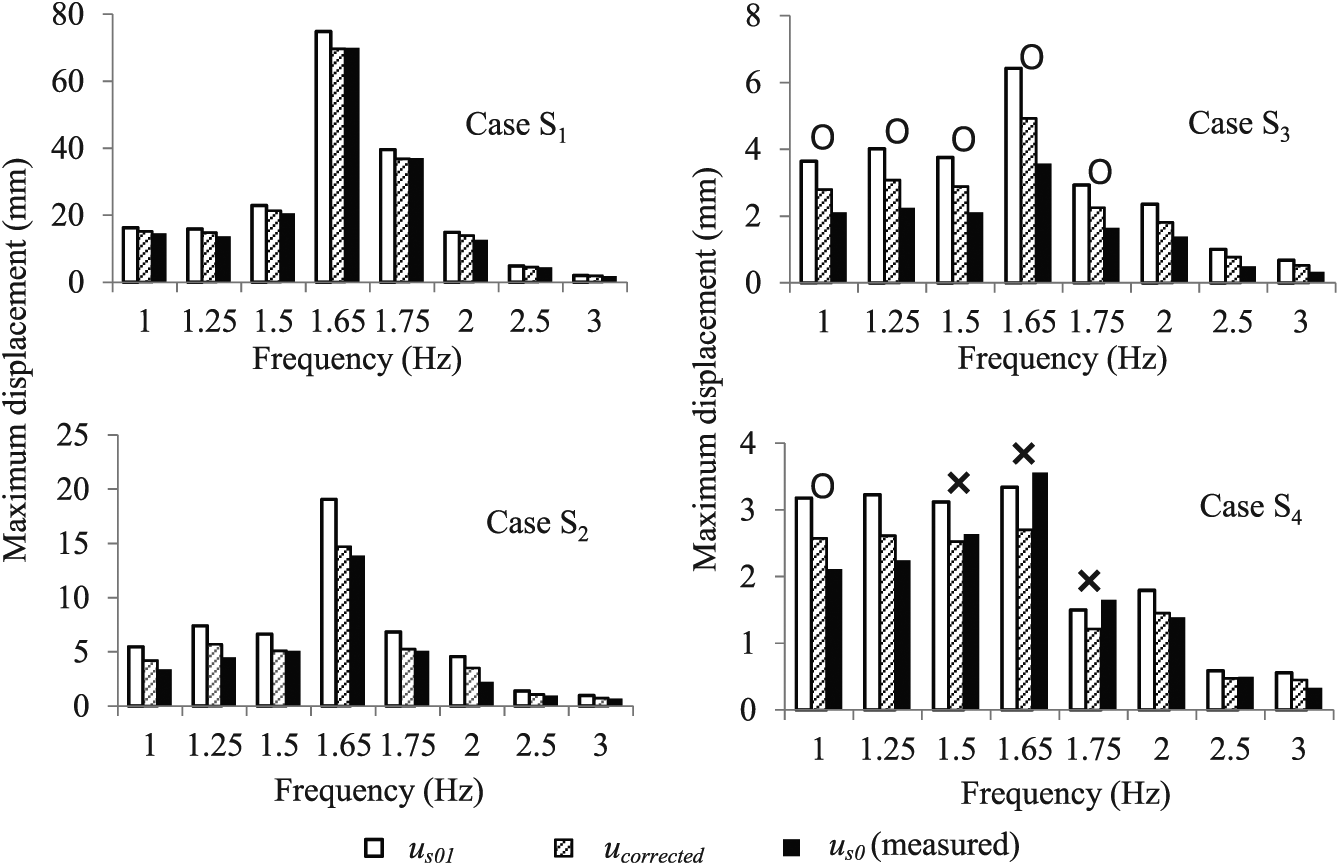
Effectiveness of equation (13) in predicting us0.
On average, the correction factor Δ appears to predict the response of the secondary structure well for Cases S1 and S2, but unsatisfactory for Cases S3 and S4. The ‘×’ and ‘o’ in Figure 15 indicate inapplicable predictions, that is, when the prediction was below the actual measured displacement and when the error exceeds 30%, respectively.
In order to further improve the accuracy of the prediction, an additional correction factor based on the support stiffness is derived. Figure 16 plots the maximum base displacements
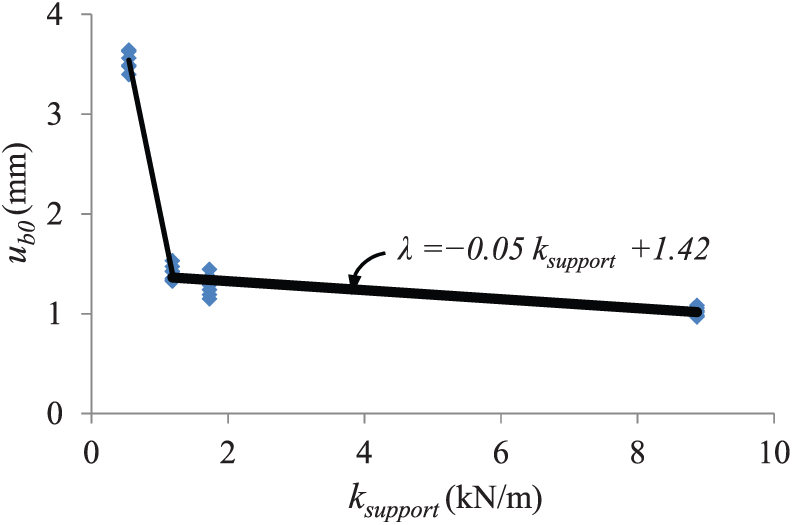
Correction factor for the case of stiff support.
The slope represented by the thick line in Figure 16 is expressed in equation (15)

In the cases considered, the prediction was acceptable for Cases S1 and S2. This means, for ksupport as low as 1.19 kN/m, no further correction was necessary. Assuming the value of λ for Case S2 is equal to 1 (λ1 = 100%). Hence, the corrected displacement for Cases S3 and S4 can be written as
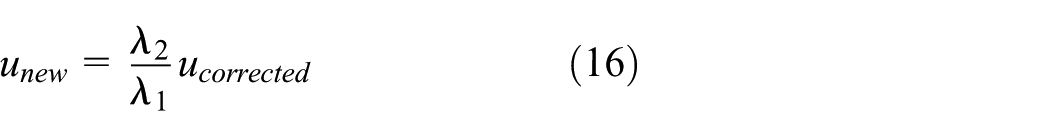
λ2 for each Case S3 and Case S4 must be calculated from equation (16) based on the actual support stiffness.
Figure 17 shows the new us0 calculated from equations (15) and (16). The new prediction unew matches with the measured us0 better for the two cases of stiffer springs. The only exception was when the frequency of excitation for Case S4 was 1.5 Hz. In this case unew overpredicted 22% larger than the measured displacement. Nevertheless, the prediction was still better than that from us01 and ucorrected.
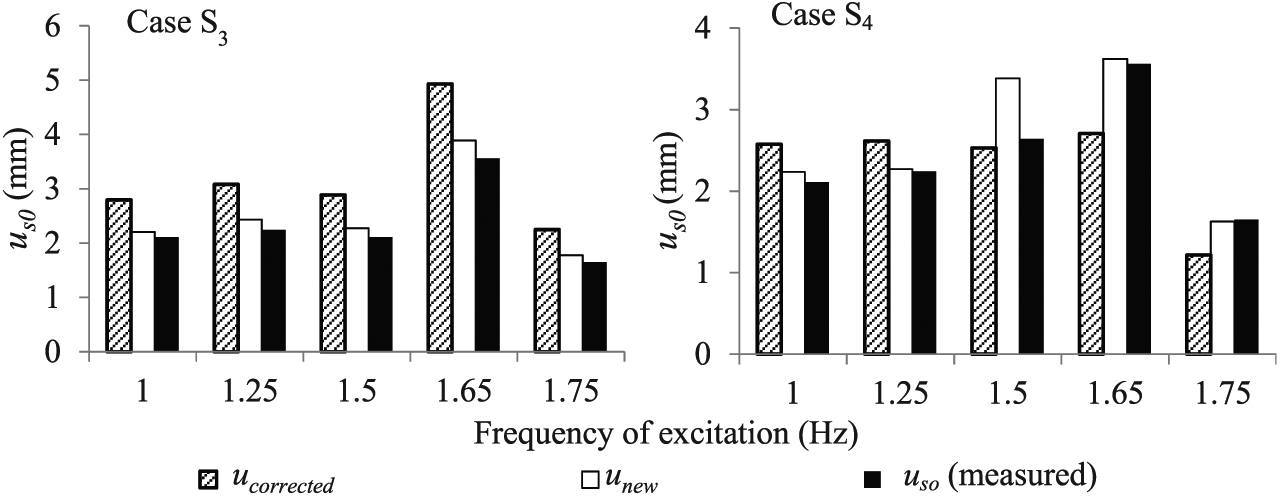
Good prediction of us0 using equations (15) and (16).
Conclusion
This research focused on the response of the primary and secondary structures due to impact and harmonic loads. Impact loading was chosen to showcase the interacting force between the primary and secondary structures because it induced free vibrations of the two systems, thus allowed the true nature of their dynamic attributes to be observed more clearly. Harmonic load was also carried out in order to validate of the findings obtained from the impact tests in the case of more realistic ground motions. The degree of fixity of the secondary structure was varied to study its influence on the response of both subsystems. In total, 130 tests were performed. The experimental results revealed that
The interacting force at the primary–secondary structure interface increases with increasing stiffness of the springs supporting the secondary structure.
The acceleration of the secondary structure increases with increase in stiffness of the supporting springs (whereas displacement decreases with increasing spring stiffness). Based on the experimental results, it is recommended that acceleration-sensitive secondary structures should be designed with flexible supports, whereas displacement-sensitive secondary structures should be designed with stiff supports.
Empirical formulae to predict the displacement of the secondary structure using the displacement at its support and its base stiffness were proposed. The formulae provide better prediction of the response of the secondary structure compared to conventional floor response spectrum approach.
Further studies including secondary structures with different dynamic properties as well as incorporating more complex primary structure should be performed to enable wider application.
Footnotes
Acknowledgements
Special thanks to Geoffrey Pot and Laure Rouanet for their contributions to the preparations of the experiments.
Declaration of Conflicting Interests
The author(s) declared no potential conflicts of interest with respect to the research, authorship and/or publication of this article.
Funding
The author(s) disclosed receipt of the following financial support for the research, authorship and/or publication of this article: Ministry of Business, Innovation and Employment through Natural Hazards Research Platform for the Award UoA 3708936 for the scholarship granted for the first author.