
Abstract
The zones where tunnels pass through faults are considered to be severely damaged during earthquakes. Site investigation of tunnels crossing faults revealed that there were different types of damage patterns after earthquakes. This article proposed a new seismic design concept of “guiding” and “yielding.” Two types of joints, multilevel brittle-flexible joint and flexible joint, were based on this concept and were investigated in this study. A series of shaking table tests were conducted on reduced scale tunnel models under two steps of the loading process, fault movement and subsequent seismic excitation with increasing intensities. The results showed that both types of joints clearly reduced the seismic responses of the tunnel lining. The idealized behavior—step-like deformation—appeared along the longitudinal direction of the tunnel in the two tests. No shear failure of the tunnel linings was found, and the longitudinal cracks in the crown, arch springing, and invert were common in the tests. The multilevel brittle-flexible joint was verified to be more appropriate for tunnels subject to massive earthquakes.
Introduction
For many years, tunnel engineering has always been considered to have a better aseismic capacity compared with the ground buildings in high-intensity earthquake areas. In recent years, many strong earthquakes, such as the Chi-Chi earthquake in Taiwan (1999), the Kocaeli earthquake in Turkey (1999), and the Wenchuan earthquake in China (2008), have shown that tunnel structures are susceptible to severe damage (Chen et al., 2012b; Durukal, 2002; Hashash et al., 2001; Li, 2012; Shen et al., 2014; Wang and Zhang, 2013; Wang et al., 2001; Yu et al., 2016). For example, following the 2008 Wenchuan earthquake, over 30 tunnel linings were reported to have cracked with different types of cracks found in almost all the tunnel linings (Wang et al., 2009). Investigations into the extensive earthquake damage indicated that zones through active faults were the most damaged parts of the tunnel structures (Wang et al., 2001). Of the most seriously damaged tunnels, such as the Longxi tunnel, the Longdongzi tunnel, and the Zipingpu tunnel in the Wenchuan earthquake (2008), nearly all passed through active faults. The major damage patterns of fault-crossing tunnels are illustrated in Figure 1, which include longitudinal cracks, shear failure, cracks and spalling perpendicular to the direction of the tunnel axis, the cracks along the tunnel axis, and uplift of the invert. Consequently, much attention should be paid to the study of aseismic measures for tunnels crossing active faults in high-intensity earthquake areas.

Damage patterns of tunnels through faults after the Wenchuan earthquake, 2008, China: (a) longitudinal crack at the crown of lining observed in the Jiujiaya tunnel, (b) sheared off damage observed in the Jiujiaya tunnel, (c) lining spalling at the sidewall in the Longchi tunnel, (d) multitransverse cracks observed in the Longdongzi tunnel, (e) longitudinal cracks at the invert in the Longxi tunnel, and (f) uplift of the invert in the Longxi tunnel.
There are an increasing number of studies on anti-seismic and damping measures for tunnels passing through faults. The proposed anti-seismic and damping measures mainly include the enlarged opening approach, the damping layer, and the absorbing joint (Caulfield et al., 2005; Shimamura et al., 1999; Stirbys et al., 1999). However, the enlarged opening approach inevitably makes the cross section of the tunnel excavation too large. This is disadvantageous for the stability of tunnel structures. The damping layer has little effect on reducing the damage to the tunnel structure in the fault zone. The absorbing joint changes the range of damage to a small area, but this area is completely sheared off between segments, which generates a large relative displacement between the segments of tunnel linings. Therefore, it is disadvantageous for traffic repair operations after earthquakes. However, it is important for the lifeline engineering to be repaired quickly. In general, the aforementioned anti-seismic measures mainly belong to passive designs, based on “reducing” the seismic response of tunnels and “resisting” the displacement of tunnels imposed by earthquakes. In recent years, some researchers have proposed flexible joints for tunnel structures within fault zones. In 2002, flexible structures were adopted in the Bolu tunnel in Turkey, which crosses the Zekidaği fault and the Bakacak fault, and the lining was divided into segments and connected with relatively small stiffness joints (Russo et al., 2002). In 2005, a flexible lining was designed for the Koohrang-III water transmitting tunnel in Iran, which is within a region of active faults; this lining was analyzed through theoretical and numerical methods to study dynamic response characteristics in the longitudinal direction (Shahidi and Vafaeian, 2005). The design criteria were based on the allowable longitudinal deflection and angular distortion, which could accommodate the movement in the case of fault rupture.
Designing joints within regions of active faults creates preferential fault displacements and enables the lining to adapt to fault movement, so that the segments of the tunnel lining generate step-like displacements. This solution also confines the potential damage to a small area without uncontrolled propagation. In summary, both theoretical and numerical methods have been conducted to verify the aseismic measures for the tunnels running through faults, while few experimental studies have been conducted for tunnels with joints. Consequently, model tests are necessary for in-depth understanding of the seismic response characteristics and failure mechanisms of the joints used in tunnel structures. In addition, multilevel joints combining brittleness and flexibility have seldom been designed for tunnel construction in high-intensity earthquake areas. In this study, based on the new seismic design concept of “guiding” and “yielding,” two new types of joints, multilevel brittle-flexible joints and flexible joints, are proposed to investigate the different seismic response characteristics and failure mechanisms for tunnel structures during strong earthquakes.
Experimental setup
Tunnel description
A tunnel model was built based on the Longxi tunnel on the Du-Wen Highway, which was severely damaged during the Wenchuan earthquake. The Longxi tunnel is located near the epicenter of the Wenchuan earthquake. The tunnel is in the southern part of the Chaping Mountains between Longxi town and Yingxiu town in Dujiangyan, which is on the left bank of the Min River. This tunnel runs through an active fault. Note that the fault is a non-causative fault. It has a horseshoe shape with excavated dimensions of 9.20 m in width and 8.04 m in height. The stability grade of the surrounding rock in the hanging wall and in the footwall is IV, and the fault fracture zone is V, according to Code for Design of Road Tunnel in China (JGJ 70-2004).
Test facilities
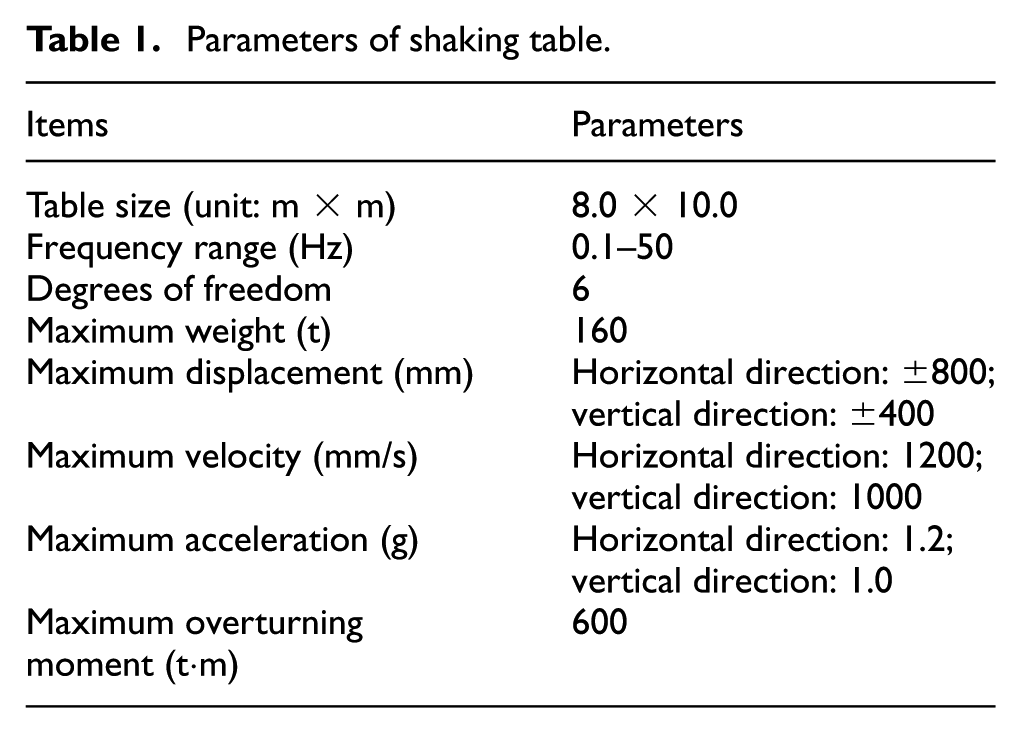
The shaking table tests were conducted at the National Engineering Laboratory for Technology of Geological Disaster Prevention in Land Transportation at Southwest Jiaotong University. The size and load capacity of the shaking table are the largest in China, as shown in Figure 2. The shaking table is a 6-degree-of-freedom platform, with dimensions of 8 m × 10 m. Other parameters of the shaking table are shown in Table 1.

Shaking table (8 m × 10 m).
Parameters of shaking table.
The model test was carried out in a rigid model box with a length, width, and height of 2.5, 2.5, and 2 m, respectively, which was bolted to the shaking table, as illustrated in Figure 3. The expanded polystyrene (EPS) geofoam material was stuck to the sidewall of the model box to absorb the seismic energy of the boundary reflection. This was to minimize the impact of the boundary effect of the rigid model box, which had been demonstrated by other researchers (Chen et al., 2012a; Sun et al., 2011). A layer of mortar concrete was laid at the bottom of the model box to increase the friction between the bottom of the model box and the model soil. This prevents relative displacement during the seismic motion.
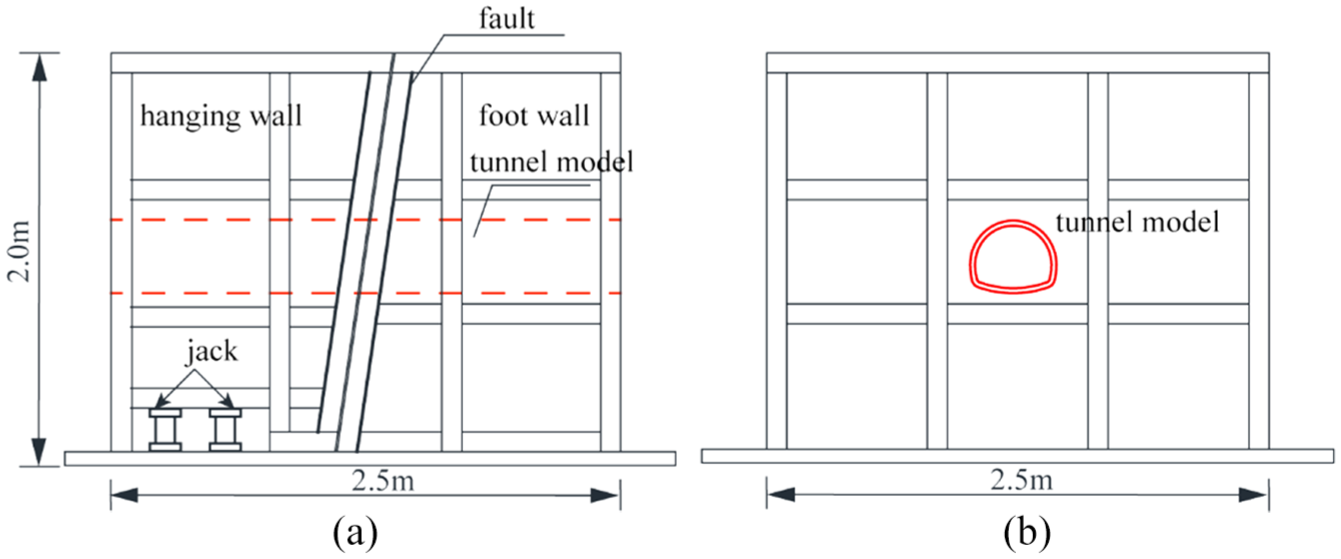
Rigid model box for shaking table: (a) lateral view and (b) frontal view.
Law of similarity and model materials
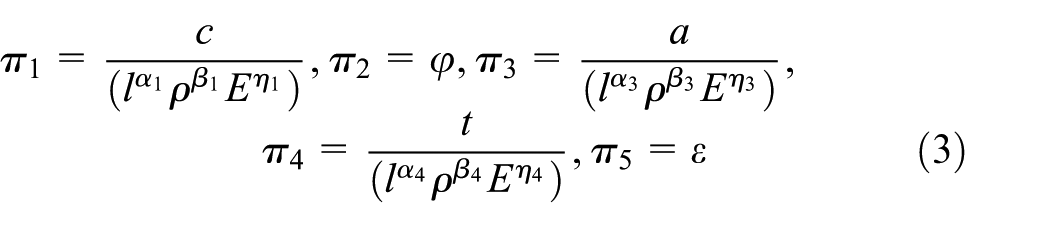
Satisfaction of similar relationship is significant for scale model tests to obtain reasonable experimental data. The similarity relations and conditions between the test model and the prototype were derived on the basis of the Buckingham-π theorem (Yang, 2005). The parameters should satisfy the following function

where l, ρ, and E are length, density, and Young’s modulus, respectively, and they are regarded as the fundamental physical variables, while c, φ, a, t, and ε are cohesion, friction angle, acceleration, time, and strain, respectively. φ and ε are dimensionless variables.
The dimensionless similarity criterion function can be expressed as

where π terms are independent dimensionless products of the physical quantities, l, ρ, E, c, φ, a, t, and ε.
Equation (2) can then be formed as
where αi, βi, and ηi are arbitrary values.
The dimensions of l, ρ, E, c, a, and t are L, ML–3, ML–1T–2, ML–1T–2, LT–2, and T, respectively, given that M, L, and T are the fundamental dimensions. Substituting these dimensions into equation (3), the following equation can be obtained

According to the dimensional consistency, the similarity criterion of all the aforementioned parameters can be deduced, as shown in Table 2.
Similarity relation for shaking table tests.

In the experiment, the similarity ratio of gravitational acceleration should be 1.0, because the gravity conditions of the experiment are consistent with the actual tunnel engineering conditions. The strain characteristics and the dynamic responses between the model and the prototype should be consistent, so the similarity ratio of strain should also be 1.0.
Based on the tunnel construction drawings of the Longxi tunnel, the conditions of the shaking table, and the size of the model box, the geometric similarity ratio of the model was set to 1:30, the similarity ratio of the density was 1:1.5 and the similarity ratio of the elastic modulus was 1:45. Other similarity ratios used in this article can be derived from equation (4) and are listed in Table 2.
The materials of the model test play a significant role in the experiment. Only by accurately simulating the geological conditions of the actual tunnel can valid data be obtained. The material for the model tests mainly includes the similar material of the surrounding rock, similar material of the tunnel lining, and the seismic measures. The selection of similar materials mainly considered mechanical parameters, such as the cohesion of the surrounding rock, the internal friction angle of the surrounding rock, the elastic modulus of the surrounding rock, the elastic modulus of the concrete lining, and the compressive strength and density of the concrete lining.
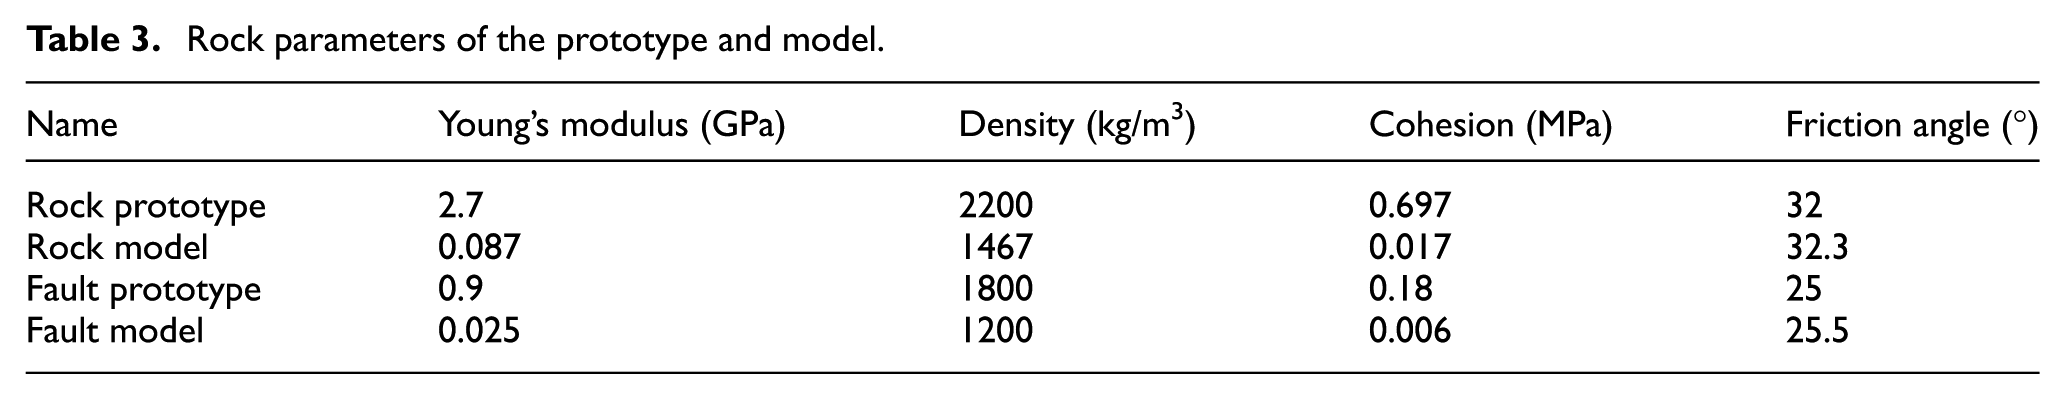
After the matching tests, the similar materials of the hanging wall, footwall, and fault fracture zones were simulated with a certain proportion of mixture of river sand, machine oil, and fly ash. The ratio of the soil in the hanging wall and footwall was 50:40:10 (fly ash:river sand:machine oil), and the ratio for the fault fracture zone was 57:31:12 (fly ash:river sand:machine oil). Table 3 shows the specific mechanical parameters.
Rock parameters of the prototype and model.
The similar material of the surrounding rock was placed uniformly into the model box and tamped down to predetermined markings by the use of a special heavy hammer. A sample was then taken by a cutting ring to test the mechanical parameters. After this similar material met the required conditions, the surface of the layer was roughened with a hook, and then the next layer was added. These steps resulted in no stratification in the model soil. The material was added as multiple layers, and the thickness of each layer was 0.2 m. When the filling was completed, the experimental model was left at rest for 24 h to reach the soil self-equilibrium stage. After that, if there was no damage to the lining and the joints, the experiment would continue.
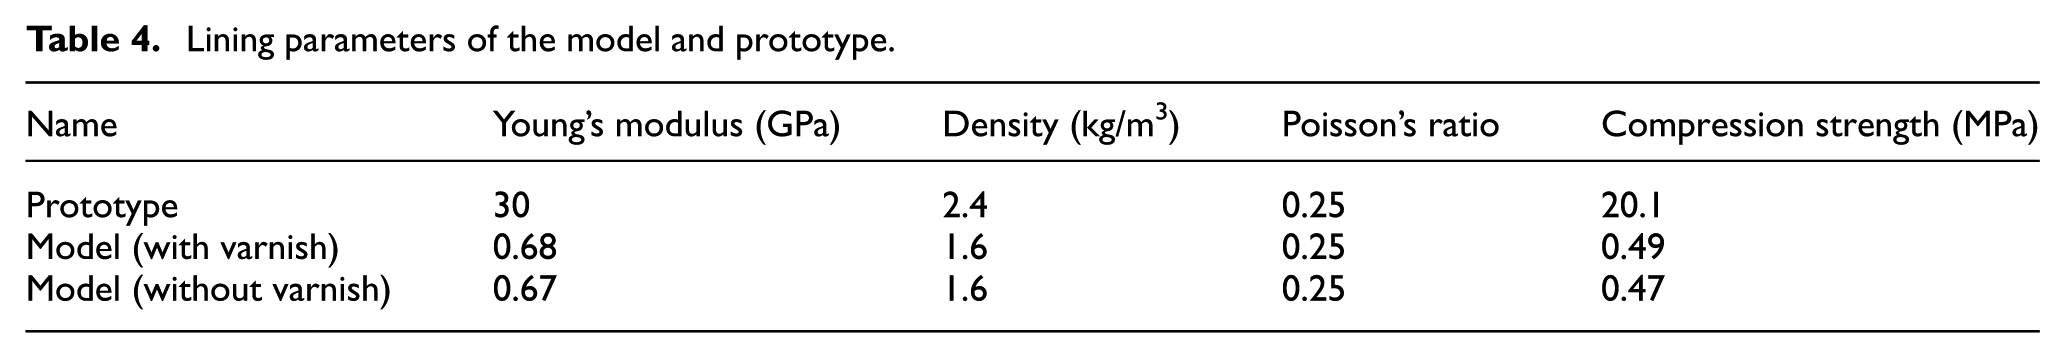
The mechanical parameters of the tunnel lining were obtained from real engineering data. After comparison and testing of several trials of materials, water, plaster, diatomite, quartz sand, and barite were used to simulate the tunnel lining with a ratio of 1:0.6:0.2:0.1:0.4. The mechanical parameters are shown in Table 4. However, plaster is noticeably affected by humidity and temperature, particularly the humidity. The physical parameters of the samples measured are quite different under different conditions. Therefore, a very thin coat of varnish was brushed on the surface of the model lining to control water absorption of plaster, which had little effect on the physical parameters, as shown in Table 4. Meanwhile, the maintenance conditions of the lining were strictly controlled, and the tests should be performed under the same environmental conditions.
Lining parameters of the model and prototype.
In this experiment, the model lining was fabricated using a mixed slurry of five materials with steel wire mesh in the middle of the lining to simulate the tunnel lining and rebar, respectively (Figure 4(a)). The thickness of the tunnel lining was designed as 2 cm according to the similarity relation (Figure 4(b)).

Preparation of the lining: (a) steel mold for fabricating tunnel lining and (b) segmental lining.
This article proposes two new joints for tunnel structures through active faults, changing the anti-seismic design concept from the traditional “resistance,” and “reducing” to “guiding” and “yielding” (active measures). The “guiding” is guiding the forced displacement to the joints between segments to decrease lining deformation. The “yielding” is that the joints yield and even break to release energy and reduce the damage of the lining when relative displacements are large enough. The idealized behavior of the tunnel in the longitudinal direction after shaking is step-like displacement, rather than brittle rupture at a certain cross section. Two types of joints were designed in the model tests, Joint 1 and Joint 2. Joint 1 combined brittleness and flexibility, and Joint 2 combined flexibility and ductility. The specific fabrication steps for these measures are as follows:
Joint 1 contains two parts. One is plaster slurry and rubber with a proportion of 2:1, arranged in the space between the segments. The other is a rubber layer with a width of 6 cm, wrapped outside the segments. The length of the joint between segments is set to 2 cm, in view of engineering practice. The rubber was laid on the joint section first, and then the plaster slurry was cast in the reserved space. Finally, the rubber layer was covered on the joint section. This joint was a combination of flexible rubber and brittle plaster. The brittle failure of Joint 1 is used to reduce damage to the lining during earthquakes. The stiffness of Joint 1 was made smaller than that of the lining, so the joint failure is prior to the failure of the lining to dissipate earthquake energy. When a small earthquake occurs, Joint 1 can resist earthquake excitation because of the load-bearing capacity of the plaster and the coordinated deformation ability of the rubber. When a high-intensity earthquake occurs, the energy of ground vibrations can be “led” to the joints, and destruction of the brittle plaster can release most of the energy (Figure 5(a)).
Joint 2 also consists of two parts. One part is tying steel wire at the connection between the lining segments, as shown schematically in Figure 5(b). Then, a rubber layer is used to cover the steel wire. The length of the joint is the same as that of Joint 1 (2 cm). The stiffness of the joint is also made smaller than that of the lining. An inelastic deformation occurs before the failure of the joint during an earthquake due to the ductility of the joint. The deformation of the joint could dissipate earthquake energy to reduce damage to the lining. This joint is obviously much more flexible than the lining. When a small earthquake occurs, due to the flexibility and ductility of the steel wire, each segment has more freedom and adaptive deformation, and proper movement between the segments can reduce the energy on the tunnel linings. When a massive earthquake hits, the joints are preferential areas for the fault displacement and shear failure to occur instead of the lining. The flexibility and ductility of Joint 2 can also release some energy. This type of joint also provides the advantage of concentrating potential damage in some segments, without uncontrolled propagation, which is more beneficial for quick repairs after an earthquake.
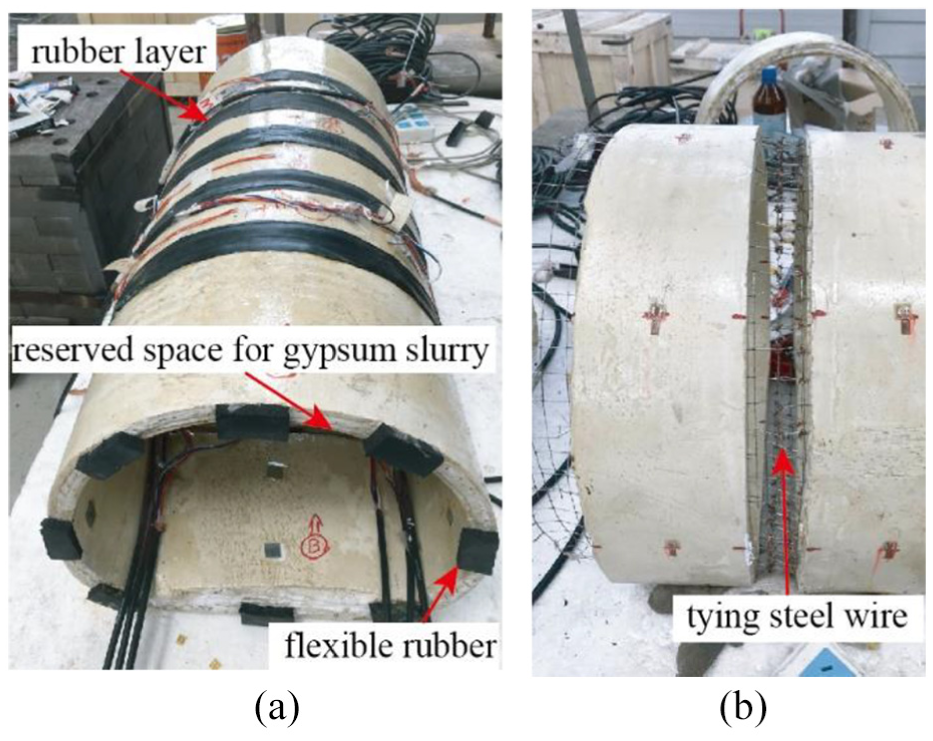
Structures of the two joints: (a) Joint 1 and (b) Joint 2.
Sensor layout
To ensure accuracy of the results, the same arrangement of sensors was adopted in the experiments because the two tests were comparison tests. Figure 6 shows the sensor locations. The segments of the lining, from left to right, were named A, B, C, D, E, F, G, and H, respectively. Five monitoring sections were designed during the tests. Monitoring section III was located inside the fault fracture zone. Monitoring sections I and V were located on both sides of the fault at equal distances, and this is also the case for monitoring sections II and IV. Strain gauges were stuck on each observation section both inside and outside of the lining. Monitoring sections II, III, and IV near the fault zone are affected more by the fault, and the strains change more during the tests, while monitoring sections I and V are affected less by the fault, and the strains change less (Liu et al., 2015). In the tests, monitoring sections II, III, and IV were set as main monitoring sections and monitoring sections I and V were set as secondary monitoring sections. In addition, taking the symmetry and channel number limitations of the data acquisition system into consideration, monitoring sections II, III, and IV were designed for full-ring strain gauges, and half-ring strain gauges were arranged at monitoring sections I and V, as shown in Figure 6(b) and (c). Thirty-nine strain gauges (BX120-3AA) were used in each test and had resistance values of 120.2 Ω ± 0.1%, sensitivity coefficients of 2.05% ± 0.28%, and dimensions of 3 mm × 2 mm. The strain gauges in monitoring sections II, III, and IV were set at the crown, the shoulder, the arch springing, and the invert, while the strain gauges in monitoring sections I and V were set at the crown, the arch springing, and the invert. Monitoring sections I, II, III, IV, and V were set to monitor the influential range of the tunnel by the fault. Monitoring sections II and IV were used to investigate the strain characteristics of the tunnel in the hanging wall and footwall areas.

Instrumentation for the seismic damage tests: (a) longitudinal sections for layout of sensors, (b) monitoring sections II, III, and IV for layout of strain gauges, and (c) monitoring sections I and V for layout of strain gauges.
Seven accelerometers were installed in the model tests and were denoted as A1, A2, A3, A4, A5, A6, and A7, as illustrated in Figure 6(a). Six accelerometers are piezoelectric acceleration transducers (TST120A500), with a measurement range of ±10 g, sensitivity of 0.516 V/g, and weight of 60 g, and the other is a magnetoelectric velocity transducer (TST125H) with a measuring range of ±20 m/s2, sensitivity of 0.345 V/(m/s2), and dimensions of 63 mm × 63 mm × 63 mm. One mode of the transducer is used to measure the accelerations. The accelerometers were fixed on the invert of each designed monitoring cross section. One of the accelerometers was installed just above A3 on the top of the model soil. Another accelerometer, A7, was mounted on the bottom of the model box to monitor the input acceleration excitation history. Accelerometers A1 to A5 were used to study the acceleration of the area affected by the fault. Accelerometers A3 and A6 were set to investigate the acceleration amplification effects on vertical section of the fault fracture zone. The acceleration responses of the lining at equal distances from the fault of the hanging wall and footwall were recorded by A2 and A4.
Analysis steps
Some fault-crossing tunnels near the epicenter are subjected to combined fault dislocation and seismic excitation, such as the Longxi tunnel. In an earthquake, some of the faults cause the earthquake itself while others are faults moved following a coseismic deformation field. The latter situation was concerned in the tests. It has always been a great challenge to simulate the loading process for tunnels crossing faults under the effects of earthquakes. There are two main research methods for this project, quasi-static fault dislocation and earthquake excitation. For the first research method, many researchers have studied the behavior of tunnel structures using theoretical analysis, numerical analysis, and experimental methods (Baziar et al., 2014, 2016; Gregor et al., 2007; Lin et al., 2007; Newmark and Hall, 1975; Vazouras et al., 2010). Scholars have mainly applied the second research method through use of numerical simulations and model tests (Burridge et al., 1989; Pakbaz and Yareevand, 2005; Wang et al., 2015). However, both methods do not consider the influence of both fault movement and ground motions on tunnels during earthquakes. When the fault movement occurs during an earthquake, it is hard to predict. In addition, considering the limitations of the shaking table test conditions, the tunnel was simplified to be subjected to fault movement first and then to seismic excitation in the tests.
In the first step, the fault slip was generated by downward displacement on the hanging wall side. The actual tunnel was offset by 1 m due to fault movement after the Wenchuan earthquake in 2008 (Cui et al., 2011). According to the similarity relation, the dislocation distance should be set at 3.3 cm for the experiments. In this experiment, the dislocation distance was rounded to the nearest 3 cm. Four jacks were used simultaneously to release 3 cm at the bottom of the hanging wall. This step is considered to simulate normal fault movement.
In the second step, the model was subjected to seismic excitation. Because the effect of the presence of the non-causative fault on the earthquake wave was less compared with the hanging-wall/footwall effect for the seismogenic fault, the earthquake wave difference between the upper and lower plate is ignored in the tests. The acceleration time history of these tests was based on the EW-component of seismic waves in Mao County in the Wenchuan earthquake. The seismic wave during the period of 20–165 s monitored by bedrock monitoring stations was selected. The wave was scaled according to a time similarity ratio of 1:5.5, as shown in Figure 7. The most significant impact on the tunnel is horizontal shear waves during earthquakes (Wang, 1993). Therefore, the input seismic wave was a horizontal shear wave perpendicular to the tunnel axis.
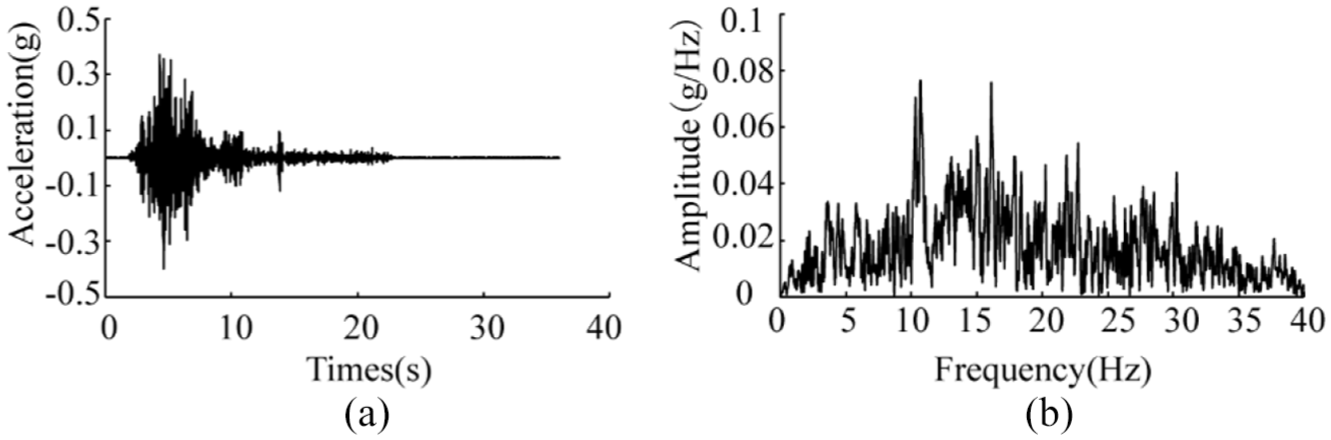
Input earthquake wave: (a) acceleration time history curve and (b) Fourier spectrum.
First, a white noise sweep excitation with an amplitude of 0.05 g was used to investigate the dominant frequencies of the tunnel lining. Then, a series of seismic damage tests with increasing intensities were conducted by applying the same seismic signal multiplied by an intensification factor. This led to shaking table excitations with peak ground accelerations (PGA) from around 0.1 to 1.0 g. The sign of the termination of the experiment was that the model tunnel is obvious in failure mode but that the whole tunnel still has not totally collapsed.
Model test results and discussion
Acceleration responses of the two tests
The peak accelerations of the two tests were used as examples for analysis under the input ground motions with a PGA of 0.3 g.
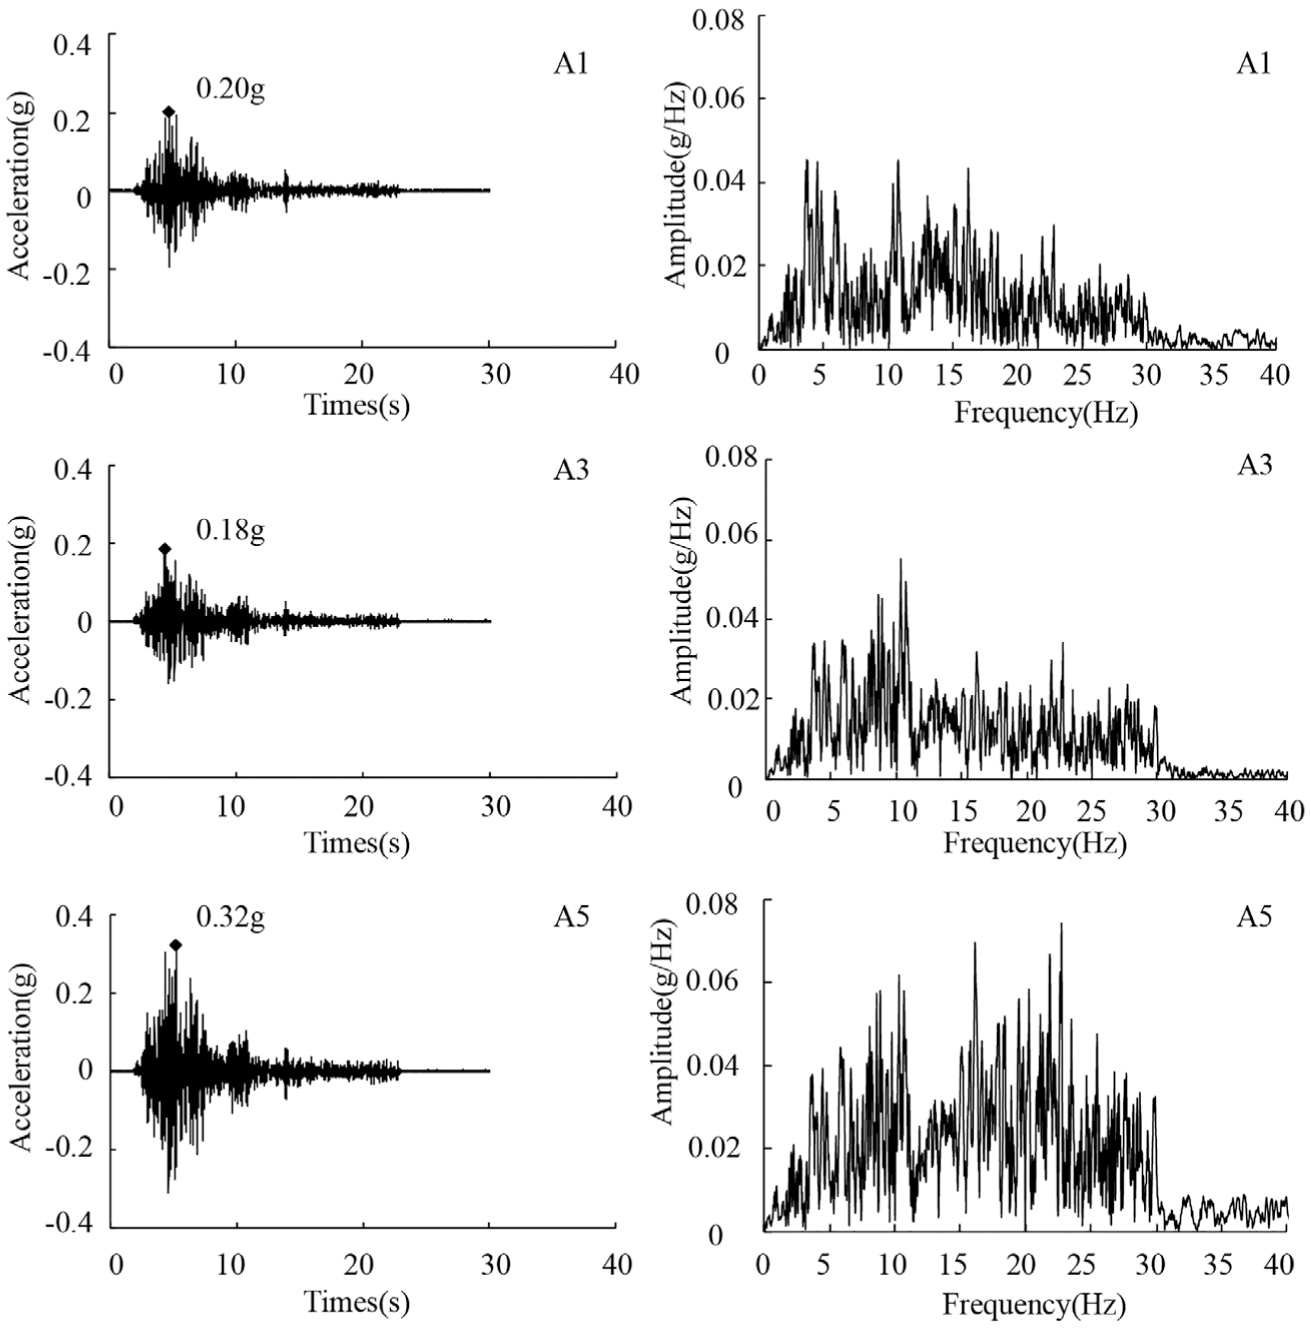
Figures 8 and 9 show the acceleration time histories and the corresponding Fourier spectra measured at different positions of the lining in Test 1 and Test 2. Figure 10 presents the variation in amplification factors with different positions in Test 1 and Test 2. The amplification factor is defined as the ratio of peak acceleration at different positions to the input peak acceleration. Figures 8 and 9 show that the acceleration time histories for different positions had the same characteristics as the input acceleration time history, and the main differences between these curves were the peak acceleration values. This trend also demonstrated that the new joints in these two tests did not influence the characteristics of the acceleration response, but did change the peak values of the acceleration at different locations. The amplification factors of monitoring points A1 and A3 were less than 1.0, while the amplification factor at monitoring point A5, at the right-hand end segment, was more than 1.0. The amplification factors from the studies by Wang et al. (2015) and Xin et al. (2014) are more than 1.0, so the amplification factors of the lining in the two tests were generally smaller than those without mitigation measures. After being analyzed, these differential transverse responses along the axis of the tunnel were ascribed to the fault-induced displacement and the ensuing tendency of the tunnel segments to “readjust” under the subsequent earthquake motions (Anastasopoulos et al., 2008). Monitoring point A5 was located at the end of the footwall where it was disturbed far less compared with the other monitoring points. The lining and model soil were still in close contact and therefore the lining vibrated along with the model soil. The peak acceleration was almost the same with the model soil and was a little larger than the input peak acceleration. However, points A1 and A3 were affected substantially by the fault movement, so the restraint of the model soil contacting the lining became was lower. The responses of A1 and A3 decreased and even showed the amplification factors smaller than 1.0 due to the fault-induced deformation and ensuing deformation adjustment of the joints. The peak acceleration at point A3 was the lowest among all monitoring points. This was because the fault fracture zone was originally weak, and the fault-induced displacement further weakened the model soil. The segments were connected by the joints, and they tended to have homogeneous displacement. The relative displacement between the segments in the fault zone was the largest. The stiffness difference between the fault fracture zone and the tunnel structure was the greatest, and it was more difficult to cause segment D to move synchronously with the other segments. Therefore, the acceleration response of segment D was the smallest. In general, the amplification factors of Test 1 were larger than those of Test 2, because Joint 2 was more flexible than Joint 1. The amplification factor for A6, which was near the surface, was approximately 1.85 owing to the magnifying effect of the weak model soil. The spectra of the structural responses and the input wave are similar. This trend also demonstrated that the new joints in these two tests did not influence the characteristics of the spectral responses. In addition, the higher frequency components recorded at the footwall increased compared with those in the fault zone and in the hanging wall, which implied that the soil was softened in the fault zone and in the hanging wall.

Transverse acceleration time histories in Test 1: (a) layout of the accelerometers and (b) acceleration time histories of A1, A3, and A5 and their corresponding Fourier spectra.
Transverse acceleration time histories and their corresponding Fourier spectra in Test 2.

Acceleration amplification factors.
Strain responses of the tests
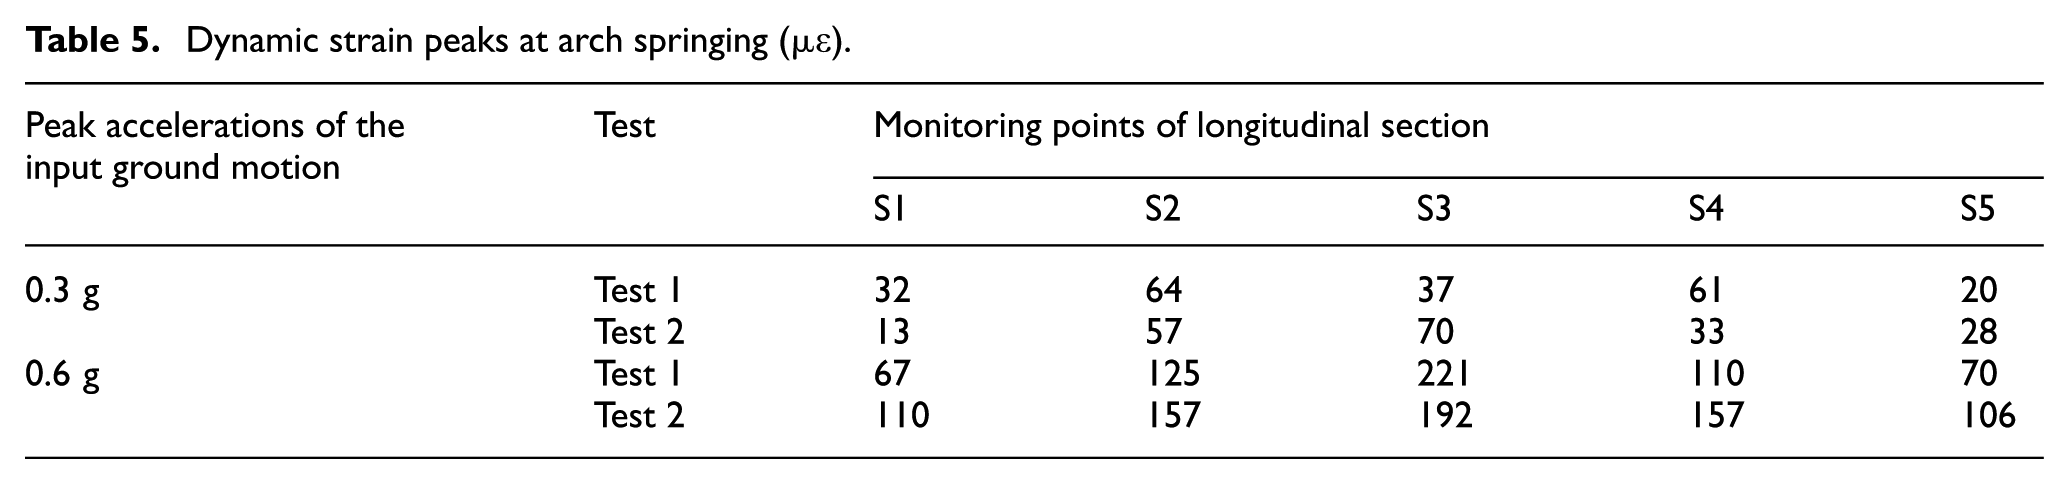
The maximum strains on the arch springing under input seismic wave with PGAs of 0.3 and 0.6 g were selected to explore the strain responses of the tunnel structure with the joints, as shown in Table 5. Figure 11 presents the lining strain–time histories on the arch springing of the tunnel with a PGA of 0.6 g in the two tests. In addition, the residual lining strain increments at arch springing after seismic excitation at 0.6 g are listed in Table 6. The residual lining strain increment is defined as the absolute value of the additional incremental lining strain above the static lining strain after each seismic excitation test case. This implies the real permanent deformation of the tunnel structure for each test case.
Dynamic strain peaks at arch springing (µε).

Lining strain–time histories at the five monitoring points on the arch springing for the two tests with earthquake excitation (0.6 g): (a) Test 1 and (b) Test 2.
Residual lining strain increments at arch springing after seismic excitation with 0.6 g (µε).

The maximum dynamic lining strain of Test 1 was on monitoring section II, and the maximum value of the test 2 was at monitoring section III where the tunnel crossed the fault when the PGA was 0.3 g, as shown in Table 5. Analysis of these phenomena revealed that the different responses were due to the different properties of the joints where the flexibility and ductility of Joint 2 were better than those of Joint 1. For Joint 1, the maximum value appeared at the maximum curvature point because of the lower flexibility of Joint 1 and relatively continuous deformation when the PGA was 0.3 g. For Joint 2, there was less restriction for the segments. The longitudinal section of tunnel underwent a step-like displacement without an obvious bending point, so the maximum value occurred in the fault-crossing segment that was affected most by the fault movement. With the PGA reaching 0.6 g, the distribution of the peak strain values in Test 1 became different, and the maximum peak value was in monitoring section III (Figure 11(a)). This was because the plaster portion of Joint 1 was subjected to brittle shear failure, and then the flexible layer of rubber had fewer constraints to the lining. Therefore, the relative “free” deformation occurred between the lining segments. The lining located in the fault fracture zone suffered a larger deformation generating large strain due to the weak model soil. Figure 11 shows that the strains in Test 1 oscillated around a baseline strain until the end of the excitation. After the loading process, these strains returned to the baseline strain with small residual strains. However, there were larger residual lining strain increments at monitoring sections II, III, and IV in Test 2. These results indicated that Joint 1 performed better. The main reason was that the restrictions between the segments in Test 1 were weaker than those in Test 2 due to brittle shear failure of Joint 1 when the peak value of the input acceleration was 0.6 g, and the segments moved more freely to reduce the deformation of the lining. From Figure 11(b) and Table 6, larger residual lining strains can be seen at monitoring sections II, III, and IV compared with monitoring sections I and V in Test 2. This means that greater permanent deformation occurred in the segments near the fault zone, whereas the segments far from the fault showed little deformation.
Damage observations and discussion
The damage in Test 1
Figure 12 shows the fracture morphology of the longitudinal tunnel section in Test 1 under seismic excitations of 1.0 g, and the fracture mode was not same as that of the tunnel lining without joints. The tunnel lining exhibited step-like displacements due to the joints, which were positive to the tunnel lining under earthquake conditions. The fault displacement was “shared” by the segments. They provided limited stiffness for fault movement and the ground motion because of the strength of the plaster part of Joint 1. The rubber layer between segments and the soft rubber on the joint section had relatively high flexibility. These factors caused progressive displacement of the tunnel lining but not serious collapse in large earthquakes.

Post-earthquake longitudinal section alignment of Test 1.
Figure 13(a) and (b) shows that the longitudinal cracks on the left and right arch springing of segment A because the invert backfill was set up in this experiment and that arch springing was the stress concentration region. Owing to the combined action of the hanging wall moving downward and subsequent earthquake shaking, the stress concentration region of the tunnel was destroyed. There was a longitudinal crack in the crown of segment A, which was the same phenomenon as in Figure 1(a). The rationality of this experiment was also verified. An inclined crack grew from the arch springing on one end to the shoulder on the other end due to the combined loading process. Figure 13 shows that the damage to segment H on the footwall was less serious than the damage to segment A. There were cracks on the left and right arch springing. A crack extended from the invert in the direction of the tunnel axis, which was the same pattern as seen in Figure 1(e). In addition, segment A was affected more by the earthquake than segment H.
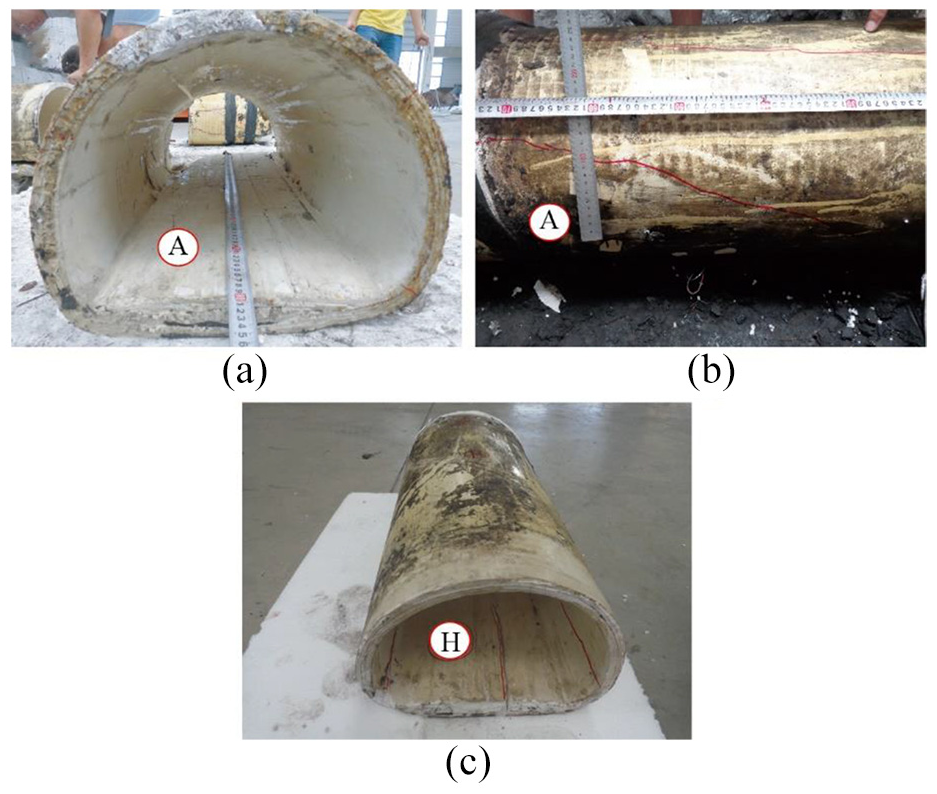
Failure patterns of segments A and H: (a) inside surface of segment A, (b) outside surface of segment A, and (c) outside of segment H.
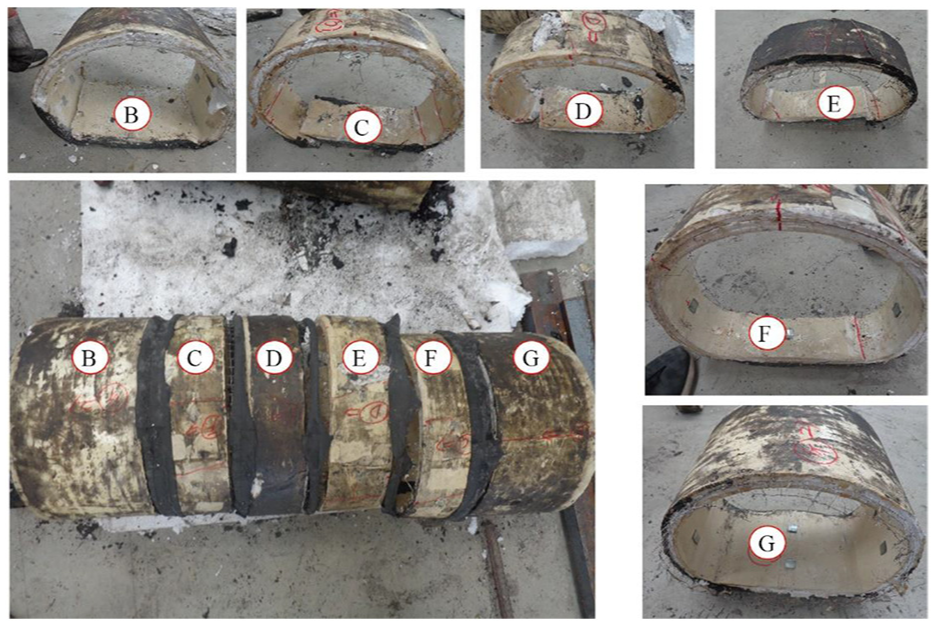
Segments D and E at the fault zone were damaged the most, as shown in Figure 14. The invert of segment E uplifted, which was the same pattern as seen in Figure 1(f). The farther the distance from the fault area, the less damages be found, as illustrated in Figure 14. This was because the plaster part of the joint was destroyed, and the external flexible rubber layer between the segments and the rubber on the joint section was effective mainly when the input PGA was up to 1.0 g. The lining segments were more independent of each other. Because of the poor model soil located in the fault zone, the influence of the fault movement and of the earthquake oscillations, the tunnel lining at the fault zone was damaged the most. The lining of the hanging wall was damaged more heavily than the footwall at the same distance from the fault, which further explained the different degrees of damage of the tunnel lining for the hanging wall and footwall when the tunnels crossed faults under earthquake conditions. It mainly depended on the active side of the fault. The model soil in the hanging wall was weaker than that in the footwall after fault movement because normal faulting causes the hanging wall to move downward relative to the footwall. The lining in weaker soil was damaged more than the footwall after seismic excitation. Therefore, it is necessary to distinguish the seismic fortification measures from the hanging wall and the footwall. In contrast to common damage patterns in the in situ surveys, there was no obvious damage perpendicular to the direction of tunnel axis. These shear failures of the lining caused by the relative motions of surrounding soil were “absorbed” by the joints in this experiment. These results indicate that the joints effectively reduced the damage to the tunnel lining.

Failure pattern of segments from B to G: (a) inside surfaces of segments B, C, and D, (b) outside surfaces of segments B, C, and D (c) inside surfaces of segments E, F, and G, and (d) outside surfaces of segments E, F, and G.
The damage of Test 2
Step-like displacements can also be seen in Figure 15 without sudden brittle shear failure because of Joint 2. Figure 15 elucidates that the major damage patterns were the longitudinal cracks on the arch springing and the crown due to the fault motion and the stress concentration region. No obvious shear transverse failure was found in this test because the imposed deformation was “absorbed” by Joint 2. Segments B and C sustained more serious damage than segments F and H because of the movement of the hanging wall. In general, the damage in Test 1 was more “concentrated” than that in Test 2, which meant the length of the lining affected by fault in Test 1 was shorter than in Test 2, as shown in Figure 15.
Cracking of the tunnel lining after completion of the seismic damaging tests.
After earthquake excitation, segments B, C, D, and E in Test 2 were heavily fractured at the arch springing and invert, and there was even uplift in the invert. However, only segments D and E in Test 1 were heavily fractured, and the other segments of the lining underwent different degrees of cracking, but this was not as intense as for segments D and E. The reason was that the plaster part of Joint 1 played a controlling role because of its stiffness, and its adaptive deformation was small and mainly provided resistance when the PGA was small. The segments suffered great stress at this period. When the PGA reached a certain value, the plaster part of Joint 1 was subjected to brittle shear failure. Then, the flexible layer of rubber had fewer constraints to the lining. Therefore, the relative “flexible” deformation occurred between lining segments. The lining located in the fault fracture zone, due to great differential stiffness between the tunnel structure and the model soil, suffered larger deformation and heavy damage. However, the other segments, due to the relatively higher strength of the model soil, were subjected to relatively slight damage. Regarding Joint 2, the flexibility was more than that of Joint 1, so a larger relative displacement occurred. The lining reached a better state because of the deformation redistribution. When the stress in Joint 2 reached its limit of elastic strength, its good ductility played a decisive role. However, as the PGA rose to a certain value, the ability of the deformation coordination resulted in a larger damage range to the tunnel lining.
Conclusion
Several conclusions of practical significance can be drawn from this study, but the specific parameters of the brittleness and ductility of the joints need to be further studied.
This article provided a new method to simulate the loading mode for tunnels through faults under earthquakes. The method considered the combined actions of fault movements and earthquake ground motions. The damage pattern, which was similar to that in the in situ surveys, provided reliable evidence for this method.
A new seismic design concept, “guiding” and “yielding,” was proposed in this article. Each of the two joints based on this concept decreased the seismic energy transmission along the tunnel axis and effectively reduced the damage to the tunnel linings. The idealized behavior—step-like deformation—appeared along the longitudinal direction of the tunnel in the two tests. Joint 1 combined brittleness and flexibility, and the length of the lining affected by the fault was shorter when a large earthquake occurred (i.e. the PGA was 1.0 g). The other joint, combining flexibility and ductility, released energy by its adaptive deformation, but it was also associated with a larger damage range to the tunnel in the longitudinal direction. Thus, Joint 1 is more appropriate for massive earthquakes compared with Joint 2.
The acceleration time histories at different positions in the tunnel had the same characteristics as the input acceleration time history, and the main difference between these curves was the peak acceleration value. The new joints did not influence the characteristics of the acceleration response. Most of the amplification factors were less than 1.0, except for segment H. The amplification factors of lining in the two tests were generally less than those without seismic fortification measures.
In contrast to common damage patterns in the in situ surveys, no shear failure on the tunnel lining is seen in the two tests, because the imposed shear deformation was accommodated by the joints. The longitudinal cracks in the crown, arch springing, and invert were obvious in the tests. Much attention should be paid to these areas.
The damage to the lining located in the hanging wall was more serious than that to the footwall. It is necessary to distinguish the seismic fortification measures from the hanging wall and the footwall.
This article analyzed qualitatively the performances of the proposed joints based on a specific tunneling project due to the limitations of the test conditions. The specific design of the joints under different situations still needs to be further studied, but the proposed design concepts, the design of the joints, and hopefully many of the conclusions of this study are generally applicable to other similar tunneling projects.
Footnotes
Declaration of Conflicting Interests
The author(s) declared no potential conflicts of interest with respect to the research, authorship, and/or publication of this article.
Funding
The author(s) disclosed receipt of the following financial support for the research, authorship, and/or publication of this article: This work was supported by the National Key Research and Development Program of China (Grant No. 2016YFB1200401), the National Natural Science Foundation of China (Grant No. 51678501 and 51778540), and the program of China Scholarships Council (Grant No. 201707000044).