
Abstract
The adverse effects caused by differential axial shortening in high-rise buildings have received increasing attention with growing building height. However, the axial shortening analysis still lacks accuracy compared to the in-situ monitoring results of practical high-rise buildings during construction stage. It is imperative to identify the error sources, and the applicability of the current shortening prediction models should be test verified. In this study, 14 plain concrete columns were cast, and the multi-stage load method was applied to approximately simulate the loading history of axial concrete members during construction stage. The time-dependent deformations of loaded concrete specimens were measured, and a comparative analysis was conducted between test results and numerical prediction values. It is found that the measured deformations of multi-stage loading cases are all underestimated compared with predicted results, and this underestimation may be mainly caused by the inappropriate use of elastic modulus. It further indicates that the axial shortening analysis of high-rise buildings tends to underestimate the actual shortening value when the traditional calculation method is used. This study provides a reference for explaining the mismatch between the analytical results and the actual shortening values.
Introduction
The time-dependent deformations of concrete materials have been discussed and experimentally studied for many years (Bažant, 2001; Havlásek and Jirásek, 2016; Mazloom, 2008; Pei et al., 2016a). The common adverse effects caused by time-dependent deformation consist of early cracks in concrete, additional deflection, loss of prestress, stress redistribution, and so on (Alexander, 2011; Bischoff, 2001; Kim et al., 2011). To quantitatively analyze the time-dependent performance of concrete structures, several widely accepted prediction models have been proposed to describe the shrinkage and creep development of concrete. However, as reported by Bažant (2001), the time-dependent deformation of concrete materials is still far from being fully understood. The incremental use of high-performance concrete materials limits the application of prediction models which are only experimentally verified by ordinary concrete. However, some new undesirable problems in time-dependent performance of concrete structures arise when the modern structures are becoming more complex, larger, and higher. Among these new issues, differential shortening between adjacent axial components was first observed in 1960 when the building height was over 100 m (Fintal et al., 1987). This unexpected differential shortening may cause extra movement in beam–column or beam–shear wall joints, sloping of floors, stress redistribution, and malfunction of auxiliary facilities (such as elevator) (Carreira and Poulos, 2007). Up to now, the highest building, that is, Burj Khalifa Tower, has reached 828 m. The axial shortening analysis of high-rise buildings has become an essential procedure during design process and construction stage (Baker et al., 2007).
With regard to the formation of differential axial shortening in high-rise buildings, there are four dominant factors, that is, uneven load distribution among axial components, construction sequence, time-dependent deformations of concrete, and temperature-induced deformation. Moragaspitiya et al. (2009, 2010, 2013) proposed a numerical simulation method to consider the influence of first three factors on axial shortening of high-rise buildings. According to Xia’s in-situ monitoring of Canton Tower with the building height of 600 m, the maximum temperature-induced daily movement is similar to the value of typhoon-induced motion (Xia et al., 2014). Referring to the abovementioned four factors, corresponding measures, such as adjustment of cross-sectional area, construction sequence, concrete strength grade, and reinforcement ratio, were proposed to minimize the differential axial shortening among adjacent concrete members (Du et al., 2016; Pei et al., 2016b; Yang, 2007; Zou et al., 2014).
Specifically, the time-dependent deformation of a concrete member under variable load is composed of instantaneous elastic strain, and long-term shrinkage and creep strain. When it comes to calculating the time-dependent deformation of axial concrete members, two simplified assumptions are generally adopted. First, creep is proportional to stress which is less than 40% of compressive strength; second, superposition principle can be used to take account of the continuous stress increment which occurs in construction stage (American Concrete Institute (ACI), 1992; Comité Euro-Internationaldu Béton (CEB), 2010). However, the accuracy of using superposition principle to describe the creep development of concrete columns under construction load history is rarely experimentally verified (Brown, 2005; Yue and Taerwe, 1993). Gardner and Tsuruta (2004) conducted an experimental investigation on the validity of using superposition principle to describe the creep development of concrete under drying condition. It is found that, for increasing loads, the maximum underestimate in measured creep strains reached 20% compared to simulated strains. Gardner (2004) further reported that the calculated strains are less than experimental strains, and the superposition underestimates the measured strain by 5%–10% for increasing load. According to the latest test report by Du et al. (2015), both loading age and stress amplitude have significant impact on the time-dependent strain of early-age concrete under step-by-step loads. The superposition principle may introduce obvious error in prediction of creep strains.
The main purpose of this study is to verify the accuracy of using superposition principle to predict axial shortening of early-age concrete columns subjected to construction load history. Three multi-stage loading methods with time steps of 3, 5, and 7 days were used to simulate the construction sequence of 3, 5, and 7 days per floor, respectively. The time-dependent deformations were measured and compared with simulated strains. This study provides a potential error source in axial shortening analysis of high-rise buildings.
Experimental investigation
Materials and specimens
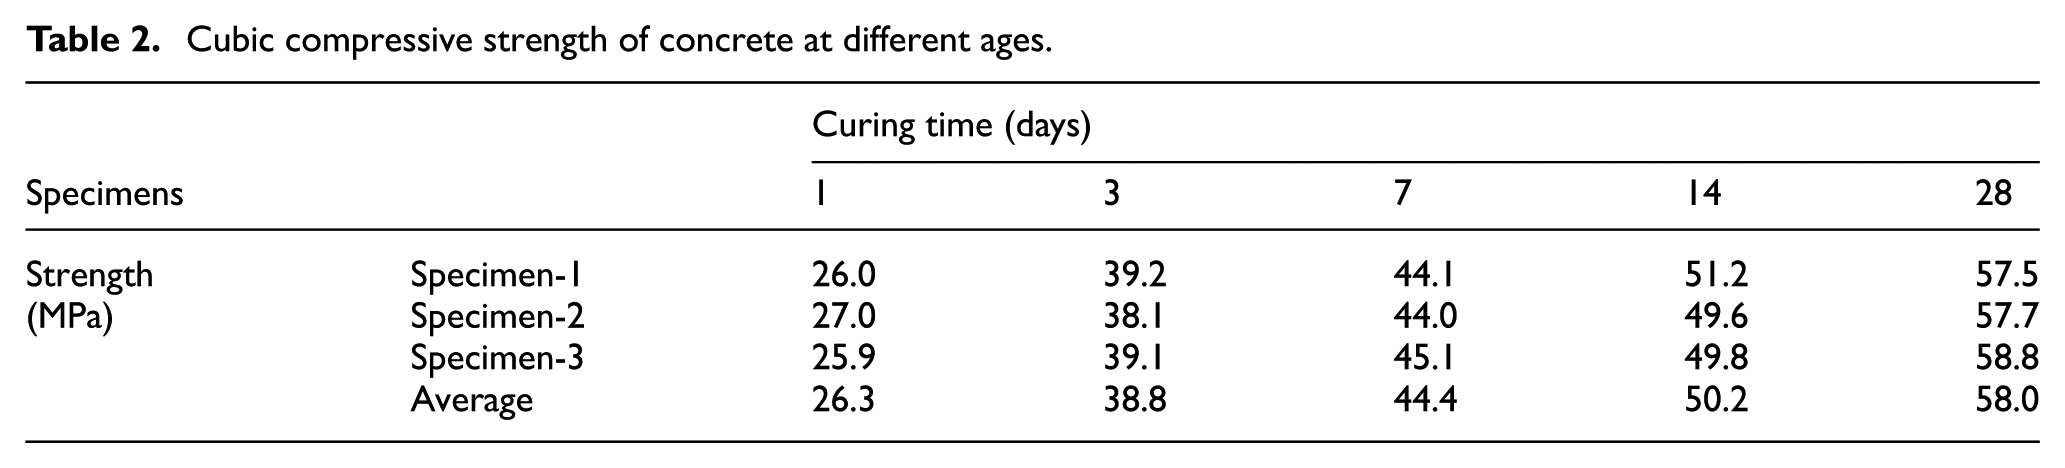
The test concrete was provided by Shenzhen Antuoshan Concrete Co., Ltd, and its mix proportion is given in Table 1. The raw materials employed were Portland cement of type 52.5R, tap water, natural sand, coarse aggregate with maximal diameter of 10 mm, fly ash, slag powder, and admixtures. A total of 14 concrete specimens with a dimension of 100 mm × 100 mm × 400 mm were cast, and three of them were used to determine the concrete elastic modulus at the age of 28 days, that is, 28,150 MPa. In total, 15 100-mm cubic specimens were also cast to evaluate the time development of compressive strength, which is illustrated in Table 2. Both elastic modulus and compressive strength at the age of 28 days are the fundamental parameters in main shrinkage and creep prediction models. After cured for 24 h, the concrete specimens were demolded and put into laboratory environment.
Details of the composition of tested concrete.

Cubic compressive strength of concrete at different ages.
Test setup and procedures
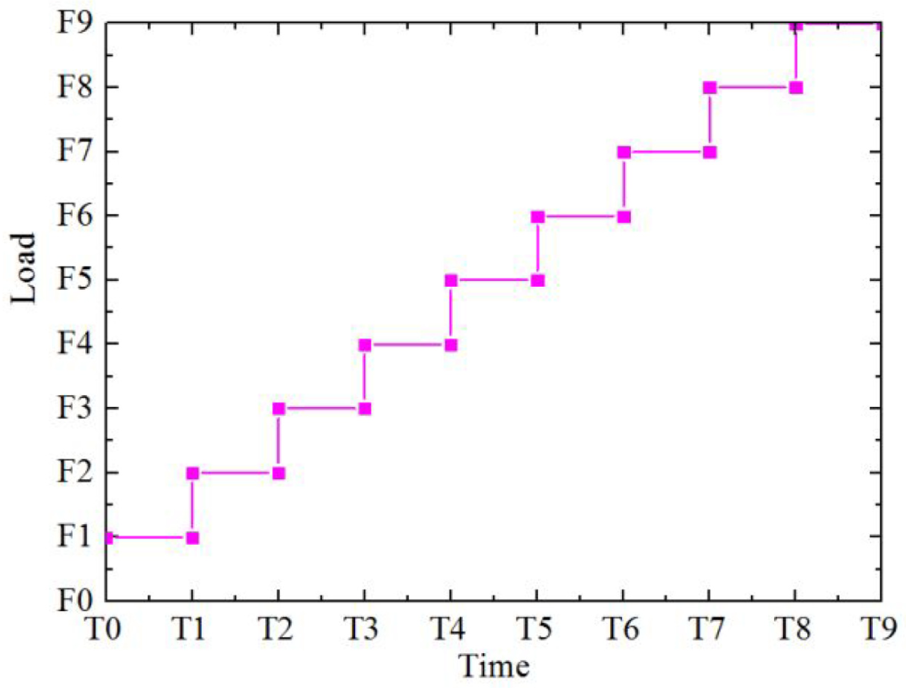
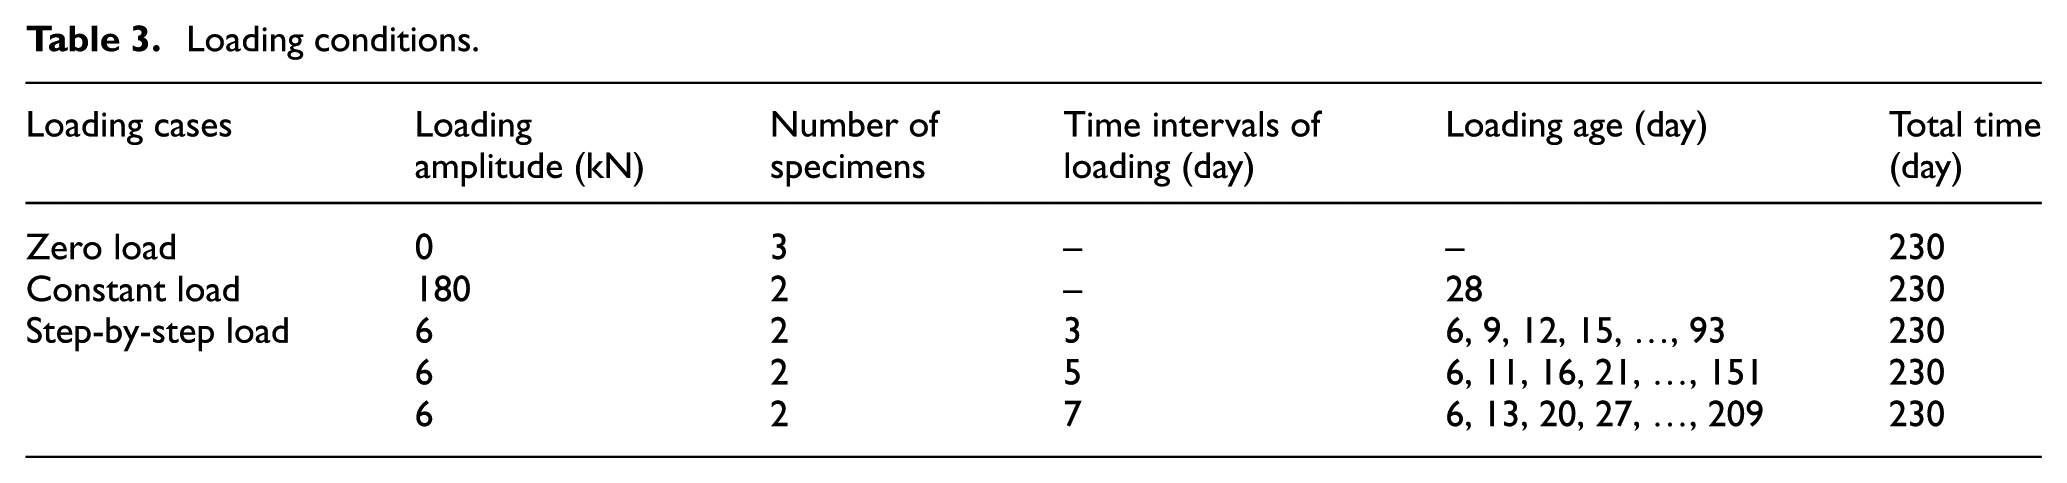
The traditional loading device recommended by China code (MOHURD, 2009) for creep measurement cannot achieve a desirable step-by-step load history on concrete specimens. For instance, the loading space of the setup recommended in China code is not enough for two superposed specimens. Moreover, the load device recommended in China code is a hydraulic jack, which cannot provide sustained load for a long period, such as 230 days in this test. Thus, a screw jack with a maximum capacity of 500 kN was used in this study to load concrete specimens, as shown in Figure 1(a)). A pressure sensor close to the jack was used to monitor the loading values. Several measures shown in Figure 1(b)) were adopted to ensure the concrete specimens in uniaxial compression. Three loading cases, that is, zero load, constant load (180 kN), and step-by-step load, are considered in this test. The zero load and constant load cases aim to obtain the shrinkage and creep development of concrete, respectively. It is generally accepted that the time-dependent strains of concrete under any form of loads could be identified if the shrinkage strains and creep strains under constant load are clearly predicted. For step-by-step load case, it was mainly used to simulate the construction load history of concrete columns in a 30-floor building. The axial concrete components of high-rise buildings are subjected to a lot of load increments from upper floors during the construction process (see Figure 2). The load increment of each new built floor is composed of gravity load and construction live load, and the construction of each floor is generally completed in 3–10 days. Specifically, in a typical floor, as shown in Figure 3, for a column with sectional dimension of 1000 mm × 1000 mm, which has a responsible area of 8000 mm × 8000 mm, assuming that the slab thickness is 240 mm, then the gravity load can be approximated. In addition, construction live load is employed as 2.5 kN/m2 (MOHURD, 2012). Thus, a column can bear stress increment of around 0.6 MPa and consequently, for step-by-step loading case in the test, the step load was employed as 6 kN to simulate a load increment, and the step load times were employed as 3, 5, and 7 days, respectively, to simulate different construction schedule of each floor.
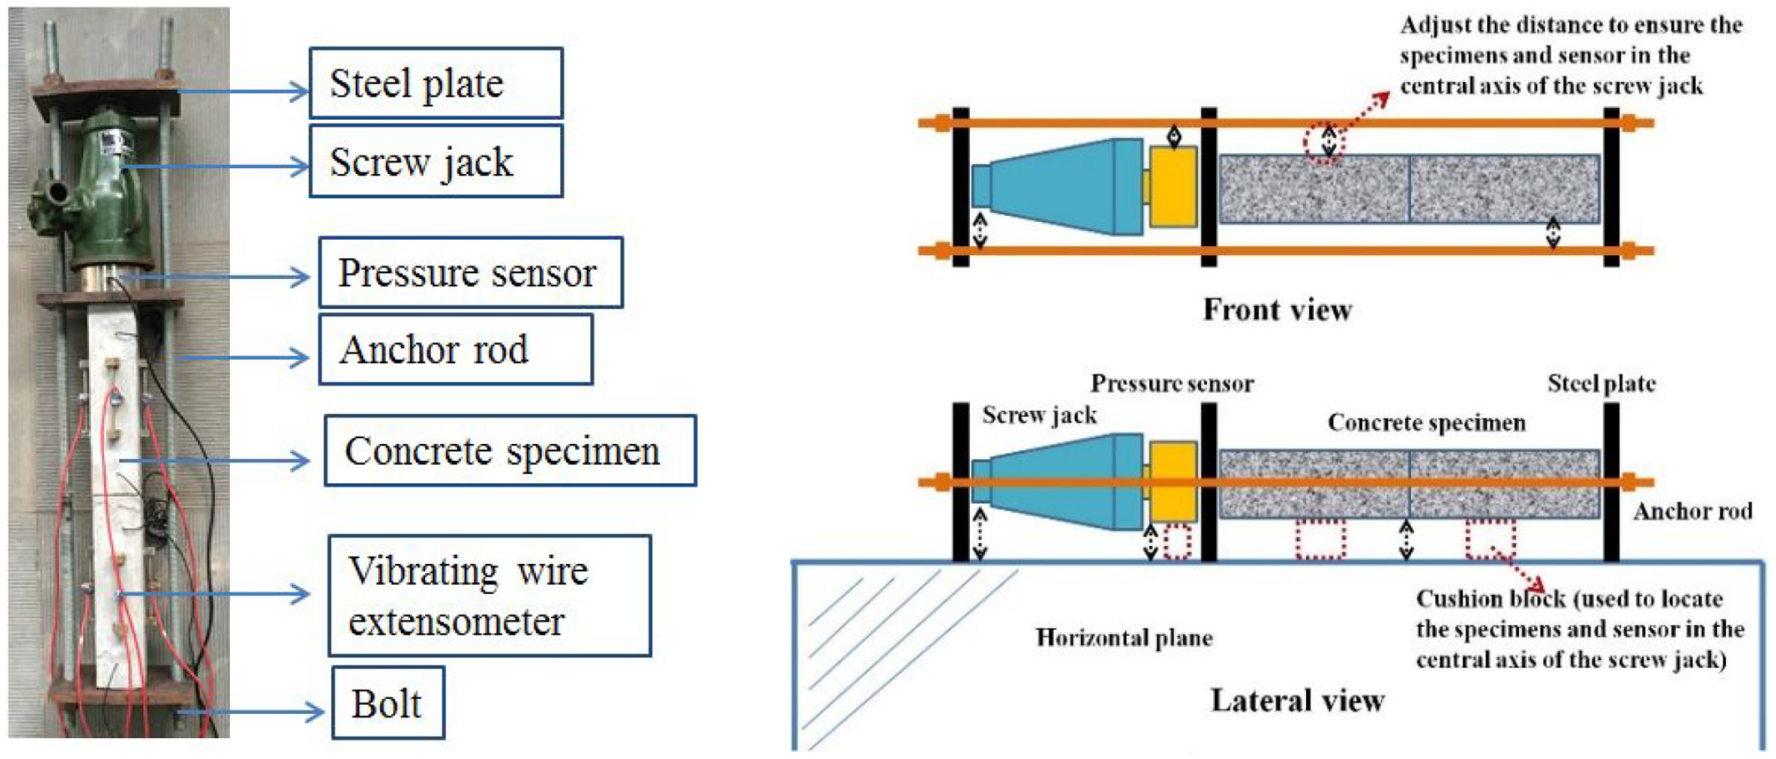
Test setup: (a) testing photo and (b) schematic diagram.
Time-dependent strain development under a load increment.
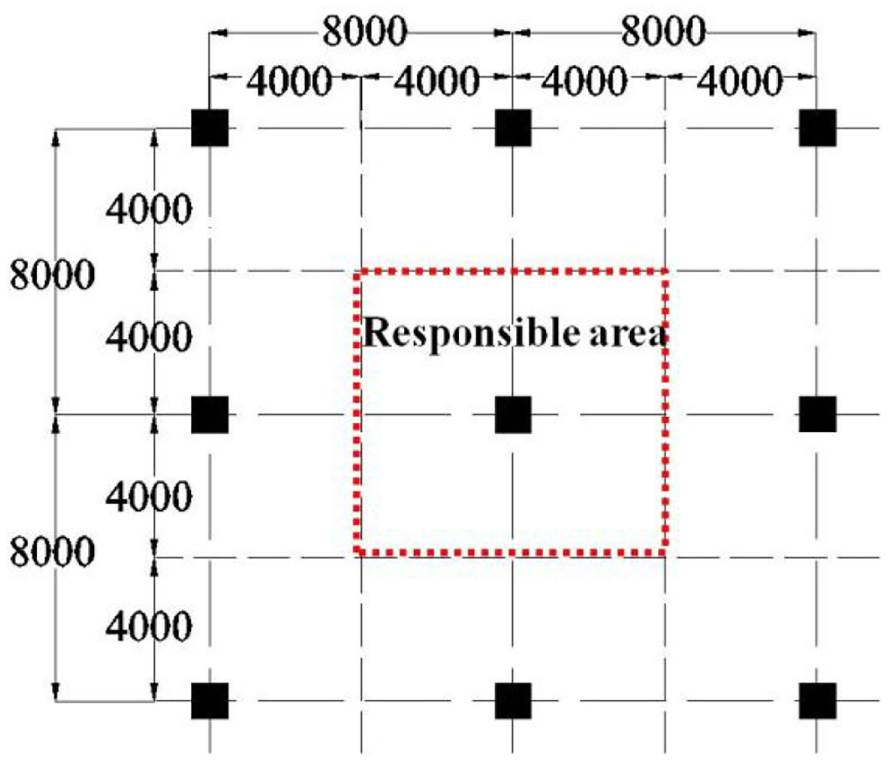
Top view of a typical floor (mm).
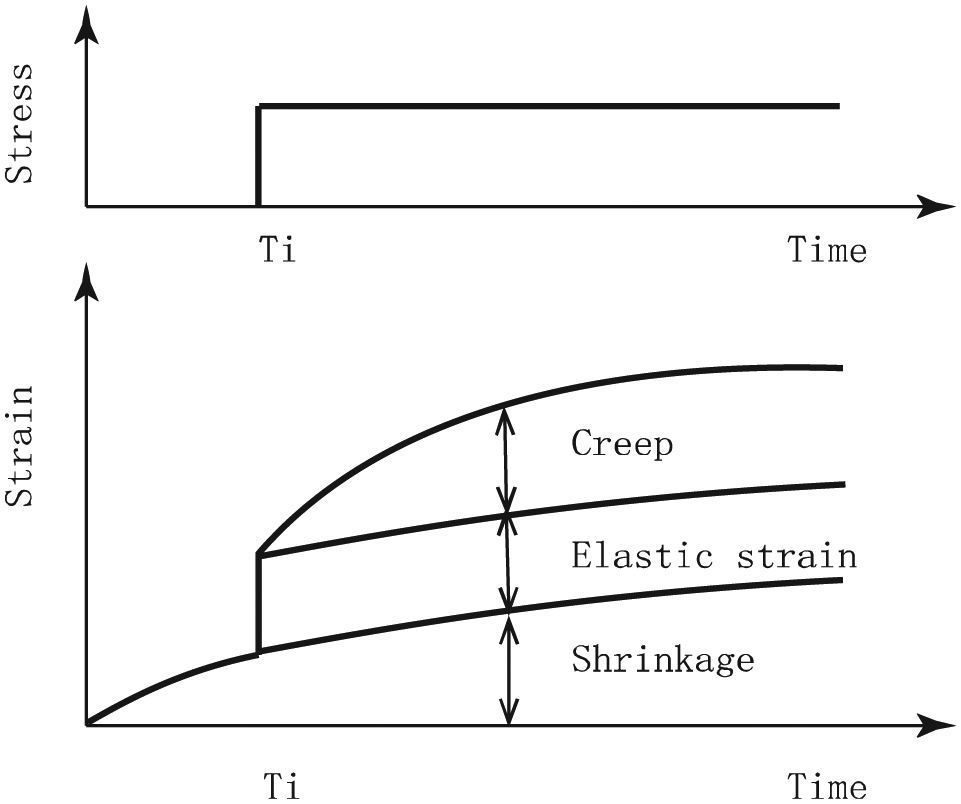
After applying an incremental load, the axial concrete member will experience an instantaneous elastic shortening, subsequent long-term shrinkage, and creep shortening (see Figure 4). In consideration of the obvious impact of environmental conditions such as temperature and air humidity on shrinkage and creep deformation, the whole test was conducted in HYHW-12A-type walk-in chamber at a constant temperature (20°C) and relative humidity (60%).
Time-dependent strain development under a load increment.
Referring to the specifications of China code (MOHURD, 2009), the experimental procedures are given in detail as follows:
A total of 14 concrete specimens with a dimension of 100 mm × 100 mm × 400 mm were cast, and 11 of them were divided into 5 groups (see Table 3). Meanwhile, 15 cubic specimens with a dimension of 100 mm × 100 mm × 100 mm were cast to measure the strength development of concrete.
After curing in the mold for 24 h, the specimens were demolded and the surface of the specimens were cleaned and lined to determine the position of vibrating wire extensometers using a pen and a caliper.
Multiple gauge measurements were used in this test, which can help us monitor the occurrence of extra bending movement (see Figure 1). The structural adhesive was employed to fix the vibrating wire extensometers on different side faces of the same specimen. The sensors should be located in the central line of the prism and parallel to the sides.
The shrinkage deformations of concrete prisms were measured from the second day after casting, and the temperature and relative humidity of the test environment were recorded at the same time.
Cushion blocks were used to ensure the concrete specimens in uniaxial compression (see Figure 1(b)). They were utilized to locate the positions of specimens and pressure sensors before loading. For the constant loading case, a total of 180 kN loading force was applied on two superposed concrete columns at the age of 28 days. For the step-by-step loading case, the step load (6 kN) was first applied on the sixth day and then applied at an interval of 3, 5, and 7 days, respectively, afterwards. It should be noted that compensation load was needed if the applied loads fell over 2% of its designed values.
Collect and organize shrinkage and creep deformation data in time and make a comparative analysis with prediction models.
Loading conditions.
Results and discussions
The deformations of concrete prismatic specimens subjected to zero stress (shrinkage), constant stress (18 MPa), and stage stresses were measured in the tests. The elastic and shrinkage prediction models of the CEB-FIP Model Code 2010 (MC2010) were adopted to calculate the elastic and shrinkage development, and creep prediction model of the MC2010 model combined with superposition principle was applied to predict the corresponding creep development.
Shrinkage development
The shrinkage strain history of concrete specimens (S-1, S-2, and S-3) from the second day is given in Figure 5. It is notable that the shrinkage rate declines with increasing concrete age. Moisture transportation is a contributing factor of concrete shrinkage, which takes place mainly in the early age of concrete. Therefore, the test result makes sense and corresponds to theoretical analysis. It is interesting to note that the discreteness of concrete among different specimens is in good control. In addition, the shrinkage curve is quite smooth due to the constant relative humidity of the test environment.
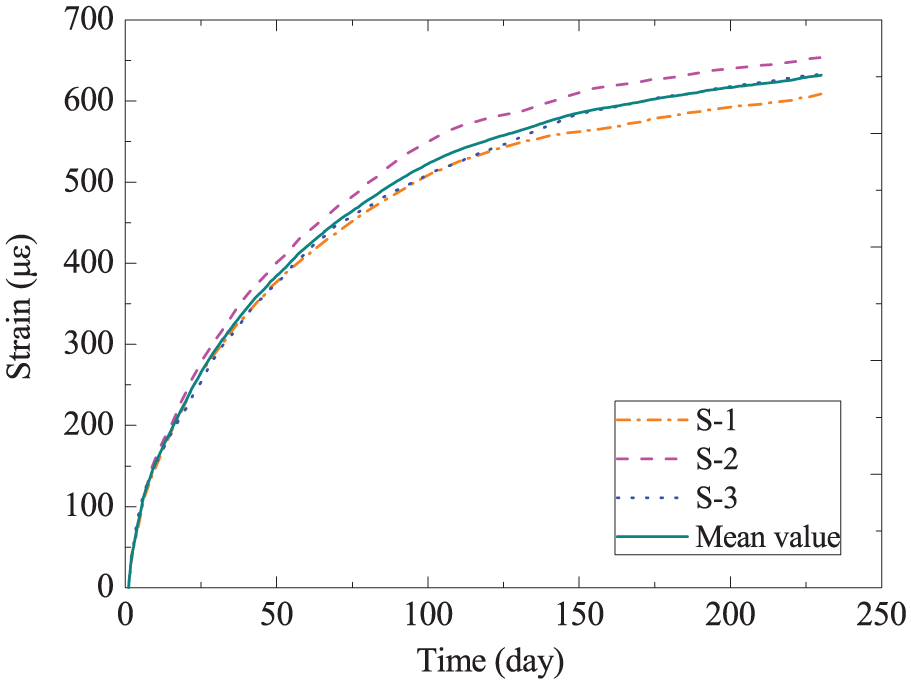
Shrinkage development of concrete specimens.
The MC2010 model was utilized to predict the shrinkage development of the concrete specimens in this test (CEB, 2010). The parameters used in the calculation are shown in Table 4. As shown in Figure 6, the measured shrinkage in the test and the numerical value show some discrepancy, that is, the prediction values are larger than the measured ones in the first 70 days, while this situation changes thereafter. As aforementioned, the multiple factors influencing the shrinkage development of concrete can account for this error. Still, the prediction accuracy with MC2010 model is acceptable.
Parameters used in numerical simulation.
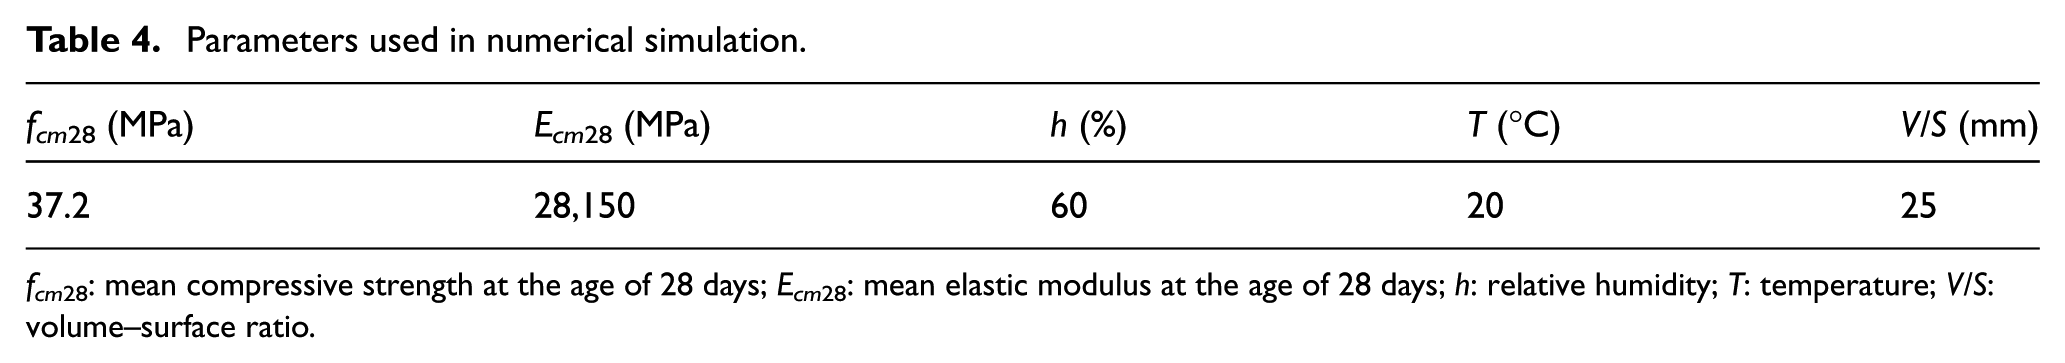
fcm 28: mean compressive strength at the age of 28 days; Ecm28: mean elastic modulus at the age of 28 days; h: relative humidity; T: temperature; V/S: volume–surface ratio.
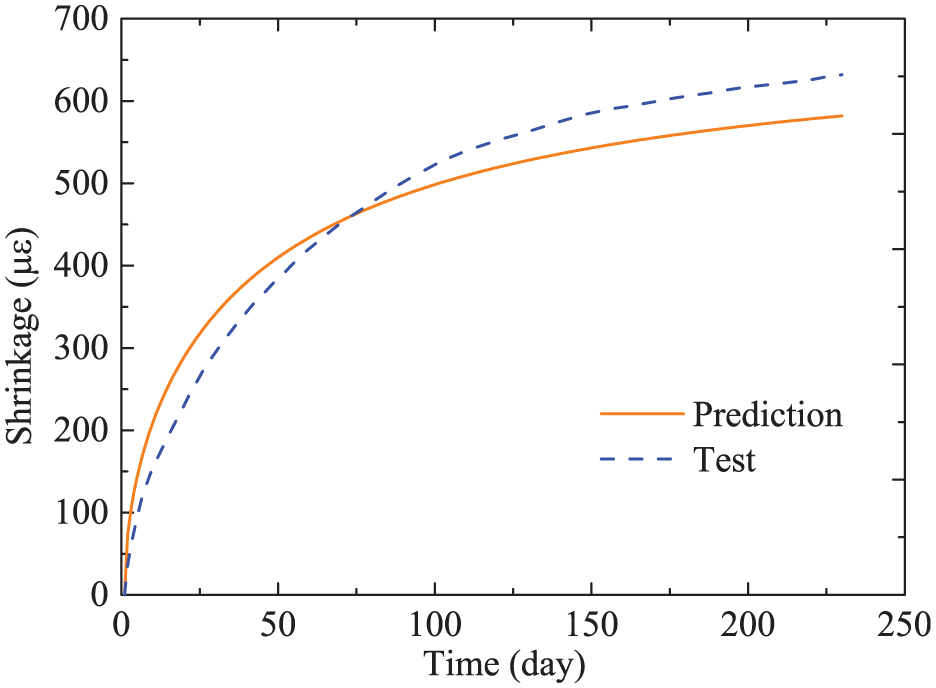
Test results and numerical prediction.
Creep development under constant load
Two superposed concrete specimens (C-1 and C-2) were subjected to a constant load of 180 kN at the age of 28 days, and the total axial deformation development is demonstrated in Figure 7, which contains elastic strain, shrinkage, and creep strain. It is evident that the strain of both the concrete specimens shows similar trend, that is, there is a sharp increase in the deformation at the age of 28 days which results in instantaneous elastic shortening under loading and subsequent shrinkage and creep strain develop continuously. Furthermore, the increasing rate of strain under sustained stress decreases with time, which agrees well with theoretical creep development trend (CEB, 2010). To make a sharp contrast between the MC2010 model prediction value and the test results, the measured shrinkage strain was excluded from total measured strain to obtain the stress-dependent strain as shown in Figure 8. It can be observed that prediction values and test results of stress-dependent strain match well. The prediction error remains quite small, varying from 1% to 3%.
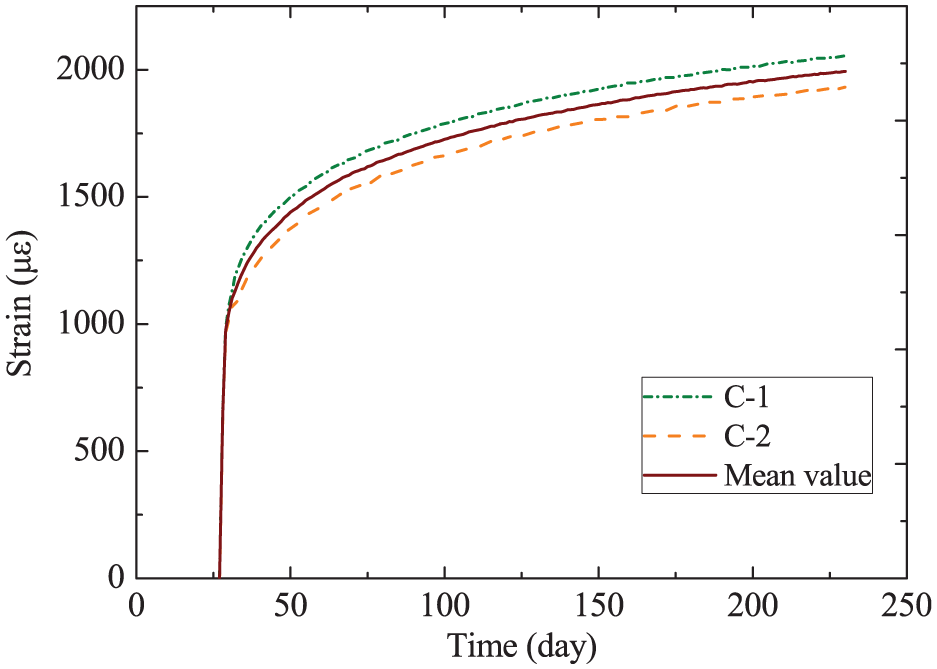
Time-dependent strain of concrete specimens under constant load.

Stress-dependent strain development in test and its numerical prediction.
Strain development under multi-stage loading
The stage loads start from the sixth day, and the time intervals (Δti) are classified into three cases: 3, 5, and 7 days. Figure 9 depicts the resulting average time-dependent strains of concrete specimens with three loading cases. The measured strains include elastic strain, shrinkage strain, and creep strain. First, concrete undergoes shrinkage since being poured resulting in moisture transfer from inside to the external environment. Shrinkage depends on the qualities of concrete and has nothing to do with loading conditions. Second, concrete experiences elastic strain during loading and creep under sustained load. Noteworthy is the fact that, the time-dependent strain development follows: strain development with Δti = 3 days > strain development with Δti = 5 days > strain development with Δti = 7 days. Obviously, the multi-stage loading case with quick loading speed completes the loading stages (30 stages) earlier. It is highly recognized that the elastic shortening strains are contrary to the elastic modulus values. Considering the fact that the elastic modulus of concrete increases with its age, the elastic strain induced by earlier step load is expected to be larger than that of induced by later construction load.
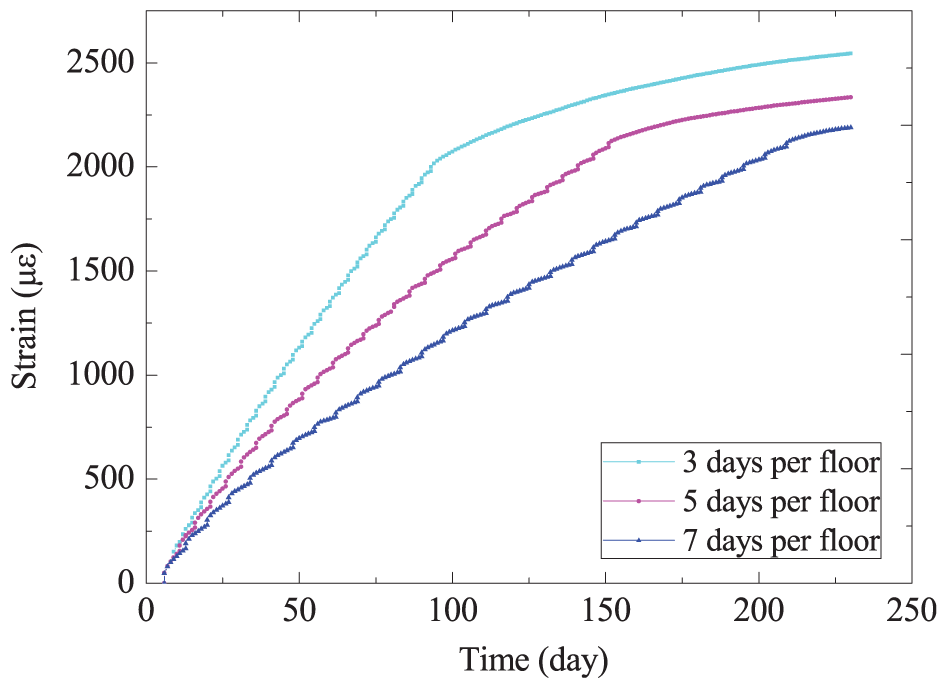
Summary of average strain development of concrete specimens under stage loading.
The total time-dependent strain,

where εshrinkage, εelastic, εcreep, and εtemperature are the shrinkage strain, elastic strain, creep strain, and thermal strain, respectively. In the MC2010 model, they can be predicted as


where tc is the curing age, and εcn(t, tc) and εcσ(t, t0) can be defined as stress-independent strain and stress-dependent strain, respectively. Hence, equation (1) can be rewritten as

For the multi-stage loading case, when a concrete component undergoes a stage load increment with the amount of Δσ(ti), the total stress-dependent strain responses can be expressed as

where Ecm(t), that is, the elastic modulus of concrete at concrete age t, can be estimated from
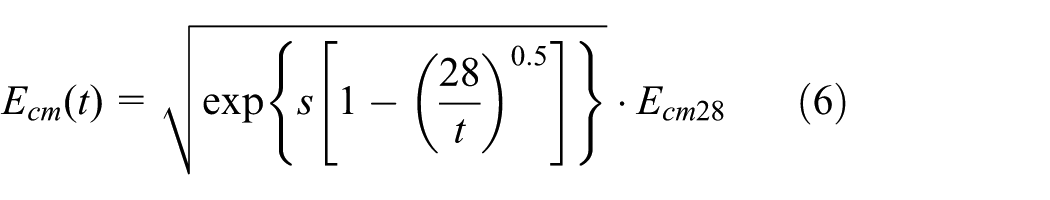
where Ecm28 is the elastic modulus of concrete at an age of 28 days; s is a coefficient taking into account the type of cement and the compressive strength of concrete.
In this study, total strain and shrinkage strain were measured, and the stress-dependent strain progress with time can be obtained by subtracting shrinkage strain from total strain (see Figure 10(a)). It should be noted that, the temperature of the test environment remains nearly constant. Hence, thermal strain is not discussed in the total strain. In contrast, the stress-dependent strain progress with time predicted by MC2010 model is plotted in Figure 10(b)). It can be observed that there are similar strain development trends among test results and predictions. To make a stark contrast of the strain progress with time of each stage loading case obtained in test and that of predicted by theoretical assumption, a comparative analysis is performed as depicted in Figure 11. It reveals that the measured time-dependent strains of multi-stage loading cases are all underestimated compared to the predicted results. Figure 12 gives the ratio of measured stress-dependent strain to predicted strain of multi-stage loading cases, which demonstrates the comparison results in a straightforward way. The prediction errors of stress-dependent strain at typical concrete ages can be found in Table 5. It can be observed that the time-dependent strains are underestimated over 20% during early age of construction period, and the prediction error tends to drop gradually and stabilize at a relatively low level (around 5%) after the construction process completed.
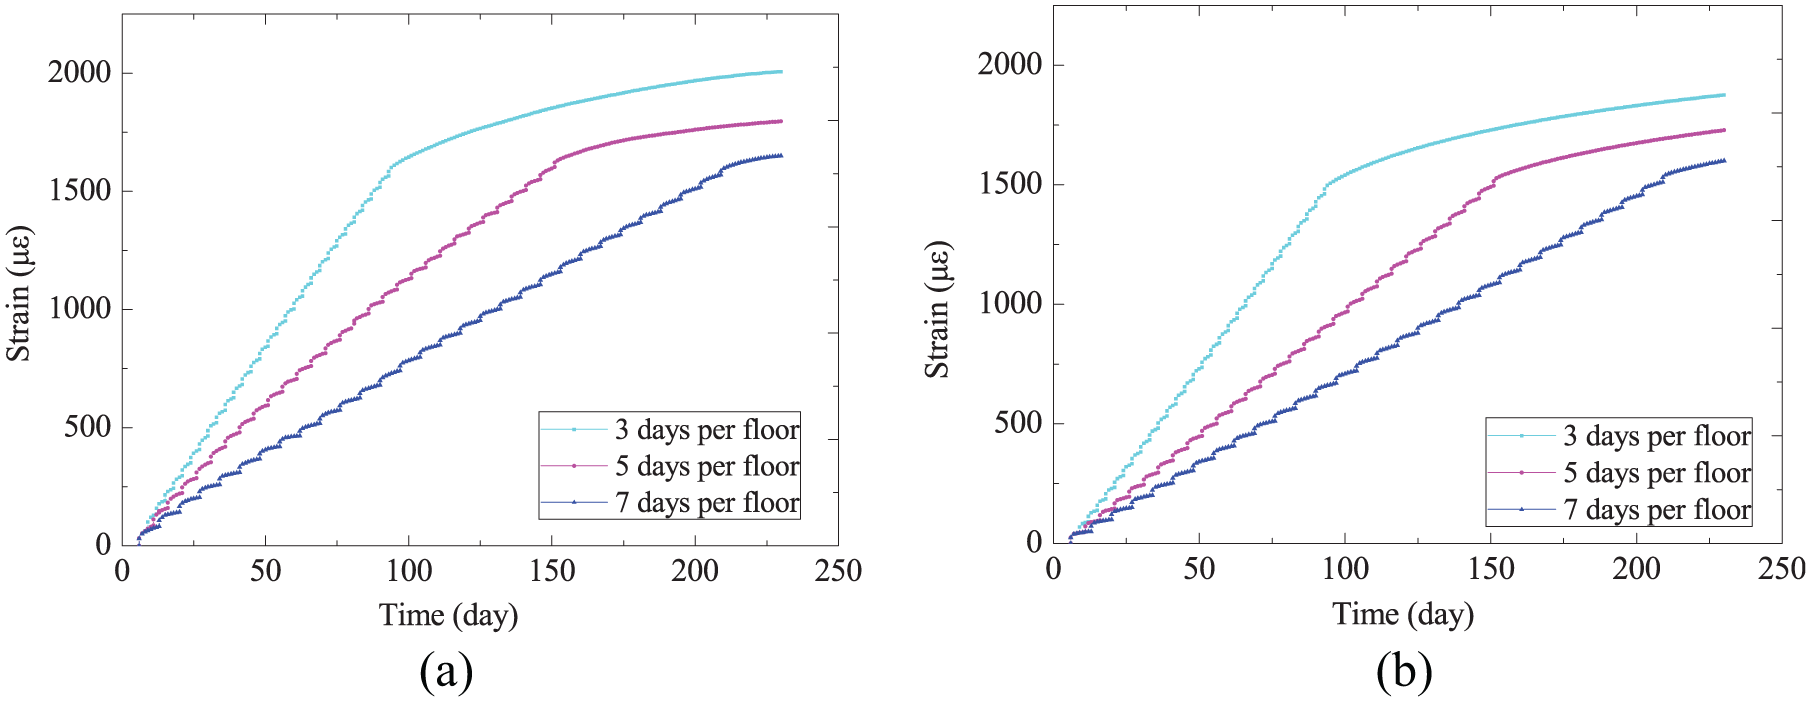
Stress-dependent strain of multi-stage loading cases: (a) test results and (b) prediction.

Stress-dependent strain comparison between test results and predictions: (a) Δti = 3 days, (b) Δti = 5 days, and (c) Δti = 7 days.

Stress-dependent strain ratio of test results to predictions.
Prediction errors of stress-dependent strain.

In terms of the existing models, the prediction of the development of concrete elastic modulus with time is primarily based on the measured elastic modulus of concrete at the age of 28 days, which is only experimentally verified by zero stress concrete specimens, ignoring the influence of varied stress on the development of concrete elastic modulus. To reveal the effect of load on the development of concrete elastic modulus, comparative curves of time-dependent elastic modulus measured in the experiment and that predicted by equation (6) are illustrated in Figure 13. It is notable that the loading history has a significant impact on the development of elastic modulus. The last stage loading ages of each case are at the age of 93 days (3 days), 151 days (5 days), and 209 days (7 days), respectively. The prediction errors of elastic modulus at typical loading ages can be found in Table 6, in which the minus sign indicates that the prediction value is smaller than its corresponding test result. For the case of Δti = 3 days, the development of concrete elastic modulus lags behind the predicted value (with prediction errors varying from 4% to around 11%) until the accomplishment of loading; for the case of Δti = 5 days, the development of concrete elastic modulus lags behind the predicted value at the early stage (with prediction errors varying from 1% to around 10%) and surpass the predicted value after approximately the age of 70 days (with prediction errors varying from −4% to around −12%); similarly, for the case of Δti = 7 days, the turning point is around the age of 48 days (with prediction errors varying around 1% to 12% and −1% to −17%, respectively).
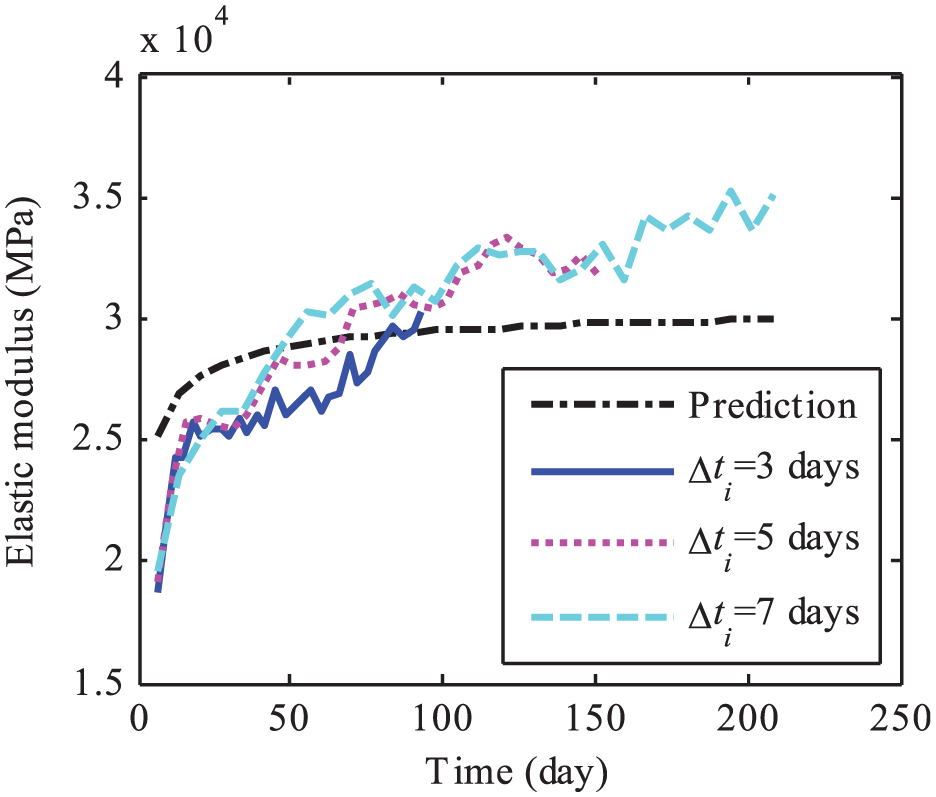
Time-dependent elastic modulus development comparison of test results and predictions.
Prediction errors of elastic modulus.

A common characteristic is that the measured elastic modulus in all three loading cases is smaller than that of prediction ones before concrete age of 28 days, the period during which elastic modulus develops the most. Apparently, compression stress poses a negative effect on the development of elastic modulus of early-age concrete, and the load history with shorter step time has larger negative effect. This is partly due to the fact that the existence of compression stress accelerates the moisture transfer, which to some extent hinders the cement hydration process. The extra stress applied on early concrete also easily causes micro-crack propagation at the interfacial transition zone (ITZ), and in the meantime, the expansion of micro-cracks results in stress redistribution until attaining a new stress balance. In terms of the final value of elastic modulus when the load increased to 180 kN in each case, the measured elastic modulus are larger than the prediction values. An explanation is that the use of fly ash in the components of the concrete can contribute to the later concrete strength growth. Further experiments are needed to identify the influence of various loads on elastic modulus development, and it is still a far way to take into account this effect in existing prediction models of elastic modulus.
Conclusion
In this study, the stage load method was used to simulate the construction process of axial elements in high-rise buildings and the effect of incremental load history on time-varying deformation of concrete was investigated. The following conclusions can be drawn:
The traditional calculation method for predicting the time-dependent deformation underestimates the actual shortening deformation of axial concrete members under construction loading histories. Furthermore, the prediction error is significant at early stage of construction process, varying from 20% to 80% and tends to weaken after construction being completed, dropping to around 5%.
The underestimation in axial shortening deformation of a concrete member is mainly caused by the inappropriate use of elastic modulus. The time development equations of elastic modulus recommended by current standards ignore the adverse influence of loading history applied on concrete, and the step-by-step loading history with shorter time step has more negative impact on elastic modulus, which makes it around 5%–11% lower than the predicted values.
Footnotes
Acknowledgements
D.Z. and T.L. conceived and designed the experiments; C.D. and H.C. performed the experiments; D.Z. and C.D. analyzed the data; T.L. and J.T. contributed materials; and C.D. wrote the paper.
Declaration of Conflicting Interests
The author(s) declared no potential conflicts of interest with respect to the research, authorship, and/or publication of this article.
Funding
The author(s) disclosed receipt of the following financial support for the research, authorship, and/or publication of this article: The reported research was supported by the National Natural Science Foundation of China under grants 51678200 and 51678205, National Key Research and Development Plan under grant 2018YFC0705400, Guangdong Provincial Natural Science Foundation of China under grant 2017A030313259, and Program of Shenzhen Science and Technology Plan under grants JCYJ20170307150200952 and JCYJ20170811160514862.