
Abstract
As the most widely used coupling structure in electromechanical systems, bolt coupling is the important part in these systems. The reliability and strength of bolted joint are affected by pretension force, which is one of the most important factors to ensure the stability of bolt coupling. The inspection personnel hit the bolt with a hammer and judge the state of the bolt based on the sound. Although this method is very simple, the ability of the human ear to distinguish the knocking sound is poor, it can only distinguish the bolt with larger looseness. So a bolt loosening detection method based on audio classification is presented in this article. First, the hammering sound at different levels of bolt loosening was collected by smartphone. Then, the audio data were extracted to form a dataset. Finally, the support vector machine was used to train and test the dataset, and obtain the bolt loosening quantitative detection. A series of experiments were carried on to verify the accuracy and stability of this method. The results show that this method has high recognition accuracy and strong noise immunity. Therefore, this method can effectively reduce the occurrence of disasters.
Introduction
Bolt coupling is the most widely used coupling method in steel structure. It is designed to be applied to all kinds of large equipments and structures in civil, mechanical, chemical, and aerospace industries. However, it is one of the weakest parts in these systems. The reliability and strength of bolted joint are affected by pretension force, which is one of the most important factors to ensure the stability of bolt coupling. Therefore, before the installation and use of the equipment, there are strict requirements on the bolt pretension force, so that the bolts are tightened in accordance with the regulations. The different levels of bolt loosening will occur under the influence of the environmental factors. It seriously affects the safe operation of equipment, and even leads to the safety accidents. Therefore, it is necessary for these systems to detect the bolt loosening quickly. The apply load method of the pretension force of the bolt is divided into the wrench torque, the angle of the bolt, and the extension of the bolt. The bolt loosening detection is essentially the detection and identification of the remaining amount of pretension force. In view of the different detection methods for the remaining amount of pretension force, the existing detection methods are divided into the detection method based on structural vibration signal (Guarino and Hamilton, 2014), the detection method based on the acoustic emission signal (Ding et al., 2014; Liang and Yuan, 2015; Ritdumrongkul et al., 2003; Yang and Chang, 2006), the detection method based on image recognition, and the detection method based on bolt angle and elongation (Cha et al., 2016; Park et al., 2015a, 2015b; Wu et al., 2016). The structural vibration signals mainly depend on the vibration characteristics of the structure. When stimulating the structure, the vibration signals of the structures are extracted, and the bolt loosening can be analyzed. The wider frequency response of the acoustic emission signal contains more information and represents more fault feature. Thus, the loosening can be identified easily (Heylen et al., 1997). Nevertheless, these methods require the professional acquisition equipment, so they have not been widely used in engineering context. The study for the detection method based on image recognition has only begun to appear in recent years. It is still in the preliminary stage, and the identification range is too small. In view of these, this article proposes a method of bolt loosening detection based on audio classification.
Machine learning detection technology based on audio classification has been widely used in the fields of medicine (Collado-Villaverde et al., 2017; Palaniappan et al., 2013), electrical fault detection (Saucedo-Espinosa et al., 2017), and speech analysis (Shin et al., 2010). However, it has not been sufficiently developed in the field of structural health monitoring (SHM). Although there are many detection methods for bolt loosening detection, these methods are limited by professional instruments. Now, inspectors always determine whether the bolt is loosened by hammering sounds. Nevertheless, the new inspectors who are restricted by limited experience cannot accurately judge whether the bolt is loosened by the hammering sounds. The machine learning algorithms can solve this situation and it has become more and more important with the improvement of computer performance. In many machine learning algorithms, support vector machine (SVM) can get much better results than other algorithms in the small sample size problem, and has strong generalization ability (Hua et al., 2007), so it has been widely applied in data classification (Zhao et al., 2015), text classification (Tong and Koller, 2002), image retrieval (Tong, 2001), and other fields.
In addition, with the rapid development of smartphones in recent years, their quality and quantity have both grown in leaps and bounds, achieving strong data processing and telecommunication capabilities. Zhao et al. (2015a, 2015b, 2016) studied the application of smartphones in the field of SHM, which invokes the sensors embedded in a phone to monitor the status of different structures. Their experimental results show that a smartphone-based method is stable and reliable in meeting the different engineering demands. Therefore, bolt loosening detection and smartphone are combined to break the constraints of professional instruments and remove the obstacles of the empirical factors in the detection process, so that the inspectors can complete the detection process of bolt loosening only by a smartphone. In this article, the recording function of the smartphone is used to collect the hammering sound. Any smartphone with a recording function can be used as a collection device.
This article proposes a new bolt loosening detection method based on audio classification. First of all, the hammering sound is collected by a smartphone. Second, some characteristic parameters are extracted from the hammering sound data for different degrees of bolt loosening. These parameters constitute sample datasets which are divided into training set and test set. Finally, training set can be trained to get a prediction model based on SVM. Test set is used to verify the accuracy of the prediction model. In order to verify the accuracy and stability of the method, a confirmatory experiment has been completed. The results show that this method has high recognition accuracy and strong noise immunity. In order to verify the practicability of this method, the multi-classification identification test of multiple bolts loosening was completed. The results show that the quantitative recognition accuracy for bolt loosening is still high, and it can meet the need of engineering. The detection method based on the SVM can identify and detect the bolts loosening conditions with high precision, and does not require any professional acquisition instrument. It is more economical and convenient.
Audio-based bolt loosening detection
A new bolt loosening detection method based on audio classification is presented in this article, the process of this method is shown in Figure 1. In the first step, the hammering sound is collected by a smartphone; in the second step, each sample data are extracted from the collected audio data by the endpoint detection algorithm; in the third step, each sample data extract the principal components from 20 principal components analysis (PCA) as time domain feature parameters and the 24 Mel-frequency cepstral coefficients (MFCCs) as frequency domain feature parameters. These feature parameters constitute the dataset. In the last step, some dataset are selected as training set, which can be trained to prediction model based on SVM. The prediction model can achieve the detection of bolt loosening. These four steps will be described in detail below.

Process of the proposed audio-based bolt loosening detection.
Data collection
With the rapid development of smartphones, its functions are becoming more and more powerful. As one of the main functions of a smartphone shown in Figure 2, recording function has been able to replace the professional voice recorder for general users. Therefore, the detection method can reduce detection costs and effectively improve scalability. In this article, the iPhone 6 is selected as the collection device and the recording parameters of the phone are shown in Table 1.

The recording function of smartphone.
The sound recording parameters of iPhone 6.

SNR: signal-to-noise ratio.
M4A is the recording file format for iPhone 6, and it is a file extension for an audio file encoded with advanced audio coding (AAC). In general, the quality of M4A is better and its file size is smaller than WAV file. For example, the length of audio is 5.5 min; the sampling frequency is 44.1 kHz, and the quantification is 16 bit. The M4A file size is 2.53 megabyte (MB), and the WAV file size is 55.7 MB. Accordingly, compared with voice recorder, the iPhone 6 not only stores more digital audio data but also the quality of audio is better.
Sample extraction
The collected audio data are shown in Figure 3. One hammering sound is selected as a sample data. To acquire convenience, we collected hundreds of samples at a time in an audio file. These samples need to be accurately extracted by endpoint detection. Endpoint detection is the basis for speech processing and speech recognition, and it separates the speech part from the noise part (Wu and Wang, 2005). In this article, a double threshold detection method based on short-time energy and zero-crossing rate is adopted. Two thresholds are defined for short-time energy and zero-crossing rate, respectively, one is a low threshold, which is sensitive to signals and easily exceeded; another is a high threshold, which is not easily exceeded. Only when the high threshold is exceeded and the signals after it all exceed the low threshold, these signals are identified as a signal. The method has been used for the recognition of every sample’s initial position with energy threshold and zero-crossing rate.

Data curve of samples.
The short-time energy of a signal

where
Zero-crossing rate of a signal


The audio data were processed with the endpoint detection method. As can be seen from Figure 4, there are many red lines. A red line indicates the initial position of one sample data. The initial point of each sample is accurately identified. As some samples were analyzed, we found that every audio sample has been reduced to zero from its initial point to 10,000 points. So the sampling number of each sample is 10,000. Finally, data curve of a single sample is shown in Figure 5.

Initial point identification of each sample.

Data curve of a single sample.
Dataset
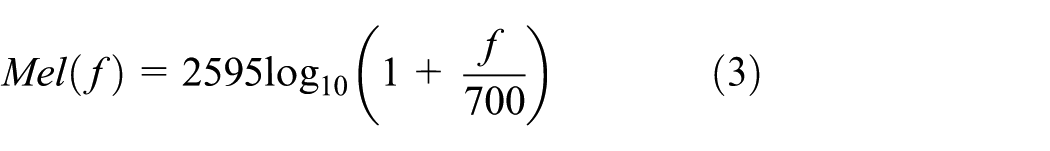
The extracted audio sample data can be analyzed with the frequency domain and time domain. The common frequency range of human hearing is 20 Hz to 20 kHz, although most power of speech signal is included in the low-frequency component, their contribution to the articulation is limited. The level of sound which is heard by the human ear does not have a linear relationship with the sound frequency, but has a linearly proportional relationship with logarithmic of the sound frequency. According to this feature, the Mel scale and Mel filter bank are constructed. The center frequencies are uniformly distributed in the Mel scale, and the bandwidth of every filter is within its critical bandwidth. We can convert frequency to Mel-frequency using the following equations (Xu et al., 2009)
The extracted sample data are pre-emphasized with a transfer function H(Z) = 1 – 0.98Z–1 filter to increase the high frequency part of the sound and enhance the resolution of the high frequency part of the sound. Then, the pre-emphasized speech is separated into short segments called frame, and hamming window is applied to each frame. After the Fast Fourier Transform (FFT) block, the spectrum of each frame is filtered by a set of filters, and the power of each band is calculated (Han et al., 2006). When calculating MFCC parameters, several band-pass filters are necessary, we adopt 24 triangular filters. Let the energy spectrum pass a group of Mel scale triangular filters (Jing et al., 2014). The calculation flowchart is shown in Figure 6.

The calculation flowchart for feature parameters in virtue of MFCC.
The feature parameters of MFCC mainly reflect the static characteristics of sound signal, which is the characteristics of each frame. But the sound waveform is continually and continuously changing, each frame is not isolated. However, the first-order difference of MFCC parameters can reflect the dynamic information of the sound signal. The static information and dynamic information are combined as the feature parameters, which can greatly improve the recognition performance of the system. In this article, the most commonly used first-order MFCC parameters are selected as dynamic information. The feature parameters in virtue of MFCC belong to the analysis of the frequency domain. However, the analysis of the time domain for audio signal is also very important, and can improve recognition performance of the system. The sample data have 10,000 dimensions in the time domain. PCA is used in order to reduce the dimension of the feature vector. So in this section, first 20 principal components are extracted as the characteristic parameters using princomp function in MATLAB. In this system, the 12 orders MFCC parameters, the first-order differential parameter (12 orders), and 20 principal components merge to form a vector.
SVM
In machine learning, SVMs are supervised learning models, which were introduced by Corinna Cortes and Vapnik in 1995. SVMs can be used to solve various real-world problems, and has good characteristic for small samples learning. The method is based on the structural risk minimization against the empirical risk minimization (Amari and Wu, 1999).
It is developed from the optimal classification of linearly separable cases. The basic idea is two types of linearly separable problems as shown in Figure 7. The hollow and solid points in the figure, respectively, represent two types of training samples, the optimal hyperplane is defined as H. The optimal hyperplane can not only separate the two types of samples without errors but also maximize the margin. The former guarantees the least empirical risk while the latter minimizes the extension of confidence in the promotional world and reduces the real risk of the problem. In order to describe the classification hyperplane and consider the existence of samples that cannot be correctly classified by the classification hyperplane, the relaxation variable εi ≥ 0 is imported. In this case, the hyperplane constraints are

where

Support vectors and optimal hyperplane.
After further simplification, in the condition of linear inseparability, the problem of generalized optimal classification can be transformed into

where C indicates a constant that controls the degree of samples misclassified punishment. The default value is 1.
The key of SVM is kernel function. Low-dimensional space vector sets are often difficult to differentiate, the solution is to map them to high-dimensional space. However, this method increases the difficulty of the calculation, but the kernel function just cleverly solved the problem. In other words, just select the appropriate kernel function, you can get classification function of high-dimensional space. The kernel functions commonly used in SVMs include linear kernel function, polynomial kernel function, radial basis function (RBF) kernel function, and sigmoid kernel function. In this article, the recognition effect of these kernel functions are compared, we get the best kernel function which is suitable for bolt loosening detection system.
In the bolt loosening detection system, the dichotomy and multi-classification of audio samples data need to be implemented. Therefore, a library for support vector machines (LIBSVM) which is designed and developed by the professor of Taiwan University Lin Chih-Jen (Chang and Lin, 2011) was selected to construct the SVM classification models. LIBSVM is a SVM software package that can solve the problems of classification, regression, and distribution estimation. And it provides several commonly used kernel functions to be chosen.
Verification experiment
Introduction of experiment
In this section, a simple experimental structure was designed. The experimental structure is composed of three iron plates, two of which are used as supports. The nine standard bolts and nuts, M28, were installed on the plate. The structure was made by iron plate with length (L) of 400 mm, width (W) of 240 mm, and thickness (t) of 10 mm as shown in Figure 8. The distances between the centers of bolts were 70 mm in the horizontal direction and in the vertical direction. In addition, the hammer, the torque wrench, and the smartphone were used in this experiment.

Main dimensions of bolt joint model.
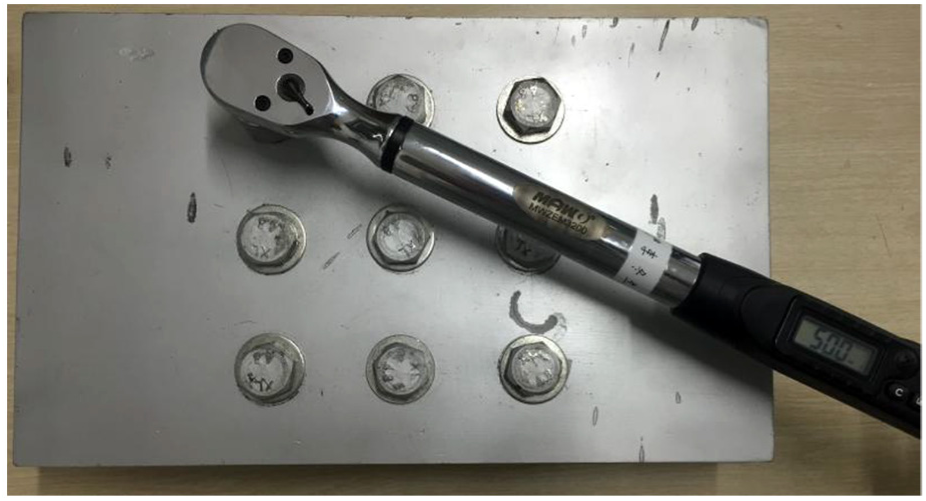
To verify the feasibility of the bolt loosening detection method based on audio classification, the pretension force of a bolt under the two conditions were, respectively, 0 and 20 N m. The hammer was used to knock the bolt, the hammering sound was collected by smartphone as shown in Figure 9. After the two sample data are processed, the SVMs were used for classifying and identifying. Compared with the four kernel functions, we got the optimal kernel function which was suitable for the method. Moreover, in order to further prove the stability and ability of resistance to noise of this detection method, the audio data had to be added with Gaussian white noise with noise-to-signal ratio of 5% and 10%, respectively. After that, the accuracy of classification for two noise conditions were compared.

The picture of test: (a) instruments of inspection and (b) data acquisition process.
Classification recognition
Data preprocess
The sample data are extracted from audio file by short-time energy and zero-crossing rate. Then the MFCC parameters and principal components are extracted from each sample. The first class data collected under the pretension force is 0 N m. The second class data collected under the pretension force is 20 N m. The label value of the first class data is 1, this class has 284 samples. The label value of the second class data is 2, this class has 270 samples. The dataset is constituted by characteristic parameters, which are extracted from these samples.
Classification result
In all, 50 samples are selected as the test set, and the remaining samples are used as training set. There are four commonly used kernel functions in SVM, namely, linear, polynomial, RBF, and sigmoid. In order to select the appropriate kernel function to get high recognition accuracy, the performance of SVM with four different kernels is shown in Table 2. As it can be seen, we gather predictions from the trained model on the inputs from the test set and compare them to the withheld output values of the test set. The accuracy of the predictions in each class were inspected. When the polynomial and the RBF function were selected as the kernel function, respectively, the recognition accuracy can reach 92%, far exceeding the recognition accuracy under the linear kernel function and sigmoid kernel function.
Recognition accuracy (%) among different kernel functions.

RBF: radial basis function.
Add noise
To simulate environment noise, Gaussian white noise has been added to the dataset. In a real environment, noise is often not caused by a single source, but by many different sources. Suppose we consider real noise as a combination of random variables with different probability distributions, and each random variable is independent. According to Central Limit Theorem, the normalized sum increases with the number of noise sources, and it approaches a Gauss distribution. Based on this assumption, the use of synthetic Gaussian noise is a simple and accurate approximation simulation. Thus, it is appropriate to choose Gaussian white noise as noise. Gaussian white noise with the noise-to-signal ratio of 5% and 10% was added to the hammer impact audio responses, respectively. The two values are often used in noise analysis (Xiao et al., 2004). The data curve after adding noise is shown in Figure 10. After adding noise, the characteristic parameters are extracted from these samples, whose label value constitutes the new dataset. The performance of SVM with four different kernels is shown in Table 3. As can be seen, different levels of noise are added to the data, but it has almost no effect on the recognition accuracy. Therefore, the bolt loosening detection method based on audio classification has strong noise immunity.
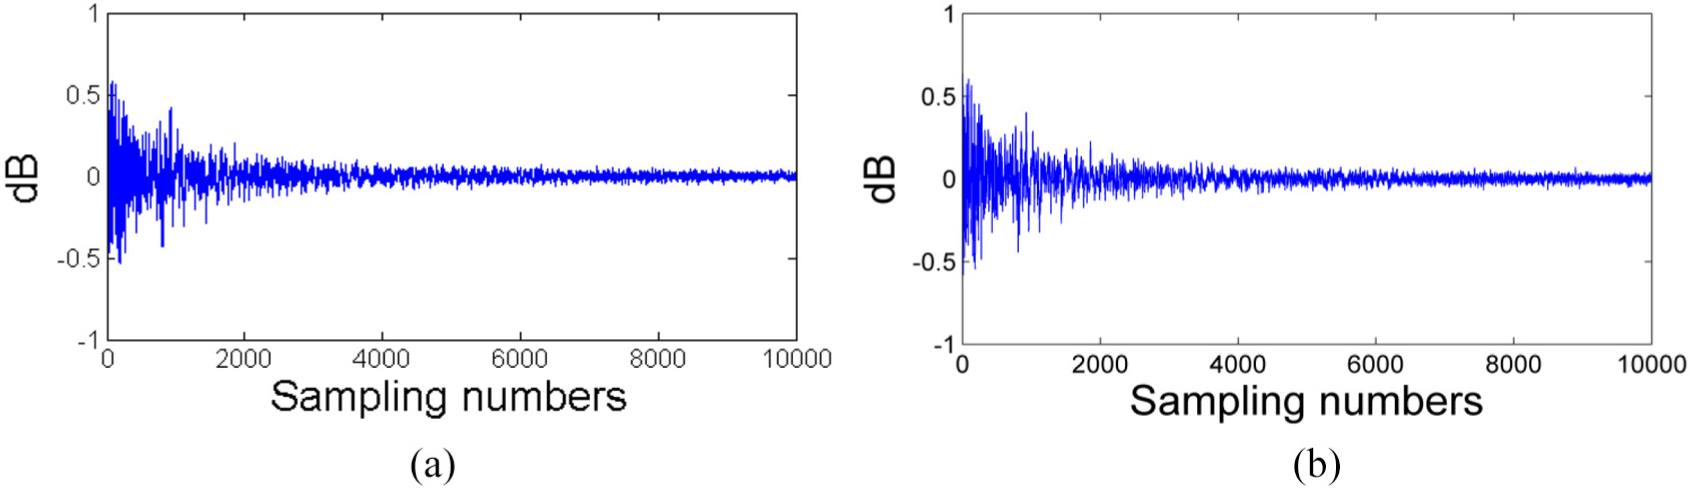
Add Gaussian white noise: (a) add 5% Gaussian white noise and (b) add 10% Gaussian white noise.
Recognition accuracy (%) after adding Gaussian white noise.

RBF: radial basis function.
Multi-class recognition for bolt
Introduction of test
The previous section of this article has verified the feasibility and stability of the audio-based bolt loosening detection method. However, the previous test only carried out a two-class recognition for bolt loosening. In order to further judge the multi-classification recognition of the bolt in various loosening states, the pretension force of a bolt under the seven conditions are, respectively, 0, 10, 20, 30, 40, 50, and 60 N m. Since torque range of torque wrench is 10–200 N m, and the pretension force of bolt was applied by hand manually completely as shown in Figure 11, the range of error is 1–3 N m. Therefore, the interval between each pretension force is 10 N m, the maximum pretension force is 60 N m by us.
Pretension force.
Classification recognition
Hammer tapping test was carried on a bolt under the seven conditions mentioned above, and the sound was collected by the smartphone. Each class dataset selects the characteristic parameters of 50 samples as the test set, others are the training set. The sample number and recognition accuracy under two different kernel functions are shown in Table 4. The results show that the recognition accuracy of these seven classes are very high, the recognition accuracy of each class is above 92% with the polynomial kernel function especially. Although the recognition accuracy under RBF kernel function is not higher than polynomial kernel function, RBF function can map low-dimensional data into high-dimensional space, more conducive to the classification of small samples. Therefore, this detection method chooses RBF function as the kernel function.
Recognition accuracy (%).

RBF: radial basis function.
Multi-class recognition for multi-bolt
Introduction of test
The above two tests are based on a single bolt loosening. Although the recognition accuracy can meet the needs of engineering, it cannot be used in large scale in practical engineering applications. To prove the scalability of this method, the hammering sound was collected with each bolts under seven conditions. The bolt loosening sample database can be established using these audio data, these sample are regarded as training sets. The number of each class in this sample database is shown in Table 5.
The database for multi-bolts loosening detection.

Classification recognition
The pretension force of each bolt is placed in Figure 12. The hammering sound is collected by smartphone, the 50 samples are extracted from audio data of a bolt as testing set. Finally, there are 450 samples. The recognition accuracy of each bolt is shown in Table 6, in which the accuracy of the identification of five bolts reaches more than 90%, the worst accuracy rate of No. 3 has also reached 82%. The average recognition accuracy of the nine bolts is 89.78%. The test set has 450 samples, of which 46 samples were misidentified, of which 16 were misidentified as neighbor class. For example, the label value of a sample is 20 N m, the sample was misidentified for 10 or 30 N m. In this test, there are seven labels, and the pretension force difference between adjacent labels is 10 N m. However, in practical applications, such a small pretension force difference is not needed. If the pretension force difference between adjacent labels is 20 N m, only 30 samples were misidentified with a larger error, the average recognition accuracy can reach 93.3%.

The number of bolts and their pretension force.
Recognition accuracy (%).

Discussion
The inspection personnel hit the bolt with a hammer and judged the state of the bolt based on the sound. It is very convenient and simple for the inspection personnel. Therefore, a bolt loosening detection method based on audio classification is proposed. The phone is used to collect hammering sound, which can be detected by SVM. The acquisition equipment is also very convenient for the inspection personnel. The above sections verify the effectiveness of the bolt loosening detection method based on audio classification. The results show that the method has high detection accuracy. However, the hammering sound is sensitive to noise. In spite of this article showing that Gaussian white noise has little effect on this method, the dataset is not large enough to immunize all types of noise. The article just provides the method of bolt loosening monitoring using hammering sound. This method has high recognition accuracy under normal circumstances.
Conclusion
In this article, a bolt loosening detection method based on audio classification is proposed, and a series of experiments have been completed. The results show that this method can well recognize different states of bolts loosening and it has strong noise immunity. For two-class recognition of single bolt, the recognition accuracy can reach 92%. The different levels of noise are added to the data, it has almost no effect on the recognition accuracy. For multi-class recognition of single bolt, the lowest recognition accuracy can also reach 88%. For multi-class recognition of multi-bolt, the worst accuracy rate of No. 3 has also reached 82%. The average recognition accuracy of the nine bolts is 89.78%. Therefore, this detection method can fully meet the requirements of engineering. In addition, the SVM has been introduced to monitor the bolt loosening, which greatly weakens the requirements of professional experience. It also changes the detection of bolt loosening from qualitative detection to quantitative detection, which can better protect the mechanical structure with bolts.
Footnotes
Author contributions
The work presented here was carried out in collaboration between all authors. Yang Zhang and Xuefeng Zhao contributed the conception and design of the detection system. Yang Zhang, Xiaowei Sun, Wensheng Su, and Zhigang Xue carried out the bolt loosening detection. Yang Zhang and Xuefeng Zhao analyzed the test data and prepared the manuscript.
Declaration of conflicting interests
The author(s) declared no potential conflicts of interest with respect to the research, authorship, and/or publication of this article.
Funding
The author(s) disclosed receipt of the following financial support for the research, authorship, and/or publication of this article: Thanks are due to the financial supports of the National Key R&D Program of China during the 13th Five-Year Plan Period (2016YFC0802002), the Science and technology project of Jiangsu Province Special Equipment Safety Supervision Inspection Institute in 2016 (KJ (Y) 2016008), and the National Natural Science Foundation of China (51479031).