
Abstract
Ultra-high-performance concrete is typically defined as an advanced cementitious material that has a compressive strength of over 150 MPa and superior durability. This article presents the development of a new type of ultra-high-performance concrete, namely, ultra-high-performance seawater sea-sand concrete. The development of ultra-high-performance seawater sea-sand concrete addresses the challenges associated with the shortage of freshwater, river-sand and coarse aggregate in producing concrete for a marine construction project. When used together with corrosion-resistant fibre-reinforced polymer composites, the durability of the resulting structures (i.e. hybrid fibre-reinforced polymer–ultra-high-performance seawater sea-sand concrete structures) in a harsh environment can be expected to be outstanding. The ultra-high strength of ultra-high-performance seawater sea-sand concrete and the unique characteristics of fibre-reinforced polymer composites also offer tremendous opportunities for optimization towards new forms of high-performance structures. An experimental study is presented in this article to demonstrate the concept and feasibility of ultra-high-performance seawater sea-sand concrete: ultra-high-performance seawater sea-sand concrete samples with a 28-day cube compressive strength of over 180 MPa were successfully produced; the samples were made of seawater and sea-sand, but without steel fibres, and were cured at room temperature. The experimental programme also examined the effects of a number of relevant variables, including the types of sand, mixing water and curing water, among other parameters. The mini-slump spread, compressive strength and stress–strain curve of the specimens were measured to clarify the effects of experimental variables. The test results show that the use of seawater and sea-sand leads to a slight decrease in workability, density and modulus of elasticity; it is also likely to slightly increase the early strength but to slightly decrease the strengths at 7 days and above. Compared with freshwater curing, the seawater curing method results in a slight decrease in elastic modulus and compressive strength.
Keywords
Introduction
Coastal cities rely heavily on their coastal and marine infrastructure (e.g. ports, bridges and offshore wind farms) for socioeconomic development. The major challenges for coastal and marine infrastructure development include steel corrosion, which is the main cause for infrastructure deterioration, and the shortage of freshwater and river-sand for making concrete. To address these challenges, the first author has recently proposed (Teng, 2014; Teng et al., 2011) a new type of concrete structures: seawater sea-sand concrete (SSC) structures reinforced with fibre-reinforced polymer (FRP) composites (i.e. FRP-SSC structures). With this new structural concept, seawater and sea-sand can be directly used in constructing coastal and marine infrastructure by capitalizing on the excellent corrosion resistance of FRP composites (Teng, 2014; Teng et al., 2011). The idea of SSC structures reinforced with FRP composites has already stimulated a significant amount of recent research (e.g. Li et al., 2016, 2018; Wang et al., 2017; Xiao et al., 2017).
Seawater and untreated sea-sand are generally considered to be unsuitable for steel-reinforced concrete structures because of the problem of steel corrosion (BS EN 1008:2002, 2002; BS EN 12620:2013, 2013; JGJ 63-2006, 2006; JGJ 206-2010, 2010). Nevertheless, many studies have been conducted on the effects of using seawater instead of freshwater and sea-sand instead of river-sand as raw materials for concrete on the properties of concrete, and a review of these studies can be found in Xiao et al. (2017). Compared with freshwater, seawater contains much higher salt contents, represented by the high contents of chloride ions (Cl−), sulphate ions (
UHPC is typically defined as an advanced cementitious material that has a compressive strength of over 150 MPa and superior durability (Alkaysi et al., 2016; Graybeal, 2011; Graybeal and Tanesi, 2007; Richard and Cheyrezy, 1995; Wille and Boisvert-Cotulio, 2015; Wille et al., 2011, 2014). The ultra-high strength of UHPC is generally achieved by increasing its particle packing density, improving the interfacial transition zones between aggregate(s) and the paste matrix, and enhancing its homogeneity (Shi et al., 2015; Wille and Boisvert-Cotulio, 2015). Therefore, the production of UHPC normally does not involve the use of coarse aggregate (Shi et al., 2015). To increase the tensile strength and fracture toughness, steel fibres are often used in the mix proportion of UHPC, and such UHPC is also referred to as ultra-high-performance fibre-reinforced concrete (UHPFRC; Shi et al., 2015). Steel fibres, although beneficial to the mechanical properties of UHPC, especially its ductility and tensile strength, are expensive and contribute considerably to the high cost of UHPC. Various curing regimes, including room temperature curing, heat curing under atmospheric pressure and autoclave curing, have been used in the production of UHPC, and their effects on the material properties have been investigated. While heat curing and autoclave curing have been found to considerably increase the strength of UHPC (Shi et al., 2015), they generally involve the use of specific equipment and can be both costly and inconvenient.
The raw materials used to make UHPC typically include water, cement, silica fume, supplemental fine materials (e.g. fly ash, ground granulated blast furnace slag (GGBS) and silica powder), high-range water reducer (HRWR), aggregate(s) and fibres (Shi et al., 2015; Wille and Boisvert-Cotulio, 2015). To enhance the homogeneity of concrete, fine quartz sand with a particle size smaller than 600 µm is commonly used as aggregate in early studies on UHPC (Shi et al., 2015). To reduce the material cost, many researchers have investigated various alternatives to quartz sand (e.g. Yang et al., 2009). These studies have conclusively shown that river-sand can be used to replace quartz sand to achieve UHPC with similar properties if the mix proportion is properly designed (Yang et al., 2009). The particle size of sea-sand is typically between those of quartz sand and river-sand and thus has the potential to be successfully used in producing UHPC.
The water-to-binder ratio of UHPC is typically around 0.2 and is much lower than that of normal-strength concrete (e.g. 0.5; Shi et al., 2015). The permeability of UHPC is low because of its dense microstructure: the chloride diffusion coefficient of UHPC can be as low as 1/55 of normal-strength concrete (Roux et al., 1996). Therefore, the detrimental effects of salt ions from both the mixing water and the water from the environment can be expected to be much smaller for UHPC than for normal-strength concrete. There is thus a great potential for UHPC to be made of seawater and to be used in coastal and marine environments.
Against the above background, this article presents the first ever experimental study on the development of UHPC with seawater and sea-sand (i.e. ultra-high-performance seawater sea-sand concrete (UHPSSC)). In this study, the UHPSSC was made without steel fibres to reduce costs and eliminate steel corrosion concerns and was cured at room temperature. The absence of steel fibres means that the present UHPSSC, in strict terms of conventional terminology, is a plain UHPSSC or a UHPSSC matrix. In practical applications, the potential weaknesses associated with the elimination of steel fibres can be addressed at material level by incorporating non-metallic fibres or at component level by the combined use of the present UHPSSC with FRP confinement. For example, the present UHPSSC can be used with filament-wound FRP tubes to form hybrid columns, in which the ductility of UHPSSC in compression can be greatly enhanced by FRP confinement. Teng et al. (2018) have recently proposed a novel type of steel-free reinforcing bars (referred to as hybrid bars) for use in SSC, and such a hybrid bar typically consists of an FRP tube filled with plain UHPSSC which is centrally reinforced with an FRP bar. In these hybrid bars, the UHPSSC can be well confined by the FRP tube, so the absence of steel fibres from the UHPSSC does not create any concerns.
Experimental programme
Mix design
In this study, 15 different mixes were prepared and tested. The mixes all had the same proportions of the six constituents (i.e. cement, silica fume (SF), supplemental fine materials (SM), fine aggregate, water and HRWR); the main differences between the mixes were the raw materials used. The mix proportions were developed by a trial-and-error process based on the recommendations provided by Wille and Boisvert-Cotulio (2015).
Mixes 1 to 5 were designed to investigate the effect of salinity of mixing water and are referred to collectively as Group 1. The five mixes were all prepared with quartz sand (QS) and the so-called artificial seawater (ASW), which was made of tap water (TW) and dissolved commercial sea salt of various doses. Mixes 6 to 10 (referred to collectively as Group 2) were all prepared with river-sand (RS) and tap (fresh) water, while Mixes 11 to 15 (referred to collectively as Group 3) were all prepared with sea-sand (SS) and natural seawater (SW). Other than that, Groups 2 and 3, each with five mixes, were both so designed that the effects of a different cement (i.e. white cement (WC) or ordinary Portland cement (OPC)) and a different supplemental material (i.e. quartz powder (QP) or Class C fly ash (FA)), as well as the effect of sand washing, can be investigated. Table 1 summarizes the details of all the 15 mixes.
Mix proportions (in kg/m3).
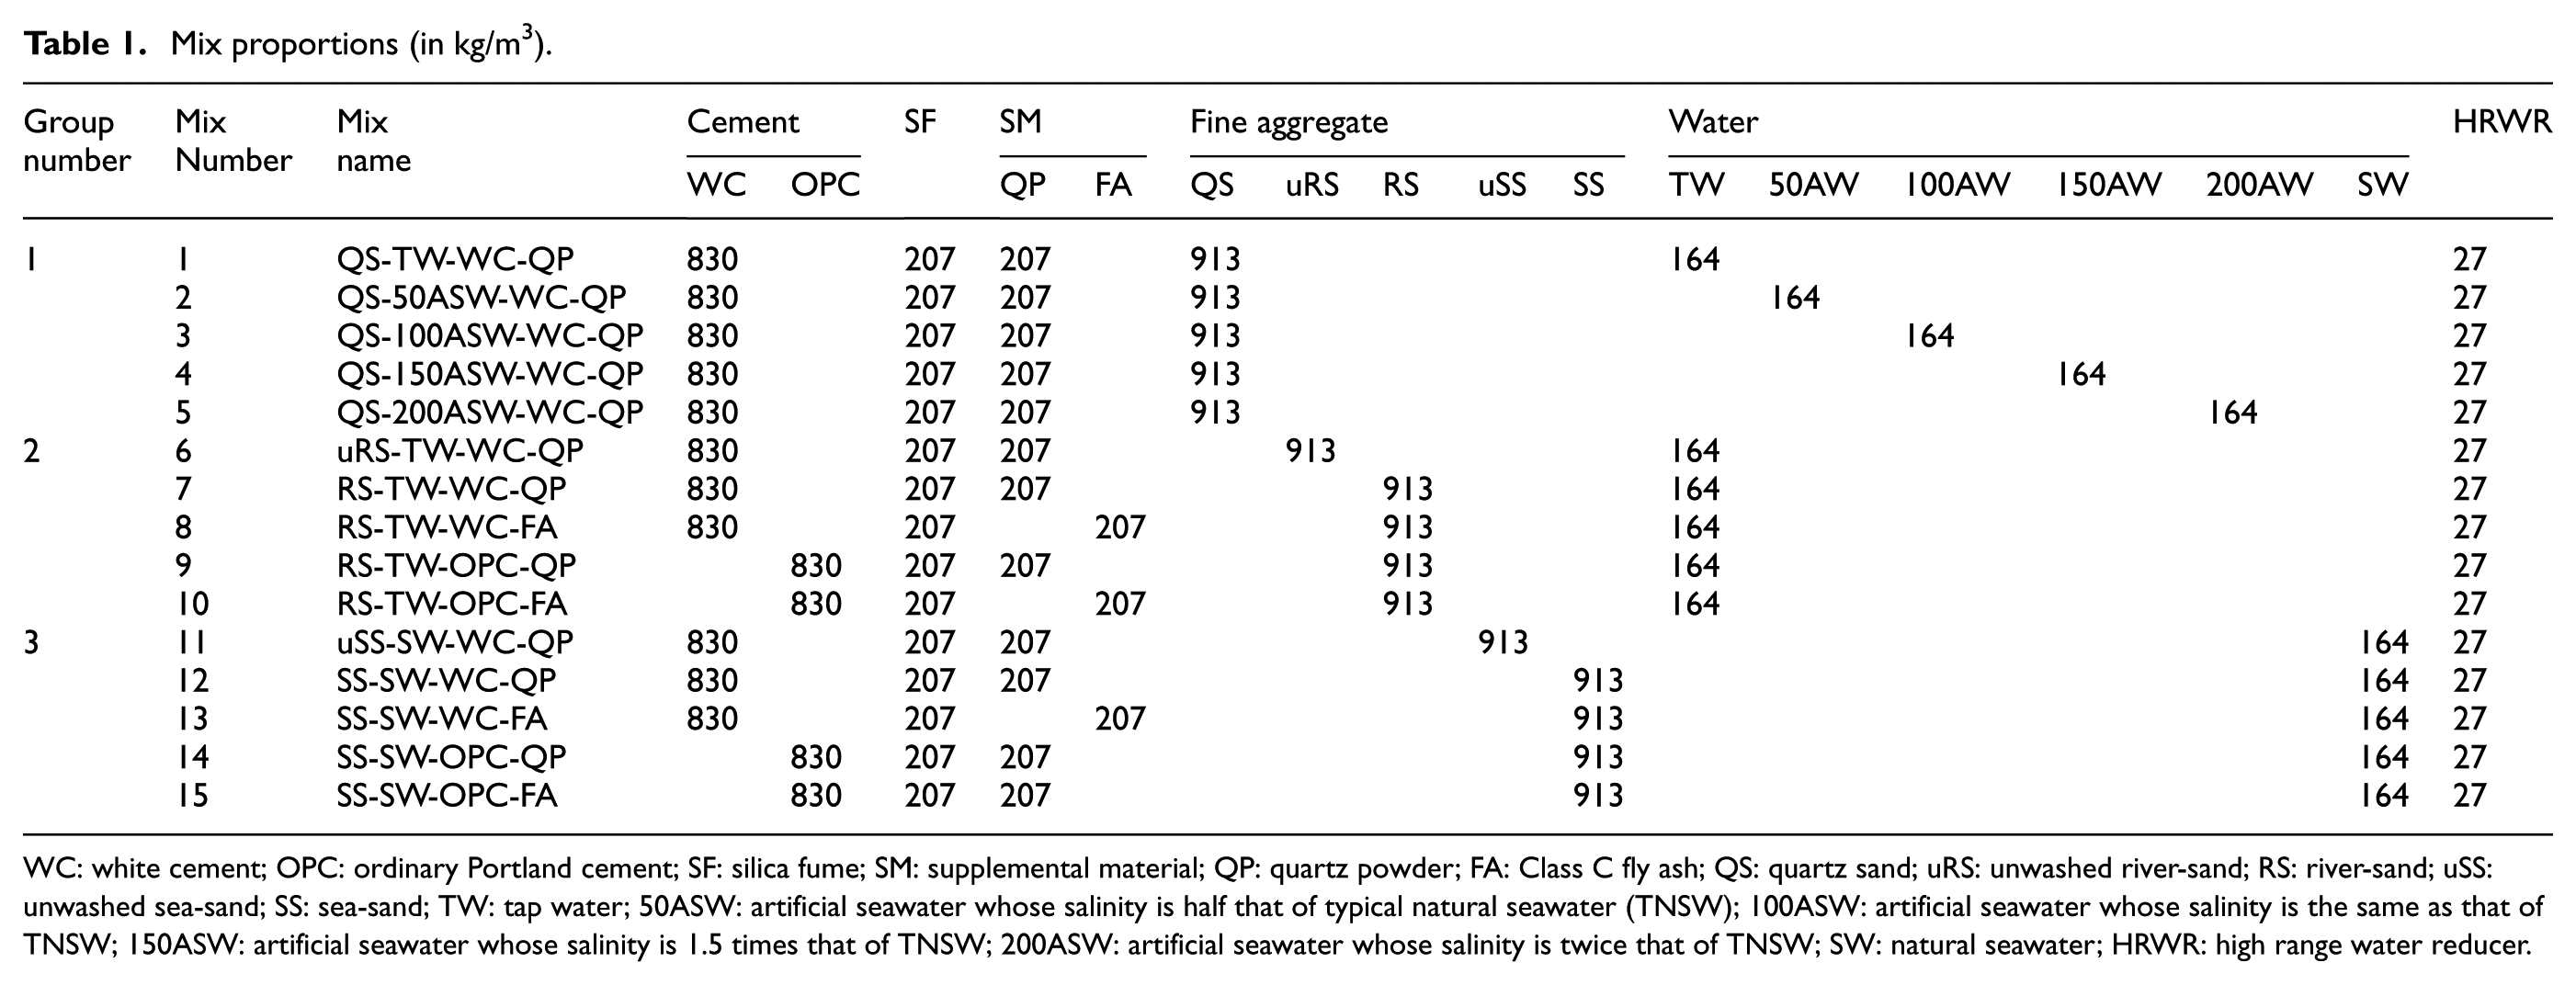
WC: white cement; OPC: ordinary Portland cement; SF: silica fume; SM: supplemental material; QP: quartz powder; FA: Class C fly ash; QS: quartz sand; uRS: unwashed river-sand; RS: river-sand; uSS: unwashed sea-sand; SS: sea-sand; TW: tap water; 50ASW: artificial seawater whose salinity is half that of typical natural seawater (TNSW); 100ASW: artificial seawater whose salinity is the same as that of TNSW; 150ASW: artificial seawater whose salinity is 1.5 times that of TNSW; 200ASW: artificial seawater whose salinity is twice that of TNSW; SW: natural seawater; HRWR: high range water reducer.
Each mix is given a name, which consists of four components representing the fine aggregate, water, cement and supplemental material used in the mix, respectively. In this study, the river-sand and sea-sand were washed before being used, except for Mixes 6 and 11 in which untreated river-sand (uRS) and untreated sea-sand (uSS) were used. Therefore, in the mix names, ‘RS’ and ‘SS’ were used only for treated river-sand and treated sea-sand, respectively. For example, the name SS-SW-WC-QP represents a mix with treated sea-sand, natural seawater, white cement and quartz powder.
Raw materials
Cement
Existing research (e.g. Graybeal, 2011; Sakai et al., 2008; Wille and Boisvert-Cotulio, 2015) suggests that white cement, which is rich in the sum of C3S and C2S, is preferred in making UHPC to ensure favourable strength development and workability. White cement, however, is considerably more expensive than ordinary Portland cement. In this study, an EN 197-1 CEM I 52.5N white cement and an EN 197-1 CEM I 52.5N ordinary Portland cement, both produced by the Green Island Cement (Holdings) Limited, Hong Kong, were used to clarify their effects on concrete properties.
The chemical compositions of the two cements, analysed by X-ray fluorescence (XRF) spectroscopy (AXS GmbH, Bruker), are summarized in Table 2, in which the Bogue components were calculated based on the Bogue equations (Hewlett, 1998). Compared with the ordinary Portland cement, the white cement was found to have high contents of C3S and C2S. In addition, the Fe2O3 content in the white cement (i.e. 0.41%) was very low compared with that in the ordinary Portland cement (i.e. 3.04%), which is the main reason for its white colour (Hamad, 1995). The specific surface area of the white cement (3540 cm2/g) was found to be smaller than that of the ordinary Portland cement (3840 cm2/g).
Chemical and phase compositions of cements, silica fume and supplemental materials.

WC: white cement; OPC: ordinary Portland cement; SF: silica fume; SM: supplemental material; QP: quartz powder; FA: Class C fly ash.
Silica fume and supplemental materials
The silica fume used in all mixes was produced by Sap Corp., China. The chemical composition of the silica fume is given in Table 2, which shows that it had a silica content of over 94%.
Two supplemental materials were used in this study: quartz powder with a mean particle diameter of 7.47 μm from the Y.S. Corp., China, and fly ash with a mean particle diameter of 8.96 μm produced by CLP Power Ltd, Hong Kong. The quartz powder had a silica content of over 96%, while the fly ash had a sum of oxides (SiO2 + Al2O3 + Fe2O3) in the range of 50%–70% and can thus be classified into a Class C fly ash according to ASTM C618-17a (2017) (Table 2).
Quartz powder has often been used in making UHPC because of its high material purity (Wille and Boisvert-Cotulio, 2015). However, the use of fly ash is more environment friendly and economical. In addition, the spherical particle shape and pozzolanic reactivity of fly ash have been reported to benefit the workability, the long-term strength development and the durability of concrete (Hemalatha and Ramaswamy, 2017).
Water
Local tap water in Hong Kong was used as freshwater in this study. The chemical composition of the tap water, measured from ion chromatography (IC) tests, is given in Table 3. It is evident from Table 3 that the salinity of the tap water was very small (<0.1 g/L).
Chemical compositions of natural seawater, artificial seawater and tap water (in g/L).

Two sources of mixing water were often used in existing studies on seawater concrete: natural seawater and artificial seawater made of tap water and dissolved commercial sea salt. In this study, natural seawater was used in Mixes 11–15, while artificial seawater was used in Mixes 2–5 so that the salinity of mixing water could be precisely controlled to investigate its effects.
Natural seawater was obtained from three locations along the coast of Hong Kong, and their chemical compositions were measured and compared with the world-average composition in Table 3. It is evident that the chemical compositions of seawater from the three sources are all close to the world-average composition. The seawater from Chek Lap Kok (CLK), which is away from residential areas, was used in Mixes 11–15 of this study.
To select the most suitable salt for making artificial seawater, three commercial sea salts were dissolved in tap water, respectively, all with a dose of 36 g/L, and the chemical compositions of the three types of resulting artificial seawater were measured. Table 3 shows that the Cl− content in Artificial Seawater 1 is slightly lower than the world-average value, but the contents of other ions (e.g. Br−,
Sand
The sea-sand used in this study was mined from CLK, Hong Kong, which is consistent with the source of the natural seawater. The quartz sand was from the Y.S. Corp., China, while the river-sand was purchased from the local market in Hong Kong. Particles with a size of larger than 1.18 mm were eliminated from the sands before being used as suggested by Wille and Boisvert-Cotulio (2015).
Existing research (Fernandes et al., 2007) suggests that the high content of clay in original river-sand and sea-sand may have detrimental effects on the workability and strength of UHPC. Therefore, for most mixes in this study, the river-sand or the sea-sand were washed with tap water to eliminate the clay. Unwashed river-sand and unwashed sea-sand were only used for comparison in Mixes 6 and 11, respectively. It should be noted that sea-sand should ideally be washed by seawater, which is expected to be the case in practice, instead of tap water which may change the salt concentration of sea-sand. Tap water was used for washing sea-sand in this study because of the difficulty in obtaining a large amount of natural seawater. Nevertheless, to minimize the potential effects, the washed sea-sand was soaked in natural seawater for 48 h after being washed. After the above desilting process, the river-sand or sea-sand was dried at 105°C for 48 h and then stored until being used. In accordance with GB/T 14684-2011 (2011), the silt contents of sea-sand and river-sand before desilting were measured to be 5.46% and 0.61%, respectively, while the values for desilted sea and river-sands were 1.54% and 0.25%, respectively.
IC tests were conducted to obtain the chemical compositions of the lixiviums of four kinds of sands: original (unwashed) river-sand and sea-sand, as well as washed sea-sand before and after being soaked in seawater for 48 h. The results summarized in Table 4 show that the original river-sand had a salinity (0.3579 g/L) much lower than that of the original sea-sand (i.e. 4.6809 g/L) and contained a very small Cl content (i.e. 0.0119 g/L). It is also evident that after being washed by tap water, the salinity of sea-sand was dramatically reduced, but it then returned to a level close to that of the original sea-sand after being soaked in seawater for 48 h.
Chemical compositions of sand lixiviums (in g/L).

The particle size distributions (PSDs) of the sands used in the mixes are shown in Figure 1. It is evident that the desilting process had little effect on the PSD. It is also evident that compared to the river-sand, the sea-sand contained more fine particles (e.g. those with a size between 0 and 300 μm; Figure 1). The shell contents of desilted sea- and river-sand were measured to be 1.19% and 0.87%, respectively, in accordance with JGJ 52-2006 (2006). These values are lower than those typically reported by previous researchers (e.g. 4.4% for sea-sand as reported by Liu et al., 2016), which is believed to be at least partially due to the elimination of particles larger than 1.18 mm in this study.

Particle size distributions of sands: (a) cumulative passing and (b) gradations.
HRWR
A polycarboxylate-based superplasticizer produced by the BASF chemical company, Hong Kong, was used as the HRWR in this study. The superplasticizer had a solid content of 22% by mass and a specific gravity of 1.05.
Methodology
Mixing, casting and curing methods
The preparation process of UHPC included two steps: (1) mixing dry constituents (i.e. cement, silica fume, supplemental material and sand) for 5 min; (2) mixing water with HRWR and adding the mixture in two steps, and then mixing for another 8 min until the UHPC reached an acceptable level of fluidity.
The freshly mixed UHPC was slowly filled into 50 mm cube moulds and Ф75 mm × 150 mm cylinder moulds, and then vibrated on a vibration table for 2 min to eliminate air voids in the concrete. After casting, all moulds were covered with a plastic sheet within 10 min. All specimens were demoulded after 24 h.
Three kinds of curing methods were adopted in this study after demoulding: (1) tap water curing: 15 cube samples and 3 cylinder samples of each mix were immersed in tap water at 22°C ± 3°C using a thermostatic water tank until the specific ages for testing; (2) seawater curing: 15 cube samples and 3 cylinder samples of Mixes 12 and 13 were immersed in seawater at 22°C ± 3°C using another thermostatic water tank until specific ages for testing; and (3) 24-h heat curing: 3 cube samples of each mix were immersed in a programmable accelerated curing tank with hot tap water at 90°C ± 1°C for 24 h.
Workability
In previous studies (Meng and Khayat, 2017; Soliman and Tagnit-Hamou, 2017; Wille and Boisvert-Cotulio, 2015; Wille et al., 2011), a dynamic mini-slump spread was usually measured in accordance with ASTM C1437/C1437M-15 (2015) using a flow table specified in ASTM C230/C230M-14 (2014). However, trial tests using the above method showed that the slump spreads of UHPC/UHPSSC in this study exceeded the maximum diameter of the flow table (i.e. 255 ± 2.5 mm) after 25 drops within 15 s. The observation suggested that accurate slump spreads cannot be obtained using this method. Therefore, a free mini-slump spread test was performed in accordance with ASTM C1856/C1856M-17 (2017) to determine the workability of UHPC/UHPSSC in this study.
Density
The densities of all specimens at ages of 1, 28 and 90 days were obtained in accordance with ASTM C642-13 (2013), in which the following equation is given for the calculation of hardened density of a specimen
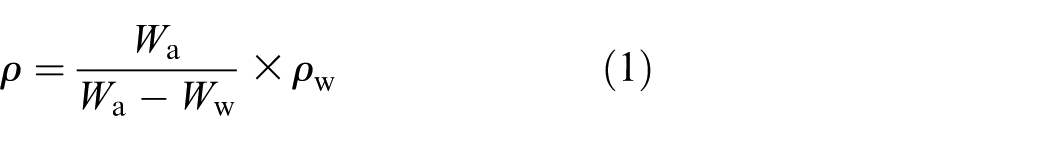
where Wa is the weight of a specimen measured in air, Ww is the weight of a specimen measured in water, and ρw is the density of water, ρw = 1000 kg/m3.
Cube compressive strength
Standard concrete cube tests (50 mm) were conducted to obtain the compressive strengths at ages of 1, 7, 14, 28 and 90 days in accordance with ASTM C109/C109M-16a (2016). For each age of each mix, three specimens were tested, and the average value was obtained. The loading rate of 1 MPa/s was adopted so that each test was completed around 3 min.
Compressive stress–strain relationship
Standard concrete cylinder tests (Ф75 mm × 150 mm) were conducted at an age of 35 days to obtain the compressive stress–strain relationship in accordance with ASTM C1856/C1856M-17 (2017). An MTS testing system was used for these tests with a displacement control rate of 0.18 mm/min, which is similar to the loading rate of 1 MPa/s used for the initial stage of loading. A total of six strain gauges, three in the axial direction with a gauge length of 50 mm and another three in the hoop direction with a gauge length of 30 mm, were installed on each specimen. Figure 2 shows the test setup and layout of strain gauges.
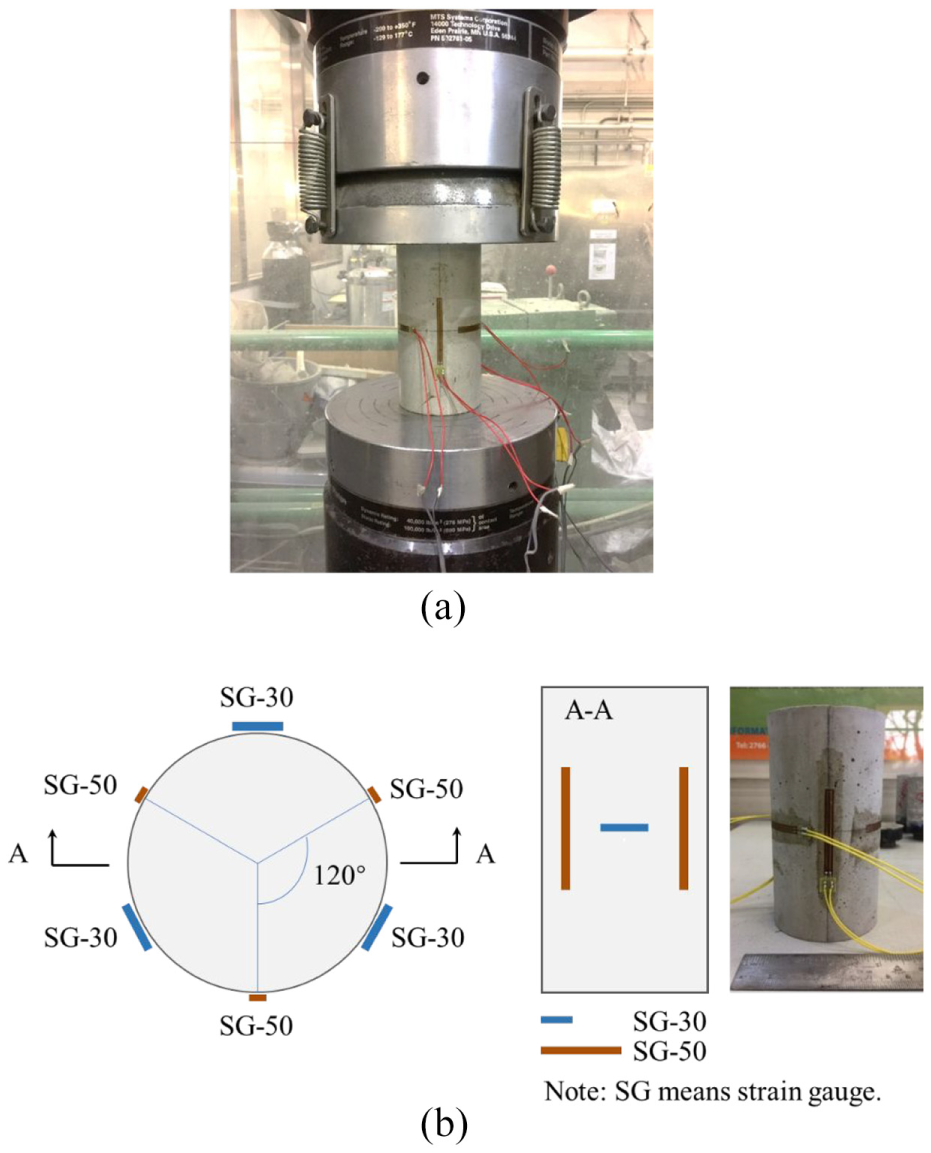
Test setup and instrumentation: (a) test setup and (b) layout of strain gauges.
Material supplies
Only a single supply of each raw material for the concrete was used during the present experimental programme to ensure the consistency of material quality and properties.
Experimental results and discussions
Workability
The workability of UHPC is associated with the good packing of raw constituent materials as well as the compatibility of cementitious materials with the HRWR (Meng and Khayat, 2017) and is normally checked using various slump tests. The slump spreads obtained from free mini-slump spread tests are summarized in Table 5 for all the 15 mixes of this study.
Workability and densities of all mixes.
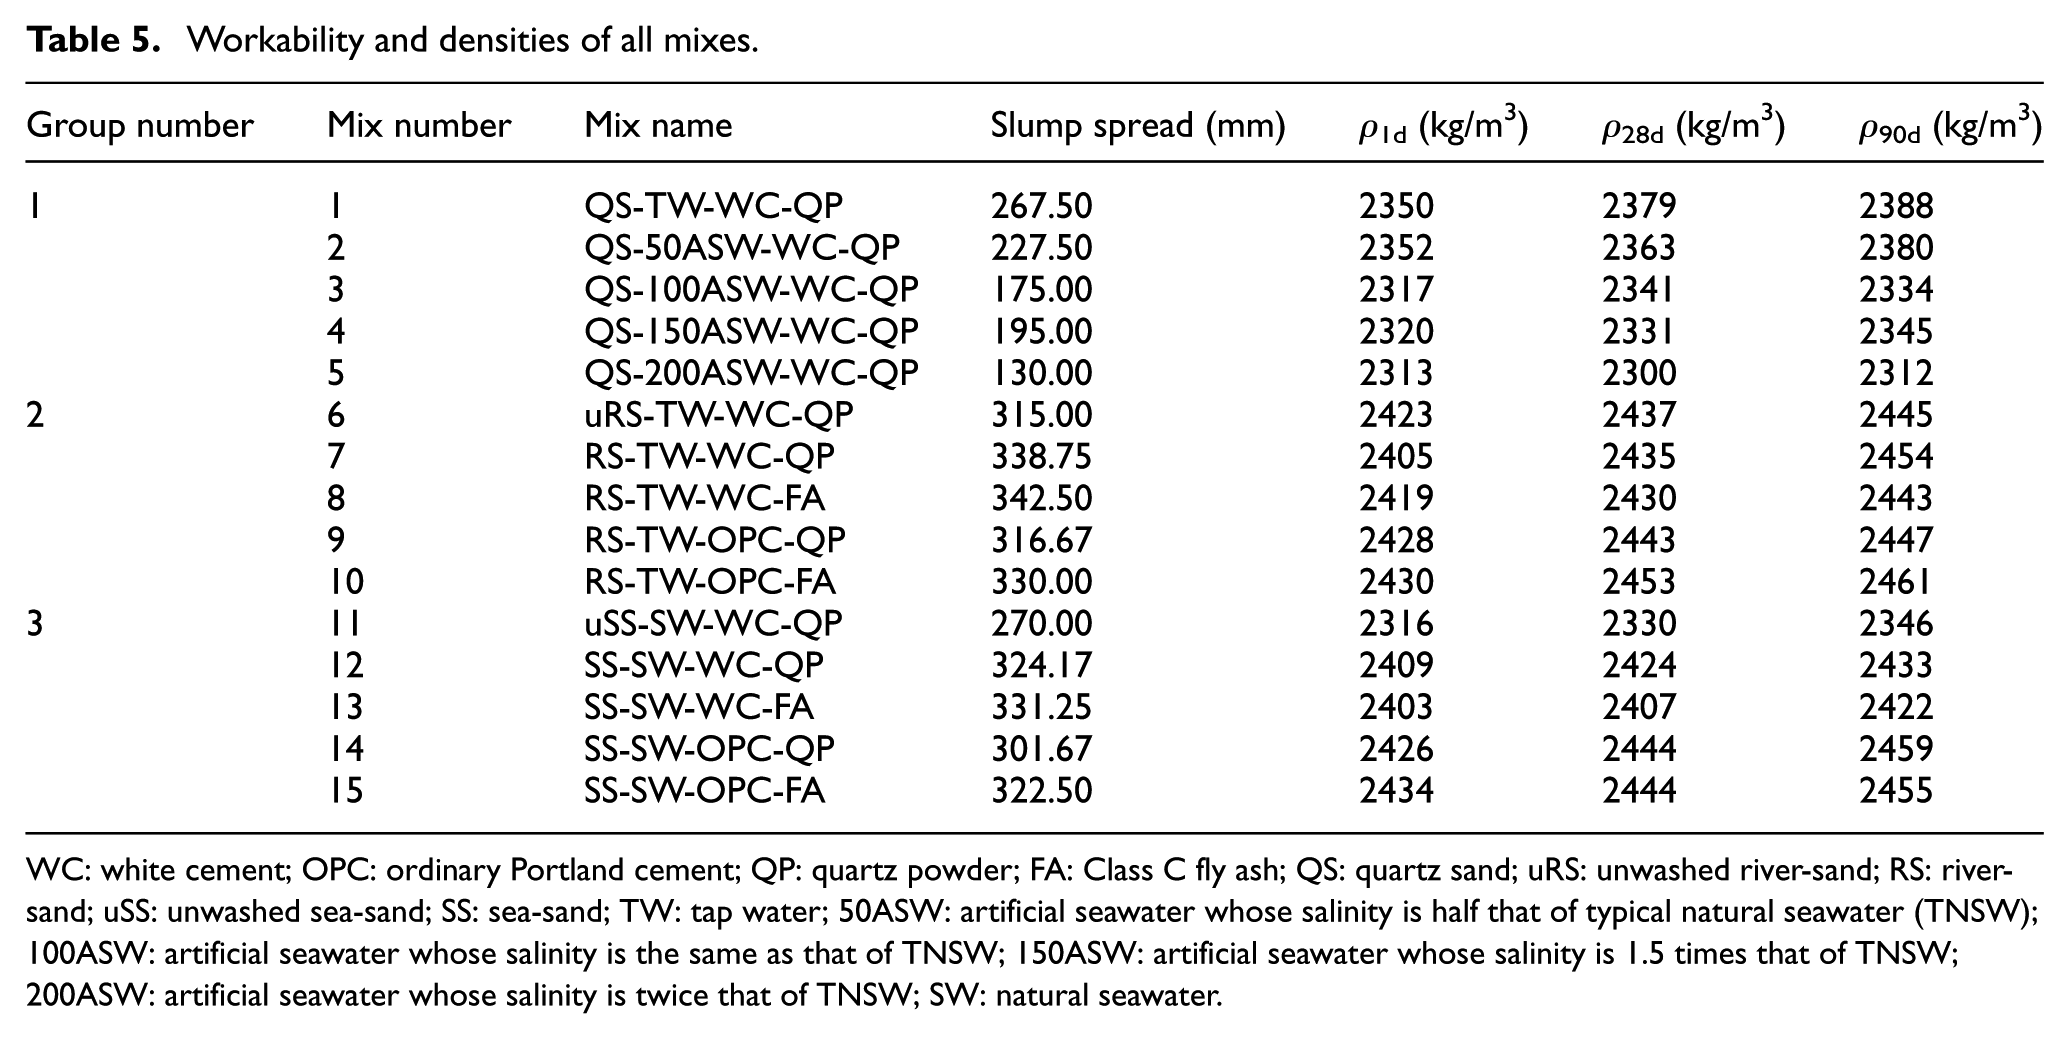
WC: white cement; OPC: ordinary Portland cement; QP: quartz powder; FA: Class C fly ash; QS: quartz sand; uRS: unwashed river-sand; RS: river-sand; uSS: unwashed sea-sand; SS: sea-sand; TW: tap water; 50ASW: artificial seawater whose salinity is half that of typical natural seawater (TNSW); 100ASW: artificial seawater whose salinity is the same as that of TNSW; 150ASW: artificial seawater whose salinity is 1.5 times that of TNSW; 200ASW: artificial seawater whose salinity is twice that of TNSW; SW: natural seawater.
The results of Group 1 (Mixes 1–5) show that the workability of UHPC generally decreases with the salinity of mixing water (Table 5). The slump spread of Mix 5 using artificial seawater with a salinity of 72 g/L was only around 50% of that of Mix 1 using tap water. This is believed to be at least partially due to the existence of CaCl2 in the artificial seawater, which accelerated the formation of C-S-H and heat release in the hydration process (Juengera et al., 2016).
A comparison between the results of Group 2 (Mixes 6–10) and Group 3 (Mixes 11–15) shows that the use of seawater and sea-sand generally leads to decreases in the slump spread, and the degree of decrease appears to be also dependent on other raw constituent materials used in the mix. This observation is consistent with findings from previous studies (Islam et al., 2012; Kaushik and Islam, 1995; Mohammed et al., 2004). Besides the accelerated hydration due to the existence of salts, it is believed that the finer particles (and thus larger surface areas) of sea-sand, as compared with river-sand, may also contribute to this decrease in workability (Hasdemir et al., 2016).
A comparison between the five mixes (Mixes 6–10) of Group 2 shows evidently the effects of various raw constituent materials. The desilting of sand and the replacement of quartz powder with fly ash led to increases in the slump spread, while the replacement of white cement with ordinary Portland cement was found to negatively affect workability. These observations are consistent with previous studies on UHPC and are believed to be at least partially due to the fineness (or surface areas) of the raw constituent materials: the desilting of sand reduced significantly its amount of clay which consists of very fine particles (Fernandes et al., 2007); while compared with the white cement, the ordinary Portland cement used in this study had a larger specific surface area. In addition, compared with the quartz powder, the fly ash has the potential of pozzolanic reactions and may reduce frictions between aggregate particles because of its spherical shape of particles, which both contribute to increased slump spreads (Hemalatha and Ramaswamy, 2017).
Similar observations can be made when comparing the five mixes (Mixes 11–15) of Group 3, which were prepared with seawater and sea-sand. The only notable difference is that the effect of desilting process seems to be much more pronounced for sea-sand than for river-sand, probably due to the larger content of clay in the former (i.e. 5.46%) compared to that in the latter (i.e. 0.61%).
Density
The densities of UHPC at different ages are summarized in Table 5 for all the 15 mixes. These results were obtained using samples subjected to tap water curing at room temperature (i.e. tap water curing). In the subsequent sections, unless otherwise specified, the reported test results were all obtained from samples subjected to tap water curing.
In general, the density increases with the age for all the mixes because of the continuous water absorption process of the concrete when immersed in water (Table 5). The effects of various parameters of the mix on the density appear to be similar to those on the workability: the density generally decreases with the salinity for the five mixes (Mixes 1–5) of Group 1, while the use of seawater and sea-sand generally led to a decrease in density (see results of Groups 2 and 3). The density is shown against the slump spread in Figure 3 to further examine the correlation between the two. It is evident that they are almost linearly correlated (Figure 3).
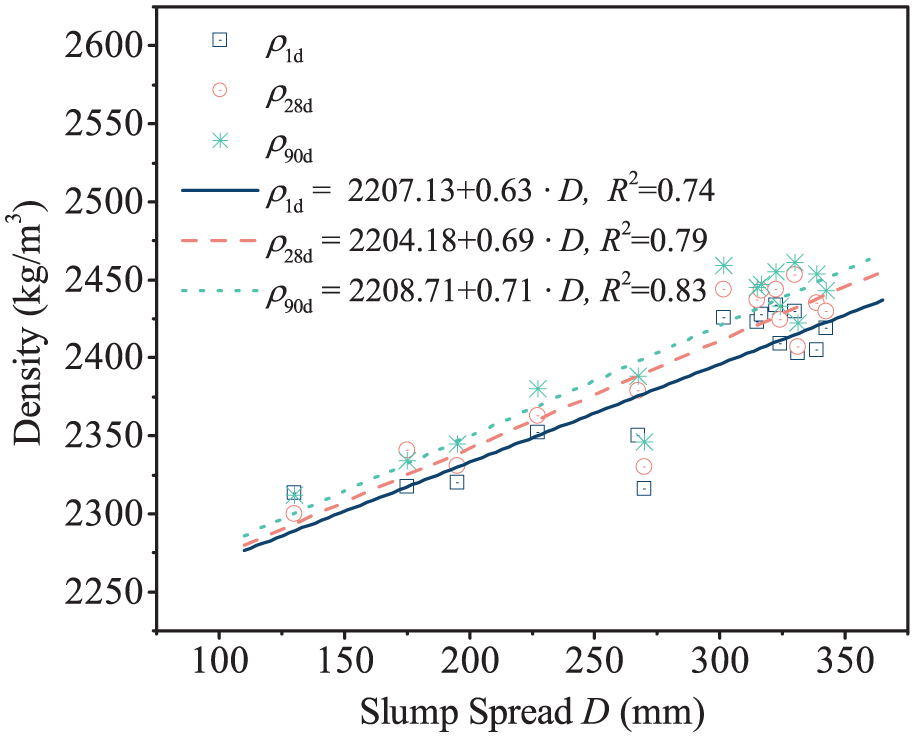
Relationship between density and slump spread.
Cube compressive strength
Table 6 summarizes the results of cube compressive strengths of all mixes at different ages. In Table 6, the mean value and the standard deviation (SD) were both obtained based on the results of three nominally identical specimens. It is evident from Table 6 that the UHPSSC made in this study reached a 28-day cube compressive strength of up to 184 MPa.
Cube compressive strengths of all mixes.
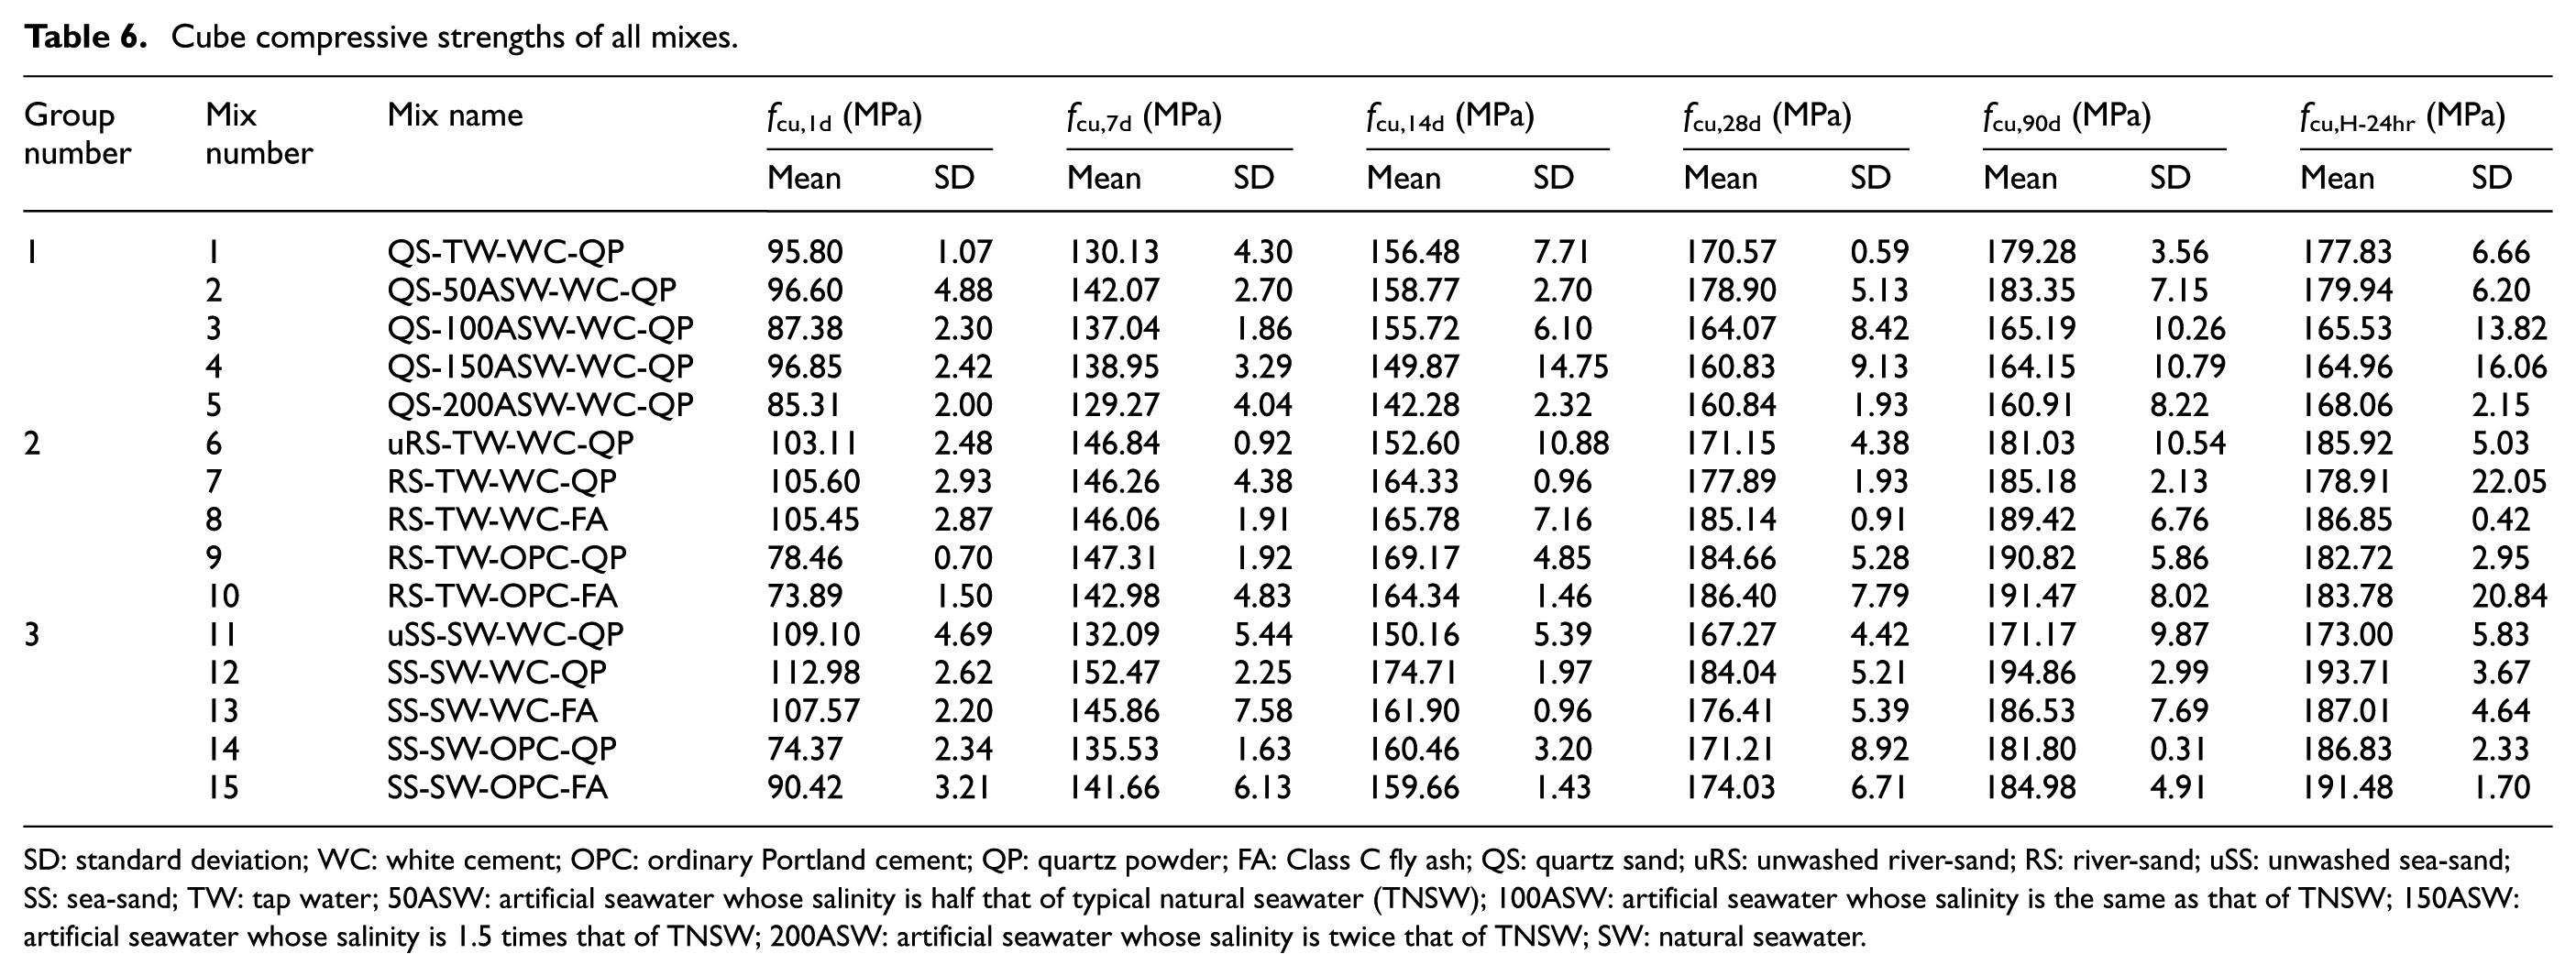
SD: standard deviation; WC: white cement; OPC: ordinary Portland cement; QP: quartz powder; FA: Class C fly ash; QS: quartz sand; uRS: unwashed river-sand; RS: river-sand; uSS: unwashed sea-sand; SS: sea-sand; TW: tap water; 50ASW: artificial seawater whose salinity is half that of typical natural seawater (TNSW); 100ASW: artificial seawater whose salinity is the same as that of TNSW; 150ASW: artificial seawater whose salinity is 1.5 times that of TNSW; 200ASW: artificial seawater whose salinity is twice that of TNSW; SW: natural seawater.
The results of specimens with Mixes 1–5 of Group 1 are compared in Figure 4 to examine the effect of salinity of mixing water on the compressive strength of concrete. For ease of comparison, the compressive strengths of different mixes are also normalized with the corresponding strength of Mix 1 at the same age in Figure 4 (referred to as normalized fcu). It is evident from Figure 5 that (1) the 7-day strengths of Mixes 2–5 are generally higher than that of Mix 1, suggesting that the use of saltwater generally leads to a higher early strength of concrete; (2) the strengths of Mix 2 with a salinity of 18 g/L at various ages are all higher than Mixes 1 and 3–5, suggesting that an optimum salinity of mixing water, equal or close to that of Mix 2, may exist for the compressive strength of concrete; (3) the 14-, 28- and 90-day strengths of Mixes 3–5 are slightly lower than Mix 1 and appear to decrease with an increase in salinity, suggesting that when the salinity of mixing water exceeds a certain value, it may have a slight negative effect on the long-term compressive strength of concrete. Similar observations were also made in existing studies on normal-strength concrete mixed with saltwater (e.g. Kaushik and Islam, 1995; Taylor and Kuwairi, 1978; Tiwari et al., 2014). It is believed that the slightly higher early strength of concrete with saltwater is due to the formation of the so-called Friedel’s salt (3CaO·Al2O3·CaCl2·10H2O) and Kuzel’s salt (3CaO·Al2O3·0.5CaSO4·0.5CaCl2·11H2O) because of the existence of chloride ions (Weerdt et al., 2014); the decomposition of these salts with time, however, is believed to affect the long-term strength of concrete (Suryavanshi and Swamy, 1996).
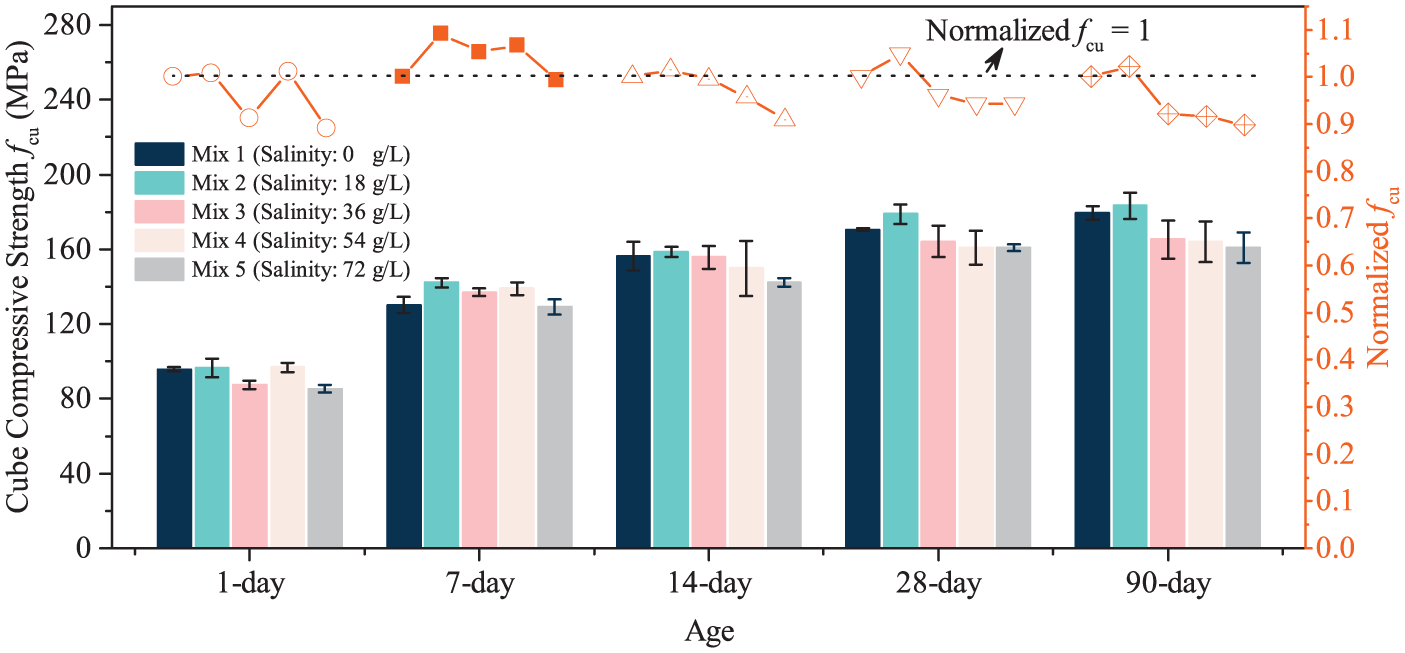
Effect of salinity on compressive strength.
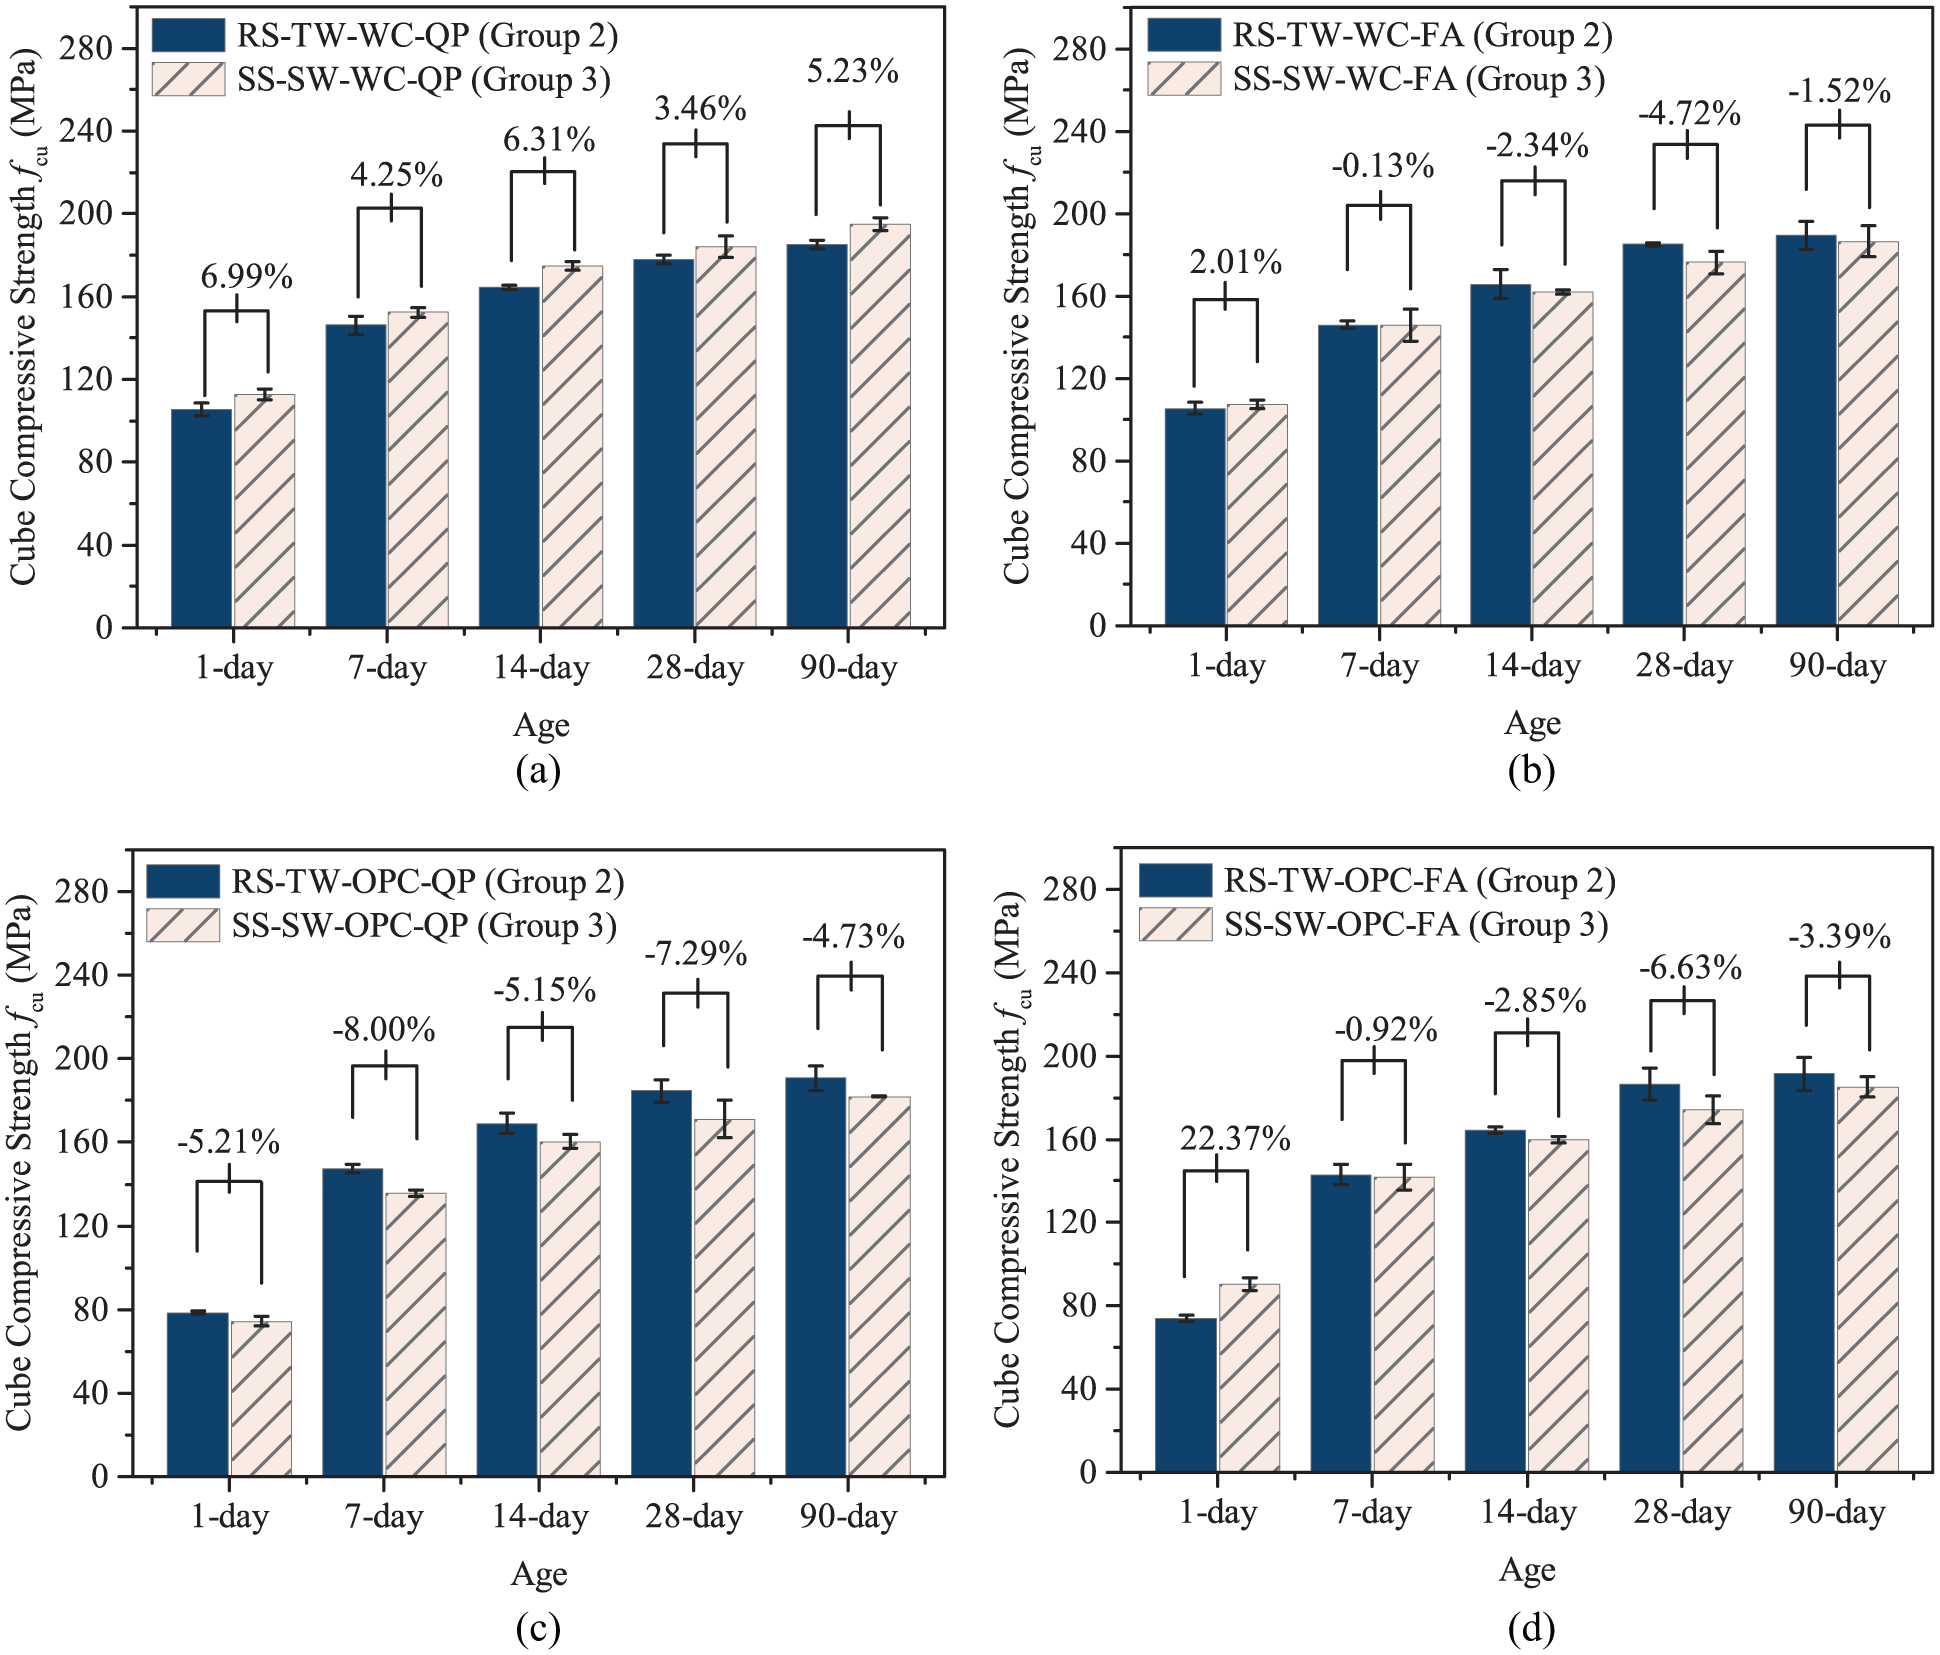
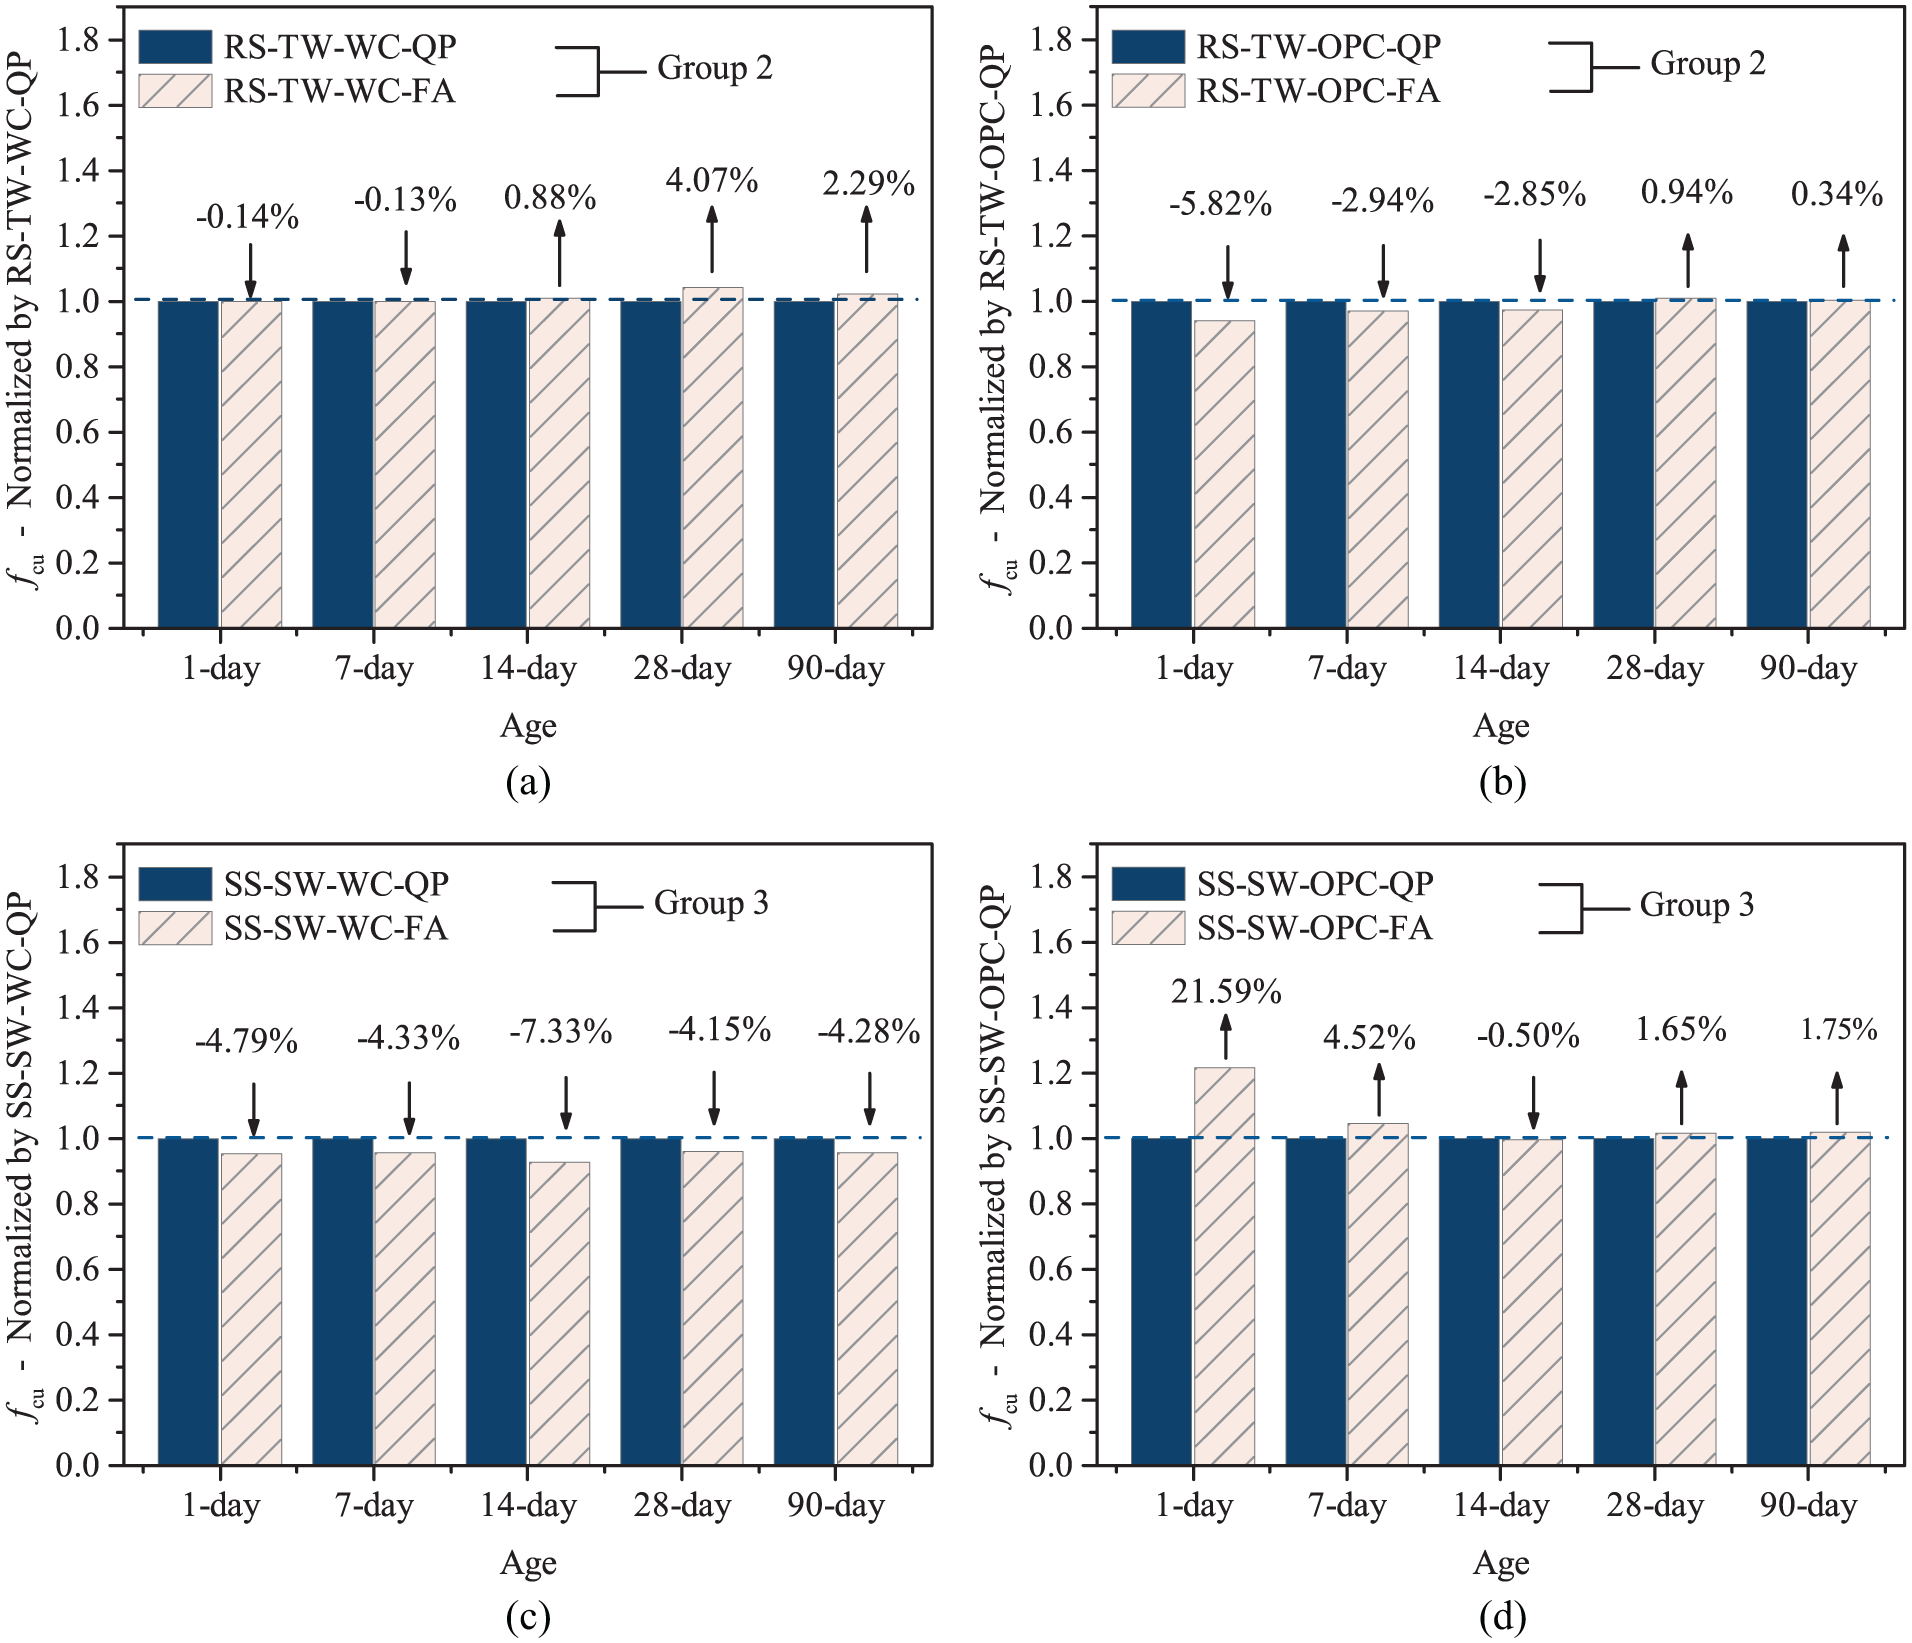
Effect of seawater and sea-sand on the strength development of UHPC prepared with (a) white cement and quartz powder, (b) white cement and fly ash, (c) ordinary Portland cement and quartz powder and (d) ordinary Portland cement and fly ash.
Figure 5 compares the results of Groups 2 and 3. In Figure 5, the only difference between the two mixes in each subfigure is that one mix (of Group 2) used river-sand and tap water, while the other (of Group 3) used sea-sand and seawater. The results indicate that due to the use of seawater and sea-sand, the early strength is likely to increase, but the strengths at 7 days and above are likely to decrease, although these trends are not shared by one of the subfigures. Nevertheless, the differences at various ages between the two mixes in each of the four subfigures are all within 8% except for the 1-day strength of one pair (Figure 5(d)), suggesting that the use of seawater and sea-sand to replace tap water and river-sand only has a small effect on the compressive strength of UHPC. This observation is also consistent with previous research on normal-strength concrete, which reported that chloride ion-induced strength variations are generally within 10% (Kaushik and Islam, 1995; Younis et al., 2018).
The effect of using Class C fly ash to replace quartz powder is illustrated in Figure 6 by comparing four pairs of mixes; the only difference between the two mixes in each pair is the supplemental fine material (i.e. fly ash or quartz powder). It is evident that the mixes with fly ash have similar strengths to those of the mixes with quartz powder at an age of 7 days or above. The variation in 1 day strength in Figure 6(d) may be attributed to the scatter of test data of Mix 14 in Group 3 (i.e. SS-SW-OPC-QP). Fly ash is known to have the potential of pozzolanic reactions (Hemalatha and Ramaswamy, 2017; Papadakis, 2000) which may be beneficial to the strength development of concrete, but the high content of free calcium oxide (i.e. CaO) of Class C fly ash may negatively affect the concrete strength especially with the presence of sulphate ions (Tikalsky and Carrasquillo, 1989). The observation illustrated in Figure 6 is believed to be a result of counteracting effects of many factors, including the two mentioned above. Further research involving analysis of the material structure of UHPSSC is needed to clarify these effects.
Effect of supplementary material type on strength development: (a) tap water–river sand UHPC with white cement, (b) tap water–river sand UHPC with ordinary Portland cement, (c) UHPSSC with white cement and (d) UHPSSC with ordinary Portland cement.
Figure 7 illustrates the effects of cement type; the only difference between the two mixes in each subfigure of Figure 7 is the type of cement (i.e. white cement or ordinary Portland cement). It is evident that the use of ordinary Portland cement to replace white cement generally leads to lower early age strengths, especially the 1-day strength, but its effect on the 28- and 90-day strengths seems dependent on other constituents of the mix: for Group 2 with river-sand and tap water, the mixes with ordinary Portland cement have higher 28- and 90-day strengths, but the opposite was found for Group 3 with seawater and sea-sand.
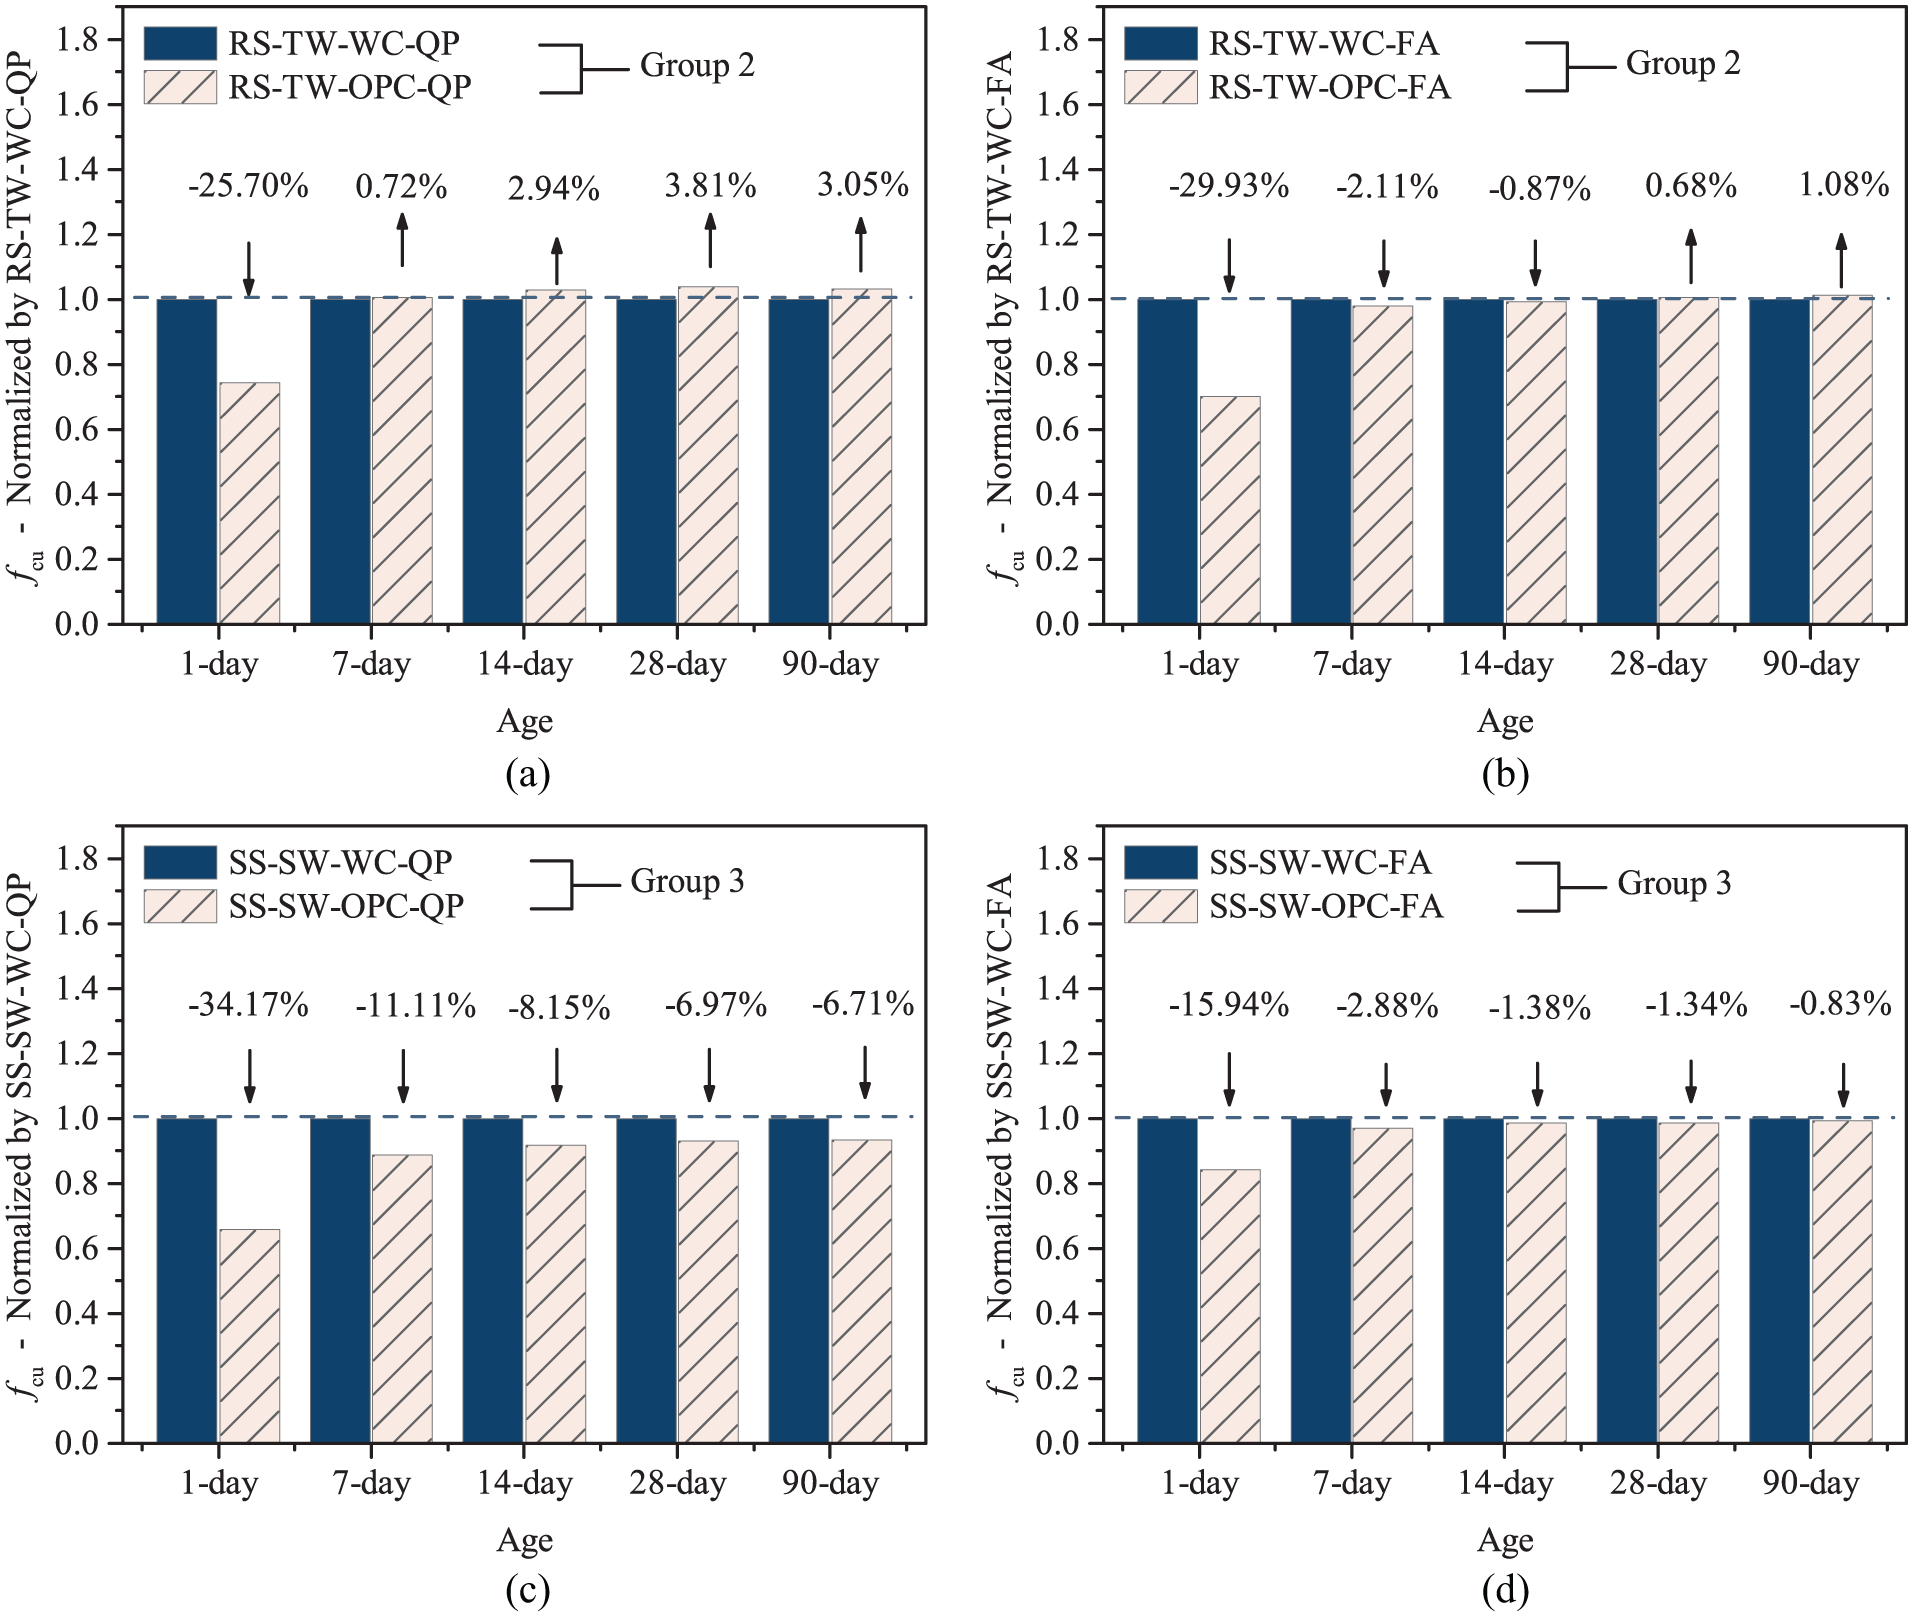
Effect of cement type on strength development: (a) tap water–river sand UHPC with quartz powder, (b) tap water–river sand UHPC with fly ash, (c) UHPSSC with quartz powder and (d) UHPSSC with fly ash.
Figure 8 shows the effect of sand desilting on the concrete strength. It is evident that the mixes with washed sand generally have higher strengths at various ages compared with their counterparts with unwashed sand. This effect appears to be more pronounced for the sea-sand group (Figure 8(b)) due to the relatively high clay content in the unwashed sea-sand: sand desilting is shown to lead to an increase of around 10% in the 28-day strength of this group. This is not a surprise as the negative effect of clay in sand (e.g. weakening the bond between sand and cement paste) has been well recognized by existing research (e.g. Fernandes et al., 2007).
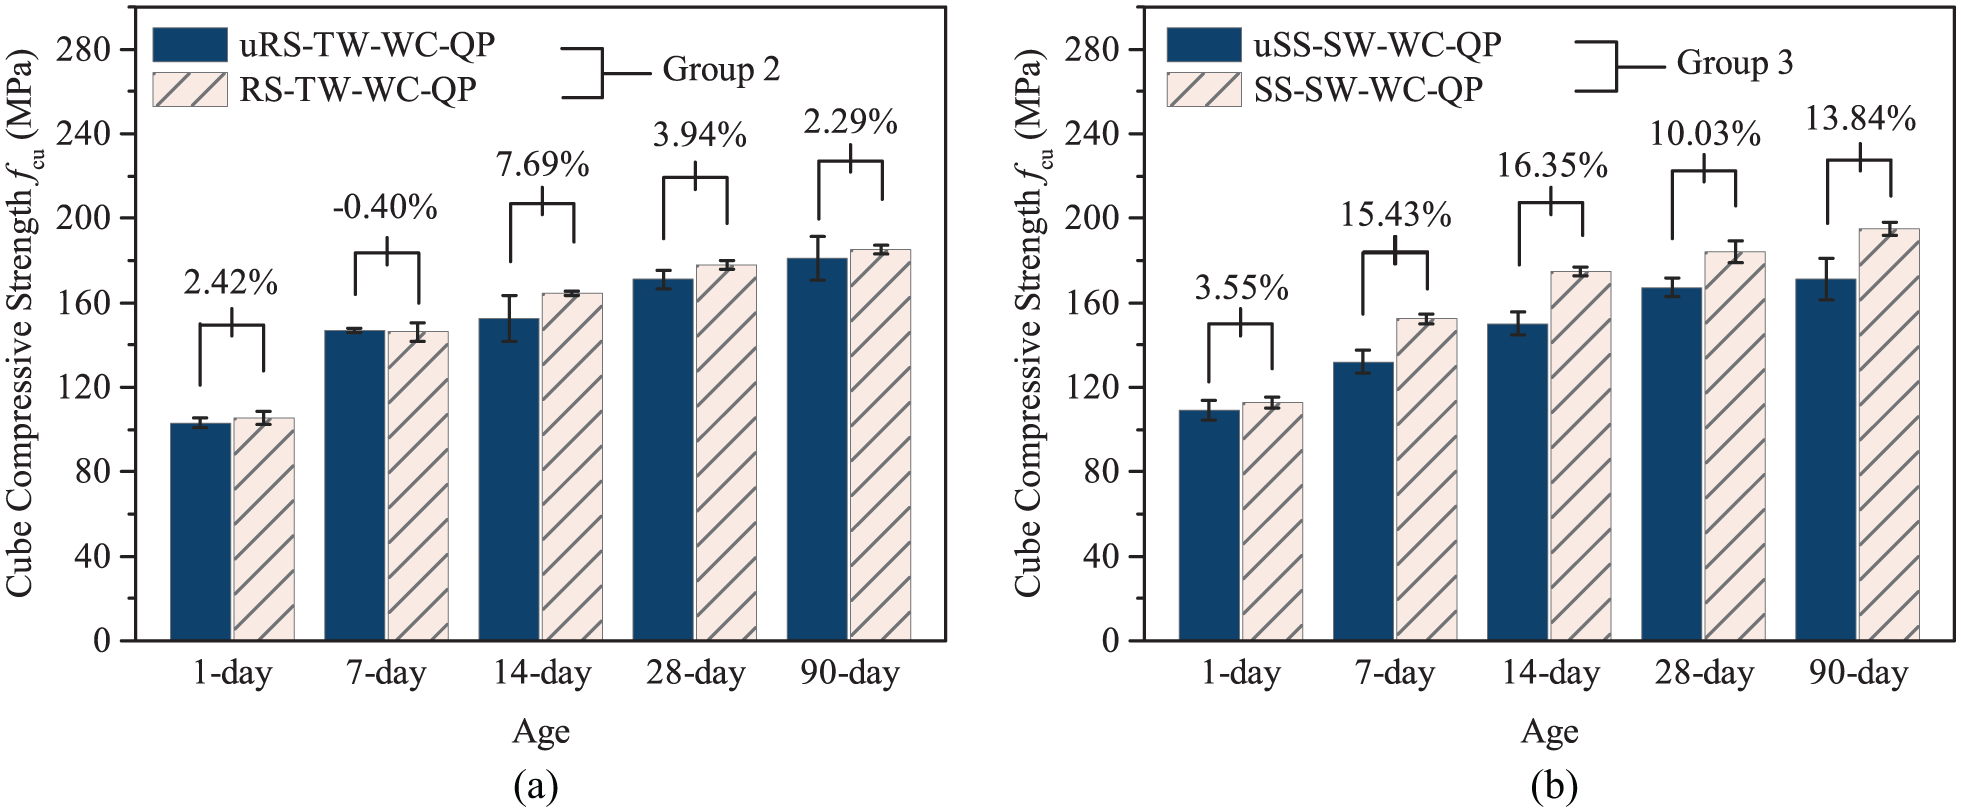
Effect of sand desilting on strength development: (a) tap water–river sand UHPC and (b) UHPSSC.
Previous research (e.g. Wille and Boisvert-Cotulio, 2015; Wille et al., 2011) has shown that the compressive strength of UHPC has a strong correlation to its rheological properties (e.g. slump spread), as the latter is an indicator of its particle packing density. The 28-day cube compressive strengths (fcu,28d) of all mixes are shown against their respective slump spreads (D) in Figure 9, which reveals clearly the correlation between the two for all the mixes including those prepared with seawater and sea-sand.

Relationship between 28-day cube compressive strength and slump spread.
Compressive stress–strain relationship
Figure 10 shows the compressive stress–strain curves obtained from standard cylinder tests for nine mixes of Groups 2 and 3. The axial strain and hoop strain values shown in Figure 10 were both averaged from the readings of three strain gauges. It should be noted that since Specimen 2 of Mix 13 and Specimen 3 of Mix 14 failed prematurely due to operational errors during the pre-loading process, only results for the remaining two specimens for each of the two mixes (i.e. Mixer 13 and 14) are presented in Figure 10(g) and (h), respectively. Similar to the observations reported in the open literature (e.g. Wu et al., 2016), the stress–strain curves all have an almost linear shape as no fibres were used in the mixes. All test cylinders failed in a brittle manner and thus the descending branch of the stress–strain curves could not be captured during the tests.
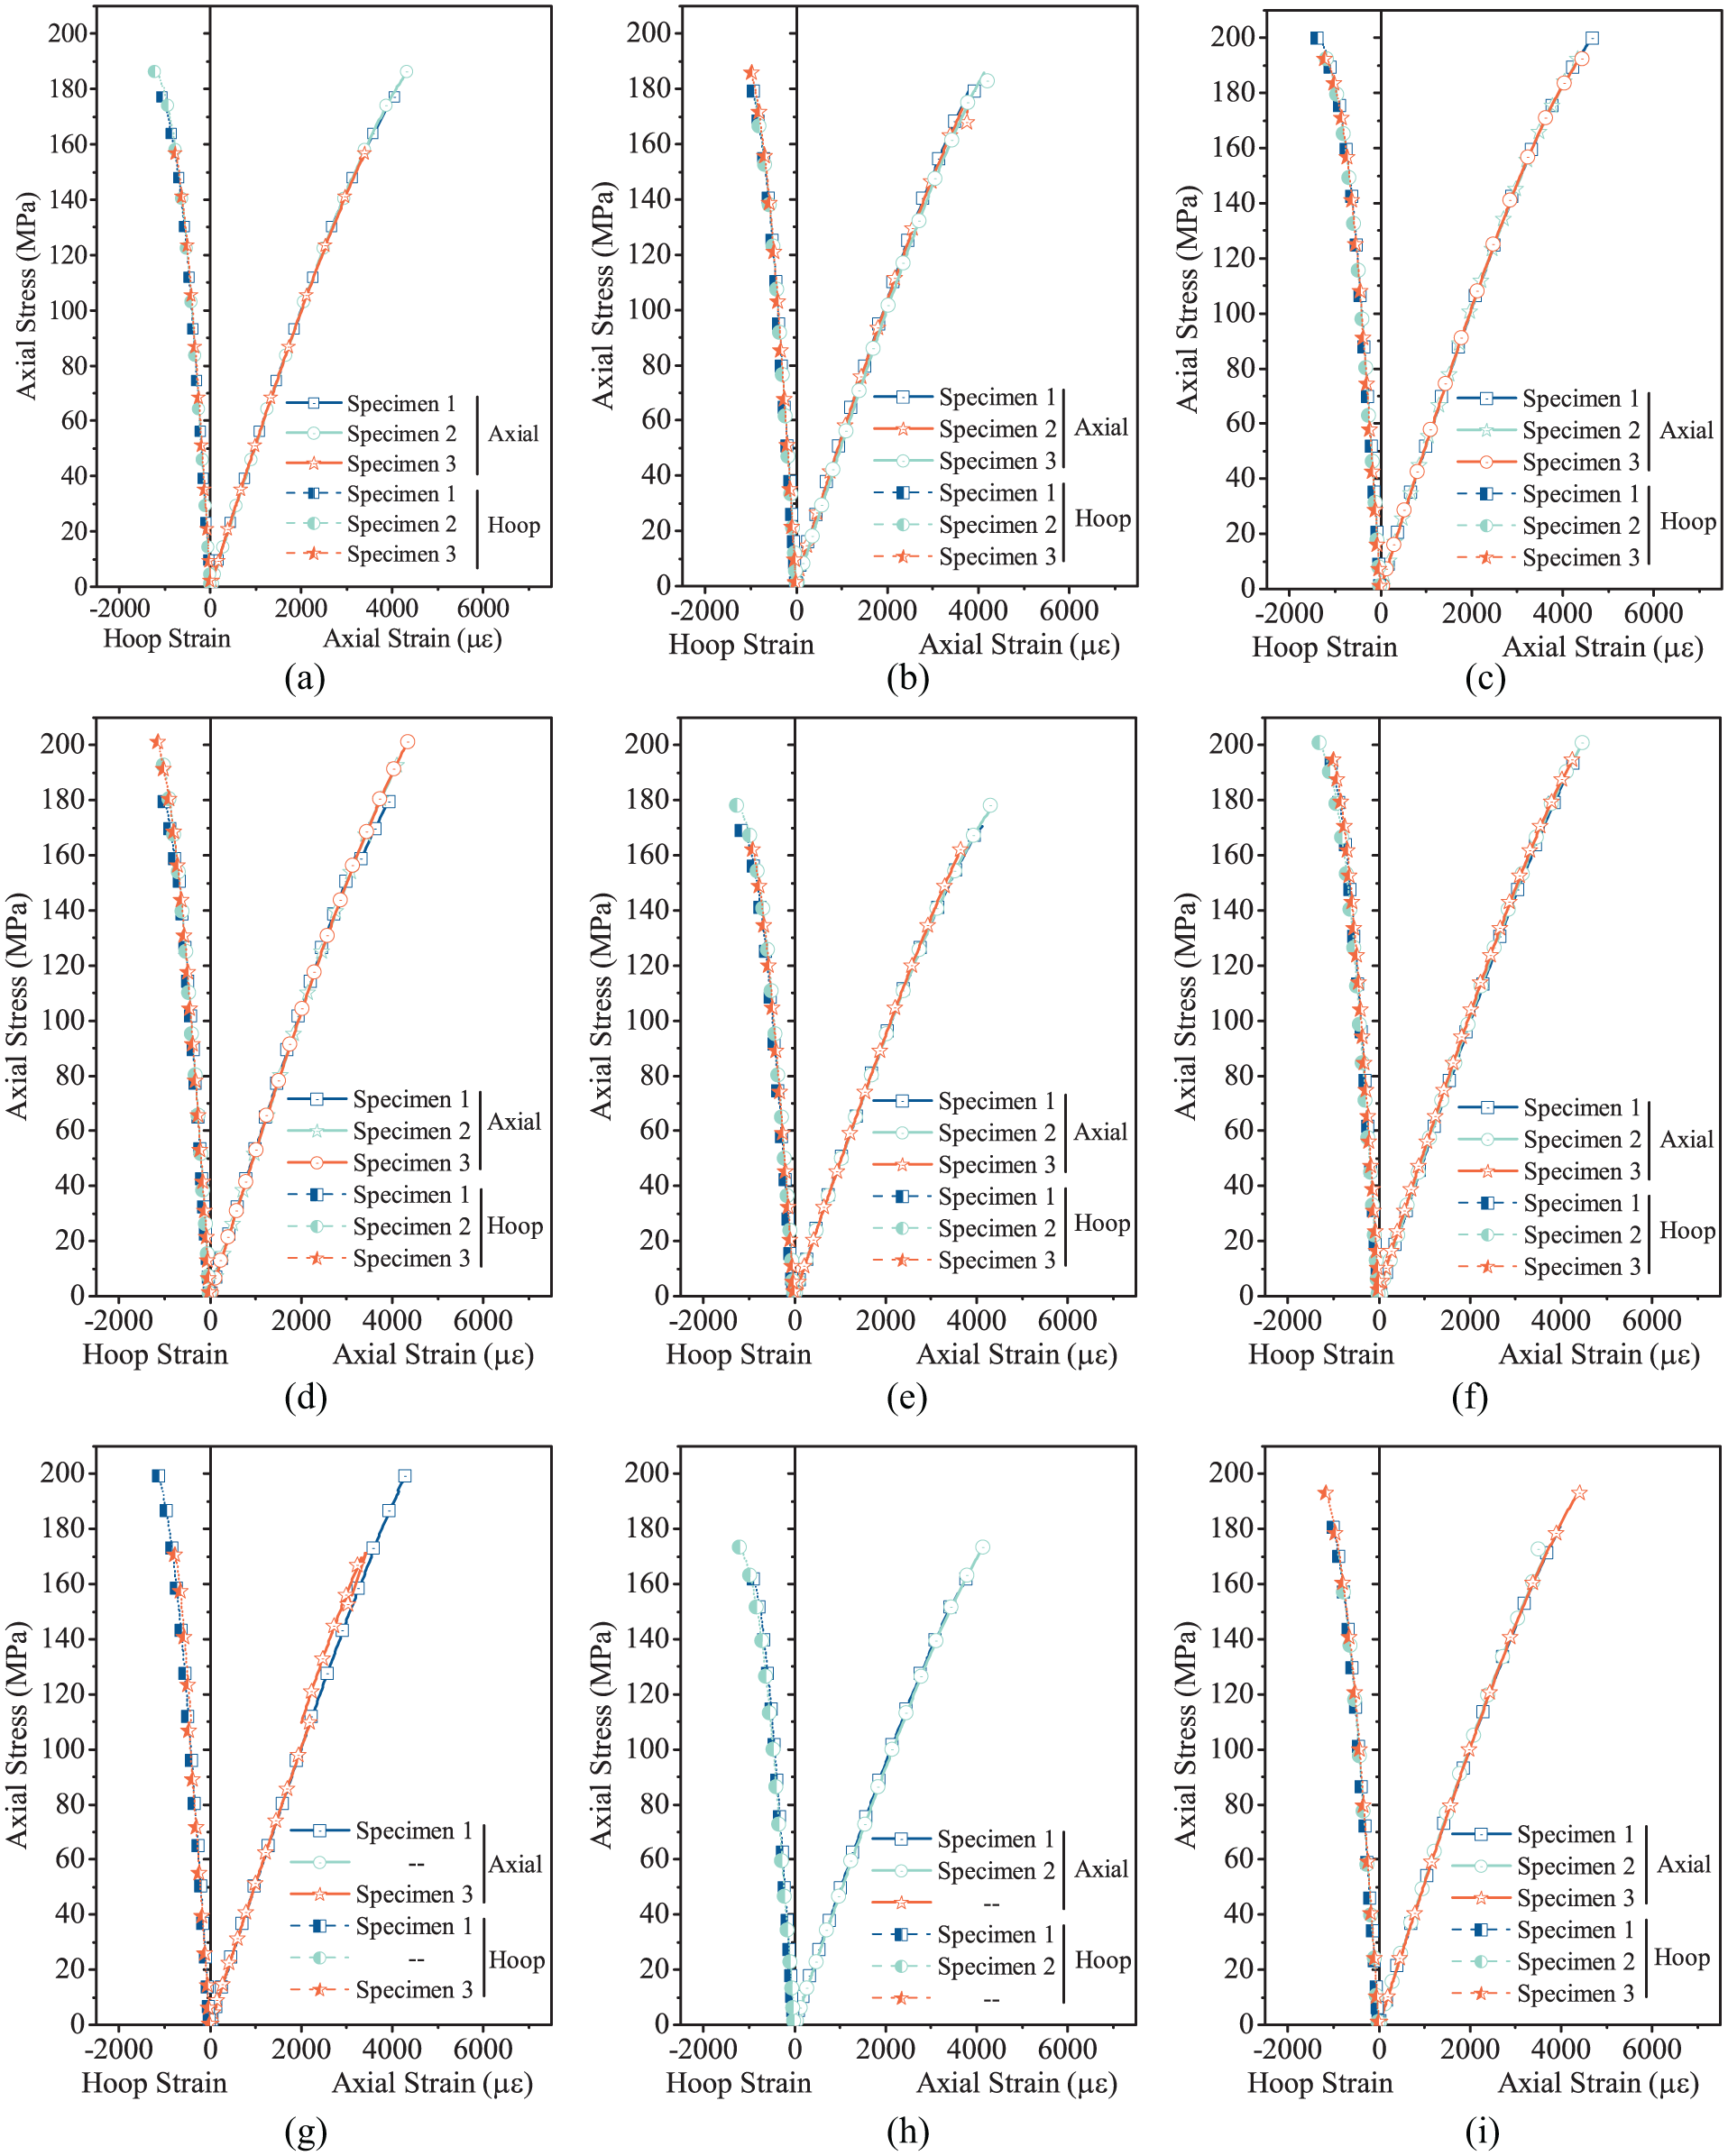
Stress–strain curves: (a) uRS-TW-WC-QP, (b) RS-TW-WC-QP, (c) RS-TW-OPC-QP, (d) RS-TW-OPC-FA, (e) uSS-SW-WC-QP, (f) SS-SW-WC-QP, (g) SS-SW-WC-FA, (h) SS-SW-OPC-QP and (i) SS-SW-OPC-FA.
The characteristic parameters of the stress–strain curves are summarized in Table 7, in which the cylinder compressive strength (fco) as well as the corresponding axial (εco) and hoop strains (εlo) were the stress and strain values at the peak point on the curve, while the modulus of elasticity (Ec) and Poisson’s ratio (υ) were calculated in accordance with ASTM C469/C469M-14 (2014).
Characteristic parameters of stress–strain curve.

WC: white cement; OPC: ordinary Portland cement; QP: quartz powder; FA: Class C fly ash; QS: quartz sand; uRS: unwashed river-sand; RS: river-sand; uSS: unwashed sea-sand; SS: sea-sand; TW: tap water; 50ASW: artificial seawater whose salinity is half that of typical natural seawater (TNSW); 100ASW: artificial seawater whose salinity is the same as that of TNSW; 150ASW: artificial seawater whose salinity is 1.5 times that of TNSW; 200ASW: artificial seawater whose salinity is twice that of TNSW; SW: natural seawater.
The elastic modulus and the axial and hoop strains at the peak stress are shown against the cylinder compressive strength in Figure 11(a) to (c), respectively. Figure 11(a) shows that the elastic moduli of specimens in Group 2 are slightly larger than those of the corresponding UHPSSC specimens in Group 3 with the same compressive strength, suggesting that the use of seawater and sea-sand may have a slight negative effect on the value of elastic modulus. By looking at all the data points in Figure 11(b) and (c), it appears that the axial and hoop strains at the peak stress of specimens in Group 2 are both slightly smaller than those of the corresponding UHPSSC in Group 3 with the same compressive strength. The above observations are further evidenced by the two trend lines in each of the subfigures, which were obtained from linear regression analyses for the two groups, respectively. In addition, the measured axial strain at peak stress ranges between 3870 and 4473 µε. These values are larger than that of normal high-strength concrete with a compressive strength of less than 100 MPa (Carreira and Chu, 1985; Lu and Zhao, 2010), but they are consistent with those reported in the existing research on UHPC (Hoang and Fehling, 2017; Sobuz et al., 2016). Poisson’s ratios (υ) of all the mixes, however, are consistently 0.20 or 0.21, despite the variations in raw constituent materials and compressive strength.
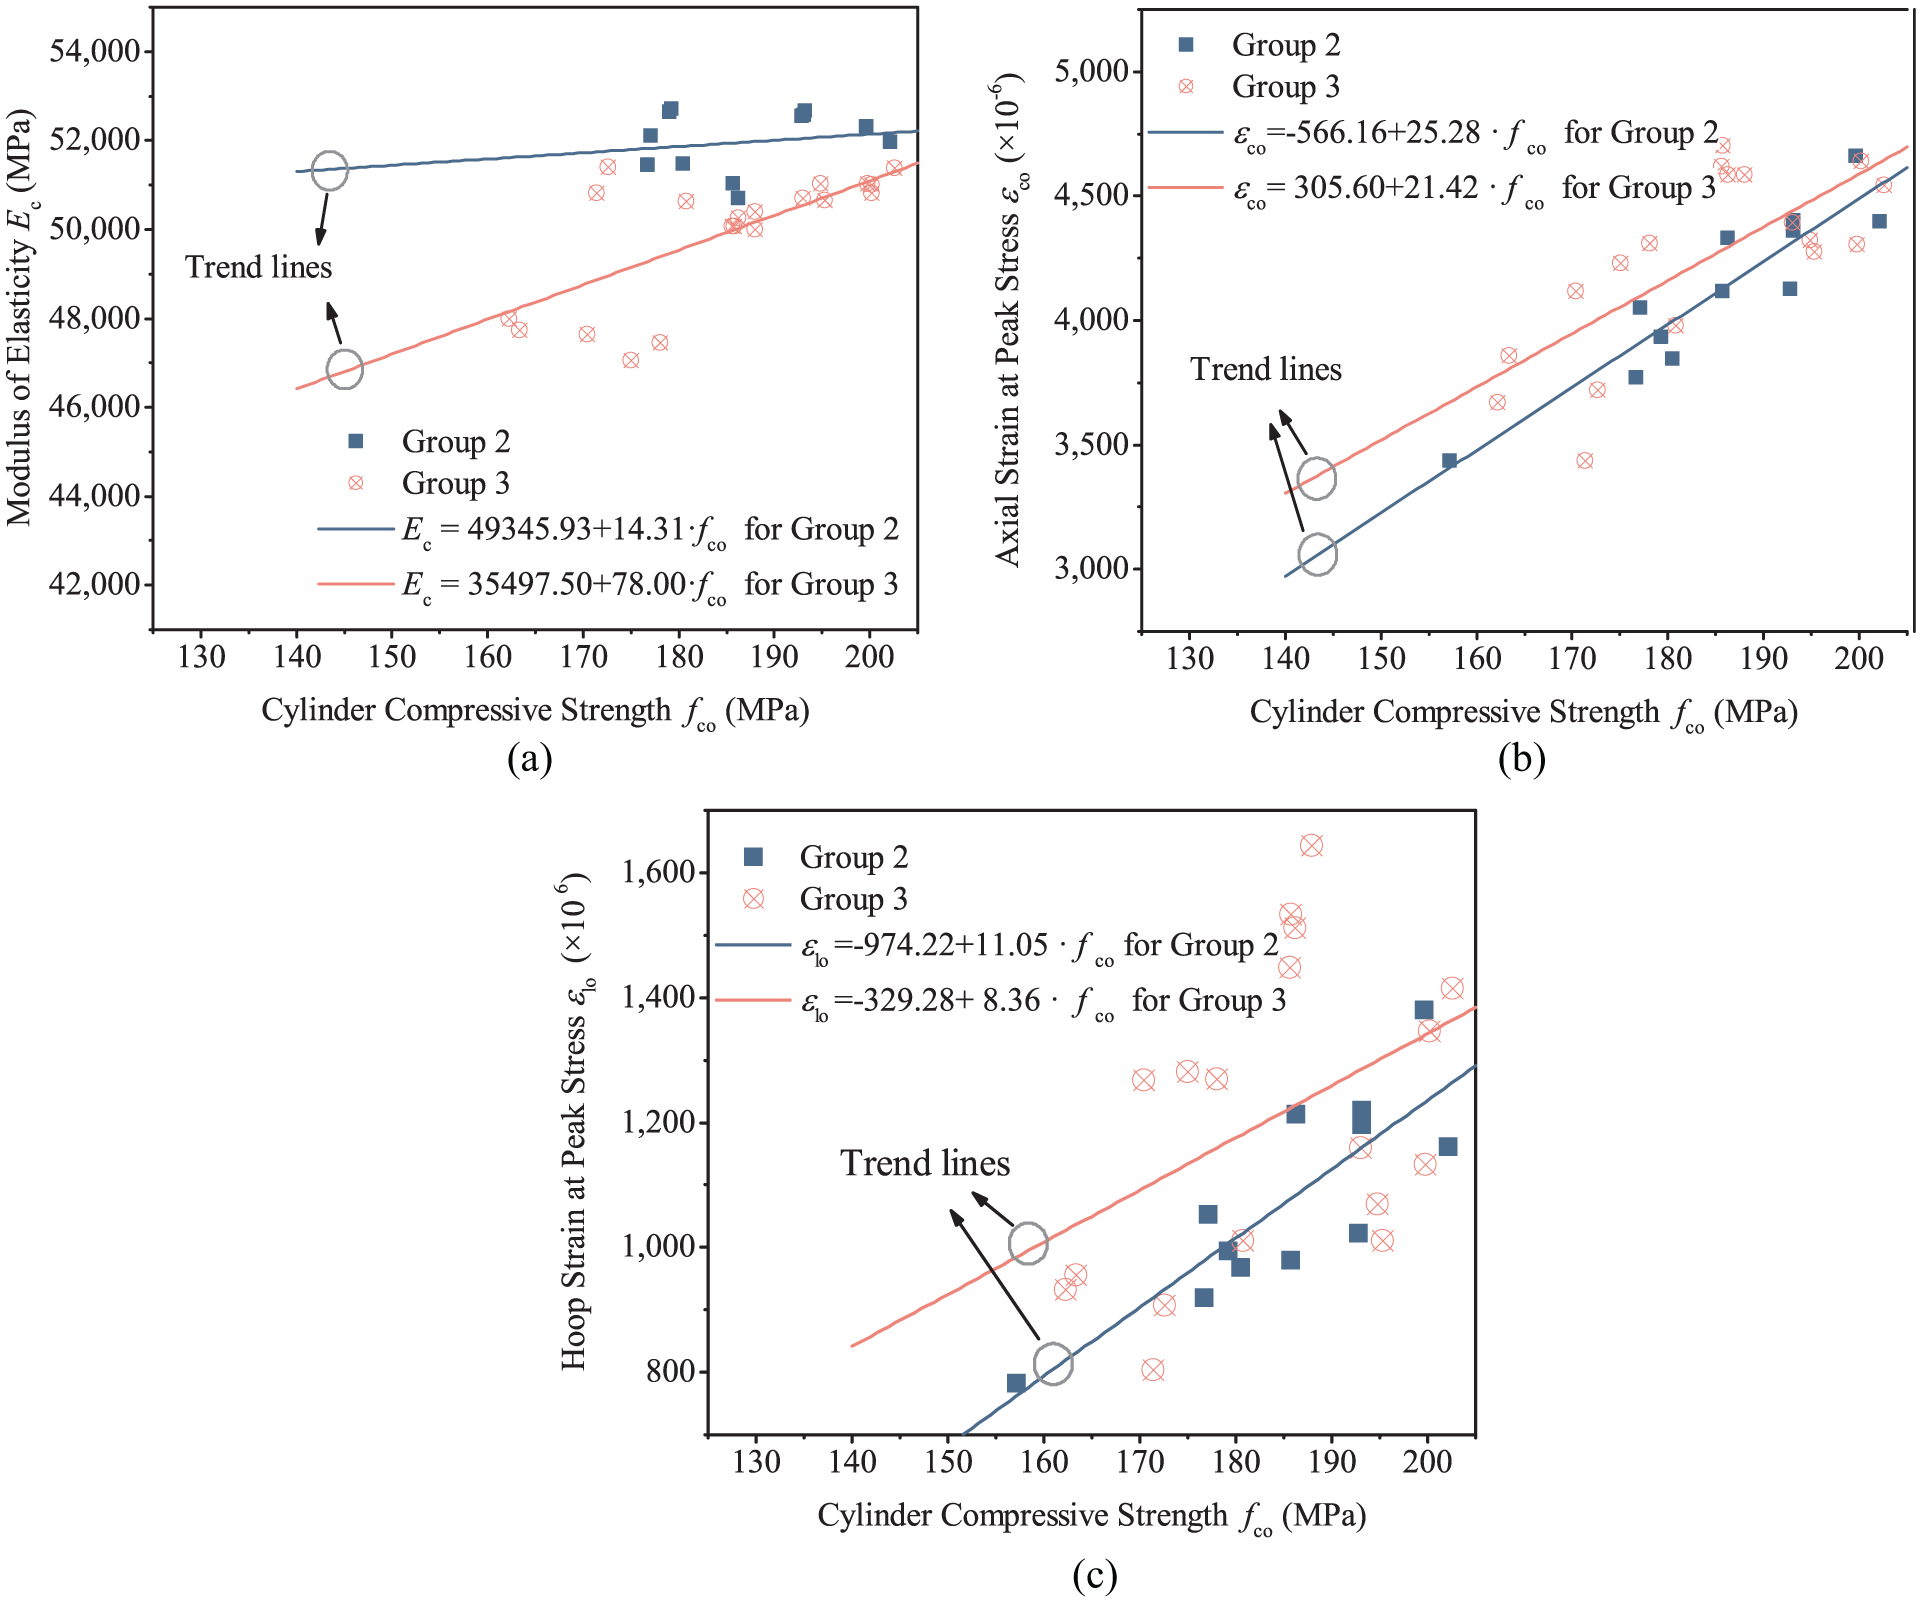
Characteristic parameters versus cylinder compressive strength: (a) Ec, (b) εco and (c) εlo.
The average cylinder compressive strengths of the nine mixes are shown against their cube compressive strengths in Figure 12, which show that the former is slightly larger for the same mix. This is opposite to the common observation for normal-strength concrete, but is consistent with the findings by Kusumawardaningsih et al. (2015) for UHPC. However, even for UHPC, Graybeal and Davis (2008) found that the cylinder compressive strength is lower than the cube compressive strength. In this study, the end surfaces of the cylinder specimens were ground to ensure that they were flat and parallel, but the surfaces of the cube specimens, which satisfied the requirement of the standard (ASTM C109/C109M-16a, 2016), were not ground. In addition, although the cylinder specimens were prepared using exactly the same mix proportions as the cube specimens, they were prepared in different batches. The above two factors might also have affected the test results. Further research is needed to clarify the relationship between the cube and cylinder compressive strengths of UHPC.
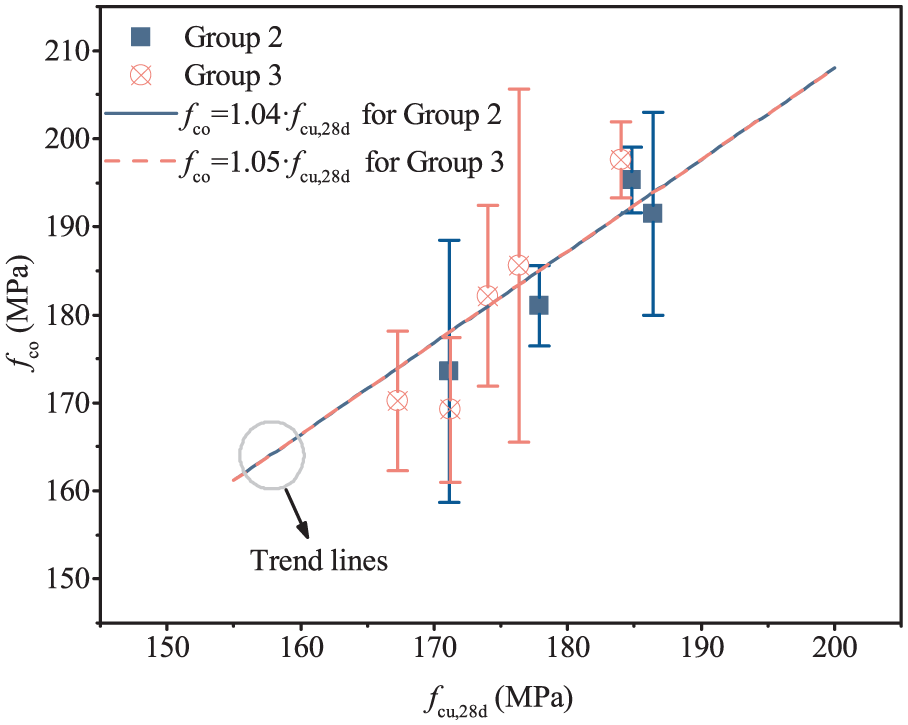
Relationship between cylinder compressive strength (fco) and 28-day cube compressive strength (fcu,28d).
Effect of curing method
Figure 13 compares the results of two pairs of specimens; the only difference between the specimens in each pair was the curing method. It is evident that compared with tap water curing, seawater curing led to evident reductions in the compressive strength of concrete (up to around 15% at the age of 90 days), and such a reduction appears to increase with the age of concrete. The seawater curing method also appears to have a slight negative effect on the elastic modulus of concrete, but this effect was not as pronounced as the effect on strength (see Table 8). The above observations are similar to those reported in the open literature (e.g. Etxeberria et al., 2016; Islam et al., 2012) and are believed to be at least partially due to the existence of magnesium sulphate when seawater is used for curing (Ragab et al., 2016).
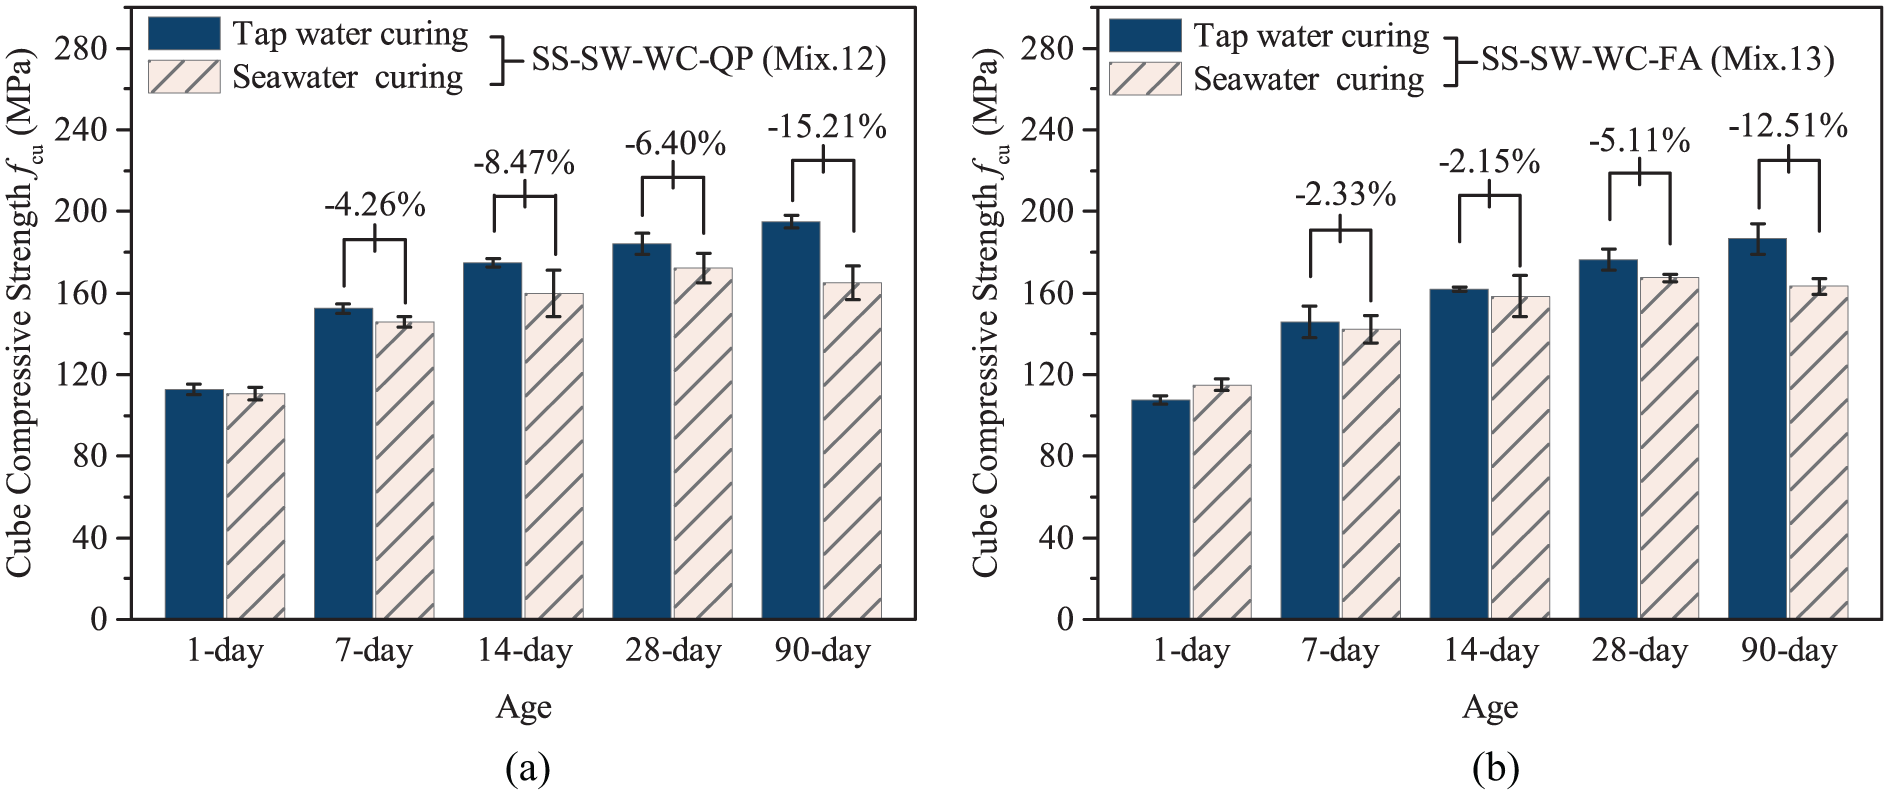
Effect of seawater curing on the strength development of UHPSSC.
Effects of curing methods on properties of UHPSSC.

WC: white cement; QP: quartz powder; FA: Class C fly ash; QS: quartz sand; SS: sea-sand.
In Figure 14, the compressive strengths of specimens after 28 and 90 days of 22°C ± 3°C tap water immersion curing (i.e. fcu,28d and fcu,90d) are shown against the strengths of the corresponding specimens after 24 h of 90°C ± 1°C heat curing (i.e. fcu,H-24hr). Trend lines obtained using linear regression analyses are also given in the figure to show the correlation between results obtained with different curing methods. In addition, the fcu,H-24hr values of all the mixes are summarized in Table 6. It is evident from Figure 14(a) and Table 6 that fcu,H-24hr is generally close to fcu,28d while lower than fcu,90d for the mixes of Group 2. However, for the UHPSSC mixes of Group 3, Figure 14(b) shows that both fcu,28d and fcu,90d are lower than fcu,H-24hr. It may thus be concluded that compared with UHPC, it takes more time for UHPSSC to be cured at room temperature to develop the same strength as that subjected to heat curing.
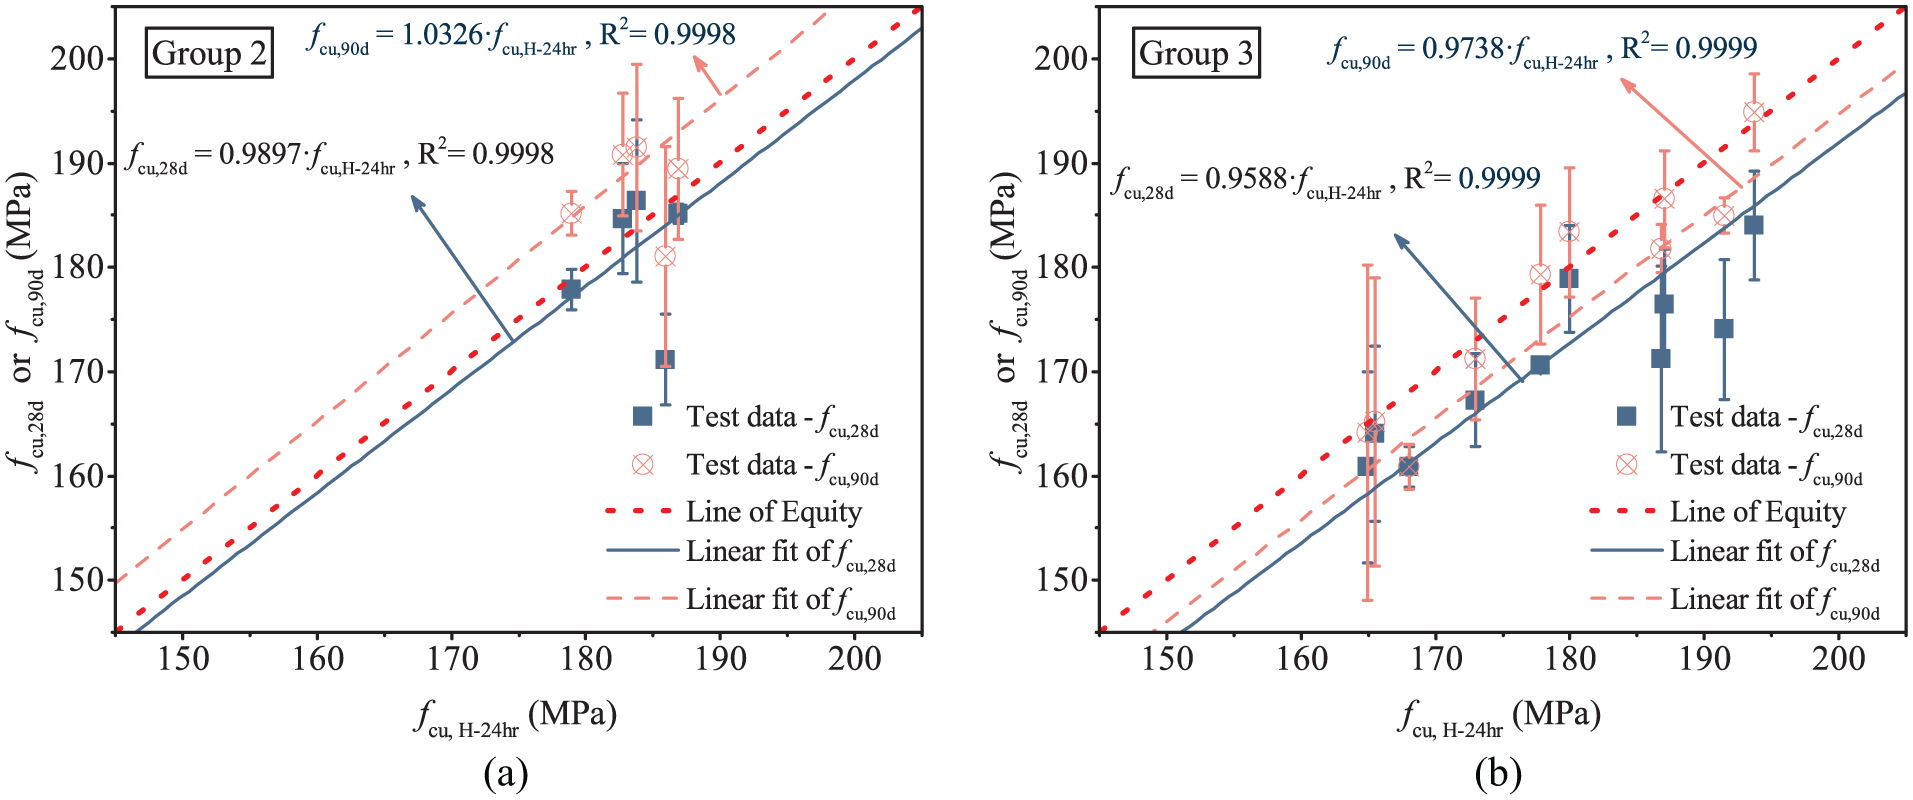
28- and 90-day tap water immersion-cured cube compressive strengths (i.e. fcu,28d and fcu,90d) versus 24 h heat-cured cube compressive strengths (i.e. fcu,H-24hr): (a) Group 2 (tap water–river sand UHPC) and (b) Group 3 (UHPSSC).
Cost analysis
The cost per cubic metre within the Hong Kong context was calculated for the mixes in Group 3 (i.e. UHPSSC) and compared with that of normal concrete having a cylinder compressive strength of 54.1 MPa, whose mix proportions are given in Zhang et al. (2014). In the calculations, the following prices of the raw materials, obtained in July 2018 from the suppliers of materials used in this study, were used: (1) HKD 2080 per tonne for white cement; (2) HKD 810 per tonne for ordinary Portland cement; (3) HKD 2070 per tonne for silica fume; (4) HKD 2300 per tonne for quartz powder; (5) HKD 300 per tonne for fly ash; (6) HKD 750 per tonne for quartz sand; and (7) HKD 13,000 per tonne for HRWR. The prices of natural river-sand and crushed stone are assumed to be HKD 138 per tonne and HKD 67 per tonne, respectively, according to the Census and Statistics Department (CSD) of Hong Kong (HK CSD, 2018b). Natural sea-sand is abundant in coastal regions, so it may be used at no cost. However, in the calculations, it is conservatively assumed to cost the same amount as river-sand (i.e. HKD 138 per tonne). Similarly, seawater is conservatively assumed to have the same cost of HKD 7.11 per tonne as tap water according to the Water Supplies Department (WSD) of Hong Kong (HK WSD, 2018).
The desilting of sand was found to increase the compressive strength of UHPSSC. The desilting process involves additional energy and labour costs, which are estimated to be HKD 2.05 per tonne based on the following assumption: (1) a typical 15 kW sand washing machine (e.g. Model KSW 200; Mewarhitech, 2019) capable of washing 130 tonnes of sand per hour; (2) the cost for electricity is HKD 1.15 per kWh (CLP, 2018); and (3) two workers are needed to operate such a sand washing machine and their average salary is HKD 998.2 per day (HK CSD, 2018a). The labour and equipment costs for casting concrete are negligible compared with other costs, so they are not included in the calculations for simplicity.
The so-calculated costs per cubic metre are summarized in Table 9. It is evident that significant reductions in the costs can result from the use of ordinary Portland cement to replace white cement and the use of fly ash to replace quartz powder. The cost per unit volume of UHPSSC is shown to be significantly higher than that of normal concrete. However, considering its ultra-high strength, the cost per MPa per cubic metre of UHPSSC is comparable to or even lower than that of normal concrete. The UHPSSC mix with ordinary Portland cement and fly ash (i.e. SS-SW-OPC-FA) is the most cost-effective one, with a cost of only HKD 9.43 per MPa per cubic metre.
Cost comparison.
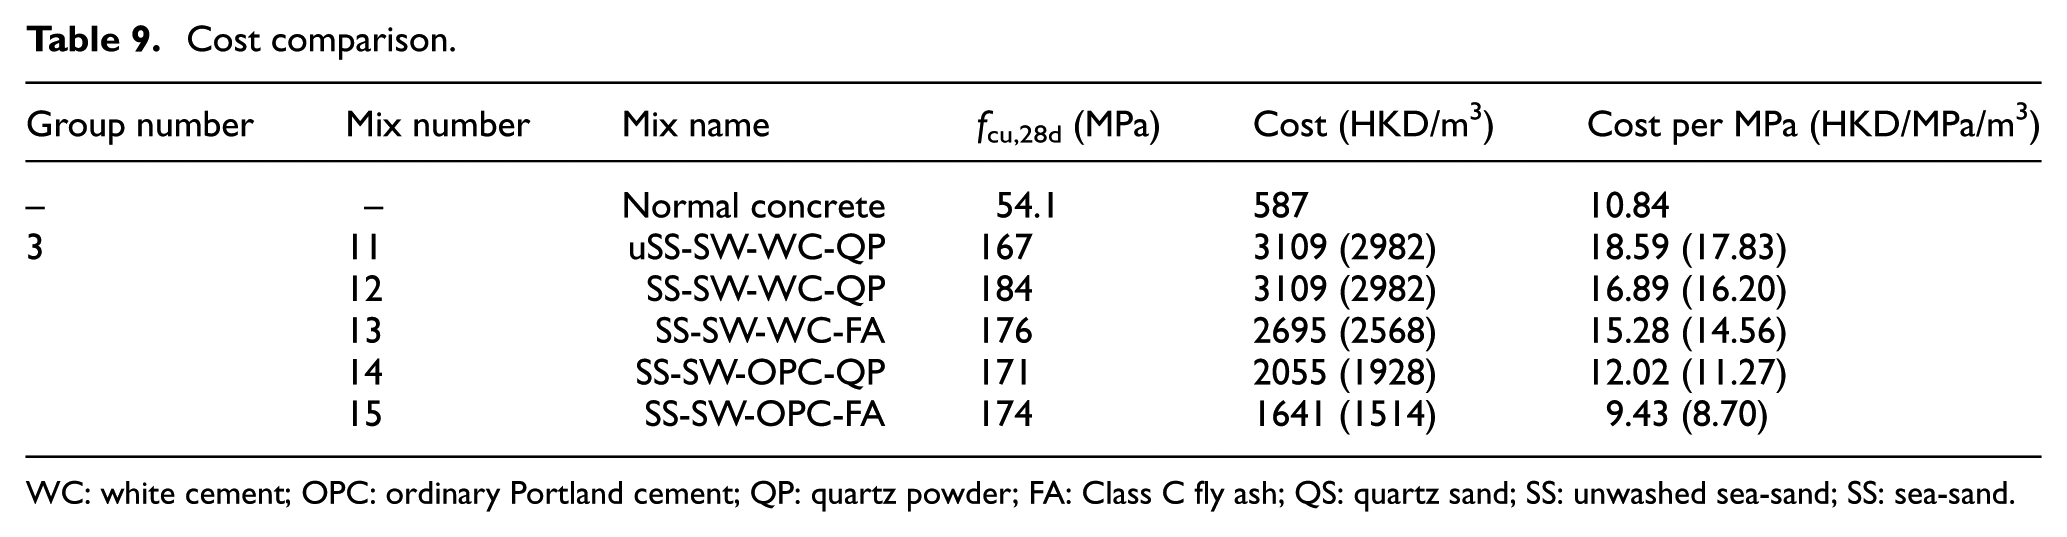
WC: white cement; OPC: ordinary Portland cement; QP: quartz powder; FA: Class C fly ash; QS: quartz sand; SS: unwashed sea-sand; SS: sea-sand.
In the above calculations, seawater and sea-sand were assumed to cost the same amounts as tap water and river-sand, respectively. By doing so, the costs per cubic metre of Mixes 11-15 (UHPSSC) are exactly the same as those of Mixes 6-10 (tap water–river sand UHPC), respectively. In practice, seawater and sea-sand may be obtained at nearly no cost so that the costs of UHPSSC can be further reduced to the numbers provided in the brackets of Table 9.
Conclusion
This article has been concerned with the development of ultra-high-performance concrete using seawater and sea-sand (referred to as UHPSSC) to address the challenges associated with the shortage of fresh water, river-sand and coarse aggregate in producing concrete for coastal and marine infrastructure. To minimize the cost of producing UHPSSC and eliminating corrosion concerns with steel fibres, the study has been focussed on the development and behaviour of UHPSSC without short steel fibres. The article has presented an experimental study to demonstrate the concept of UHPSSC and to clarify the effects of several parameters on its mechanical behaviour. The test results showed that the highest-strength UHPSSC in this study, which was prepared with white cement, silica fume and quartz powder and cured at room temperature, achieved a 28-day cube compressive strength of 184 MPa, with its mini-slump spread, modulus of elasticity and Poisson’s ratio being 324 mm, 51 GPa and 0.21, respectively. The results and discussions presented in the article also allow the following conclusions to be drawn:
The use of seawater and sea-sand generally leads to decreases in the workability and the density of UHPC. Such decreases are shown to be dependent on the other constituent materials and can be small.
The use of seawater and sea-sand is likely to slightly increase the early strength of UHPC but is likely to slightly decrease the strengths at 7 days and above.
Compared to tap water–river sand UHPC, the UHPSSC with the same compressive strength generally has a slightly lower modulus of elasticity but slightly higher axial and hoop strains at peak axial stress.
Sand desilting results in a considerable increase in the workability and strength of UHPSSC. The use of ordinary Portland cement to replace white cement leads to a slight decrease in the workability and early strength of UHPSSC, whereas the use of Class C fly ash to replace quartz powder leads to a slight increase in the workability of UHPSSC.
The cost per MPa per cubic metre of UHPSSC is comparable to or even lower than that of a normal concrete with a cylinder compressive strength of 54.1 MPa. The most cost-effective UHPSSC in this study, which was mixed with ordinary Portland cement and Class C fly ash, has a unit cost of only HKD 9.43 per MPa per cubic metre and a 28-day cube compressive strength of 174 MPa.
Footnotes
Acknowledgements
The authors would like to thank Messrs Ze-Jian Chen, Ryan Ho and Jia-Chen Ma for their assistance in the execution of the tests and BASF Chemical, Hong Kong, for donating the HRWR used in the tests. They would also like to thank Drs Lik Lam, Cheng Jiang, Botong Zheng and Rui Zhong for helpful discussions during the study.
Declaration of Conflicting Interests
The author(s) declared no potential conflicts of interest with respect to the research, authorship and/or publication of this article.
Funding
The author(s) disclosed receipt of the following financial support for the research, authorship and/or publication of this article: This study was financially supported by the Hong Kong Research Grants Council (Project Nos: PolyU 152634/16E and T22-502/18-R) and The Hong Kong Polytechnic University (Project Account Code: 1-BBAG).