
Abstract
The inherent vulnerability of beam-column joints to seismic loading and steel congestion are two major research problems connected with beam-column joints of moment-resisting frames. The experimental study presented herein addresses these research questions and seeks to solve them by using Polyvinyl Alcohol based Engineered Cementitious Composite (PVA-ECC) in beam-column joints without transverse shear reinforcement. The study included the manufacture and shake table testing of two 1:3 reduced scale one bay two-story moment-resisting frame models using simulated earthquake motions. To evaluate the performance of ECC beam-column joints without shear reinforcement, two frame models, one with and the other without shear reinforcement in the beam-column joints, were prepared and tested. The acceleration time history record of the 1994 Northridge Earthquake USA was used for the excitation of specimens at different levels to produce progressive damage up to the near collapse state. The observed damage mechanism of tested models was recorded, and the response parameters, including floor displacement and acceleration, were measured. The measured data was processed to develop a lateral force-displacement envelope curve for the supposed prototype frames and calculate their seismic design factors (ductility, overstrength, and response modification). Comparison of the seismic performance parameters of the two prototype frames reveal that the ECC beam/column joint without shear ties performed marginally inferior to the ECC beam-column joints having shear ties but it still achieved a 75% larger R-factor compared with the code specified value.
Keywords
Introduction
Past studies and assessments of earthquake damages reveal that the beam-column joints of buildings are highly vulnerable to distress during earthquake shaking (Arslan and Korkmaz, 2007; Ates et al., 2013; Pantelides et al., 2002; Sezen et al., 2003), and result in severe damage or collapse of buildings causing massive (heavy) loss to the economy and human life (Erdil, 2017; Jitendra and Bothara, 2008; Naseer et al., 2010; Rossetto and Peiris, 2009; Ruiz-Pinilla et al., 2016). Since the deficiency of confinement in the joint region and concrete brittleness are the main reasons for this susceptibility, a substantial amount of research has been devoted to improving the seismic behaviour of beam-column joints of RC structures. The focus of the research, however, has been performance improvement by refinement of reinforcement detailing (i.e., joint hoops and introduction of 135 hooks to improve the anchorage) and the introduction of new design concepts (Fahmy et al., 2018; Hassan et al., 2010; Kadarningsih et al., 2014; Murty et al., 2003) that resulted in high steel congestion in the joint region creating new problems with concrete placement and quality assurance of beam-column joint construction. A recent innovation has occurred with the use of High-Performance Fiber Reinforced Cementitious Composites (HPFRCCs) or Engineered Cementitious Composites (ECCs) for the improvement of seismic behaviour of structure (AL-Gemeel and Zhuge, 2018; Gencturk and Hosseini, 2015; Hosseini, 2014; Hosseini et al., 2018; Ismail et al., 2018; Jin and Li, 2019; Pan and Yuan, 2013; Qudah and Maalej, 2014; Said and Abdul Razak, 2016; Wu et al., 2017; Yu et al., 2018; Yuan et al., 2013; Zhang et al., 2015, 2019). The use of ECC in the selected regions of conventional reinforced concrete members has been very useful in addressing its inherent weaknesses such as inadequate tensile strength, brittleness, etc. (Zhang et al., 2019). Several experimental studies have been reported on the use of ECC in the selected regions of structural members, including beam-column joints for the performance enhancement and overcoming the inherent concrete weaknesses (Şahmaran and Li, 2010; Srinivasa and Venkatesh, 2014; Youssef et al., 2007).
The presence of fibres in ECC and absence of coarse aggregate from the mix impart extra ductility and strain hardening to concrete thus preventing concrete spalling, crushing and rebar debonding. The strain hardening of ECC has been observed at more than 1% of the strain capacity of concrete under tension (Fukuyama et al., 2000). These characteristics provide ductile behaviour to ECC and help in enduring damages produced in the RC structure without any construction difficulties. A study conducted by Li VC has proved the effectiveness of ECC in controlling crack propagation and improving the ductility of structural elements (Li, 2003). The studies by Fischer and Parra conclude that ECC’s energy dissipation and stiffness degradation capability are favourable to the extent that it can eliminate the need of transverse reinforcement in the structural component (Fischer et al., 2002; Parra-Montesinos et al., 2005).
This research program seeks to exploit the ultra-ductile behaviour of the PVA-ECC for seismic performance enhancement of beam-column joints and reduce steel congestion at the joint region by eliminating the need for transverse reinforcement. The performance of joints has been investigated by shake table testing the frame models at different excitation levels to produce progressive damage up to the near-collapse state. The seismic performance of beam-column joints using ECC without shear ties has been assessed by comparing the seismic design factors for the prototype frame having ECC beam-column joints without shear reinforcement with those for the similar prototype frame having ECC beam-column joints with transverse shear reinforcement. In the wake of limited published research on the shake table testing of hybrid ECC-concrete structures, the current study may be regarded as a pioneering effort to build the confidence of the practising engineers in using ECC in beam-column joints of buildings without transverse shear reinforcement.
Experimental program
The experimental program included testing two models of a full-scale interior frame extracted from a two-story frame shown in Figure 1. The frame designed for high seismic vulnerability had a theoretical lateral force design capacity of 0.2 times the structure weight, i.e., 11.475 kips (51.04 KN). The following sections describe the prototype frame and its models. Plan and isometric view of the prototype structure.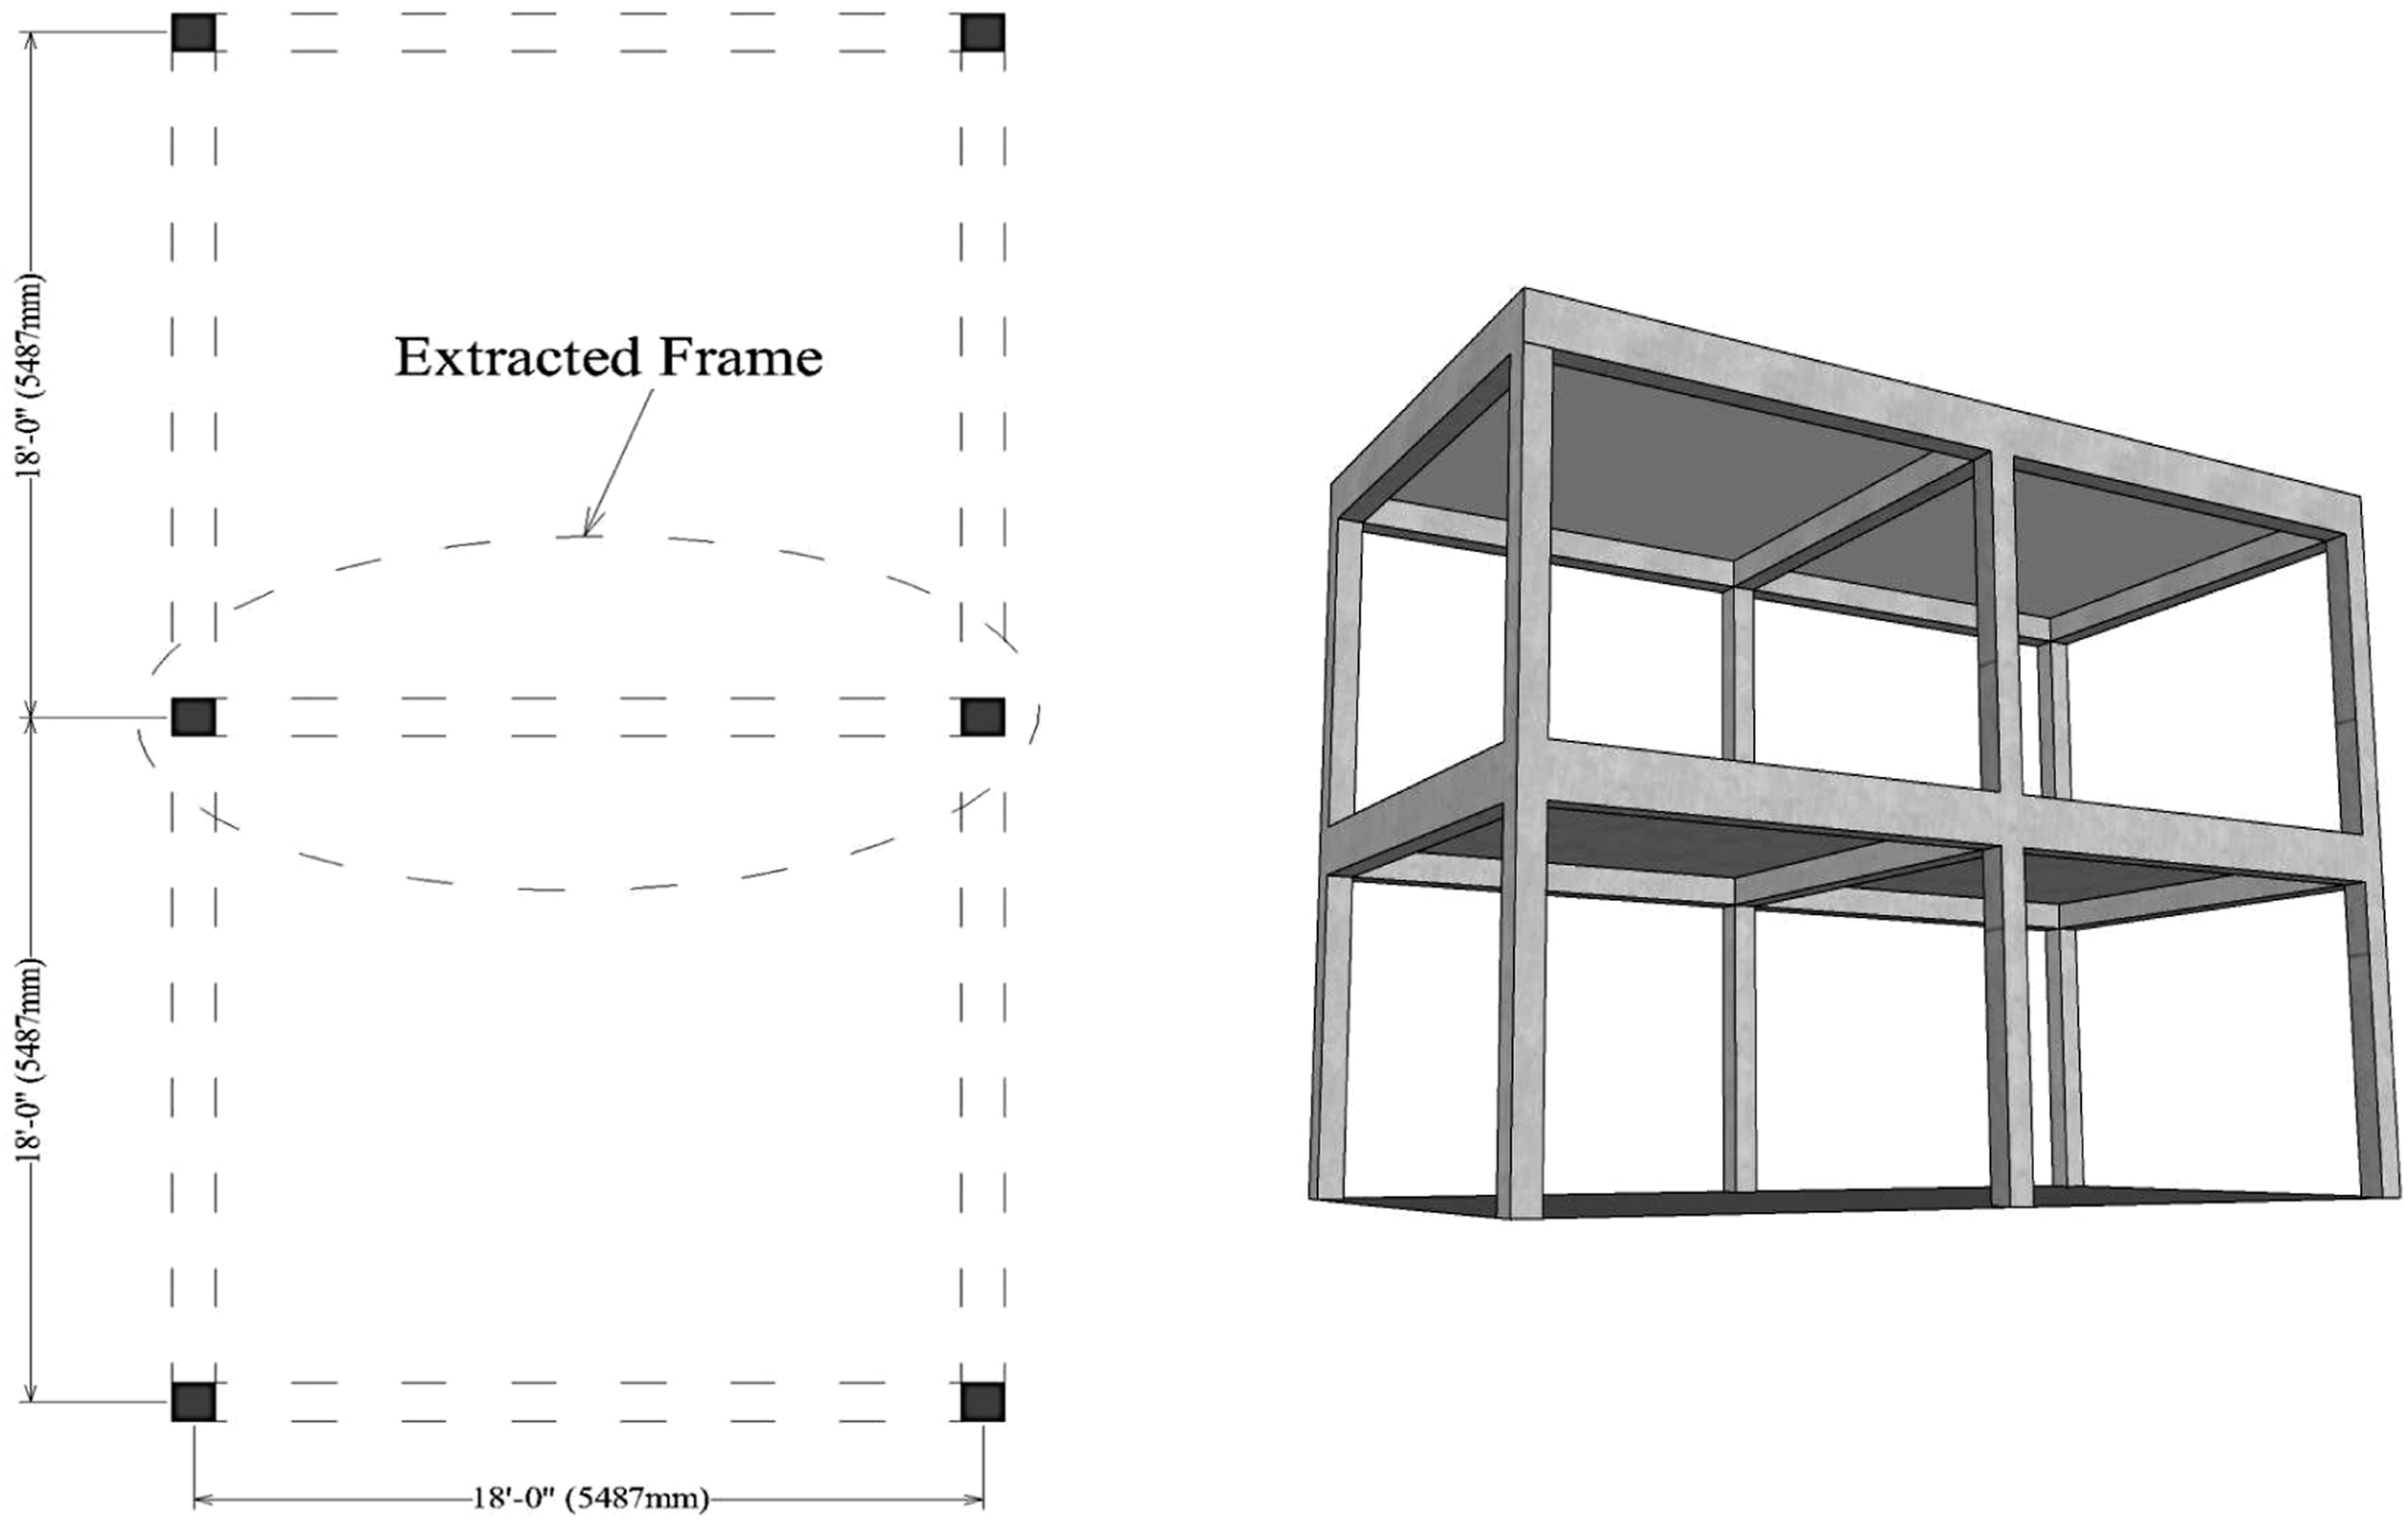
Frames description
The prototype interior frame, shown in Figure 1, has column and beam dimensions of 12 in. × 12 in. (304 mm × 304 mm) and 12 in. × 18 in. (304 mm × 459 mm), respectively, with the reinforcement details shown in Figure 2. To compare the performance of ECC beam-column joint without shear ties with shear ties; two prototype frames, one having shear ties as per ACI-318-19 (ACI-318-19, 2019) for IMRF requirements called Prototype-1 and the other without shear ties called Prototype-2 were prepared. The structural detailing of each frame prototype is shown in Figure 2. Geometric and reinforcement details of prototype frames.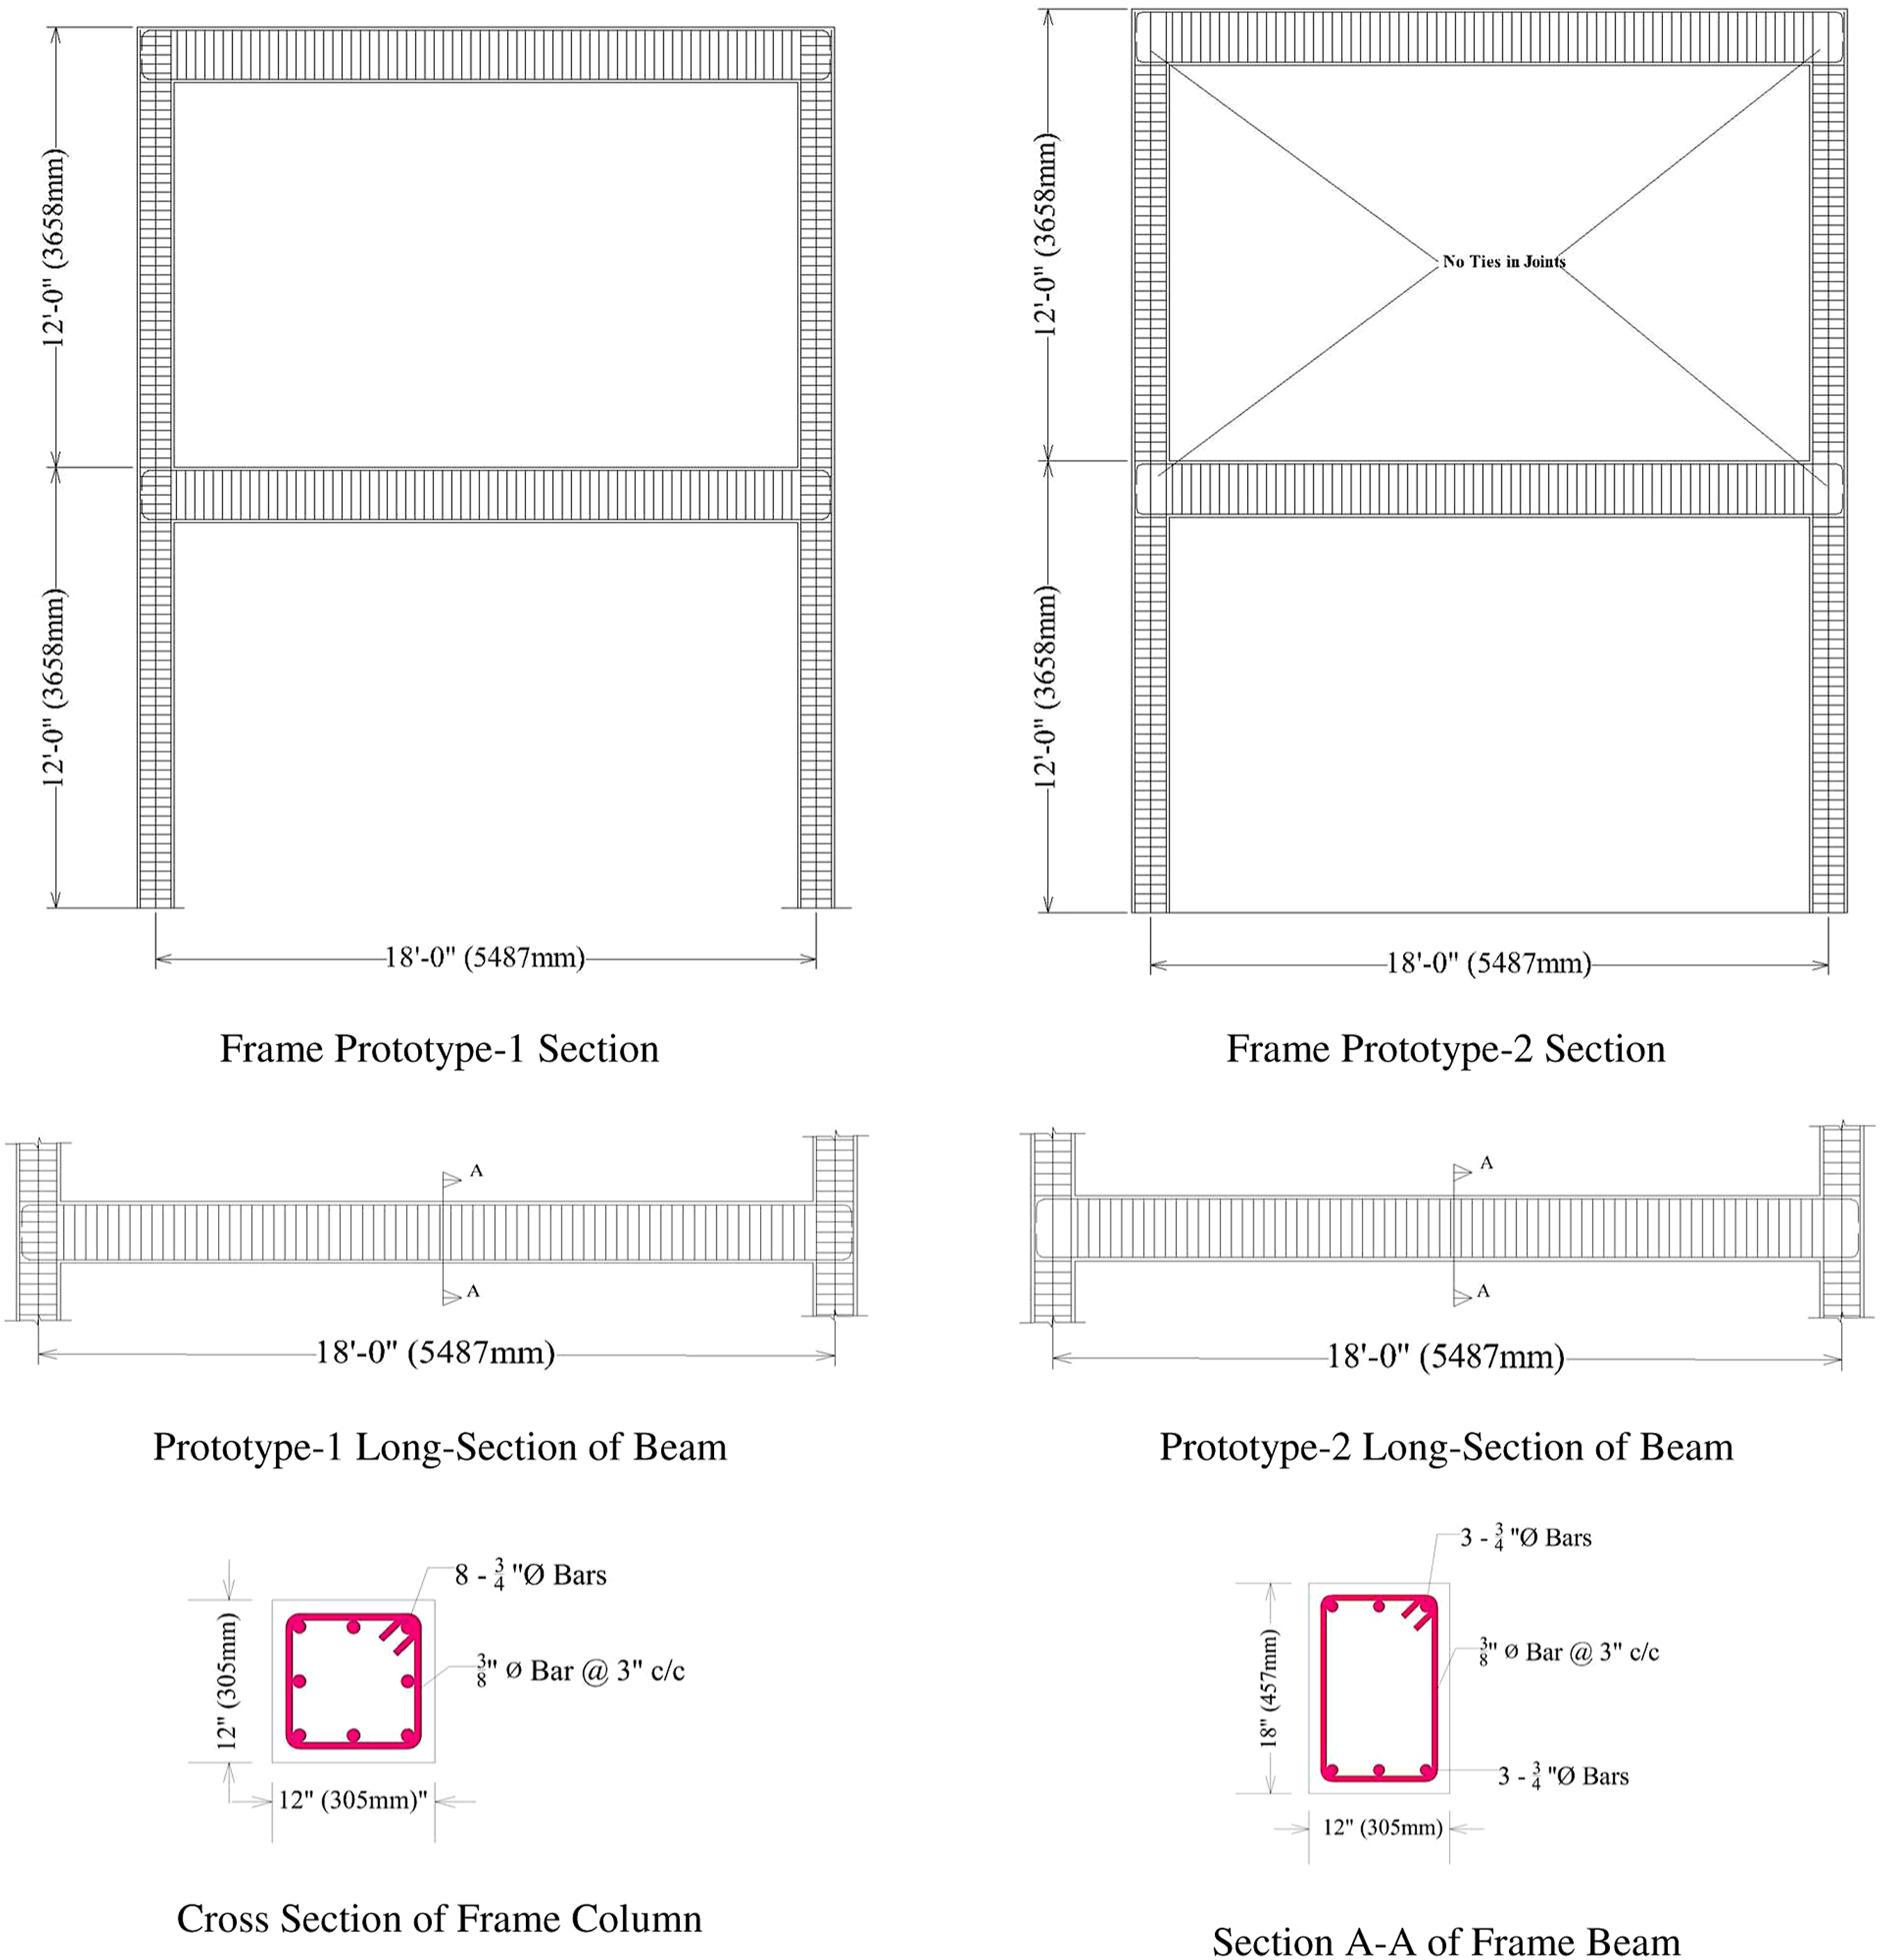
The compressive design strength of concrete and yield strength of steel reinforcement was supposed to be 2000 psi (14 MPa) and 60,000 psi (414 MPa), respectively, whereas the design average strength of 3626 psi (25 MPa) was assumed for ECC. The material strength was selected to represent no quality assurance conditions in third world countries whereas the geometric and reinforcement detailing of the prototype frames was considered in line with the recommendations of the previous studies (Ahmad et al., 2018a, 2019; Akbar et al., 2018; Rizwan et al., 2018; Ullah et al., 2020). To ensure maximum utility, the locations of ECC were assumed to behave as plastic hinges. The usage of the ECC was extended 3 feet (914.4 mm) beyond the joint boundaries both in columns and beams, as shown in Figure 3. Placement of engineered cementitious composite in prototype frame.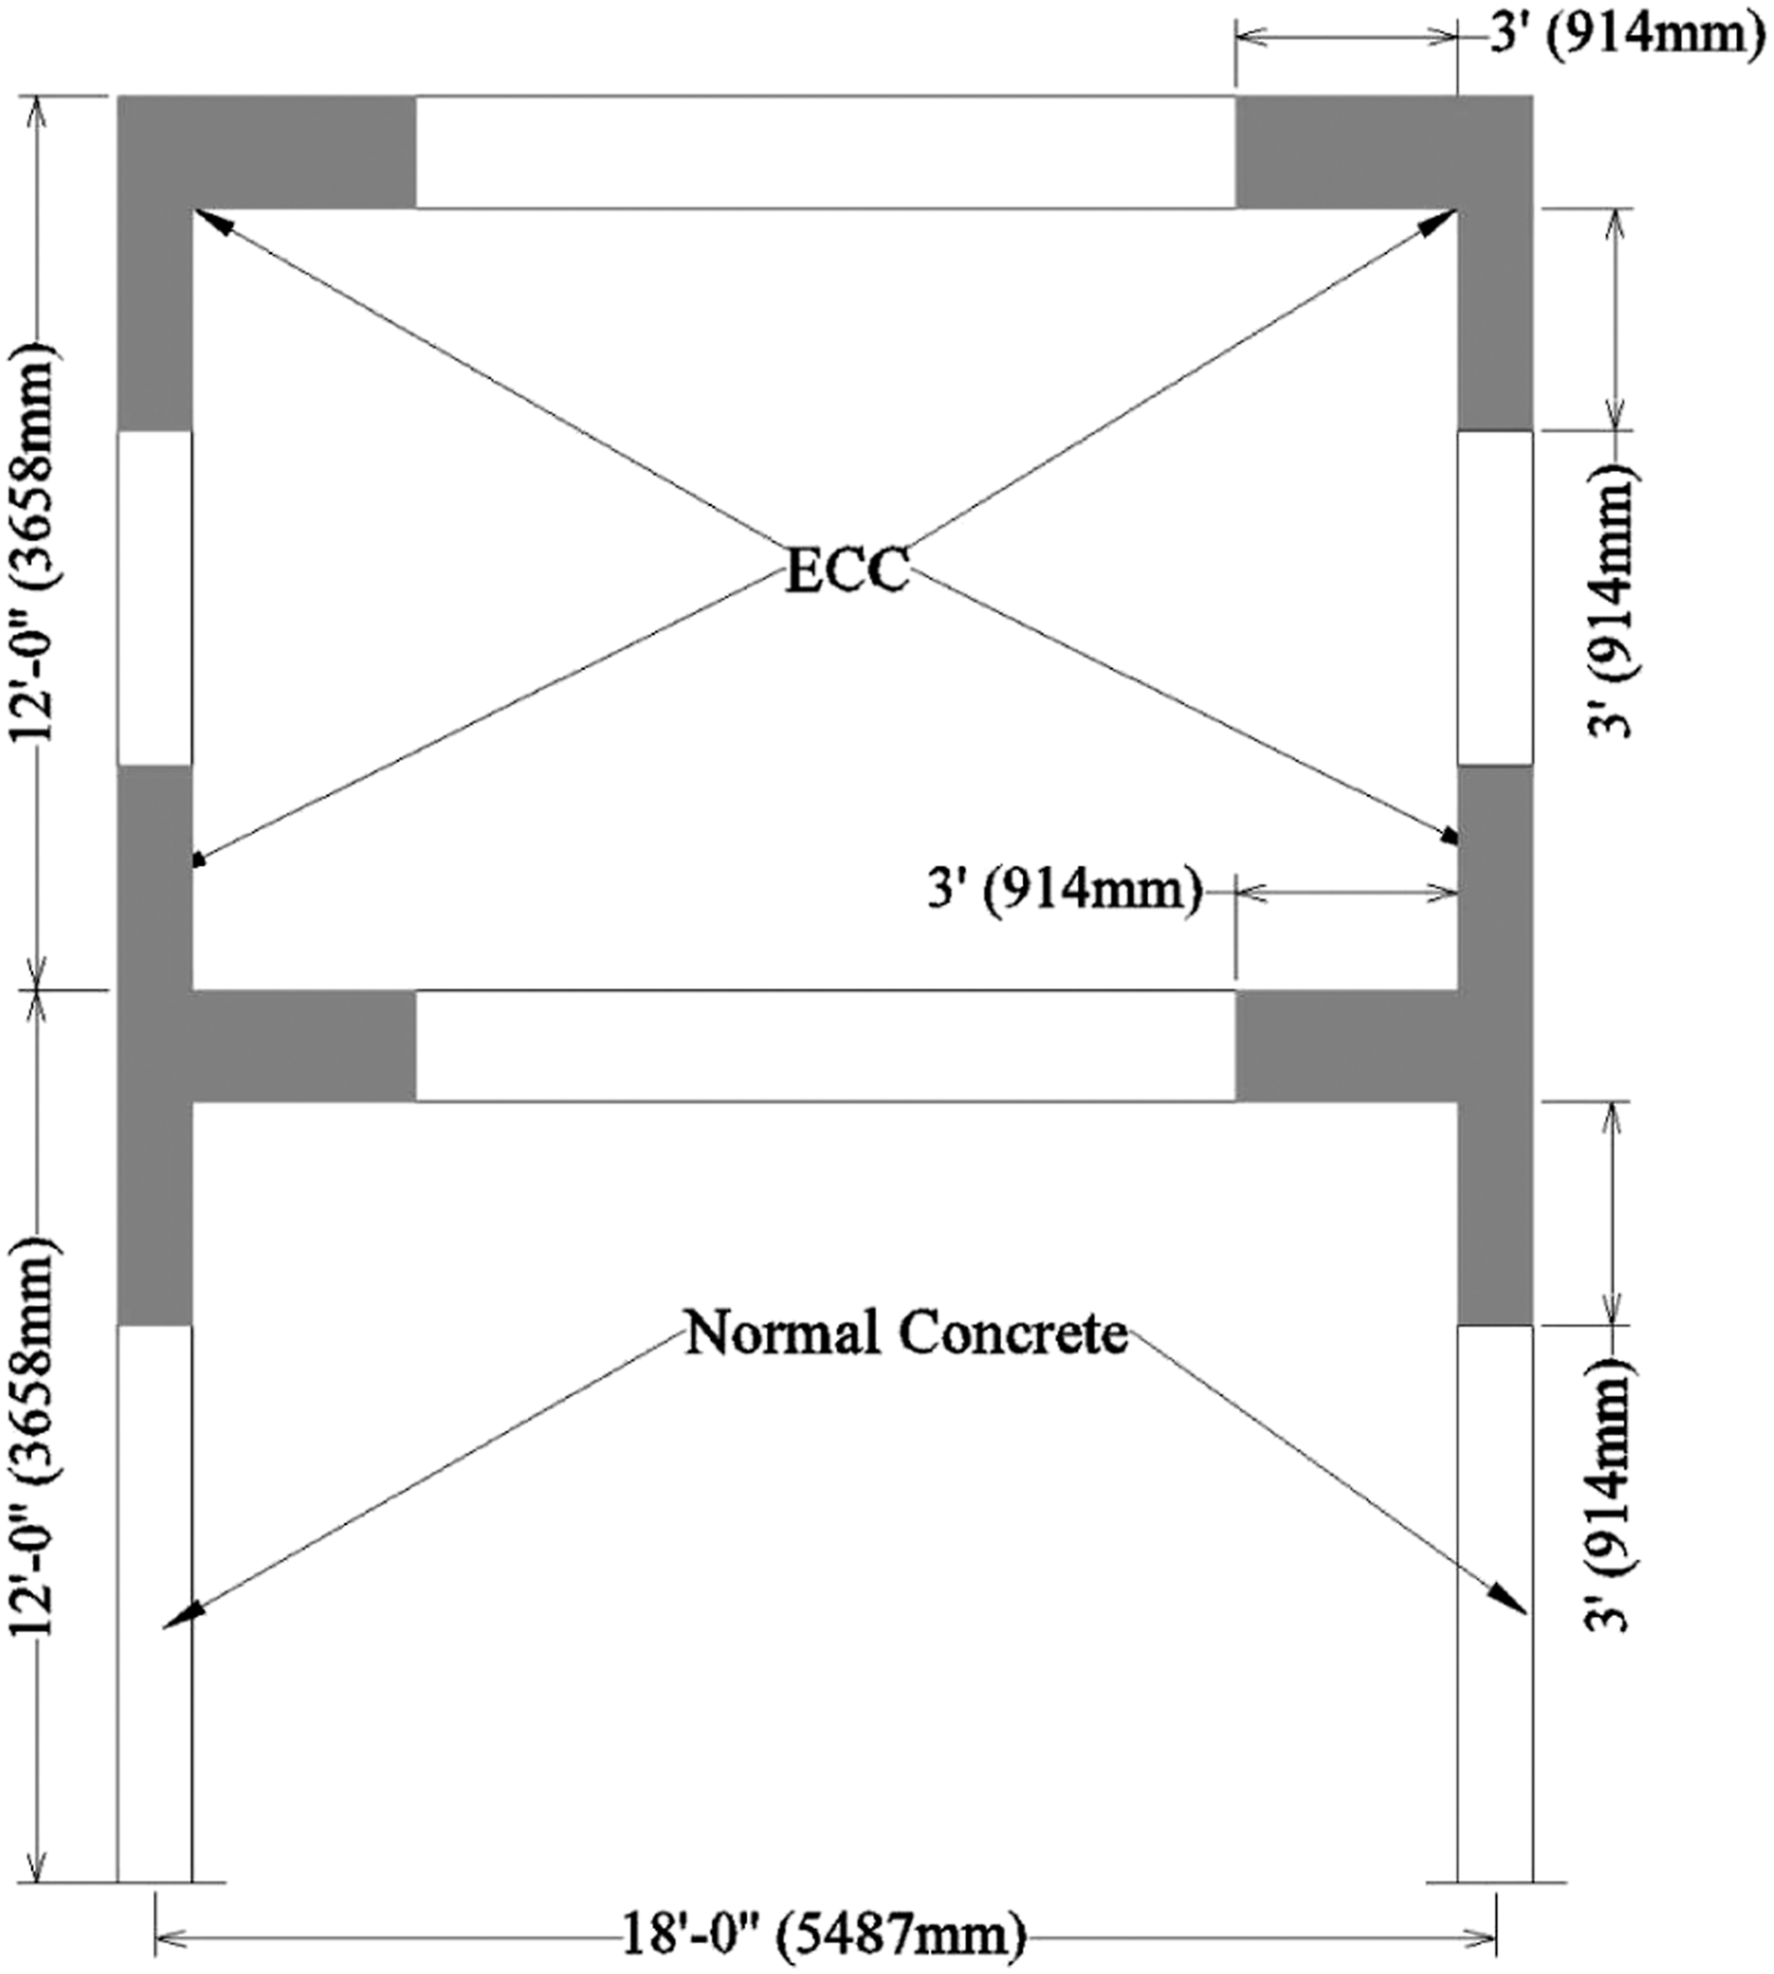
Preparation of scaled-down models
Geometric and material Configuration of test specimen.
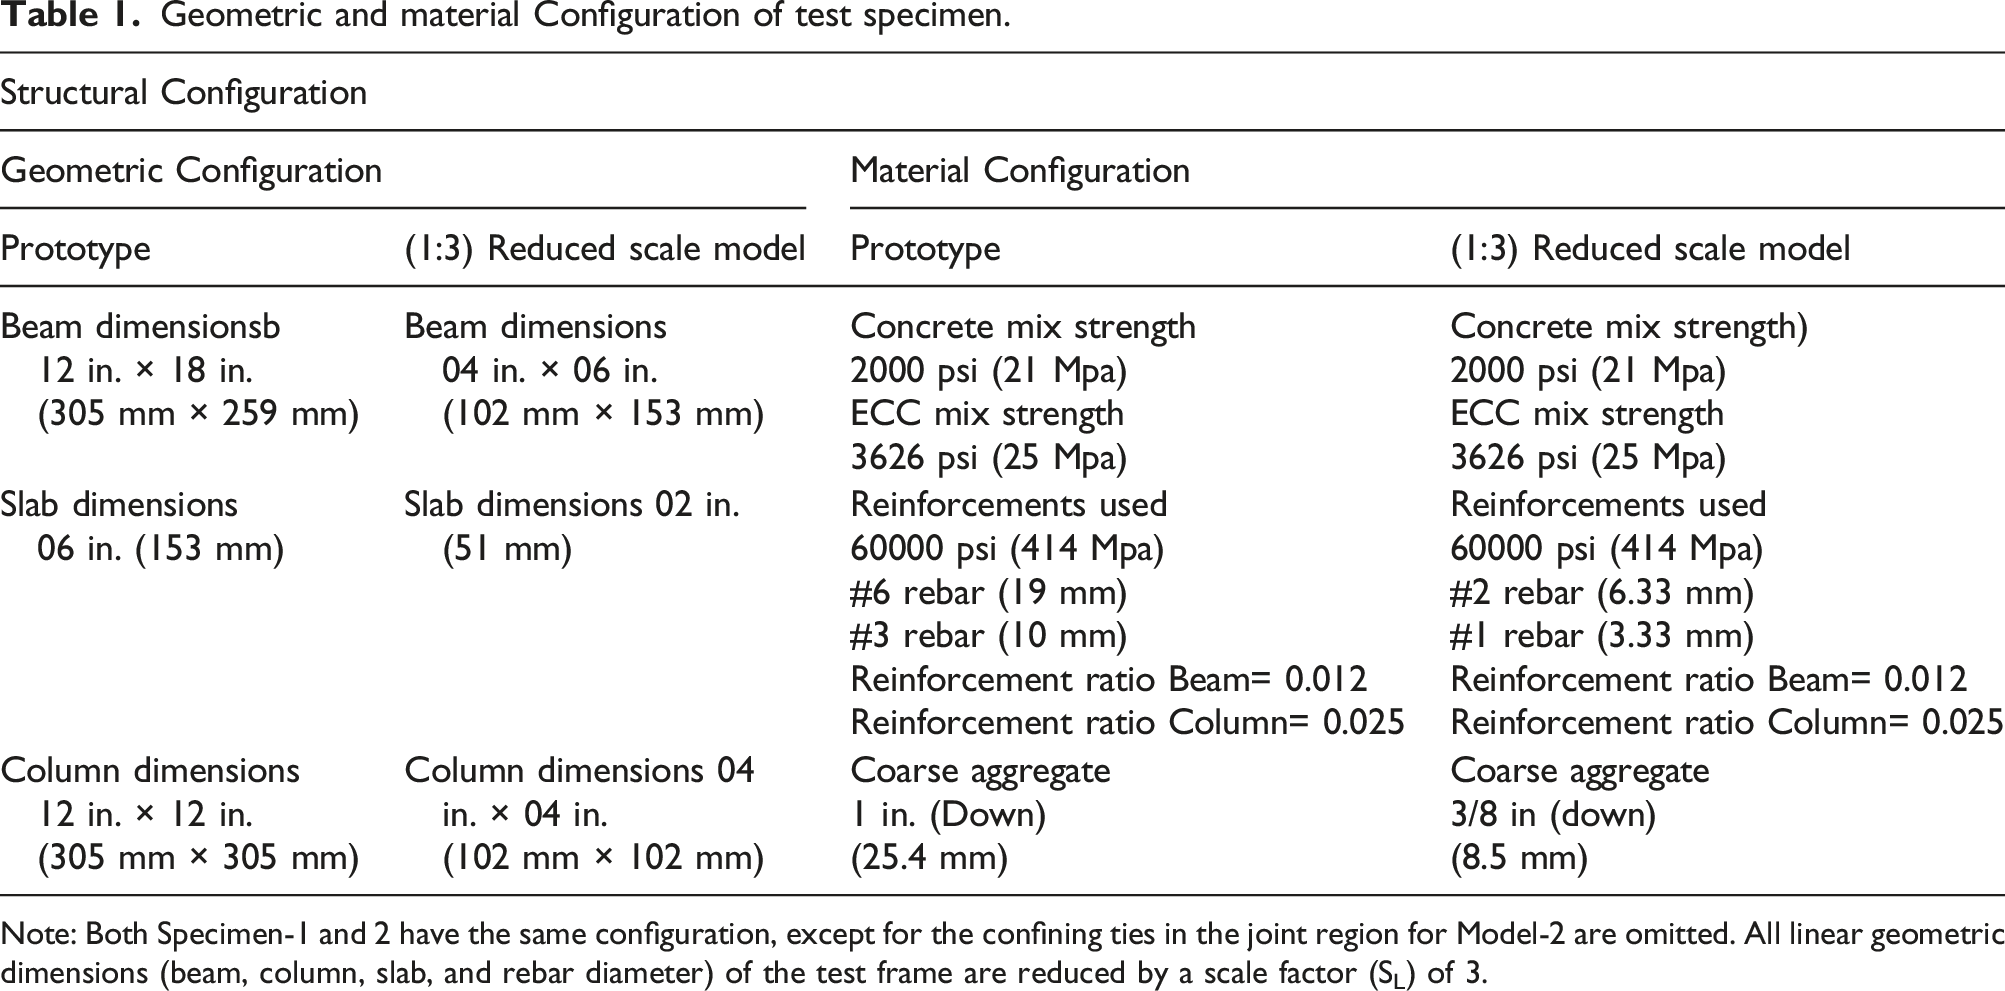
Note: Both Specimen-1 and 2 have the same configuration, except for the confining ties in the joint region for Model-2 are omitted. All linear geometric dimensions (beam, column, slab, and rebar diameter) of the test frame are reduced by a scale factor (SL) of 3.
The casting of the models was done on a firm 22 in. (559 mm) wide, 15 in. (381 mm) deep, and 8 ft (2439 mm) long RC pad. The ground story was cast monolithically with the pad and ECC was then poured into the formwork at beam-column joints and up to 1 ft (304.8 mm) into the adjoining beam and columns (Figure 3). After the ground story had gained sufficient strength, the second story was constructed following the same procedure. The structure was cured for 14 days with the help of gunny bags after the removal of the formwork.
Engineered cementitious composites mix design for test specimens.

aHigh Volume Water Reducing admixture @ 2.5 kg per 100 kg of binding material was used.
An additional mass of 1200 kg was added to each model floor by anchoring steel plates of equivalent mass to fulfil the model-mass simulation requirements. The extra mass was calculated using the mass simulation model used in earlier studies (Ahmad et al., 2016, 2017a; Akbar et al., 2018; Rizwan et al., 2018, 2020; Ullah et al., 2020).
Input excitation and loading protocols
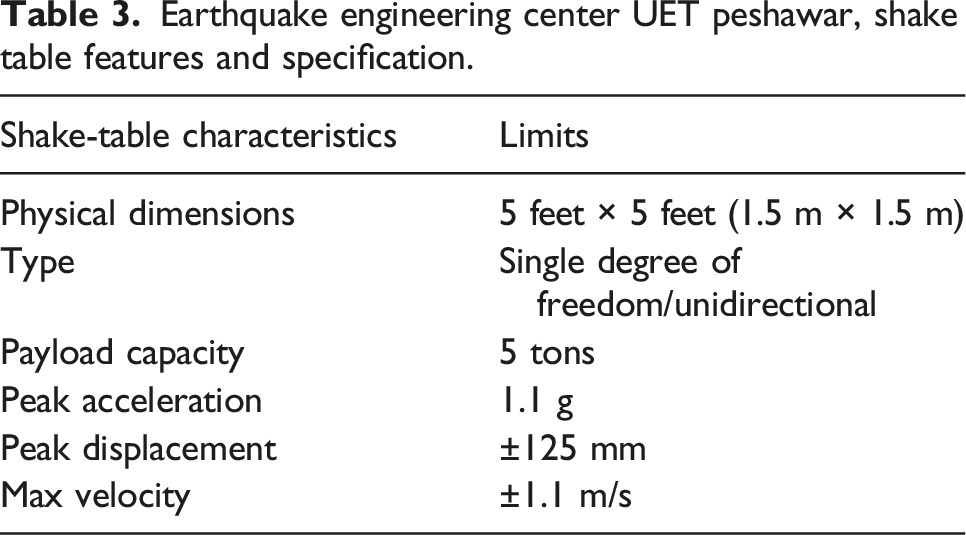
Earthquake engineering center UET peshawar, shake table features and specification.
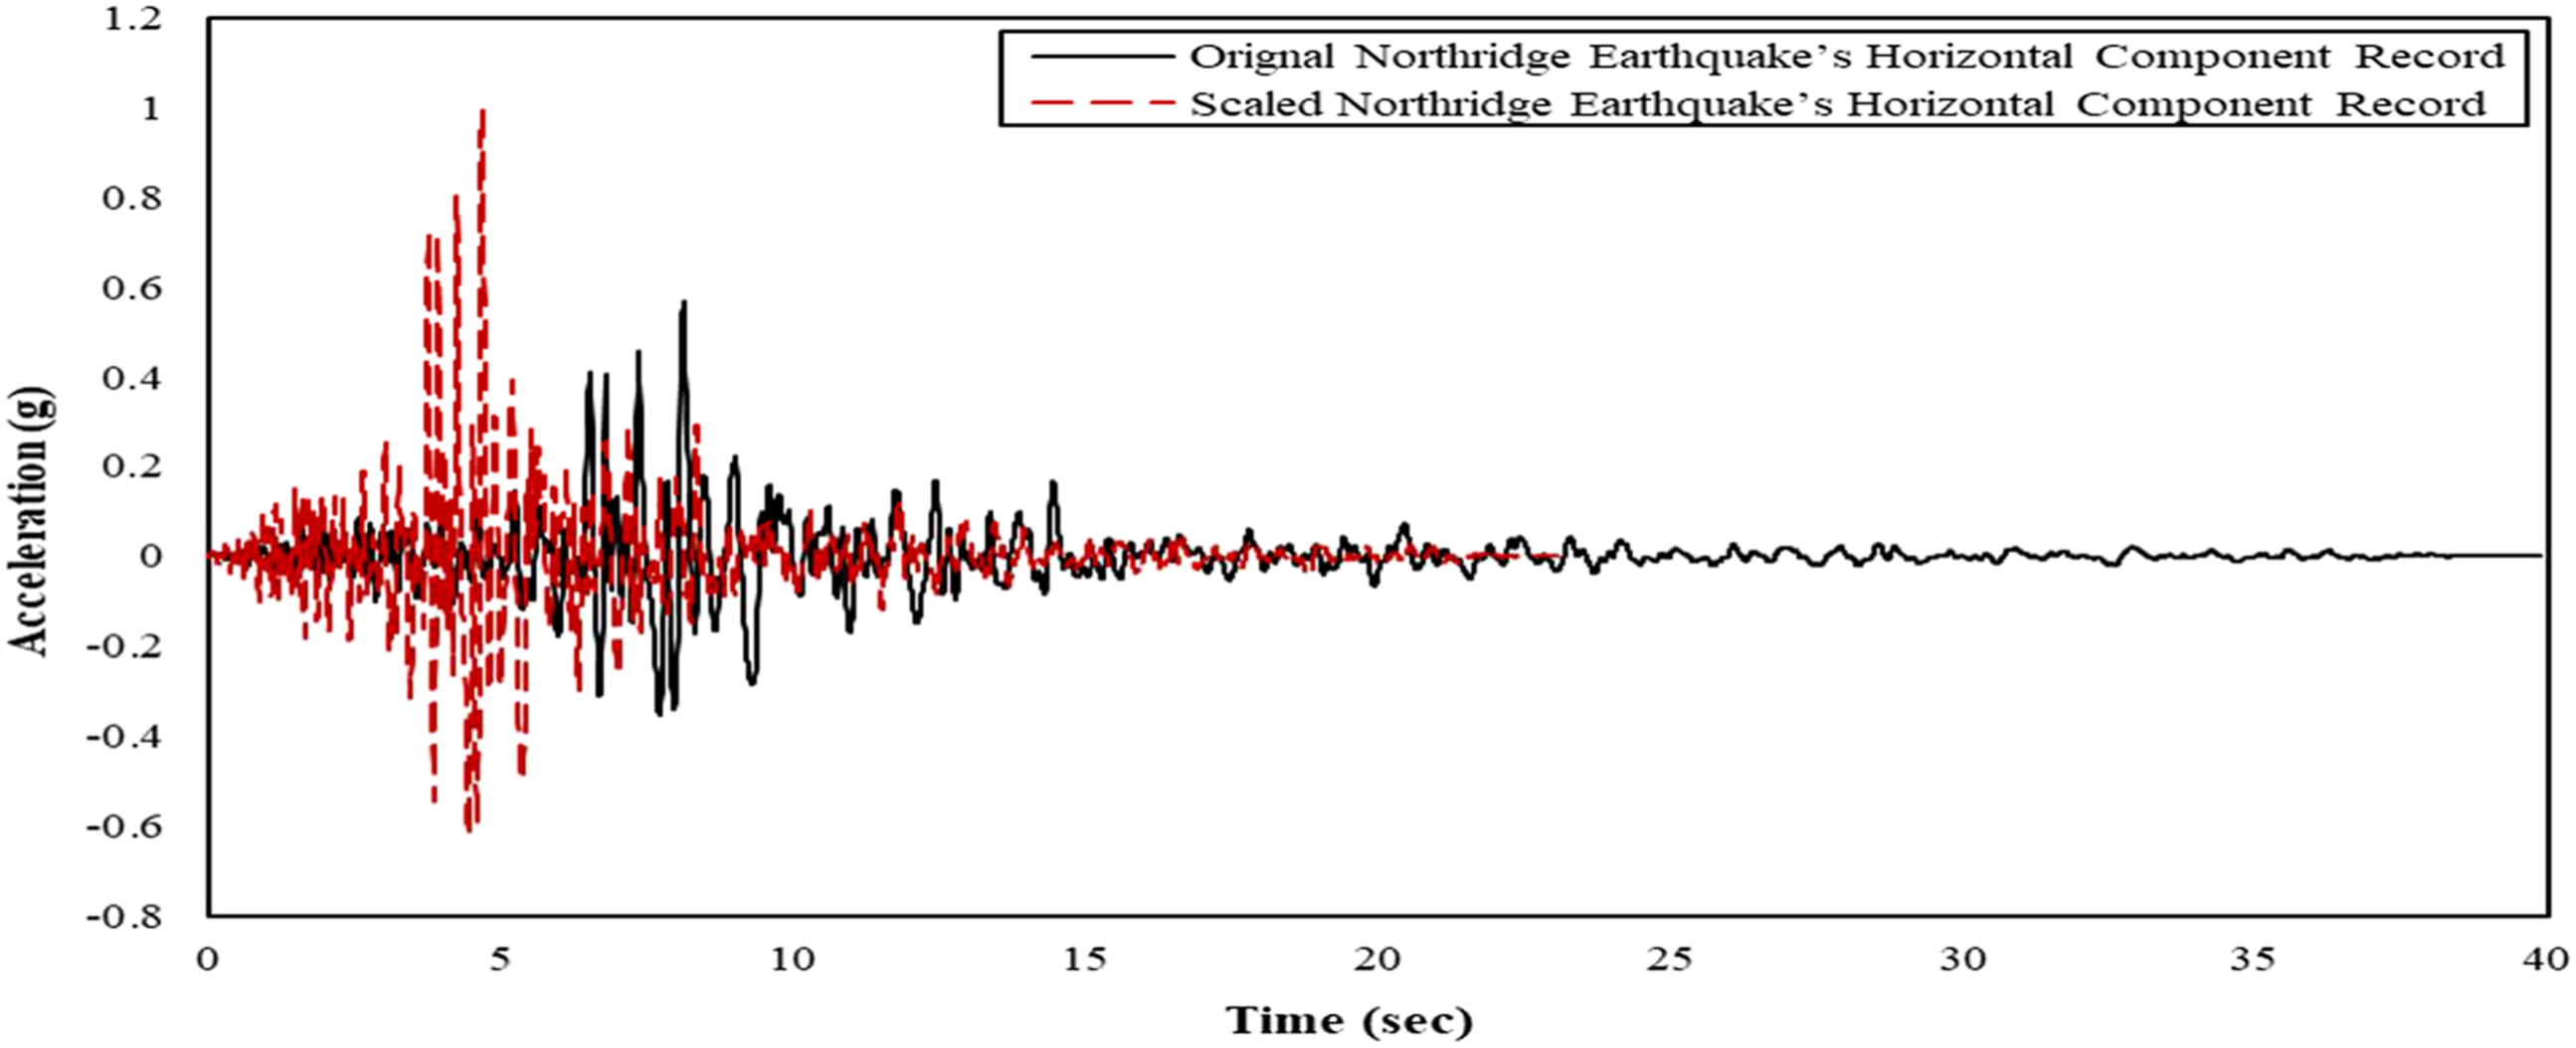
Northridge input excitation for shake table testing [56].
Only one-time history was used to study the dynamic behaviour and amplitude was scaled from 5% to 100% for the excitation of the model up to the near-collapse state. This method of constructing force-displacement capacity curve used in other studies (Ahmad et al., 2018a, 2018b, 2019; Akbar et al., 2018; Khan et al., 2021; Rizwan et al., 2020; Ullah et al., 2020) was considered appropriate and hence used in the current study as well. The time history had a maximum PGA equal to 0.57 g, with a maximum velocity of 518 mm/s and a maximum displacement of 90 mm.
The time step was reduced for the acceleration record by a scale of SL0.5=30.5 to comply with the similitude requirements suggested by the earlier studies (Ahmad et al., 2017b; Ali et al., 2013; Tomaževič, 2000). The chosen time history was primarily scaled to 1.0 g; then, it was applied to the specimen with an incremental rate of 5%–100% of the highest acceleration. The damage sequence of the test specimens was noted and documented for each run. The testing of the model was considered as complete as it reached the near-collapse state of damage.
Scheme of instrumentation
The pad of the specimen was firmly secured to the shake-table with bolts to avoid tilting or rocking of the test specimen. A reference frame was then erected and fixed in line with the model at an approximate distance of 3 ft (915 mm) to mount the five-displacement transducer at a different level, as shown in Figure 5. The string pot of each displacement transducer was stretched by half of its length and attached to each floor and base pad. For recording the acceleration at each level, the experimental models were provided with three uniaxial accelerometers shown in Figure 5. The characteristics of each instrument and its position on the specimen are given in Table 4. The installed accelerometers could measure acceleration up to ± 10g, whereas the displacement transducers had a maximum capacity of 24 inches (610 mm). Scheme of instrumentation for shake table testing. List of instruments used their position and sensitivity.
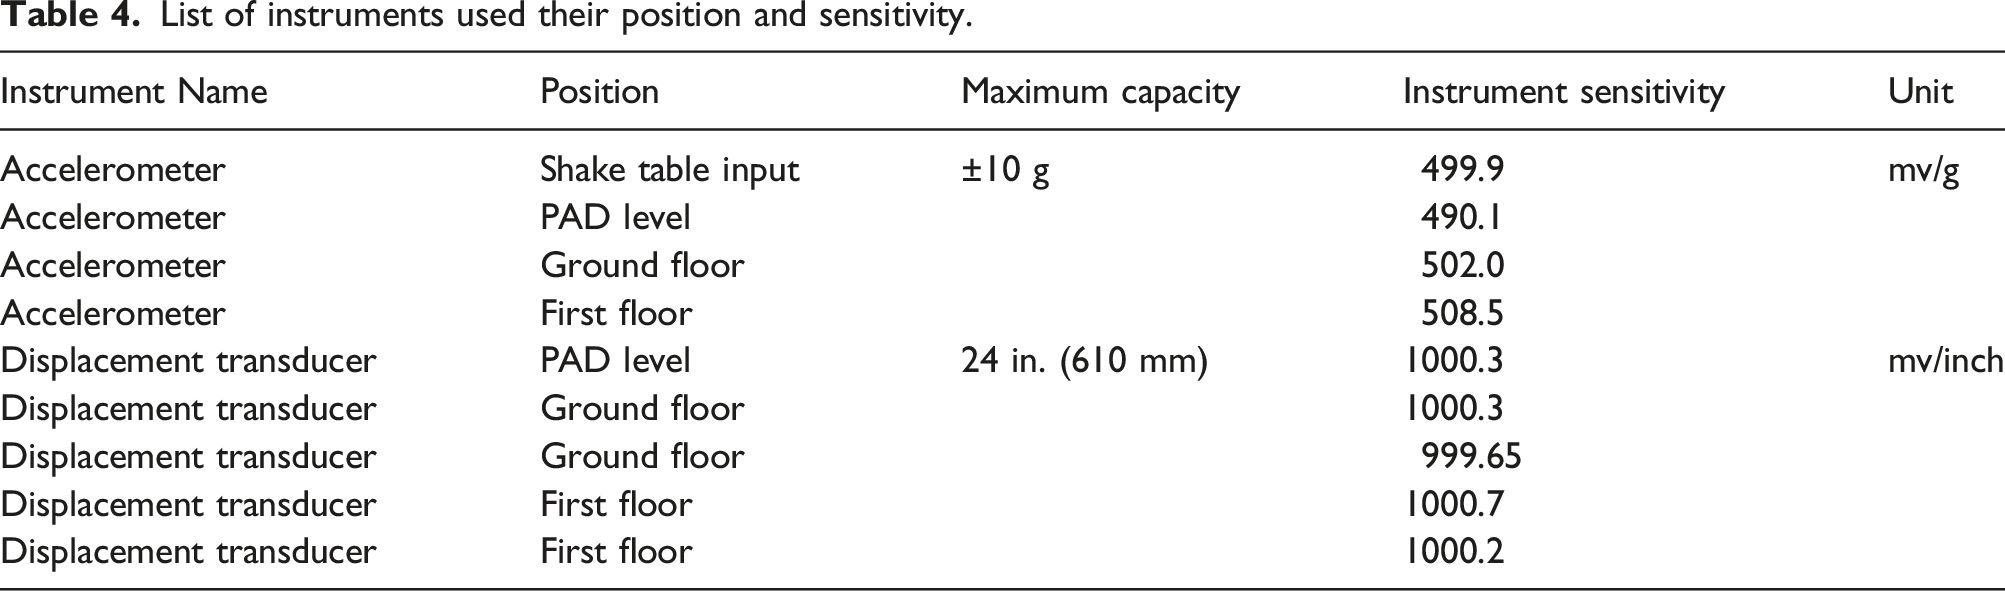
The data signals received from the accelerometer and displacement transducer were in the form of an electrical signal (mv) converted to equivalent acceleration and displacement by multiplying them with their relative sensitivity reported in Table 4.
Free vibration test
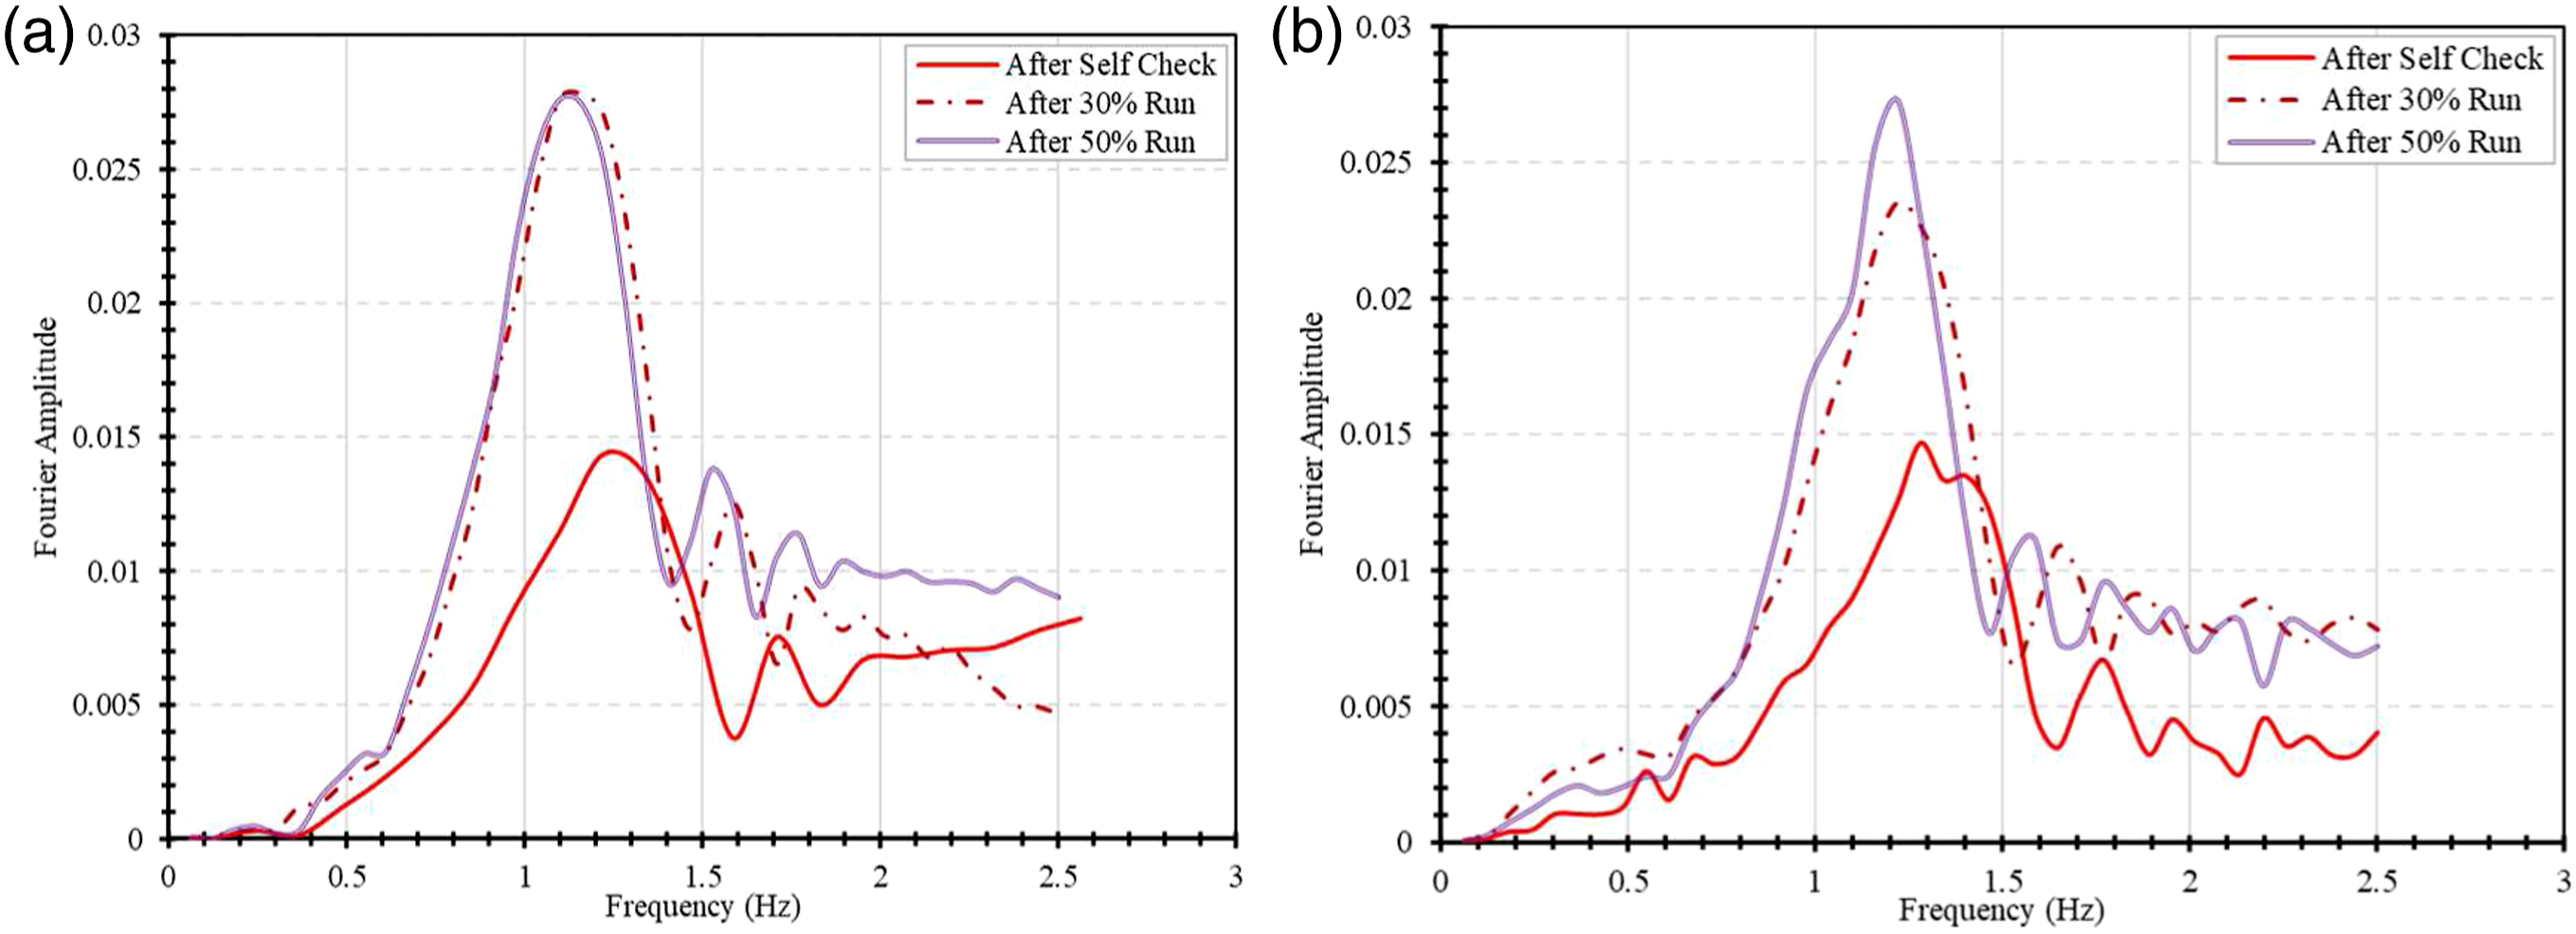
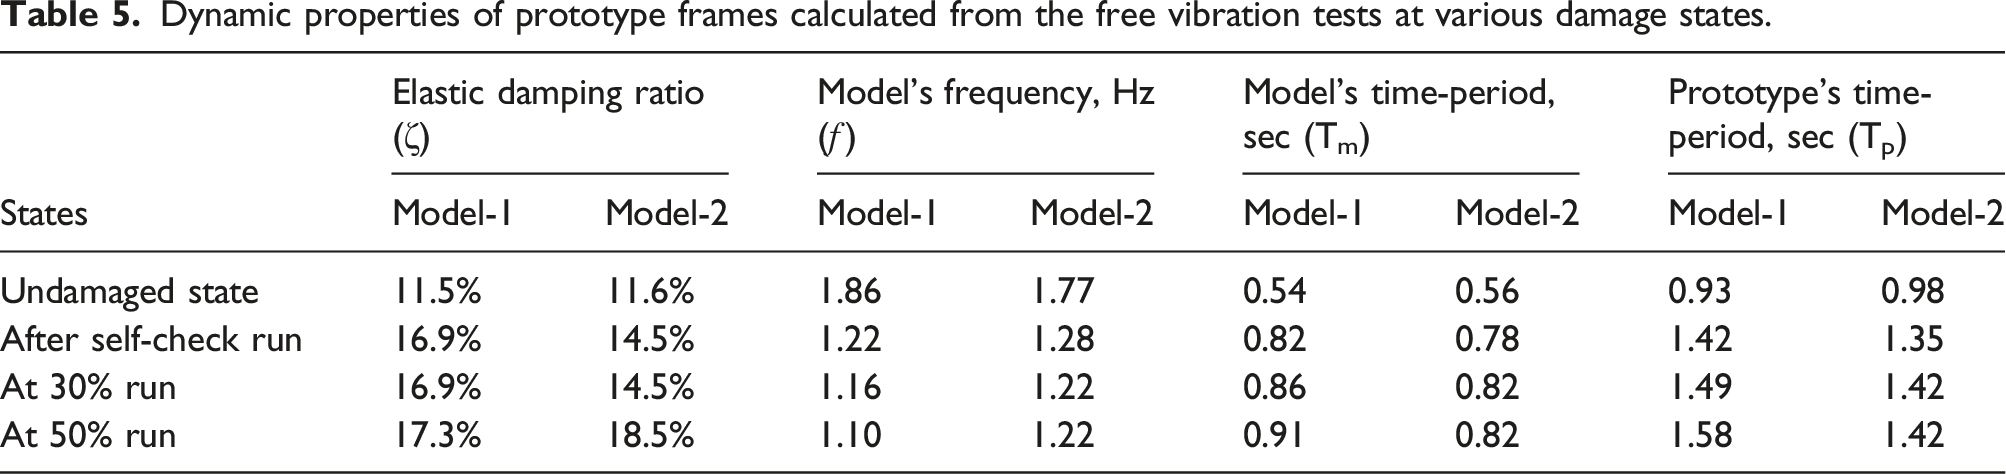
The free vibration test was conducted at different stages of the test program to calculate variations in natural frequency, time period, and damping ratio of the models with the gradual progression of the test. The data acquired from the logger was filtered, and a base correction was applied with the help of Seismosignal software. Similarly, the roof displacement data was transformed from the time domain to the frequency domain with the implementation of Fourier transformation. The Power Spectral Density (PSD) plots shown in Figures 6 and 7 were drawn for different runs by the correlation of frequency and Fourier amplitude. The resonant frequency (ƒ) was considered the first peak of the PSD plot. The resonant frequencies (time period) for undamaged Model-1 and Model-2 were measured as 1.86 Hz (0.53 s) and 1.77 Hz (0.56 s), respectively. The scale factors were used to calculate the time period of prototype frames, which came out as 0.93 s for Prototype-1 and 0.98 s for Prototype-2. The slight increase of 5.1% seen in the calculated time period for Prototype-2 might have been due to a change in the relative stiffness caused by the absence of confining ties in the joint region. As the test progressed, the models experienced cracking, causing a decrease in relative stiffness that ultimately caused an inccrese in the time period, as clear from Table 5. Power spectral density (PSD) plots for the test models in undamaged condition, the first peak represents the modal frequency. Power spectral density plots for models after various levels of test run. (a) Power spectral density Plots for Model-1 after subsequent runs (b) Power spectral density Plots for Model-2 after subsequent runs. Dynamic properties of prototype frames calculated from the free vibration tests at various damage states.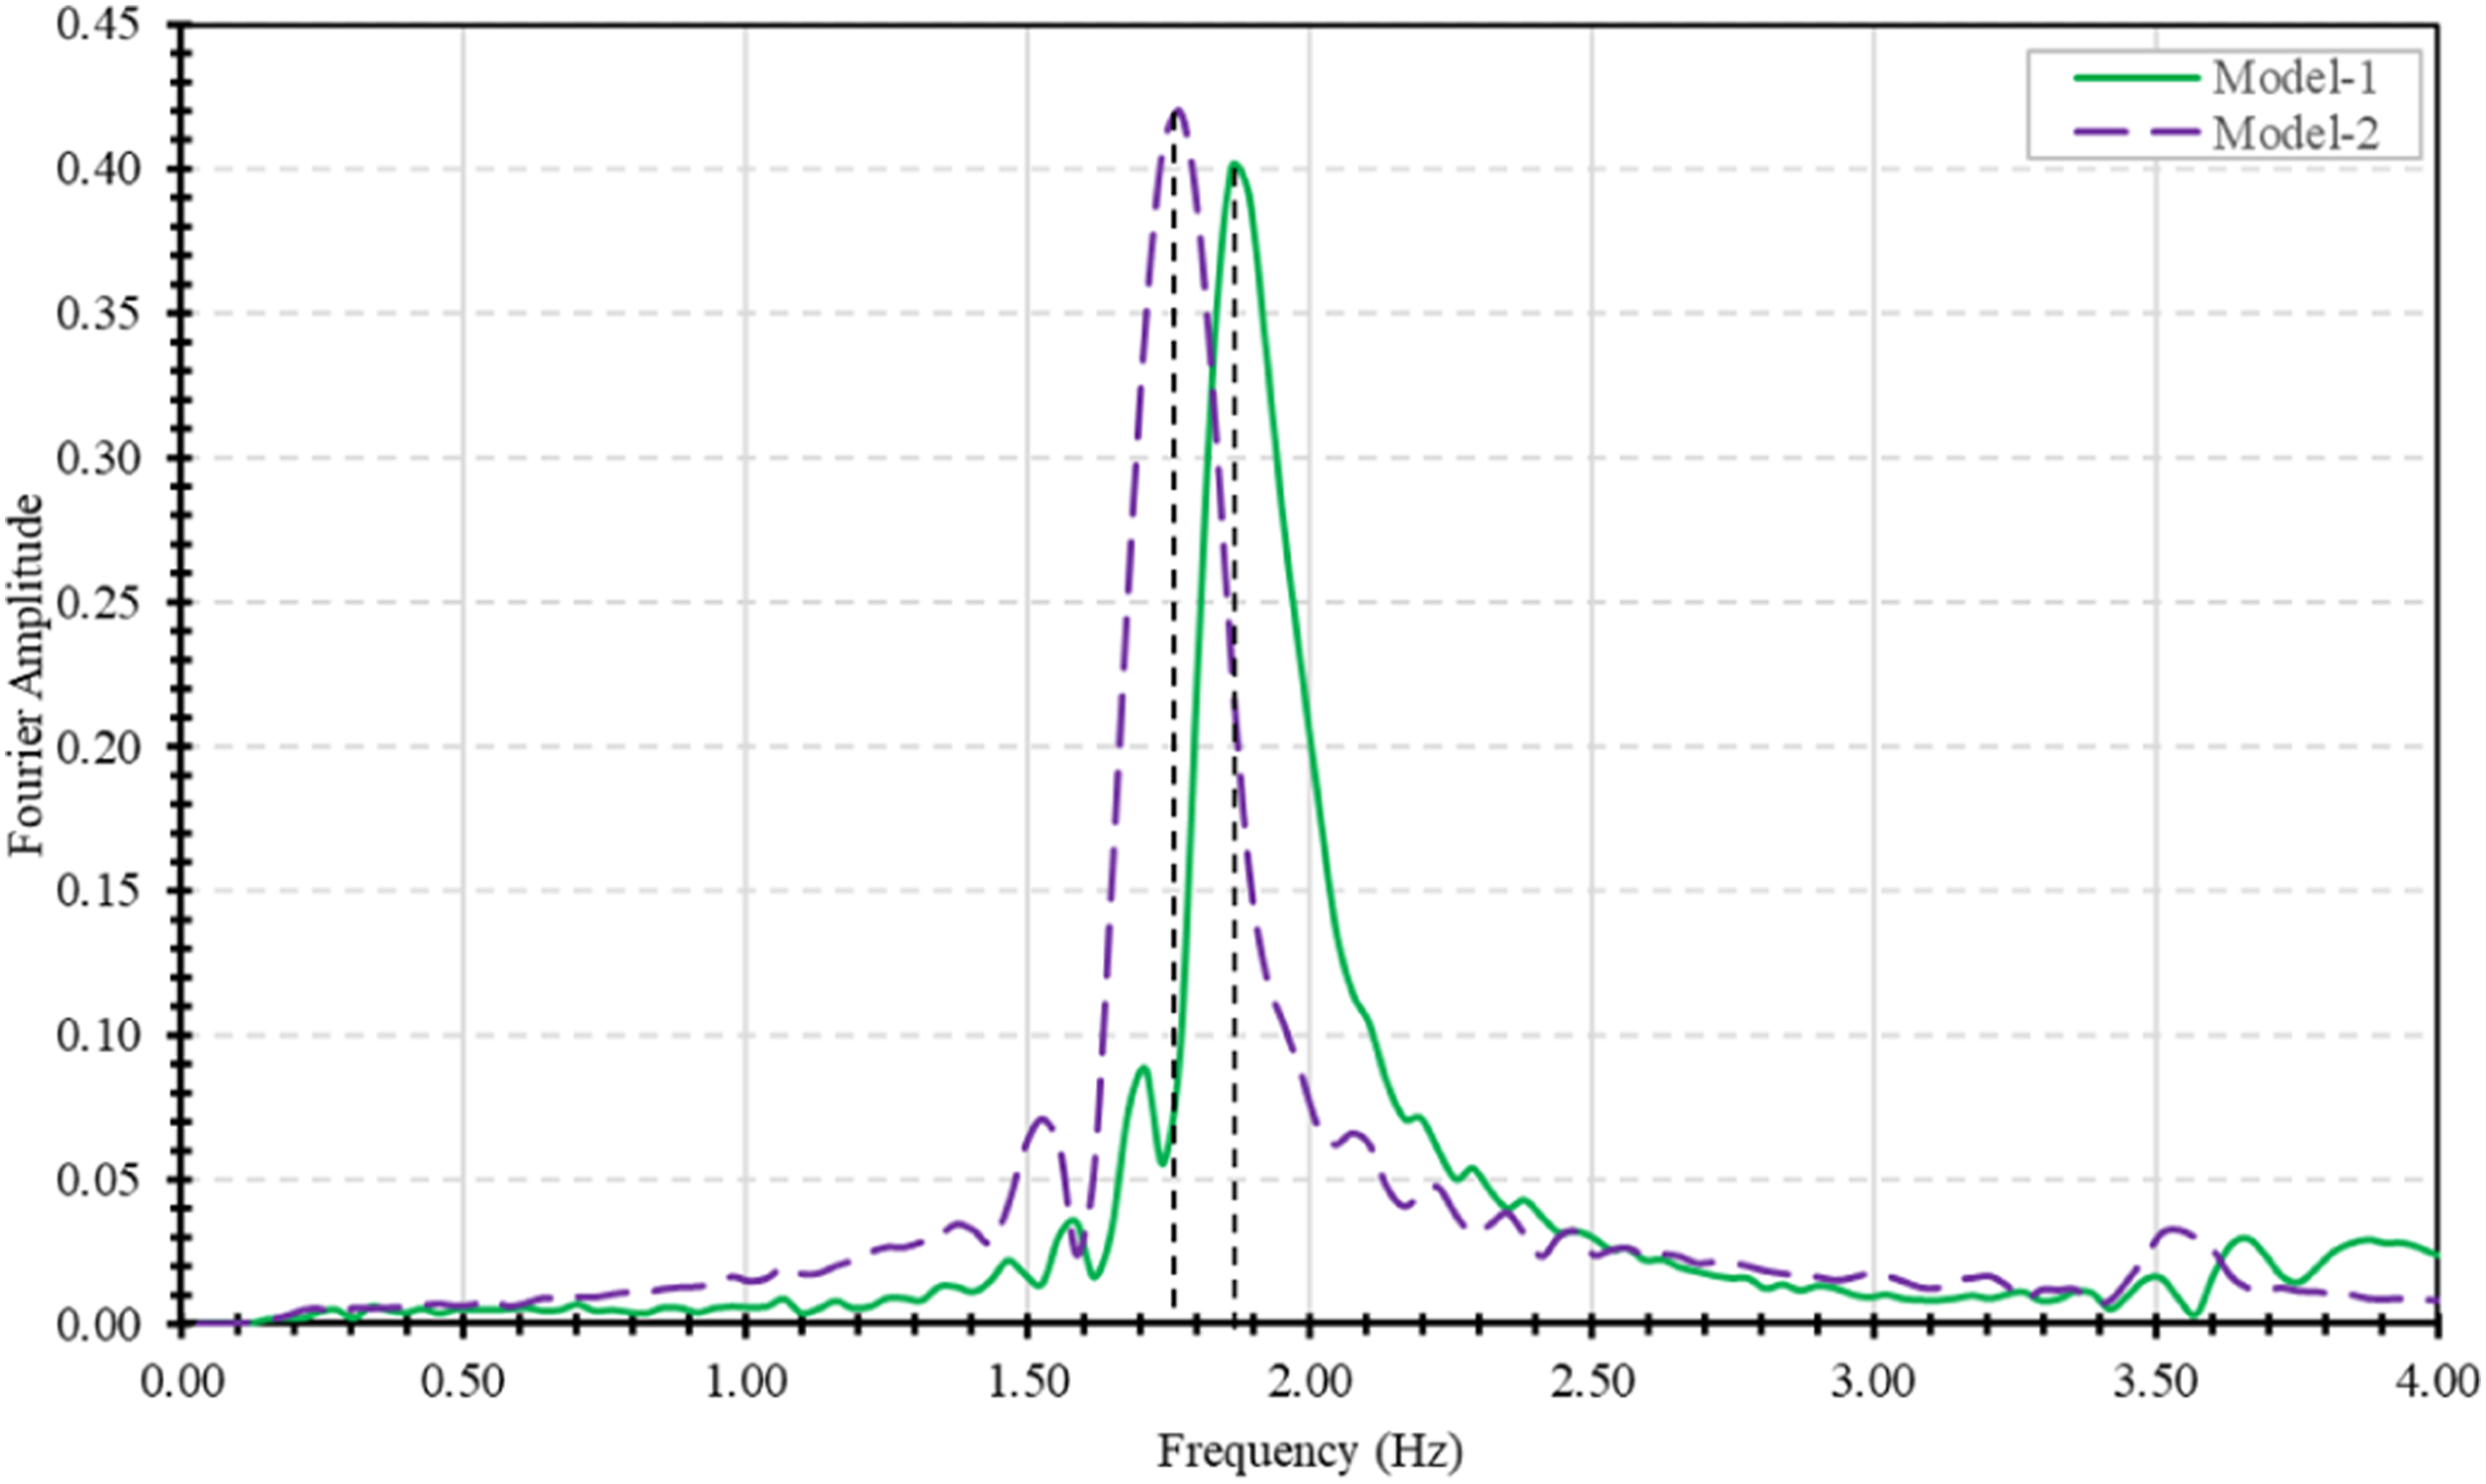
The decay function expressed as equation-1 (CHOPRA, 2012) was used for the calculation of elastic damping ratios for models: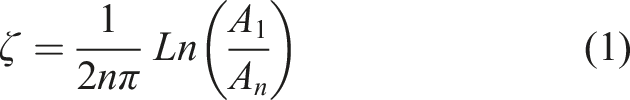
In equation (1),
The damping ratio for models was calculated at the initial stage when the specimen was intact, then after the self-run of the shake table when the model had minor damages, and lately after 30% and 50% run of the test. Damping ratios of Model-1 and Model-2 in the undamaged state were 11.5% and 11.6%, respectively. After the self-check run, damping ratios of both the models were found to increase, possibly due to the propagation of cracks. The approximate increase was 47% and 25% for Model-1 and Model-2, respectively. A slightly less comparative increase in the damping ratio of Model-2 may be due to the energy dissipation caused by the fibres in the ECC mix. At the 30% run of the test, the calculated elastic damping ratios remained the same as those at the self-run. At 50% run, an increase of 50% and 59% was noted in the damping ratios for Model-1 and Model-2, respectively. The difference in damping characteristics of the models may be due to the difference in joint confinement offered by stirrups in Model 1.
Seismic behavior of tested frame models
Observed damage behaviour of RC-ECC composite test models
Model-1
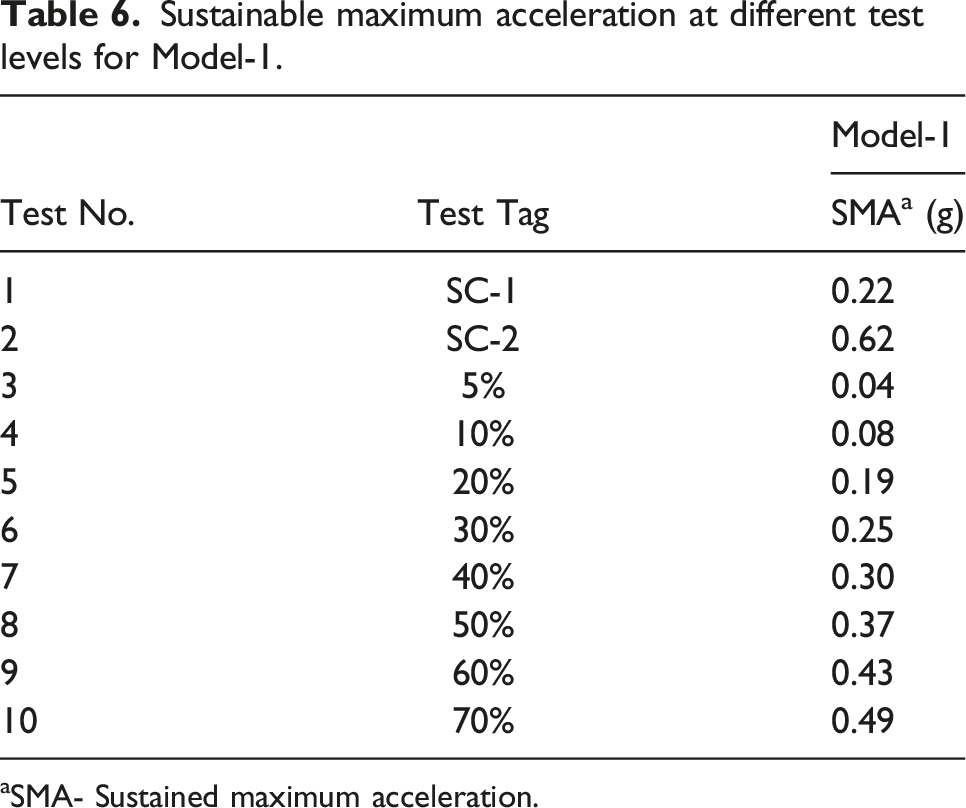
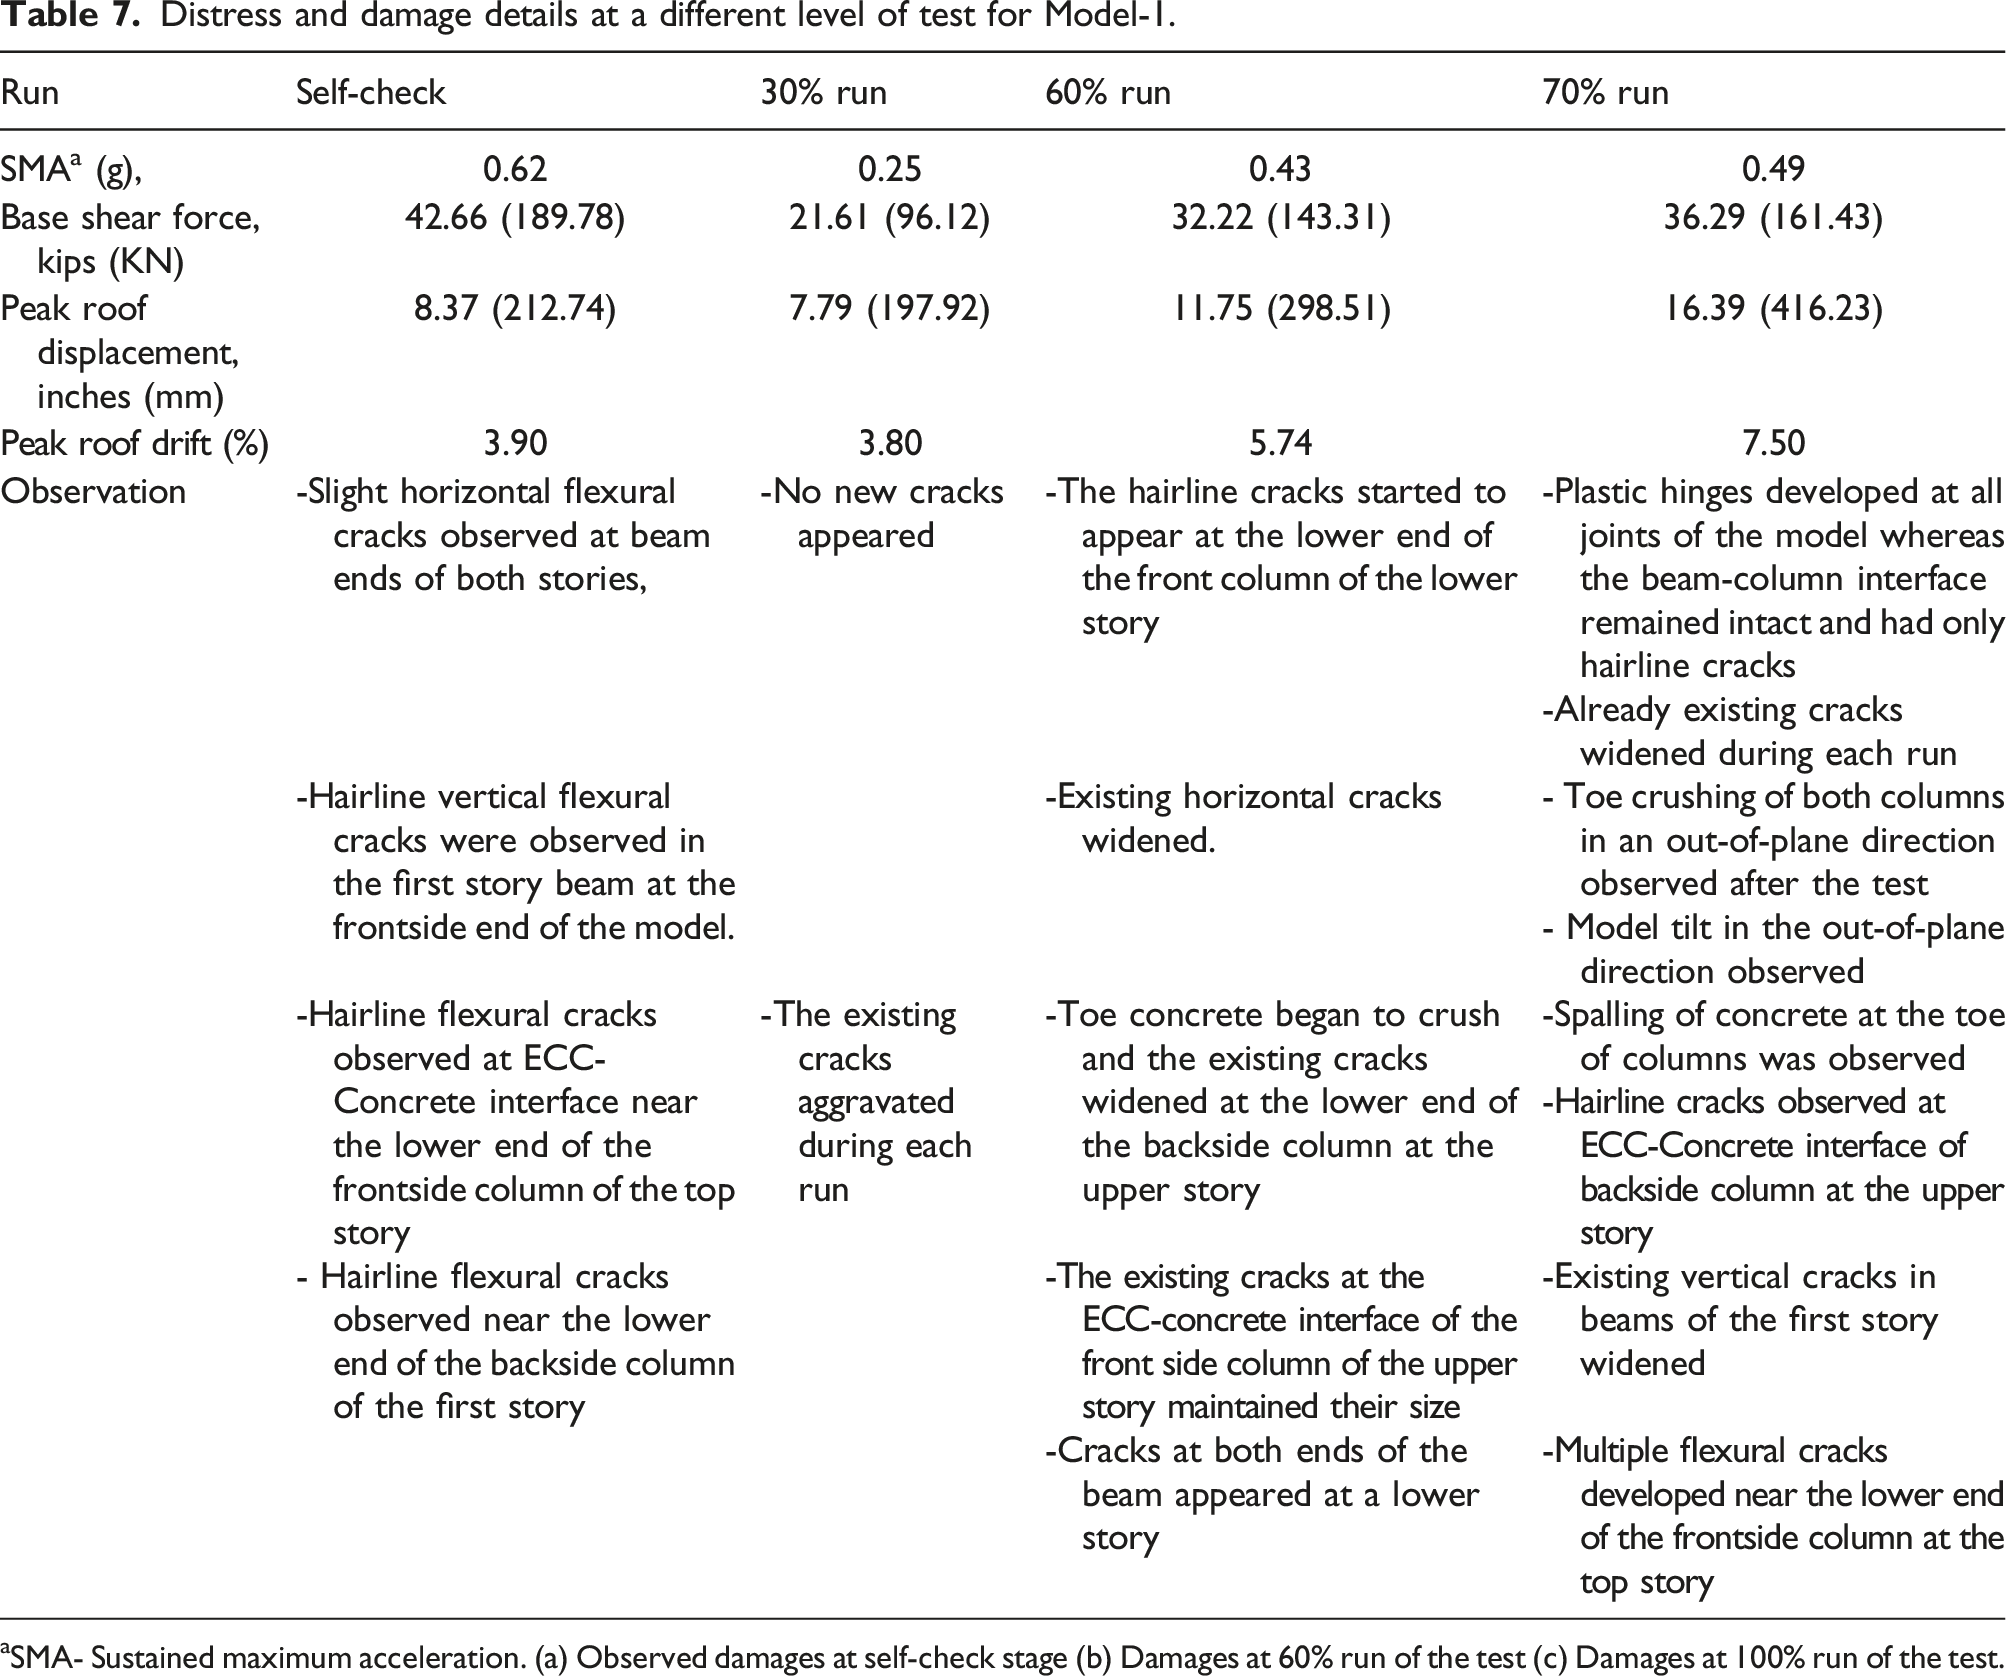
The shake table testing begins with a self-check, in which the table adjusts itself to the input excitation time history. Throughout the self-check, model-1 was excited to Sustainable maximum acceleration (SMA) of 0.62 g. The structure was laterally displaced 8.37 inches (212.74 mm), and roof drift was 3.90%. Through this run, the specimen experienced horizontal flexural cracks at all the beam/column members, and minor flexural cracks were seen in the front column of the upper story at the interface of ECC/concrete and the bottom end of the column (Figure 7). The damages observed during the self-check are shown in Figure 8(a). Table 6 reports the SMA observed for the frame Model one at various testing levels. The observed damages in the self-check aggravated during subsequent runs. At a run of 60% (corresponding to 103% of the original Northridge Earthquake), the model was excited at SMA of 0.43 g, which laterally displaced the structure 32.22 inches(143.31 mm), and the peak story drift observed was 5.74%. For the duration of this run, the widening of the present cracks continued, and the toe crushing was observed at the base of the ground story column at the backside of the model. Horizontal flexural cracks were seen in the beam of the first story on both sides (Figure 8(b)). In the final run, the structure was excited to SMA of 0.49 g, at which plastic hinges were developed at all the joints near the beam-column interface, and existing cracks widened. Opening and closing horizontal flexural cracks at the interfaces of beam-column were distinctly visible at this stage, and toe crushing was also seen in columns. Column crushing was observed in the out-of-plane direction that caused tilting of the model to bring it to the verge of collapse. The concrete spalling at the column’s toe was also observed (Figure 8(c)). Hairline cracks were seen at the top story at the model’s backside at the ECC-Concrete interface. On the face side of the top story, multiple flexural cracks were formed at the bottom of the columns. The damages observed during the final run of Model-1 are shown in Figure 8 whereas Table 7 and 8 reports the detailed damage evaluation of the same during different excitations. Model-1 observed damages during different runs. (a). Self-Check 1 Observed Damages (b). Run 60% Observed Damages (c). Run 70% Observed Damages. Sustainable maximum acceleration at different test levels for Model-1. aSMA- Sustained maximum acceleration. Distress and damage details at a different level of test for Model-1. aSMA- Sustained maximum acceleration. (a) Observed damages at self-check stage (b) Damages at 60% run of the test (c) Damages at 100% run of the test. Sustainable maximum acceleration at different levels of test run for Model-2. aSMA-Sustainable Maximum Acceleration.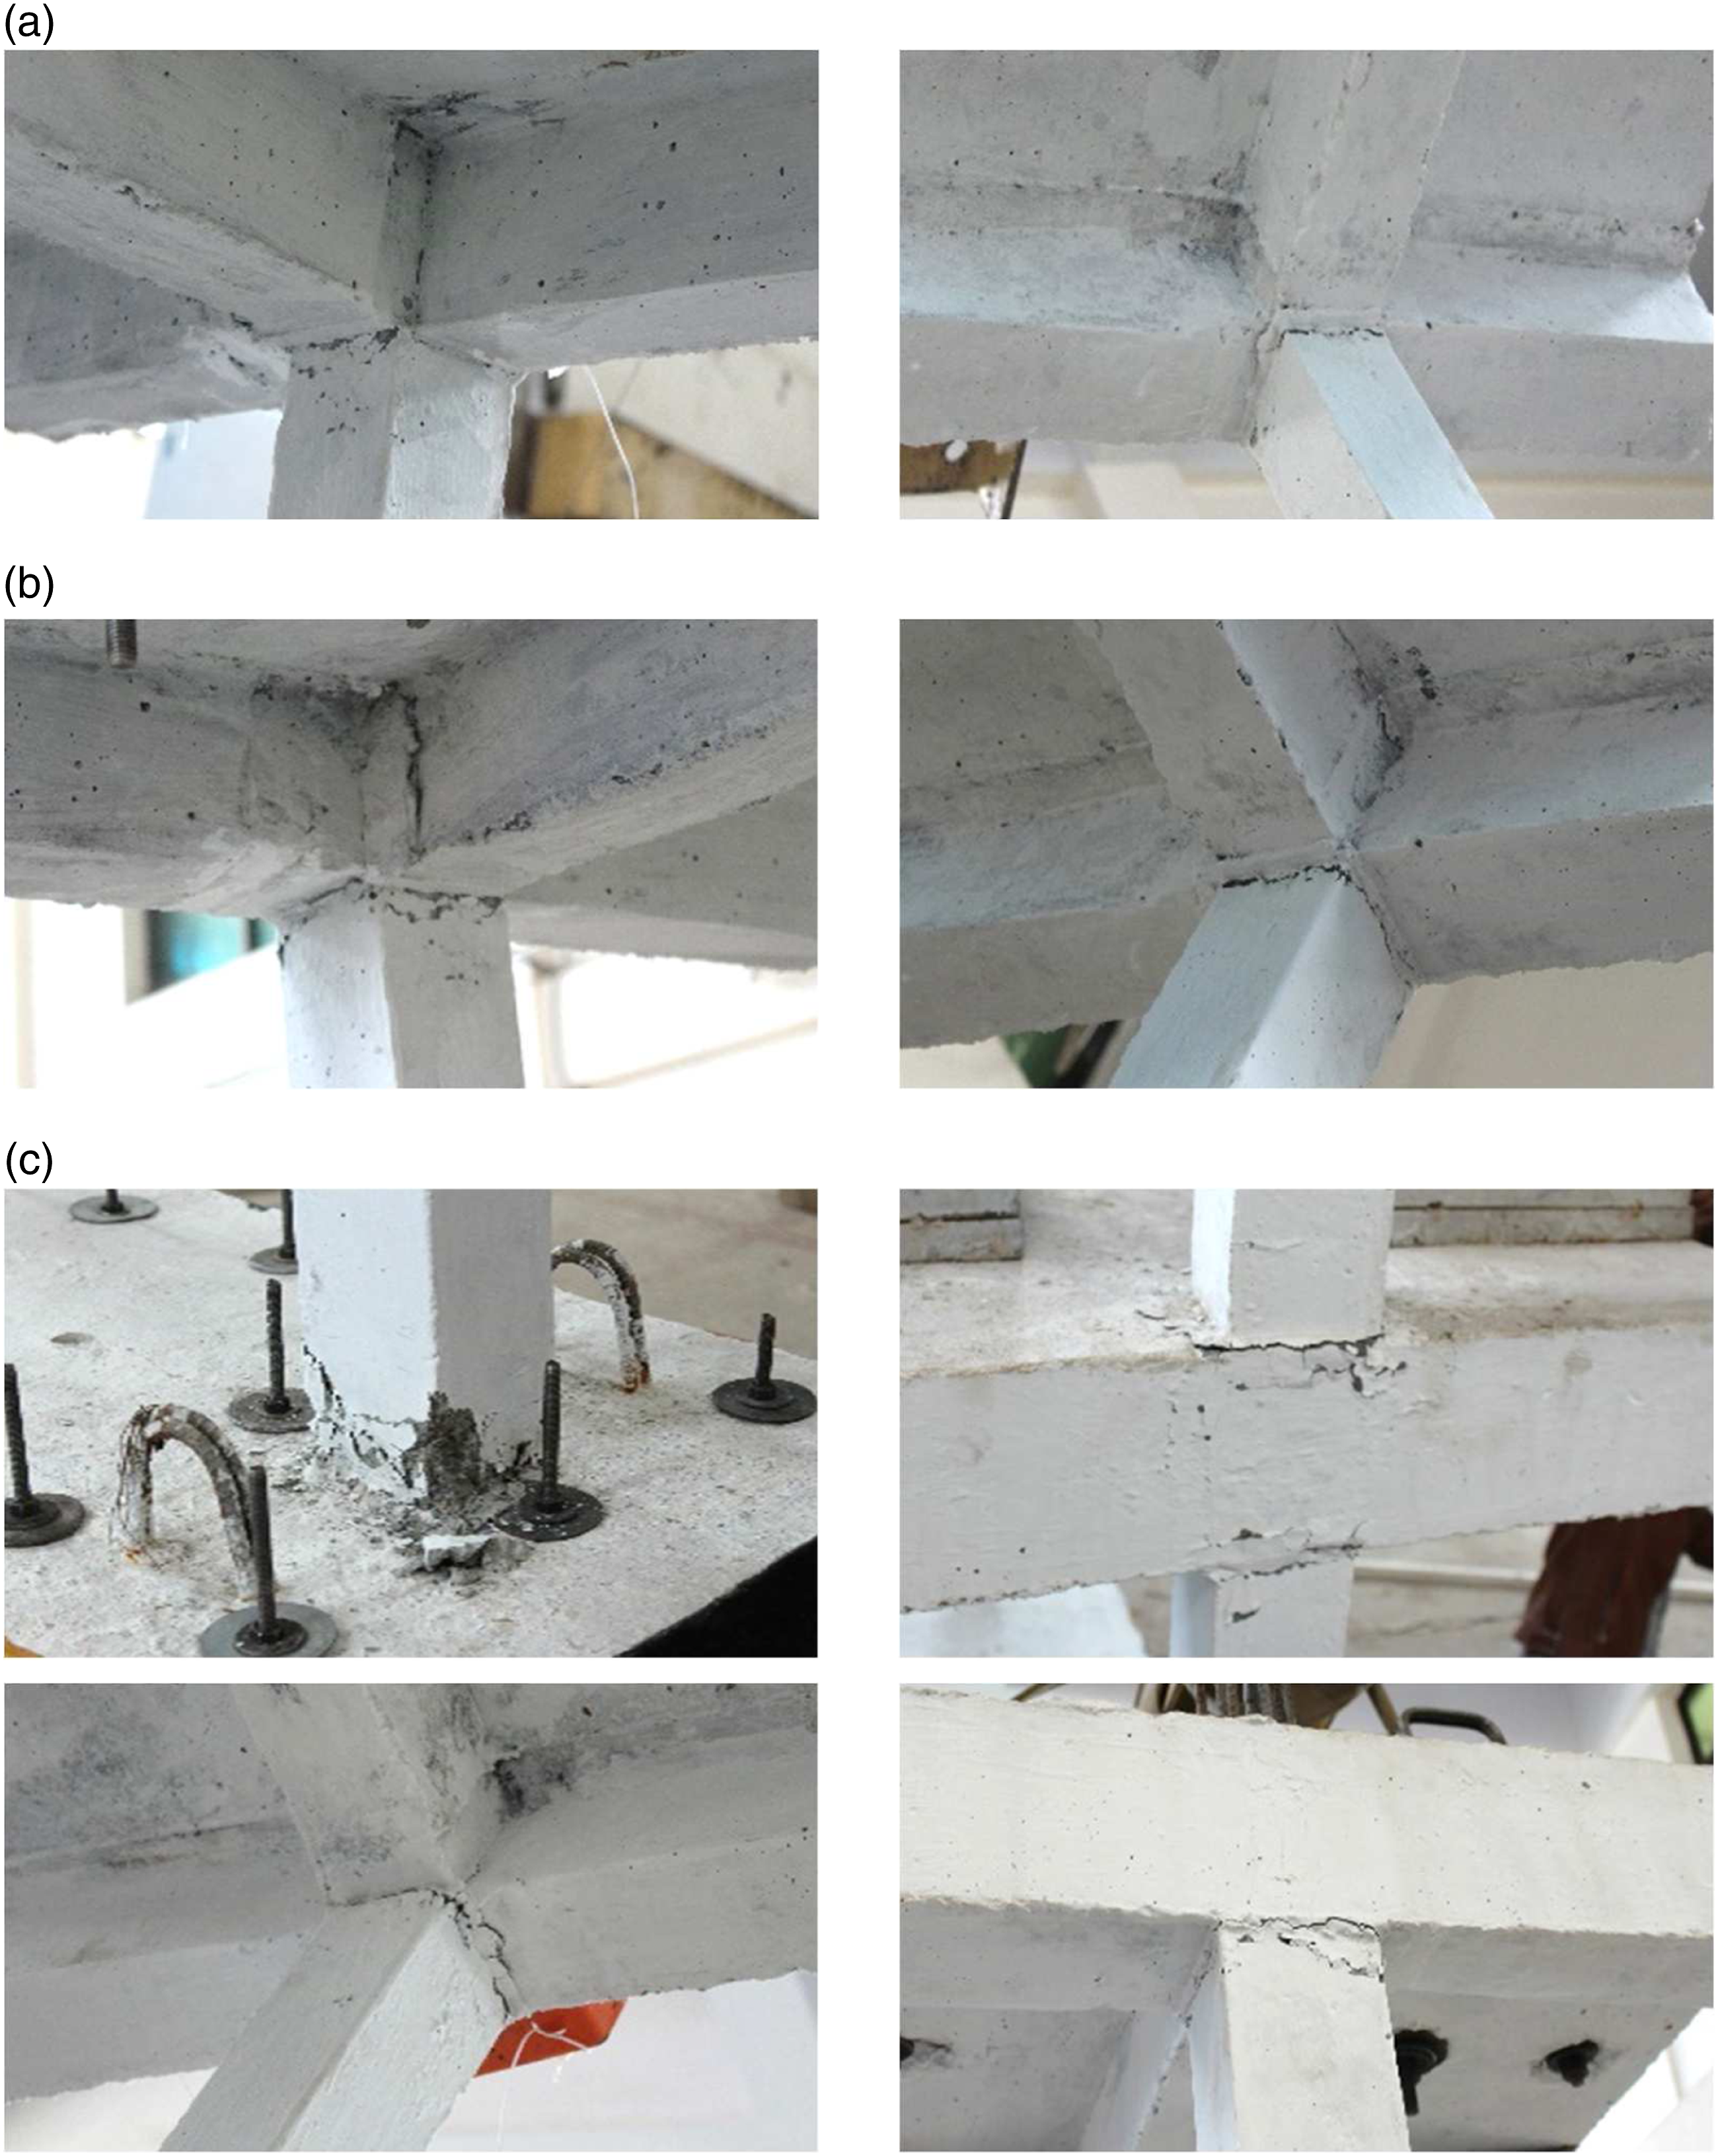
Model-2
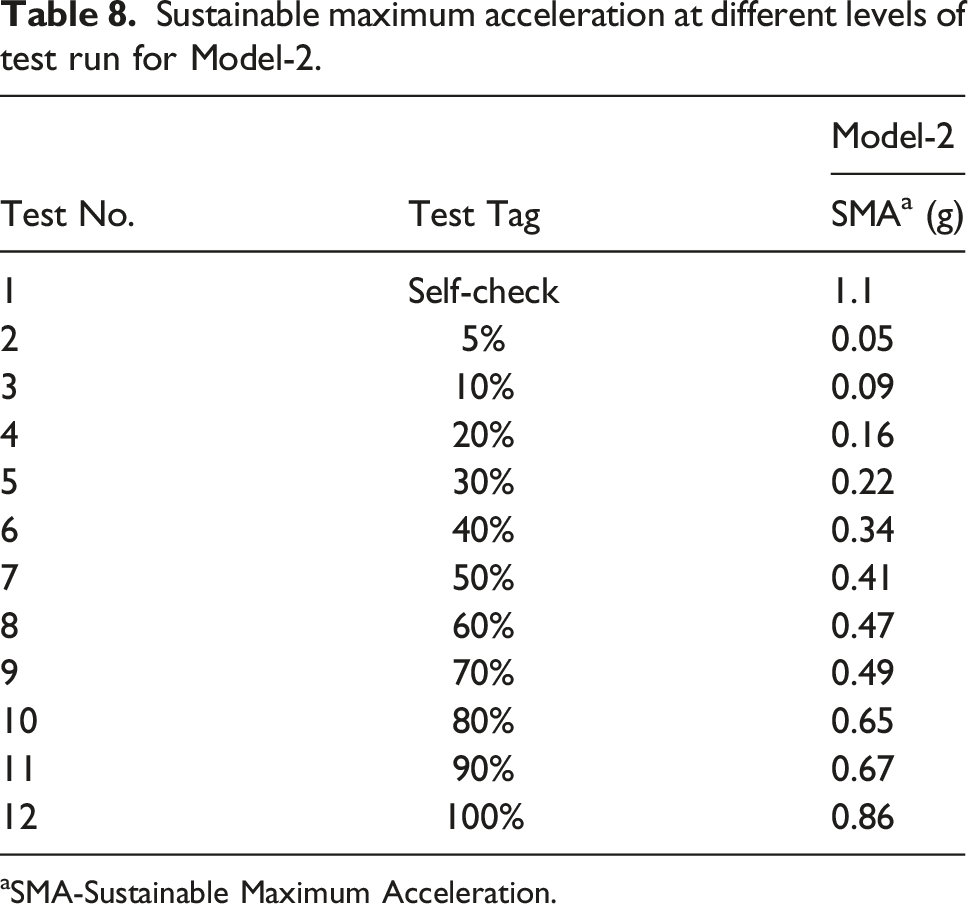
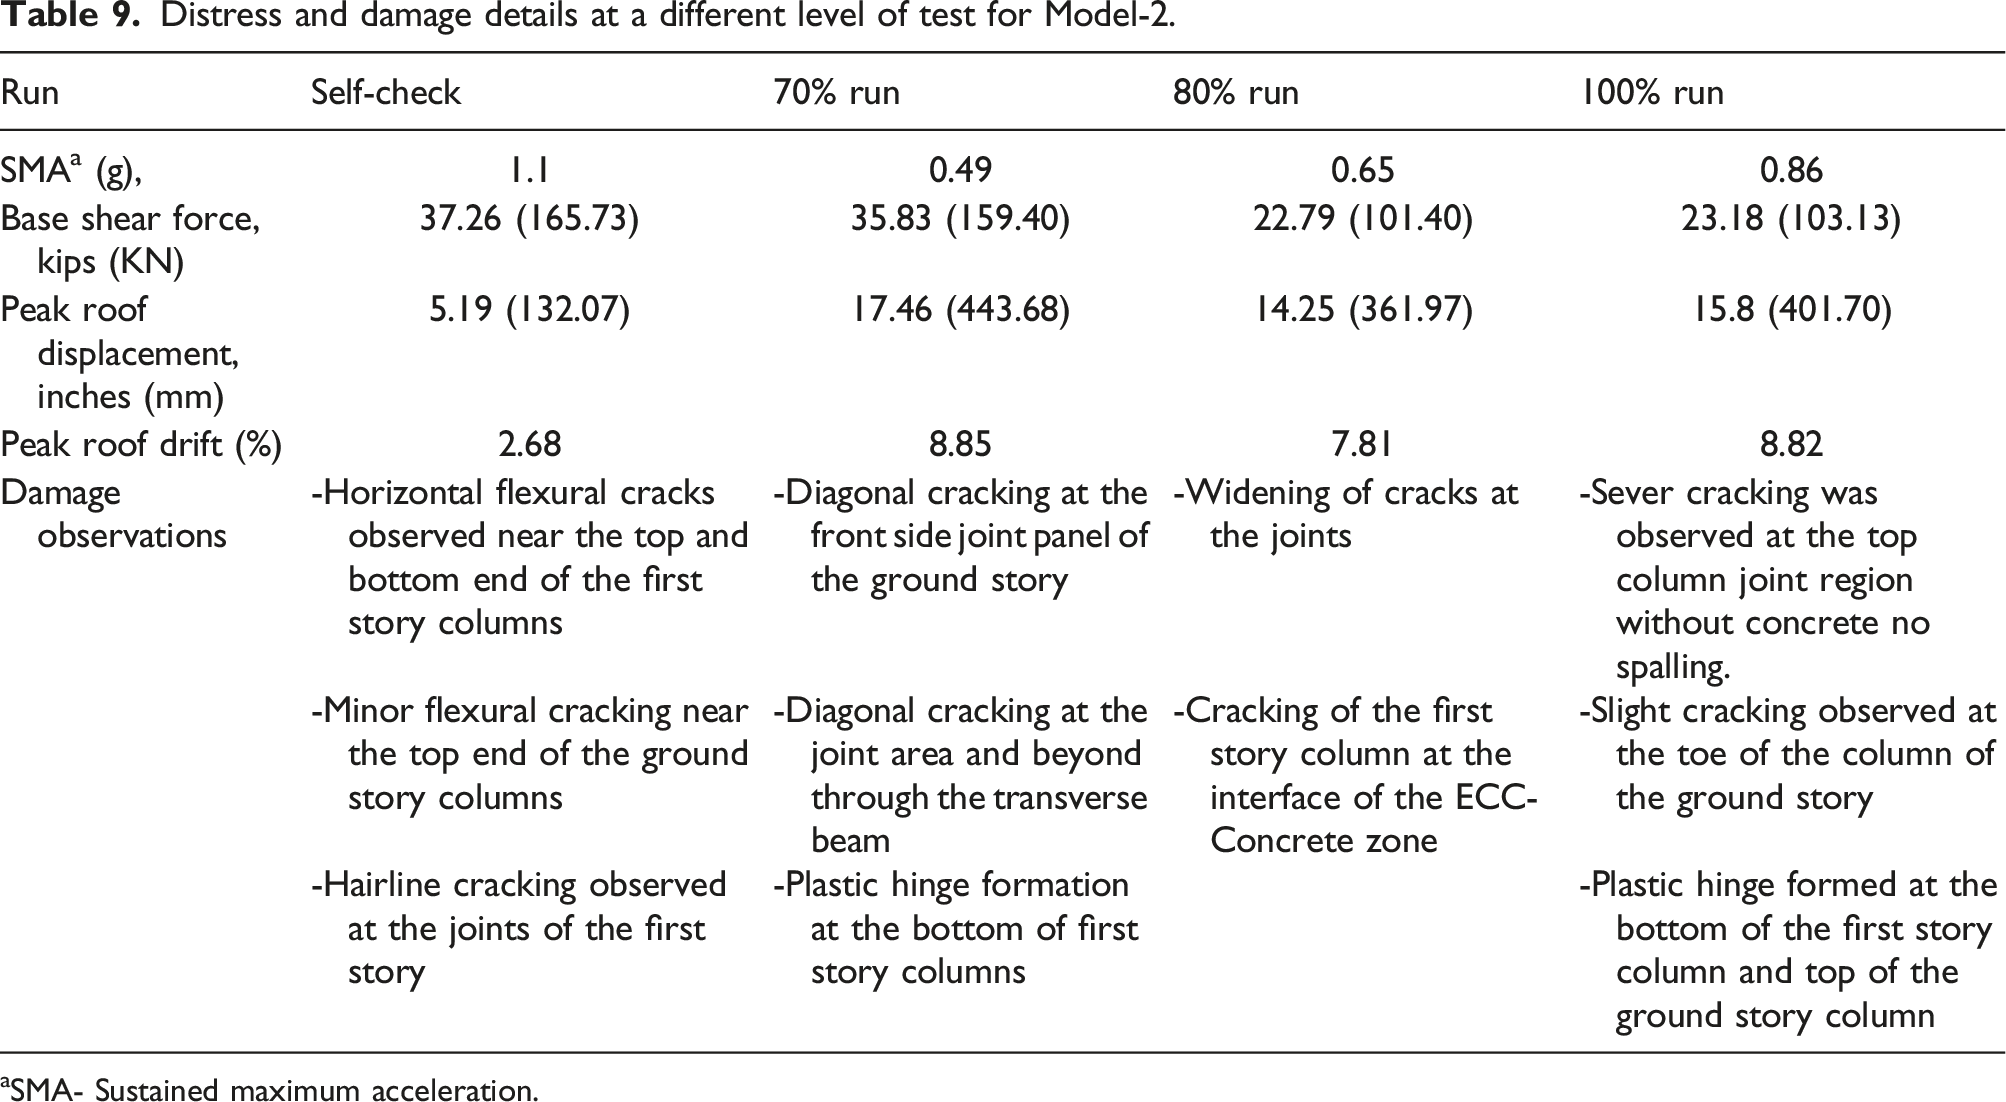
The model was first excited at SMA of 1.1 g as a self-check that caused a lateral displacement to 5.19 inches (132.07 mm) in the model and produced horizontal flexural cracks near the top and bottom of the first story columns. Similarly, minor flexural cracks were observed near the top of the ground story columns and hairline cracks in the first story’s joint panel, as shown in Figure 9(a). These cracks were similar in pattern to those observed in Model-1. At 60% run, when the structure was subjected to PGA of 0.51 g and lateral displacement of 9.62 inches (244.56 mm), diagonal cracking at the lower storey front beam-column panel was observed that extended to the transverse beams and developed plastic hinges at the base of the first story column (see Figure 9(b)). At 80% run, the model was excited to 0.89 g that caused widening of the existing joint cracks and produced new minor cracks in the top story column at the interface of the ECC-concrete zone. At the 100% run representing 172% of the original Northridge earthquake intensity, the test model was excited to a 1.05 g PGA producing a lateral displacement of 15.8 inches (401.70 mm) and several cracks near the top end of the lower story column. Extensive opening and closing of the horizontal flexural cracks at the interface of the beam and column were observed at this stage. Table 9 gives details of distress and structural damages at a different test run level for Model 2. It is worth mentioning that, unlike Model 1, no tilt of Model 2 in the out-of-plane direction was observed after the dynamic testing. Pictures of structural damages of Model two at different stages of testing. (a) Observed damages at self-check stage (b) Damages at 60% run of the test (c) Damages at 100% run of the test. Distress and damage details at a different level of test for Model-2. aSMA- Sustained maximum acceleration.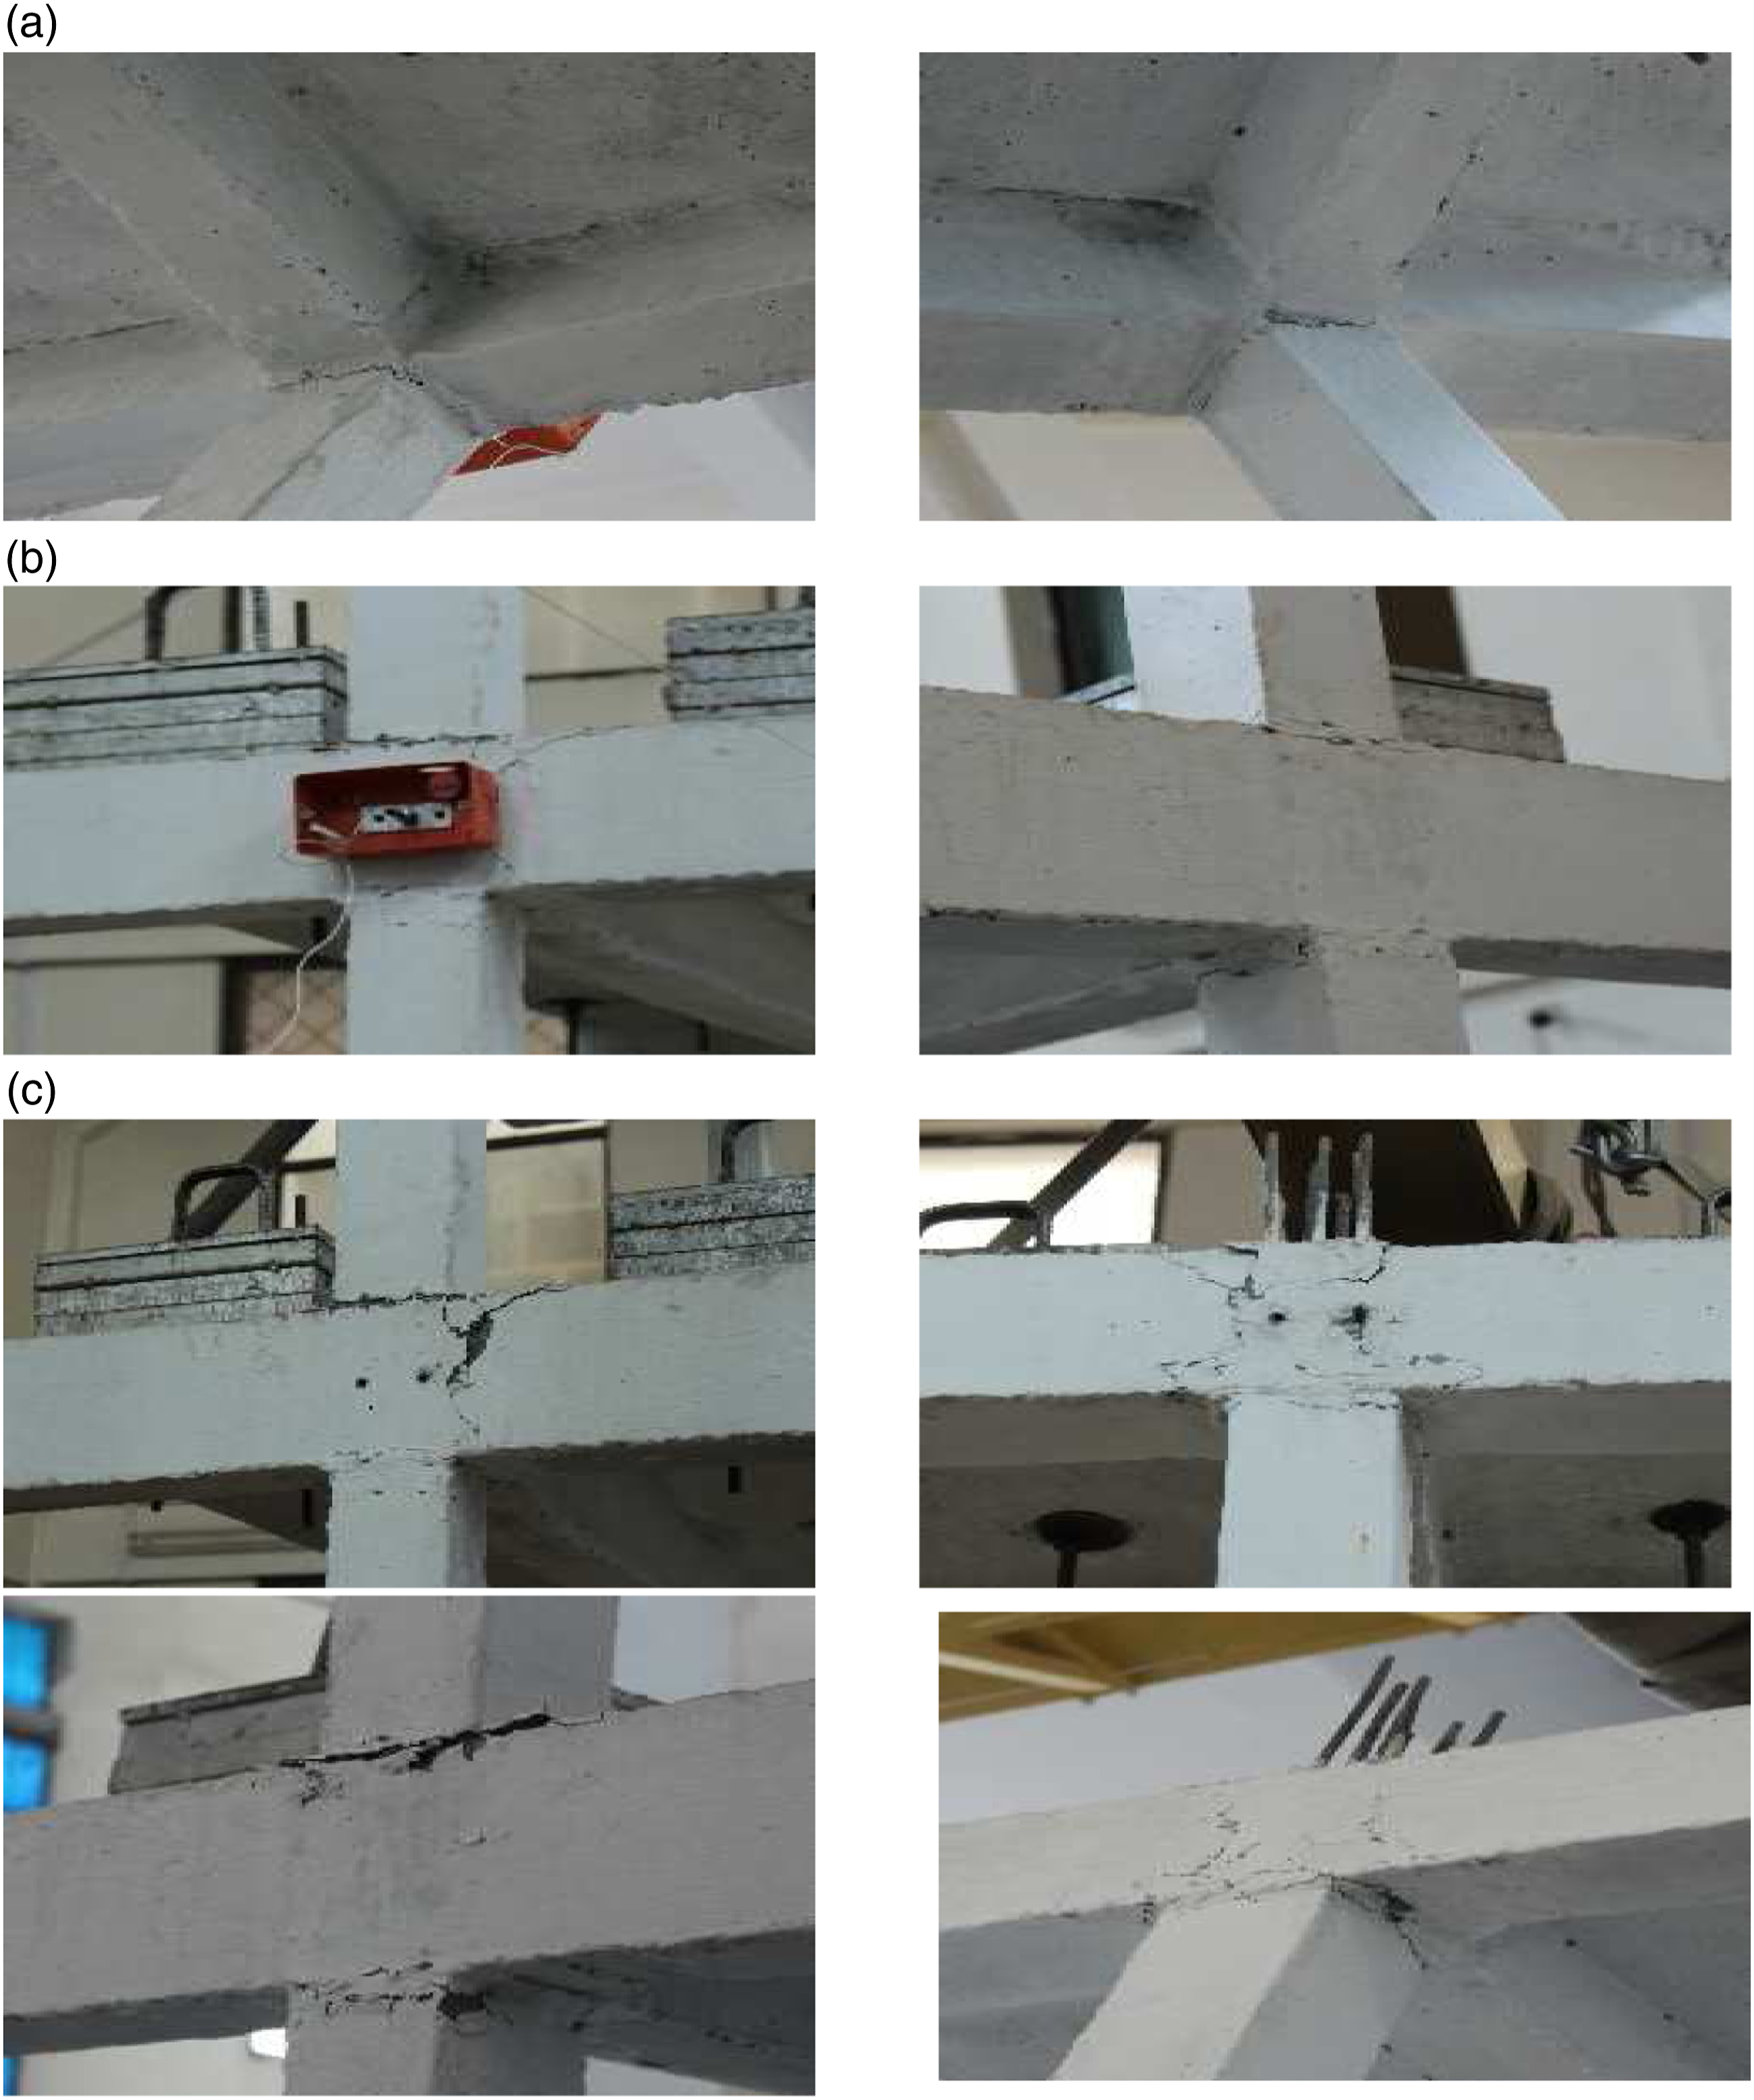
Seismic performance assessment of RC-ECC frames
Lateral force-deformation curves for prototype frames
The LFDCs for prototype frames one and two were constructed from the experimental data of their respective models. The data received from the testing of models was first converted to the respective prototype data by using scaling factors (SLs). The maximum roof displacement for each run of the test was calculated from the test data, using the full height of the model, and it was normalized to calculate the resultant roof drift. The acceleration data of each floor given by the test was multiplied with the floor masses (that included additional applied load for satisfying the similitude requirements, ½ mass of column below and above the floor, and self-weight of structural members) to calculate inertial forces for each floor. The inertial forces were summed up for each run to get the base shear force. The identified maximum roof displacement and maximum base shear force from each run were used to construct LFDCs shown in Figures 10(a) and 10(b). LFDCs for RC-ECC prototype frames. (a) LFDC for Prototype Frame -1 (b) LFDC for Prototype Frame -2.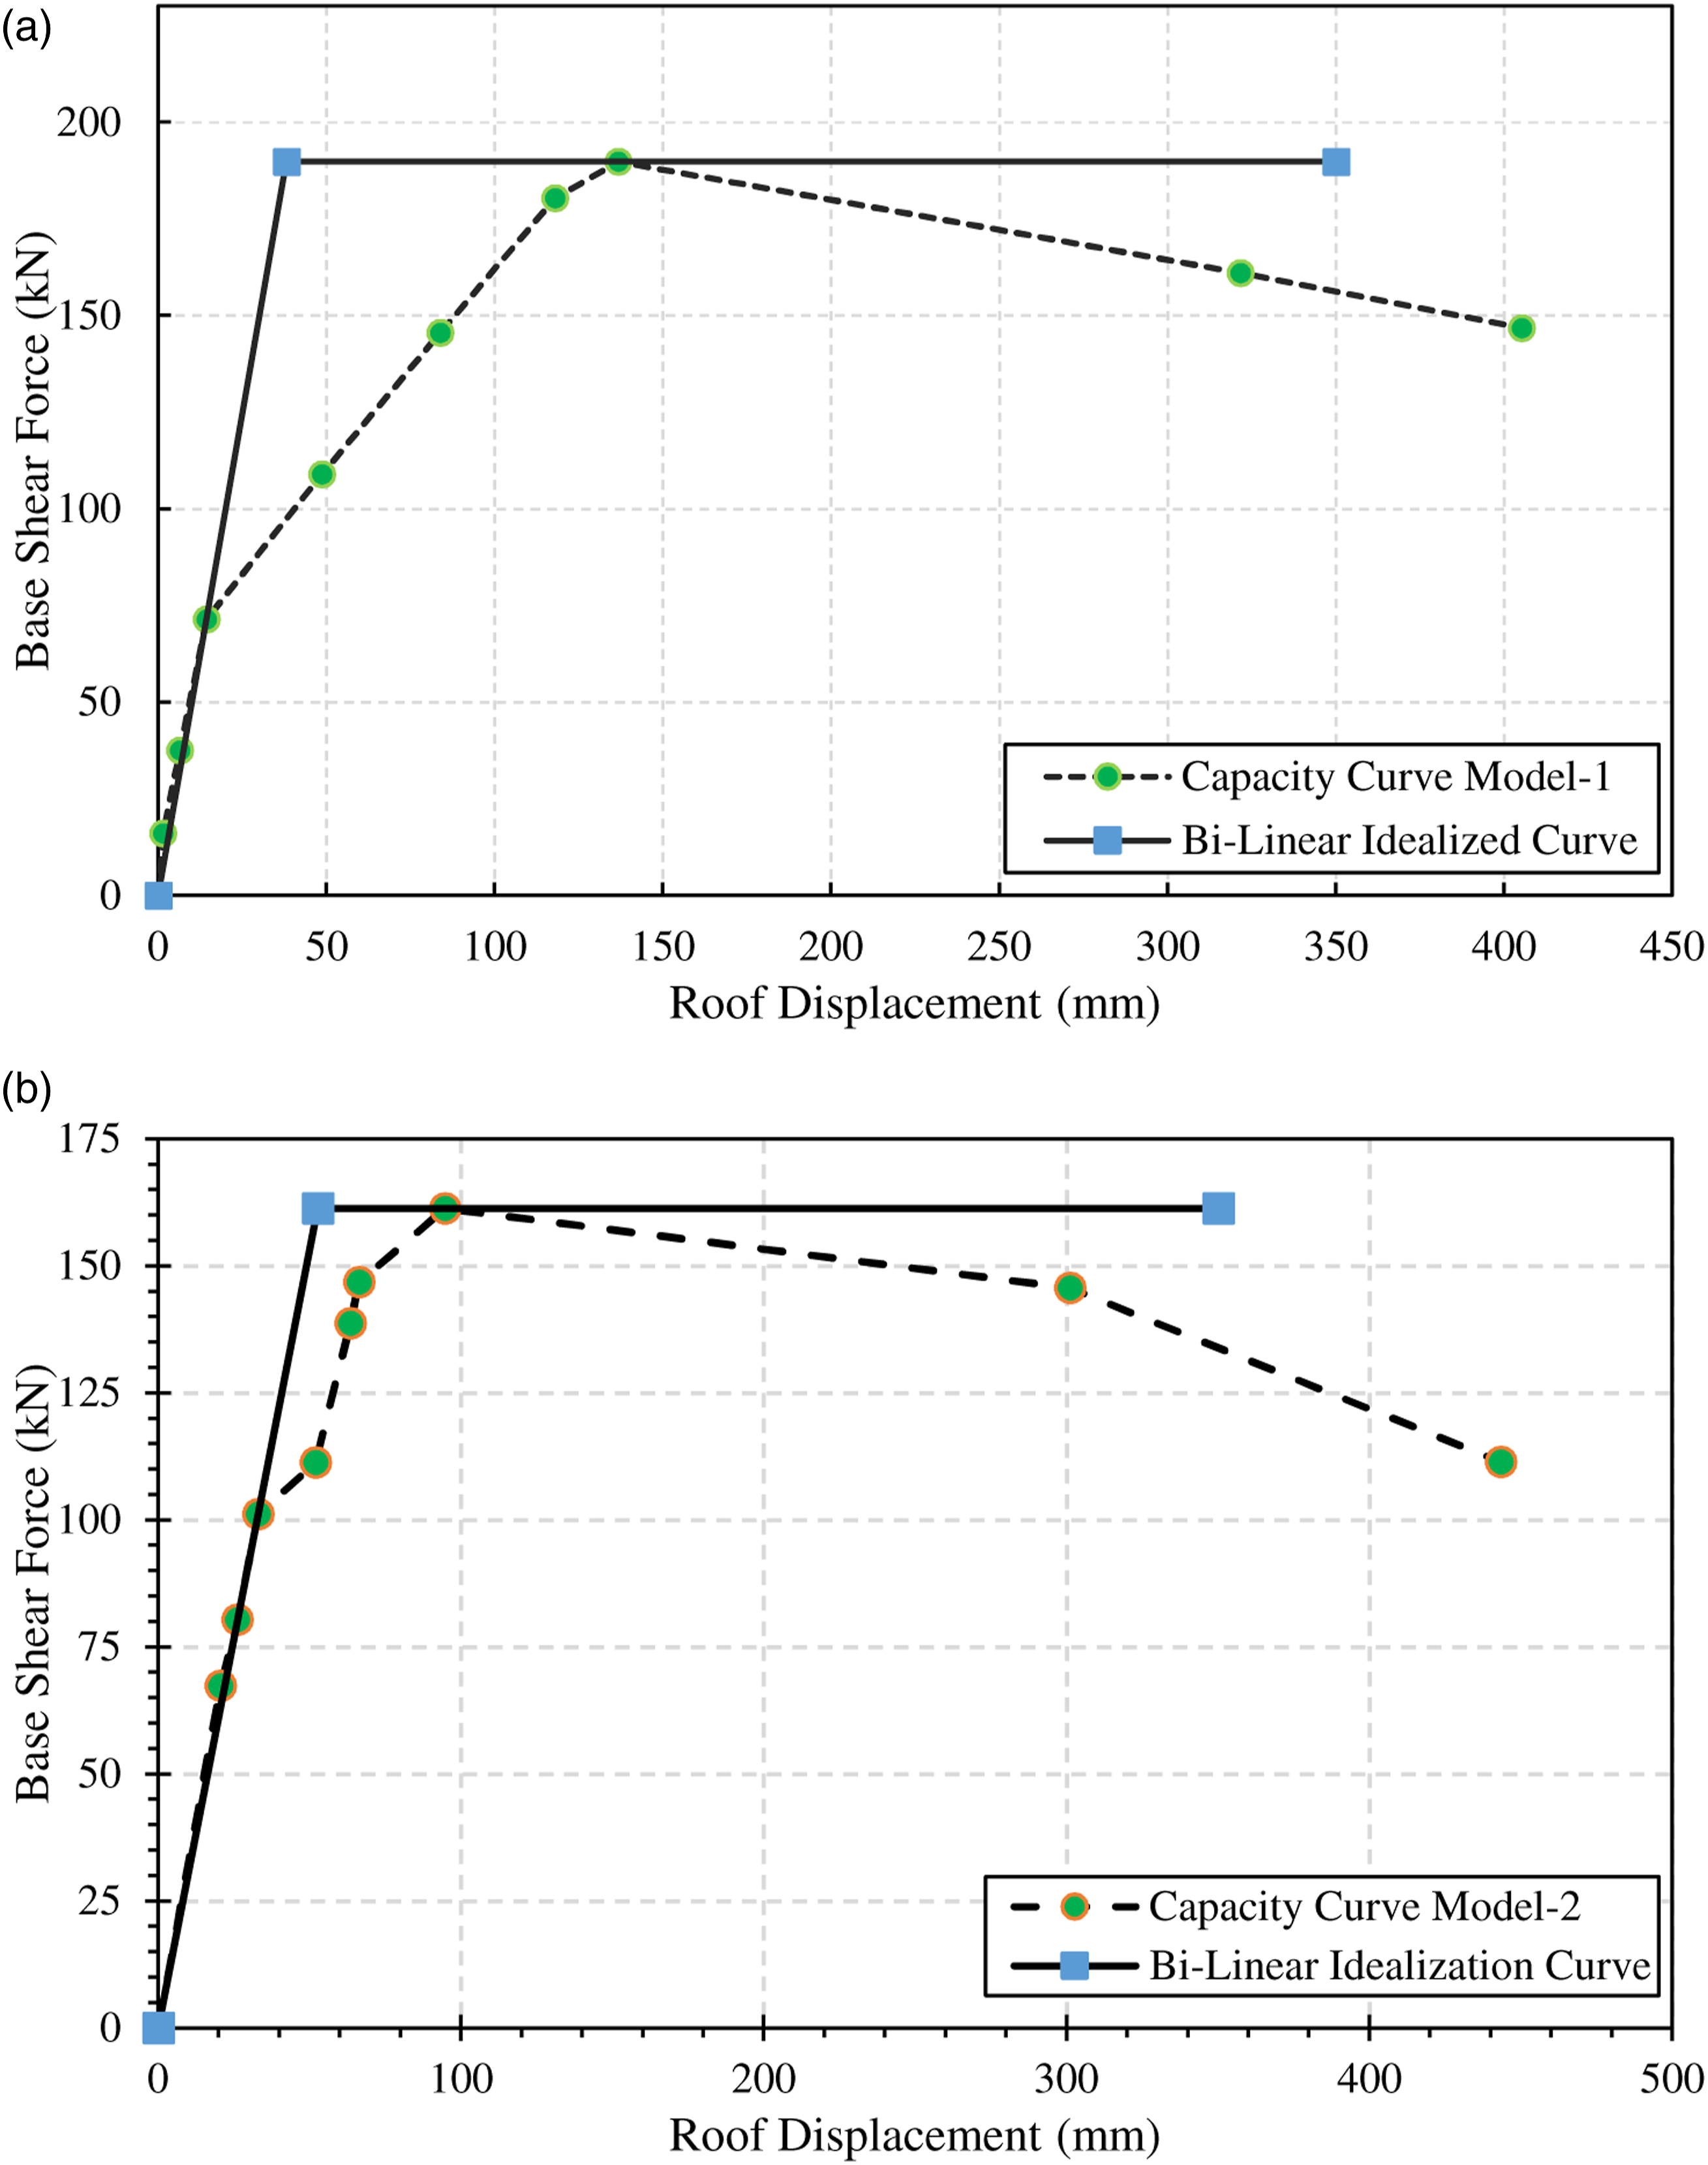
To compute the seismic response parameters and their relative comparison, the first step was to perform the bilinearization of the LFDCs shown in Figures 10(a) and 10(b), using FEMA P695. The ultimate displacement response was obtained from the test data. To calculate the idealized yield strength and yield displacement, several iterative calculations were performed to balance out the area below the LFDC to that of the idealized elastoplastic capacity curve of the experimental force-displacement curve.
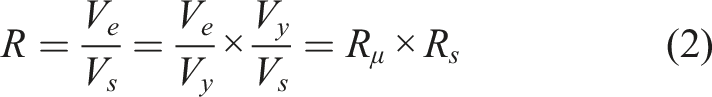
The seismic response modification factor


Comparison of seismic response parameters for prototype 1 and 2.

Conclusions
The following conclusions can be drawn from the experimental study presented herein: 1. Due to lack of confining ties in Prototype Frame −2, there was not a considerable increase in the time-period and elastic damping ratios of the structure as compared to Prototype Frame-1, but the structure without confining ties performed well under higher seismic loads and provided good confinement due to fibres matrix in the ECC Mix. 2. A slight decrease (15%) in overstrength factor (Rs) was observed for Prototype Frame-2, which is attributed to the lack of confining ties in the joint of the structure. However, the overall performance of Prototype Frame −2 was satisfactory due to the excellent confining effect of PVA fibres in ECC matrix hence it is believed that ECC can conveniently replace confining ties in the joint. 3. The elimination of shear reinforcement from the ECC beam-column joints of a single bay two-story frame results in a 38% and 27% decrease in yield stiffness and displacement ductility of the structure, respectively. 4. The elimination of shear reinforcement from the ECC beam-column joints of a single bay two-story frame cause a marginal decrease of 9% in the R-factor compared to Prototype Frame −1. 5. The use of ECC in beam-column joints of the single-bay two-story frame without shear ties in beam-column results in a 75% higher value of R-factor as compared to the ASCE/SEI Code specified value of five for IMRF structures. This increase is 92% for the frame having shear ties in the ECC in beam-column joints.
Footnotes
Declaration of conflicting interests
The author(s) declared no potential conflicts of interest with respect to the research, authorship, and/or publication of this article.
Funding
The author(s) disclosed receipt of the following financial support for the research, authorship, and/or publication of this article: The authors would like to express their gratitude to Higher Education Commission (HEC), Pakistan(Grand No:10745/KPK/NRPU/R&D/HEC/2017), for funding the project under the Research and Development Division National Research Program for Universities.