
Abstract
Wind attack angle increments are important inputs for the accurate and efficient wind tunnel test in analyzing the aerodynamic coefficients and Den Hartog galloping coefficients of iced cable structures. This research aims to investigate the interference of wind attack angle increments on the aerodynamic coefficients and Den Hartog galloping stability of iced hangers based on the aerodynamic coefficient theory and Den Hartog galloping theory, and by adopting the method of wind tunnel test. The analysis shows that considerable calculation error will be caused when directly using the conventional method during the processing and analysis of Den Hartog galloping for iced cable structures. The curve fitting of the aerodynamic coefficients of iced hangers in which their characteristics are better presented, for example, smooth-going characteristic, antisymmetric characteristics for lift coefficients, and symmetric characteristics for drag coefficients, can satisfy the accuracy requirement of the derivation of lift coefficients and can then be used to examine the Den Hartog galloping coefficients of iced hangers accurately. In cases where the wind attack angle increments are more than 3°, the wind attack angle that corresponds to the minimum value of the Den Hartog coefficients shows an offset. Meanwhile, distortions occur when determining the range of wind attack angles of Den Hartog galloping, and thus quantitative analysis cannot be conducted. These cases are only applicable to a preliminary study. The precision of the Den Hartog coefficients, which is solved in cases where the wind attack angle increments are not more than 3°, can meet the requirements for the Den Hartog galloping analysis. Results of this study can provide a reference for research on the galloping of iced hangers using the wind tunnel test.
Keywords
Introduction
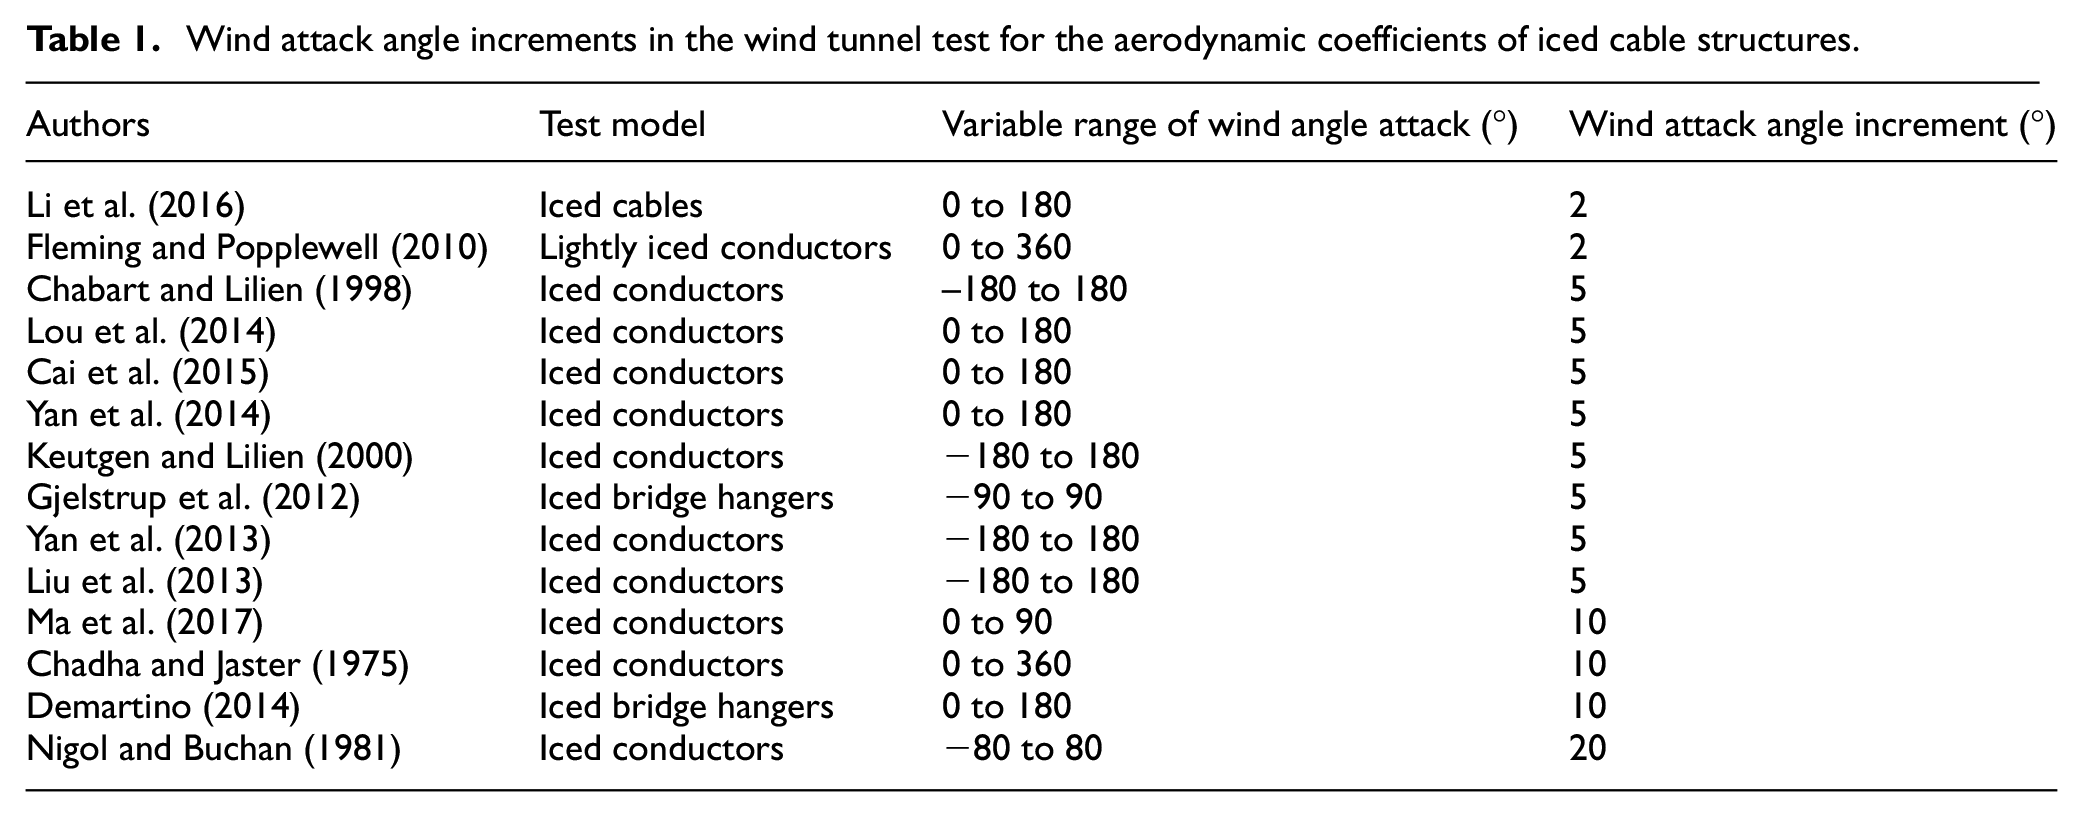
The wind tunnel test is the primary measurement tool used in the field of wind engineering research and it plays a crucial role in structural wind engineering (An et al., 2016; Chabart and Lilien, 1998; Fleming and Popplewell, 2010; Guo et al., 2017; Hu et al., 2015; Keutgen and Lilien, 2000; Li et al., 2017; Loredo-Souza and Davenport, 2002). It has been found in the literature that wind attack angle increments may directly influence the accuracy of the test data in the wind tunnel tests of iced cable structures. However, previous studies have not defined the specific wind attack angle increments, and different scholars have adopted nonidentical values. As shown in Table 1, different wind attack angle increments, such as 2° (Fleming and Popplewell, 2010; Li et al., 2016), 5° (Cai et al., 2015; Chabart and Lilien, 1998; Gjelstrup et al., 2012; Keutgen and Lilien, 2000; Liu et al., 2013; Lou et al., 2014; Yan et al., 2013, 2014), 10° (Chadha and Jaster, 1975; Demartino, 2014; Ma et al., 2017), and 20° (Nigol and Buchan, 1981), have been adopted in existing research while performing wind tunnel tests for the aerodynamic coefficients of iced cable structures. Therefore, selecting appropriate wind attack angle increments that can ensure the accuracy of the test data, shorten the period of experiment, and reduce the expense of the experiment is a problem that should be addressed immediately.
Wind attack angle increments in the wind tunnel test for the aerodynamic coefficients of iced cable structures.
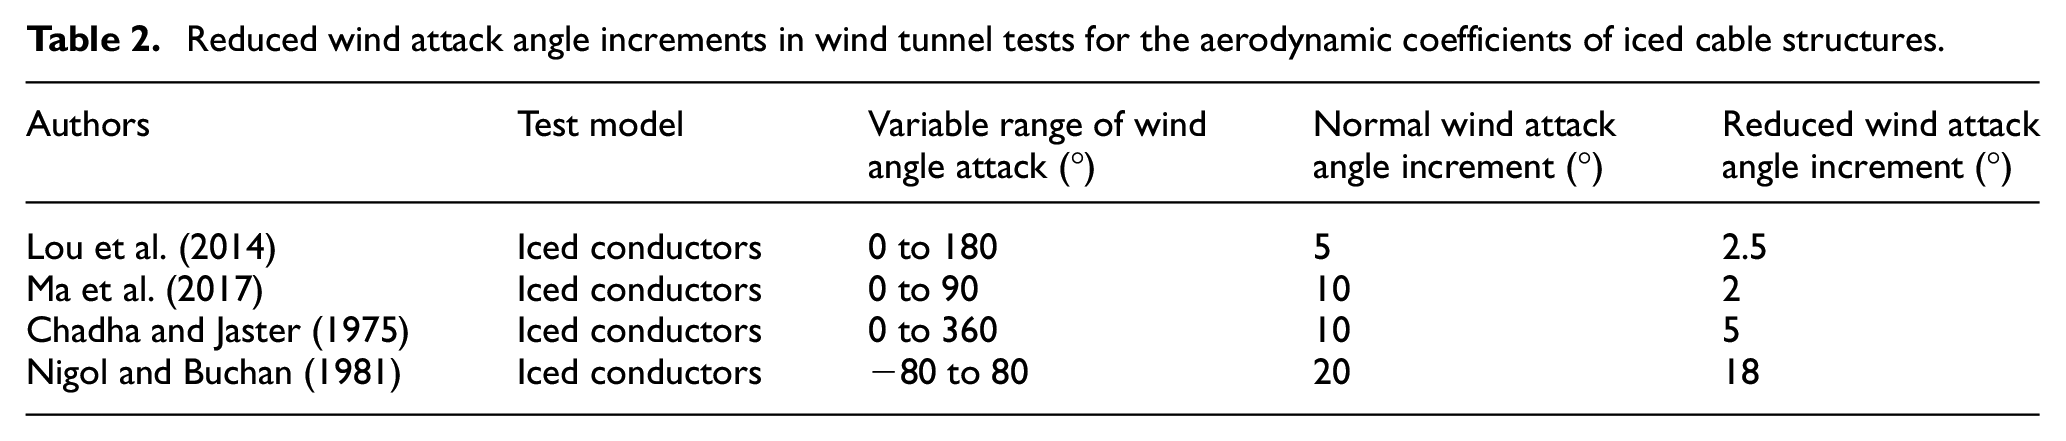
Results of Den Hartog galloping obtained are unavoidably affected by uncertainties due to the measures and the calculation of the force coefficient derivative (Pagnini et al., 2017). To reduce measurement errors caused by the inappropriate selection of wind attack angle increments during the analysis of the Den Hartog galloping stability of iced hangers based on the aerodynamic coefficient theory and Den Hartog galloping theory, previous methods are generally used to reduce the wind attack angle increments in possible galloping ranges of wind attack angles (Chadha and Jaster, 1975; Lou et al., 2014; Ma et al., 2017; Nigol and Buchan, 1981). However, these methods require first determining possible galloping ranges of wind attack angles according to the productions investigated in other studies. Otherwise, another test with smaller increments of wind attack angles within possible galloping ranges of wind attack angles should be conducted. However, reduced wind attack angle increments within possible galloping ranges of wind attack angles differ among scholars. Several test research programs used in previous studies, such as the reduced increments of 2° adopted by Ma et al. (2017) and 5° adopted by Chadha and Jaster (1975), are listed in Table 2. However, the aforementioned authors also adopted normal wind attack angle increments of 10°.
Reduced wind attack angle increments in wind tunnel tests for the aerodynamic coefficients of iced cable structures.
Reduced wind attack angle increments within possible galloping ranges of wind attack angles can reduce measurement errors. However, different scholars have adopted various aerodynamic data processing methods. Although Ng et al. (2005) and Ouyang (2011) independently analyzed the aerodynamic data processing of square cylinders and conductors based on wind attack angle increments of 1°, the former was analyzed through normal polynomial fitting curve estimation, whereas the latter was analyzed directly. Keutgen and Lilien (2000) and Yan et al. (2013) separately analyzed the aerodynamic data processing of iced conductors based on wind attack angle increments of 5° through trigonometric function and polynomial fitting curve estimation. However, no subsequent analysis of the fitting equations was conducted. Fleming and Popplewell (2010) indicated that a reasonable approximation curve fitting could be achieved by considering intervals of 30° in analyzing the aerodynamic coefficients and Den Hartog coefficients of iced conductors. However, the analysis was performed based solely on wind attack angle increments of 2°. Moreover, no analysis was conducted to determine whether the conclusion remains applicable under the influence of other wind attack angle increments. Therefore, the analysis of aerodynamic coefficients is a problem that should be solved immediately.
Different scholars have adopted various wind attack angle increments, and different aerodynamic data processing methods in wind tunnel tests for the aerodynamic coefficients of iced cable structures. The selection of appropriate wind attack angle increments and a comparatively good method for aerodynamic data processing is an issue that should be addressed. In this study, rigid segment models of iced hangers were built. This research aims to investigate the interference of wind attack angle increments on the aerodynamic coefficients and Den Hartog galloping stability of iced hangers by adopting the wind tunnel test. In addition, the curve fitting method for analyzing aerodynamic data was applied under different wind attack angle increments. The results of this study can provide a reference for research on the galloping of iced hangers using the wind tunnel test.
Basic theories of structure galloping
Aerodynamic coefficient theory
The aerodynamic coefficients of the test model can be expressed according to the wind tunnel tests as follows (Nigol and Buchan, 1981)
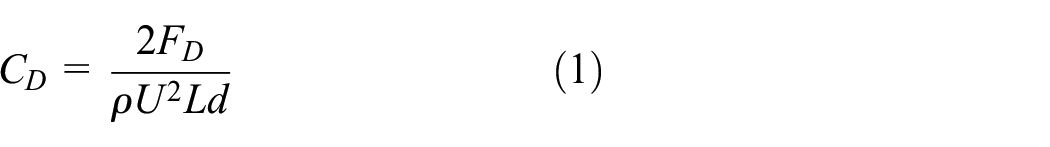

where CD and CL denote the drag force coefficient and the lift force coefficient, respectively. FD and FL represent the drag force and the lift force, respectively.
Den Hartog galloping theory
The Den Hartog criterion is important for determining the occurrence of galloping in a structure. The concept of galloping coefficients is expressed as follows (Den Hartog, 1932)
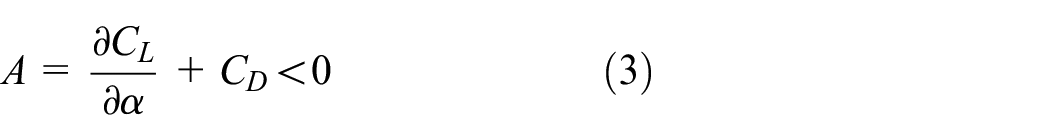
where the Den Hartog coefficient A is equal to the sum of the drag coefficient and the derivative of the lift coefficient of the wind attack angle.
Experimental setup
Tests were conducted in the laboratory of atmospheric environment and wind engineering in the Tianjin Research Institute for Water Transport Engineering, M.O.T. The tunnel is an open-circuit wind tunnel with a test section. It is 4.4 m wide, 2.5 m high, and 15 m long. The model and supporting system were placed in the test section, in which the velocity profile was uniform within ±0.5% and the turbulence intensity was approximately 0.84% at 10 m/s.
The size of the hanger model was derived from a suspension bridge with articulated hangers across the Yangtze River in China. The distance between hangers is 400 mm (as shown in Figure 1), and the diameter of a hanger is 74 mm. A hanger consists of 106–Φ5.2 parallel wires made of high tensile steel and completed with a polyethylene (PE) outer sheath (as illustrated in Figure 1(b)).

Articulated hangers of one suspension bridge across the Yangtze River in China: (a) vertical section of articulated hangers (unit: mm) and (b) cross section of articulated hangers (unit: mm).
Two identical specimens were made of lightly cured composite resins, and a three-dimensional (3D) printer was used to simulate the articulated hangers. The length of a specimen is 0.66 m, and the sling diameter was 0.074 m. As shown in Figure 2(a), the result of the climatic wind tunnel tests of Demartino et al. (2015) and Demartino and Ricciardelli (2015) shows that an evident stagnation line appears in iced hangers at low temperatures with rain and fog. Moreover, the icing thickness changes in relation to velocity and temperature. The simplified form of the iced hangers used in this study is shown in Figure 2(b), along with the interrelated sizes of specimens, such as 74 mm hanger diameter, 30 mm icing thickness, and 400 mm spacing between specimens.
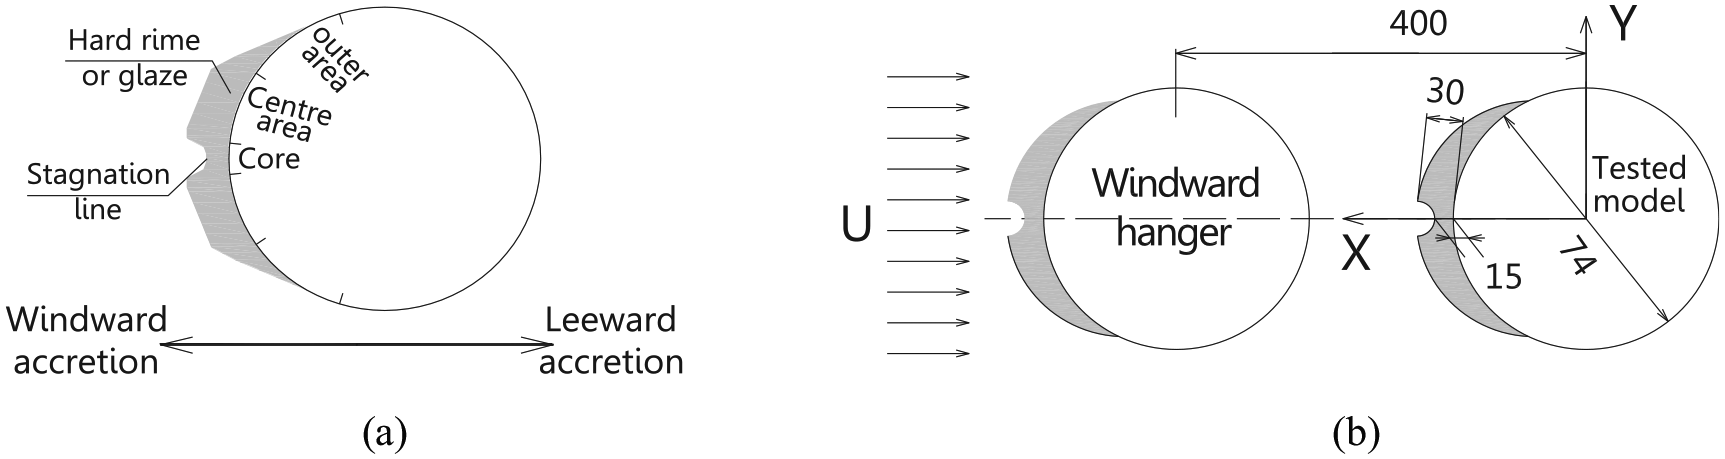
Cross section of iced hangers: (a) icy forms of hangers in Demartino et al. (2015) and Demartino and Ricciardelli (2015) and (b) simplified form and interrelated sizes of the iced hangers used in this study (unit: mm).
The aerodynamic characteristics of the tested model (Figure 3) were measured using a high-frequency force balance under a uniform flow with a test wind speed of 10 m/s (Yan et al., 2016). Six component strain gauge balances with a sampling rate of 1000 Hz and a sampling time of 30 s were used to measure the aerodynamic forces, that is, drags and lifts, on the tested model (Hu et al., 2015). Wind speed was measured using a Cobra Probe 308 with a sampling rate of 500 Hz and a sampling time of 30 s.

Test model setup in the wind tunnel.
A circular plate is hung over the model to reduce the effect of the upper end as shown in Figure 3. The feature dimensions of the end plate (Figure 3) are 10 times greater than those of the model cross section to avoid 3D effects at the model tip. The plate must be horizontally hung over the model and positioned close to the model tip.
In accordance with the Den Hartog galloping theory, the Den Hartog coefficients are possible to be negative only when the derivatives of the lift coefficients are negative. Therefore, in analyzing the aerodynamic characteristics of iced cable structures to evaluate Den Hartog galloping stability, the corresponding range of attack angles for the negative derivatives of the lift coefficients should be selected. In the test, the range of wind attack angles of 0°–20° is adopted after the preliminary experimental study. The forces acting on the tested model are shown in Figure 4.

Definition of parameters.
Results and analysis
Aerodynamic coefficient data of iced hangers and error analysis of the Den Hartog coefficients
The effect factors of Den Hartog galloping include uncertainties due to the measures and the calculation of the force coefficient derivative (Pagnini et al., 2017). The former source of uncertainties can be reduced by improving the instrument equipment and the quality of the test, and an authenticated wind tunnel with a cross-section of 4.4 m × 2.5 m and a free-stream turbulent intensity of less than 1% is adopted. The control accuracy is 0.01° for wind attack angle, and a circular plate is hung over the model to reduce the effect of the upper end. And high-precision instruments are used, for example, the precision of the wind speed measurement instrument is better than 1.0% and the accuracy of force balances is 10−15 N; however, the latter will impact on the results inevitably since the differences of the solution algorithm for the dispersion of the data lead to different results.
Formulas (1) to (3) were usually adopted to study the galloping of iced cable structures in the wind tunnel test for the aerodynamic characteristics measured using a high-frequency force balance (Li et al., 2016; Loredo-Souza and Davenport, 2001; Lou et al., 2013; Zhou et al., 2016). The drag force coefficients (CD), the lift force coefficients (CL), and Den Hartog coefficients are calculated using formulas (1) to (3) at different angles of attack ranging from 0° to 20° with a test wind speed of 10 m/s under a uniform flow. The results are presented in Figures 5 and 6.
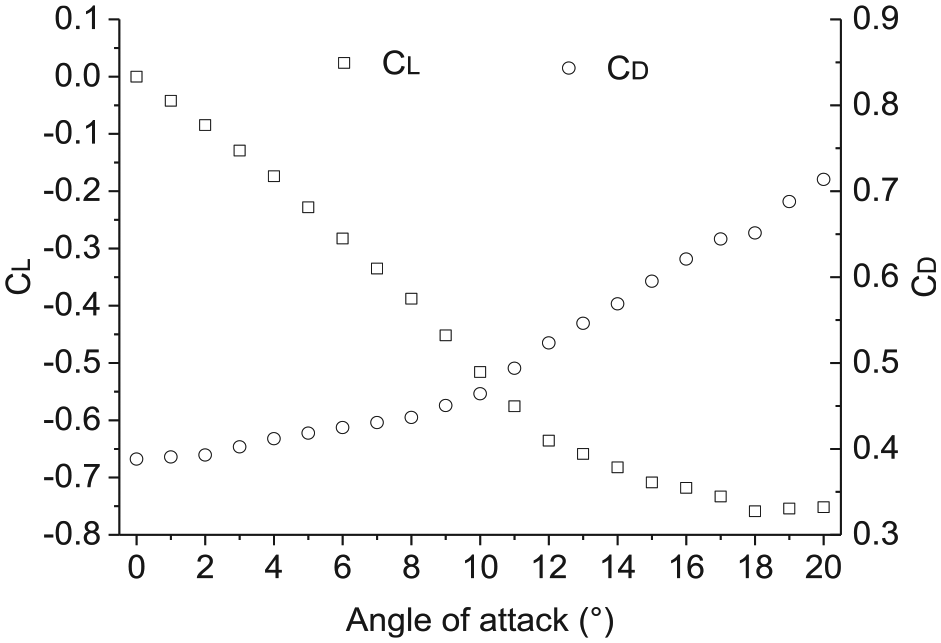
Aerodynamic coefficients of the tested model at angles of attack ranging from 0° to 20° with the test wind speed of 10 m/s.

Den Hartog coefficients of the tested model at angles of attack ranging from 0° to 20° with a test wind speed of 10 m/s under a uniform flow.
The figures obtained using equations (1) to (3) are frequently distorted because of the impacts of the data fluctuation of balances and the interval of attack angles. As shown in Figure 6, Den Hartog coefficients of the tested model initially decreased and then increased with an increment in wind attack angles at angles of attack ranging from 0° to 20° with a test wind speed of 10 m/s under a uniform flow. A trough appeared around the wind attack angle of 9°. The Den Hartog coefficients of the tested model were more than zero at the wind attack angles of 14° and 16°, but less than zero at a wind attack angle of 15°. The distorted Den Hartog coefficients of the tested model can be determined because of the phenomenon of alternately positive and negative variations within an attack angle of 2°.
To further illustrate the situation, data regarding crescent-shaped iced cables from Li et al. (2016) are presented in Figure 7. Wind attack angles of 34° and 180° were determined as galloping regions, but the wind attack angle of 55° was excluded when the Den Hartog coefficients of the tested model were less than zero (Li et al., 2016). That is, the Den Hartog coefficients of the tested model at a wind attack angle of 55° were determined as error values. This result further proves that a large error of the Den Hartog coefficients may occur directly when formulas (1) to (3) are used.

Data regarding the crescent-shaped iced cables in Li et al. (2016).
In sum, considerable calculation error will be caused when directly using the conventional method during the processing and analysis of Den Hartog galloping, and the data of the drag force coefficients and the lift force coefficients must be processed prior to analysis of Den Hartog galloping.
Fitting curve of the aerodynamic coefficients of iced hangers at various wind attack angle increments
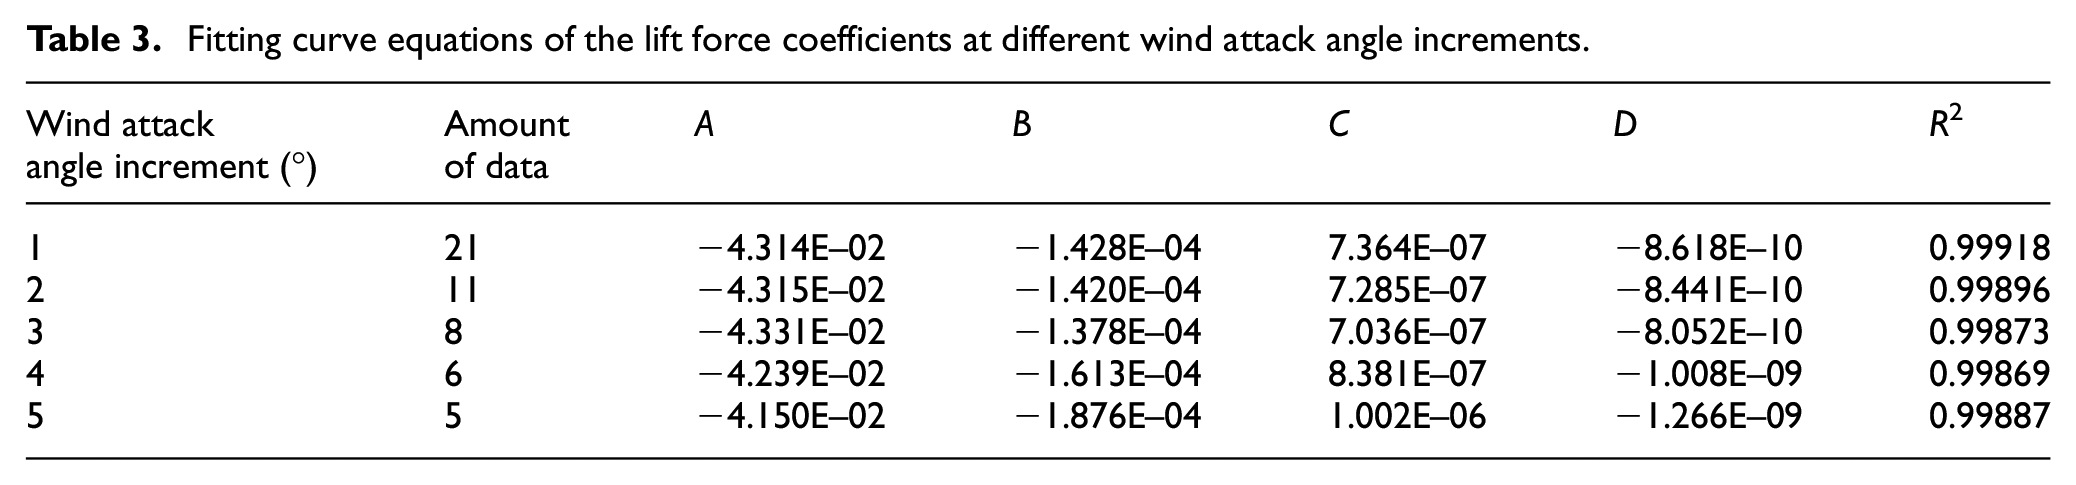
As mentioned in section “Aerodynamic coefficient data of iced hangers and error analysis of the Den Hartog coefficients,” the figures obtained using formulas (1) and (2) are frequently distorted, and it will cause larger calculation errors. In this section, data processing is performed on the drag force coefficients and the lift force coefficients under wind attack angle increments of 1°, 2°, 3°, 4°, and 5° (as shown in Tables 3 and 4) in order to meet the requirement of the Den Hartog galloping analysis.
Fitting curve equations of the lift force coefficients at different wind attack angle increments.
Fitting curve equations of the drag force coefficients at different wind attack angle increments.

It is hard to avoid a sudden change in the data because of the volatility of the data collected by the sensor (Pagnini et al., 2017), and therefore the main purpose is to find a function that reflects the law of data change in data processing. Although there are many methods for data processing, such as polynomial fitting and interpolation fitting, polynomial fitting can achieve this goal better (Wu, 2007). Since the cross section of iced hangers is symmetric, the drag coefficients are symmetric and the lift coefficient are antisymmetric (Li et al., 2016; Loredo-Souza and Davenport, 2001; Lou et al., 2013; Ng et al., 2005; Pagnini et al., 2017; Zhou et al., 2016)


where
In accordance with the Den Hartog galloping theory, the corresponding range of attack angles for the negative derivatives of the lift coefficients should be selected. In the test, the range of wind attack angles is 0°–20° and the amounts of data are presented in Tables 3 and 4. Obviously, the higher the order of polynomials, the higher the fitting accuracy, but the more data points it needs. Ng et al. (2005) pointed out that the seventh-order polynomial has a high accuracy for fitting the lift coefficients of symmetric structures in the wind attack angle range of −15° to 15° (40 data points) and the determination coefficient (R2) is greater than 0.99. Therefore, the data of lift coefficients are fitted by the odd function of seventh order, while the data of drag coefficients are fitted by the even function of eighth order in this section, where the fitting curve equations are shown in Tables 3 and 4.
As shown in Tables 3 and 4, the values of R2 are greater than 0.99 in the fitting curve equations of the aerodynamic coefficients at different wind attack angle increments, thereby indicating that the actual and fitted values exhibit an extremely high fitting precision, and the data distribution features can be reflected effectively by higher-order nonlinear equations which may satisfy the requirement of the Den Hartog galloping analysis.
Analysis of wind attack angle increments for the Den Hartog galloping stability of iced hangers
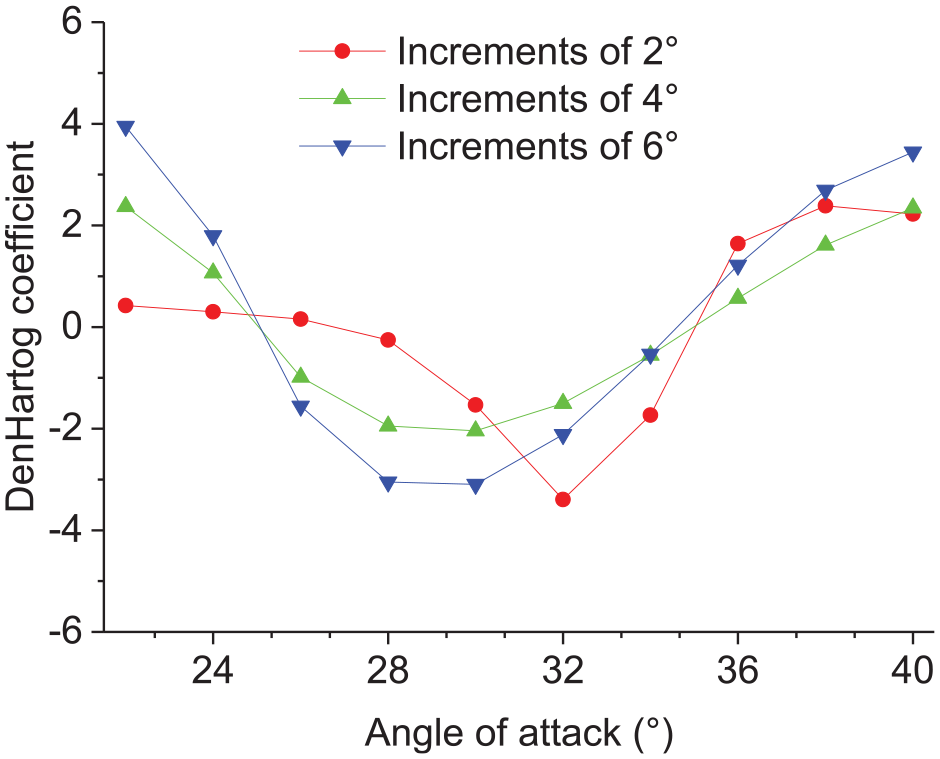
As analyzed in section “Aerodynamic coefficient data of iced hangers and error analysis of the Den Hartog coefficients,” the data distribution features can be reflected effectively by higher-order nonlinear equations at different wind attack angle increments. However, different results for the Den Hartog galloping analysis of iced hangers will be produced due to different wind attack angle increments. In this section, the reasonable value of wind angle of attack increment is analyzed to obtain the purpose of not only meeting the test precision requirement but also improving the test efficiency. As shown in Figure 8, the Den Hartog coefficients were calculated using formula (3) under the wind attack angle increments of 1°, 2°, 3°, 4°, and 5° based on the curve fittings obtained in section “Fitting curve of the aerodynamic coefficients of iced hangers at various wind attack angle increments.”
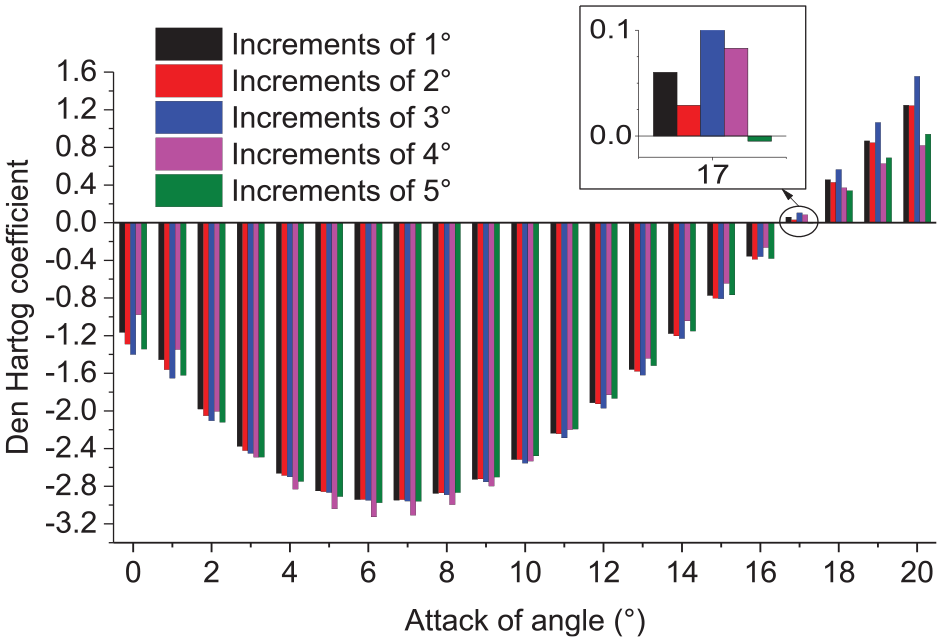
Den Hartog coefficients calculated from the fitting curves of aerodynamic coefficients of the tested model with different wind attack angle increments at angles of attack ranging from 0° to 20°.
The Den Hartog coefficients calculated from the fitting curves of the aerodynamic coefficients of the tested model with different wind attack angle increments shown in Figure 8 and Table 5 are characterized as follows.
Den Hartog coefficients calculated from the fitting curves of the aerodynamic coefficients of the tested model with different wind attack angle increments.
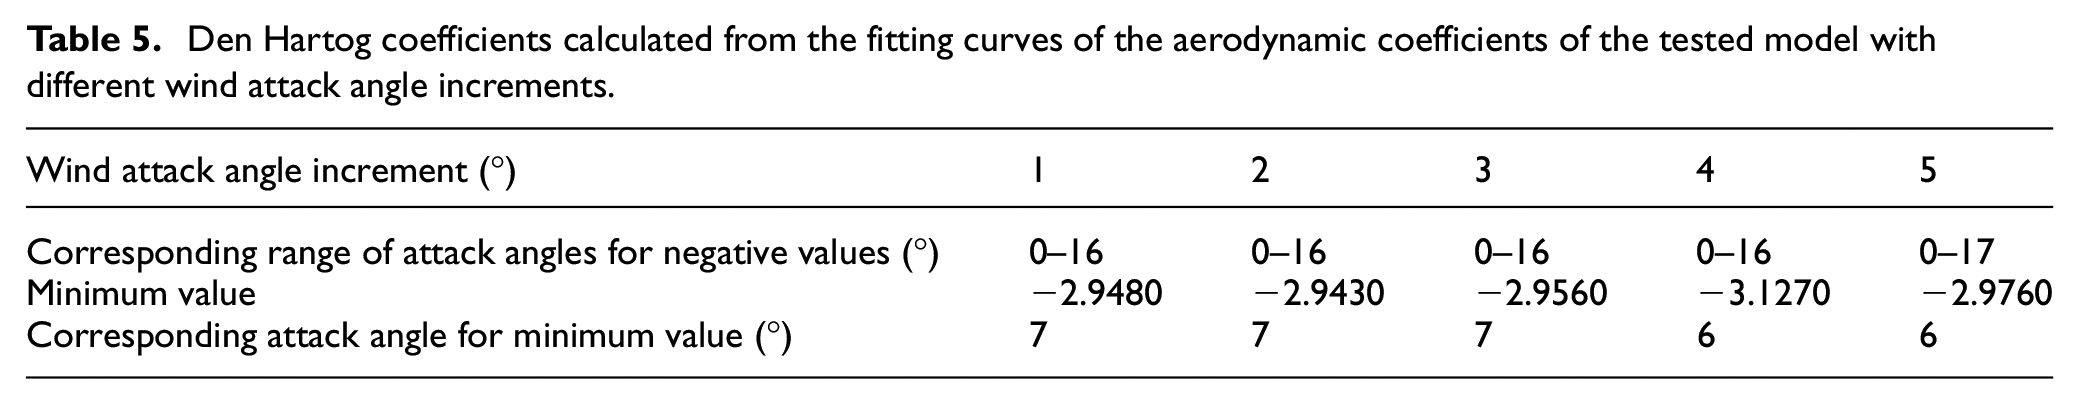
When the wind attack angle increment was 2°, the corresponding range of attack angles for the negative values of the Den Hartog coefficients was the same as that for an increment of 1°. The corresponding attack angles for the minimum value were the same as those for an increment of 1° with a relative error of 0.17%.
When the wind attack angle increment was 3°, the corresponding range of attack angles for the negative values of the Den Hartog coefficients was the same as that for an increment of 1°. The corresponding attack angles for the minimum value were the same as those for an increment of 1° with a relative error of 0.27%.
When the wind attack angle increment was 4°, the corresponding range of attack angles for the negative values of the Den Hartog coefficients was the same as that for an increment of 1°. However, the corresponding attack angles for the minimum value differed from those for an increment of 1°, that is, the wind attack angle that would most likely cause galloping had changed.
When the wind attack angle increment was 5°, the corresponding range of attack angles for the negative values of the Den Hartog coefficients differed from that for an increment of 1°. In addition, the corresponding attack angles for the minimum value differed from those for an increment of 1°.
Overall, the indices of the Den Hartog coefficients were basically the same when the wind attack angle increments were not more than 3°. However, the distortions occurred when the wind attack angle increments were more than 3° because the corresponding range of attack angles for the negative values of the Den Hartog coefficients and the corresponding attack angles for the minimum value had changed.
Discussion
Analysis of wind attack angle increments from other studies
The aerodynamic coefficients of D-shaped iced cables were analyzed at an increment of 2° by Li et al. (2016). As shown in Figure 7 (Li et al., 2016), the Den Hartog coefficients were negative at angles of attack ranging from 28° to 34°, and the corresponding attack angle for the minimum value that would most likely cause galloping was 32° (Figure 9).

Data regarding the D-shaped iced cables from Li et al. (2016).
Higher-order nonlinear equations were adopted to fit the data of aerodynamic coefficients and the R2 value > 0.99 was ensured by adjusting the wind attack angle increments with existing data. The fitting curves are shown in Figure 10.
Den Hartog coefficients calculated from the fitting curves of the aerodynamic coefficients with different wind attack angle increments at angles of attack ranging from 20° to 40° (raw data cited from Li et al., 2016).
As shown in Table 6, when the wind attack angle increment was 4°, the corresponding range of attack angles for the negative values of the Den Hartog coefficients differed from that at an increment of 2°. The corresponding attack angles for the minimum value were shifted off at 2°, that is, the wind attack angle that would cause galloping had changed. When the wind attack angle increment was 6°, the corresponding range of attack angles for the negative values of the Den Hartog coefficients differed from that at an increment of 2°. In addition, the corresponding attack angles for the minimum value were shifted off at 4°.
Den Hartog coefficients calculated from fitting curves of aerodynamic coefficients with different wind attack angle increments at angles of attack ranging from 20° to 40° (raw data cited from Li et al., 2016).
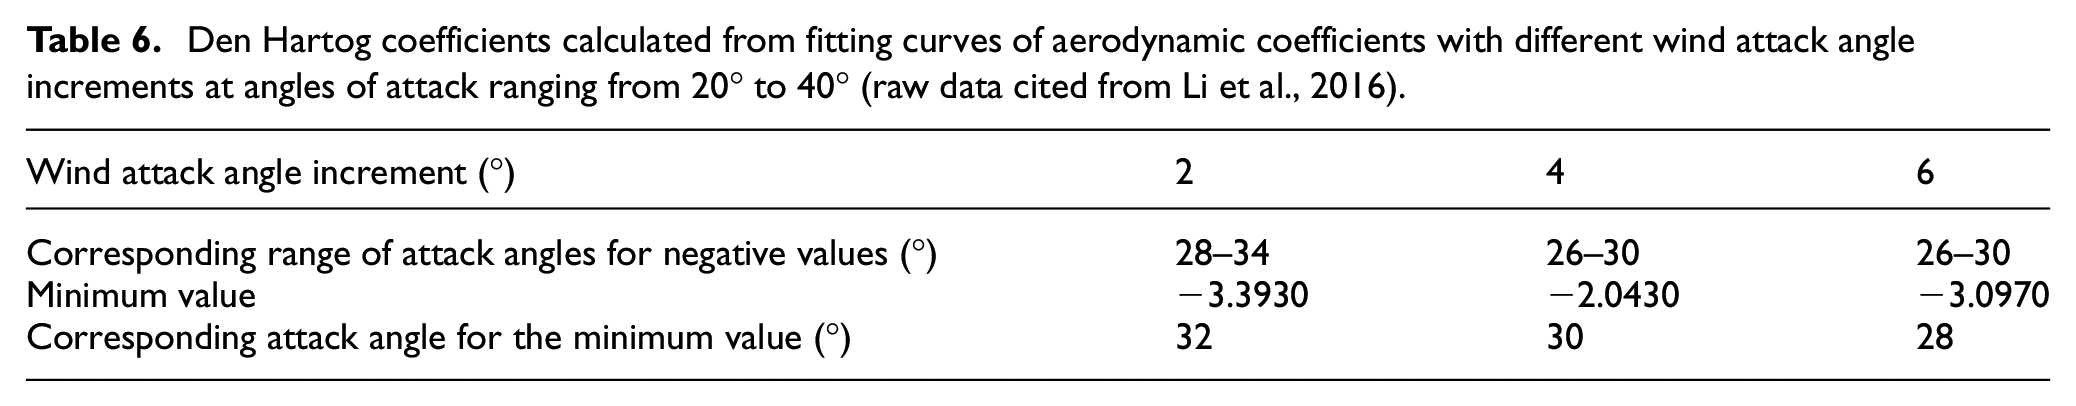
Therefore, on the basis of the aerodynamic coefficient analysis of D-shaped iced cables in Li et al. (2016), distortions occurred when the wind attack angle increments were more than 4°. The results were in accordance with those in section “Analysis of wind attack angle increments for the Den Hartog galloping stability of iced hangers.”
Analysis of the curve fitting method
There are many kinds of discrete data processing methods, such as polynomial fitting and interpolation fitting. As can be seen from Table 7, the polynomial fitting method is basically adopted in the analysis of aerodynamic data of iced conductors and square columns. The purpose of the study is to find out the function that reflects the law of data change. Therefore, the polynomial fitting method is also adopted in this study. Further studies will be needed to confirm whether other fitting methods are suitable for the analysis of iced hangers based on the aerodynamic coefficient theory and Den Hartog galloping theory.
Aerodynamic data analysis method of iced conductors and square columns.
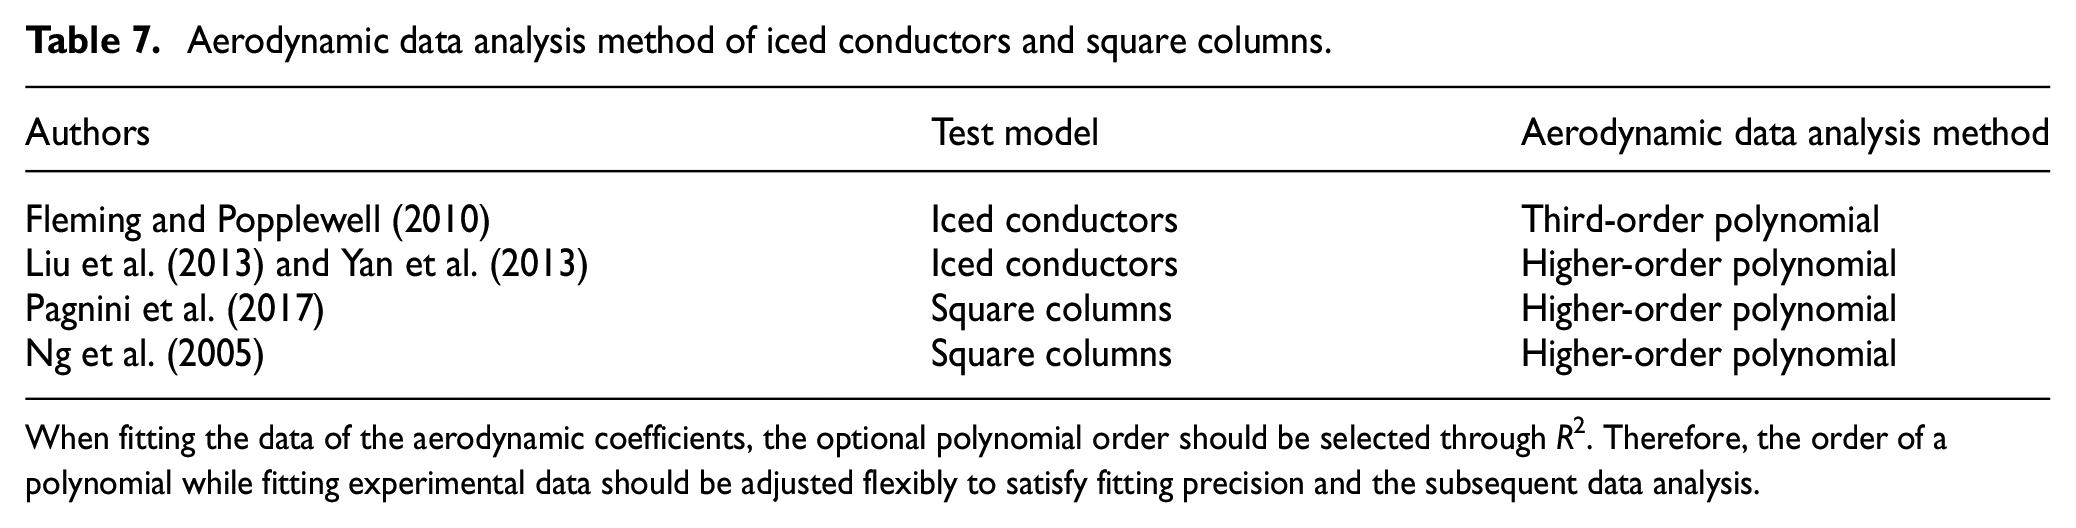
When fitting the data of the aerodynamic coefficients, the optional polynomial order should be selected through R2. Therefore, the order of a polynomial while fitting experimental data should be adjusted flexibly to satisfy fitting precision and the subsequent data analysis.
Error analysis
The results obtained from Den Hartog galloping are unavoidably affected by measurement error and calculation error (Pagnini et al., 2017). The former source of uncertainties can be reduced by improving the instrument equipment and the quality of the test. The wind tunnel test, as the common study method, has been widely used in the field of wind engineering research (An et al., 2016; Chabart and Lilien, 1998; Fleming and Popplewell, 2010; Guo et al., 2017; Keutgen and Lilien, 2000; Li et al., 2017; Loredo-Souza and Davenport, 2002), and the corresponding standard of wind tunnel test has been formulated. In addition, the performance and accuracy of equipments can meet the need of experiments. Hence, only the wind attack angle increments are analyzed, but without the analysis of measuring equipment error, in order to meet the need of test accuracy of icing hangers, improve the test efficiency, shorten the test period, and reduce test expenses.
For the latter factor, as described in section “Analysis of the curve fitting method”, the high-order polynomial fitting method, as the common method for aerodynamic data of iced conductors and square columns is adopted (Fleming and Popplewell, 2010; Liu et al., 2013; Ng et al., 2005; Pagnini et al., 2017; Yan et al., 2013), and the optimal wind attack angle increment is obtained based on the Den Hartog galloping theory.
Conclusion
In this work, wind tunnel tests were conducted to analyze the aerodynamic coefficients and Den Hartog galloping coefficients of iced hangers and data analysis was performed at different wind attack angle increments. Several important conclusions were drawn from the preceding considerations as follows:
Considerable calculation error will be caused when directly using the conventional method during the processing and analysis of Den Hartog galloping for iced cable structures.
The curve fitting of the aerodynamic coefficients of iced hangers in which their characteristics are better presented, for example, smooth-going characteristic, antisymmetric characteristics for lift coefficients, and symmetric characteristics for drag coefficients, can satisfy the accuracy requirement of the derivation of lift coefficients and can then be used to examine the Den Hartog galloping coefficients of iced hangers accurately.
In cases where the wind attack angle increments are more than 3°, the wind attack angle that corresponds to the minimum value of the Den Hartog coefficients shows an offset. Meanwhile, distortions occur when determining the range of wind attack angles of Den Hartog galloping, and thus quantitative analysis cannot be conducted. These cases are only applicable to a preliminary study.
The precision of the Den Hartog coefficients, which is solved in cases where the wind attack angle increments are not more than 3°, can meet the requirements for the Den Hartog galloping analysis. The results of this study provide a reference for research on the galloping of iced hangers using the wind tunnel test.
Footnotes
Acknowledgements
The manuscript has not been previously published and will not be submitted elsewhere before a decision is made by this journal.
Author Contributions
P.G. carried out the wind tunnel tests, analyzed the data, and wrote the first draft of the article. S.L. guided and modified the paper. D.W. guided the paper.
Declaration of Conflicting Interests
The author(s) declared no potential conflicts of interest with respect to the research, authorship, and/or publication of this article.
Funding
The author(s) disclosed receipt of the following financial support for the research, authorship, and/or publication of this article: This work was supported by the National Natural Science Foundation of China (Grant Nos 51778587 and 51808510), Natural Science Foundation of Henan Province of China (Grant No. 162300410255), Foundation for University Young Key Teacher Program of Henan Province (Grant No. 2017GGJS005), Outstanding Young Talent Research Fund of Zhengzhou University (Grant No. 1421 322059), and Science and Technology Planning Project of Transportation in Henan Province (Grant Nos 2016Y2-2 and 2018J3).