
Abstract
Contemporary tall buildings constructed with high-strength and light-weight materials become relatively flexible and lightly damped, and the fluctuating wind forces acting on the buildings may cause excessive vibrations, especially at the vicinity of vortex lock-in wind speed, where the natural frequency of the buildings is synchronized with the vortex shedding frequency. Given that tall buildings tend to be designed with unconventional shape involving innovative structural systems and complex geometry, the correlations among three force components may accentuate building motions significantly. In this study, the coupling characteristics between the alongwind and crosswind vibrations of tall buildings with symmetric shape and distinct natural frequencies in two directions are investigated through a serious of aeroelastic model tests. The response standard deviations and power spectral densities are calculated, respectively, based on the displacement data measured at multiple levels of wind speed and structural damping ratio. Then the coupled response is extracted from the alongwind response in frequency domain through Fourier transform and inverse Fourier transform, and the standard deviations of the coupled response are calculated based on time history analysis, which are compared with that of the crosswind response to investigate the relationship between the alongwind and crosswind motions. Moreover, the amplitude ratio, phase difference, and coherence of the response components are also calculated for further discussing the coupling effects and examining the coupled vibration characteristics.
Introduction
Wind-excited tall buildings may oscillate in the alongwind, crosswind, and torsional directions. The alongwind vibration primarily arises from approaching flow fluctuations, while the crosswind vibration is more complicated, which results from fluctuating pressures acting on lateral sides of the building, mainly induced by separated shear layers and wake vortex shedding (e.g. Kwok, 1982; Matsumoto, 1986; Solari, 1985). The torsional effects usually stem from the asymmetrical wind pressure distributions on the building surface (e.g. Beneke and Kwok, 1993; Isyumov and Poole, 1983; Kareem, 1981, 1985). In the case of tall buildings with symmetric shape and conventional structural systems, where the center of rigidity coincides with the centroid of the building, the correlations among three force components are negligible, and the vibration in each direction can be analyzed independently. Therefore, the wind-induced response in three directions can be considered uncoupled statistically.
Contemporary tall buildings constructed with high-strength and light-weight materials become relatively flexible and lightly damped, and the fluctuating wind forces acting on the buildings may cause excessive vibrations, especially at the vicinity of vortex lock-in wind speed, where the natural frequency of the buildings is synchronized with the vortex shedding frequency. Given that tall buildings tend to be designed with unconventional shape involving innovative structural systems and complex geometry, the correlations among three force components may accentuate building motions significantly. Copious research has revealed the coupling effects between the crosswind and torsional force components due to the effects of structural eccentricity. The interactions between the crosswind and torsional motions has received extensive attentions in literatures (e.g. Kareem, 1985; Katagiri et al., 1992; Kawai, 1993; Kim et al., 2011; Şafak and Foutch, 1987; Tallin and Ellingwood, 1985a, 1985b; Thepmongkorn and Kwok, 2002; Torkamani and Pramono, 1985; Mao et al., 2018; Wang et al., 2019).
In contrast, the coupling effects between the alongwind force or response and that of crosswind are seldom discussed, although the relevant research had pointed out that the coupling between the alongwind and crosswind vibrations could take place as the reduction of the difference between the natural frequencies in two principal axes may lead to an increase in the system damping (Perera, 1978). Besides, another research found that the joint probability distribution between the alongwind and crosswind motions at low reduced wind speeds were symmetrical about the wind axes, indicating the independence of the crosswind and alongwind motions, but this trend tended to be diminish at higher reduced wind speeds (Kareem, 1982). Generally speaking, the coupling mechanism between the alongwind and crosswind vibrations is complicated, and may amplify the dynamic response considerably, especially when the aeroelastic effect is significant. Consequently, it is necessary to conduct further experimental investigation on this topic.
In this study, the coupling characteristics between the alongwind and crosswind vibrations of tall buildings with symmetric shape and distinct natural frequencies in two directions are investigated through a serious of aeroelastic model tests. First, the response standard deviations (STD) and power spectral densities (PSDs) are calculated, respectively, based on the displacement data measured at multiple levels of wind speed and structural damping ratio. Then the coupled response is extracted from the alongwind response in frequency domain through Fourier transform and inverse Fourier transform, and the STDs of the coupled response are calculated based on time history analysis, which are compared with those of the crosswind response to investigate the relationship between the alongwind and crosswind motions. Moreover, the amplitude ratio, phase difference, and coherence of the response components are also calculated for further discussing the coupling effects and examining the coupled vibration characteristics.
Aeroelastic model testing
Aeroelastic model testing using a base-pivoted rigid model of a square-shaped tall building was carried out at the boundary layer wind tunnel in Beijing Jiaotong University, China. The wind tunnel has a length of 15 m and test section of 3.0 m × 2.0 m. The atmospheric boundary layer flow was generated, representing flow over a suburban terrain. Figure 1 shows the profile of mean wind velocity and turbulence intensity, which have the power law exponent of α = 0.145 and
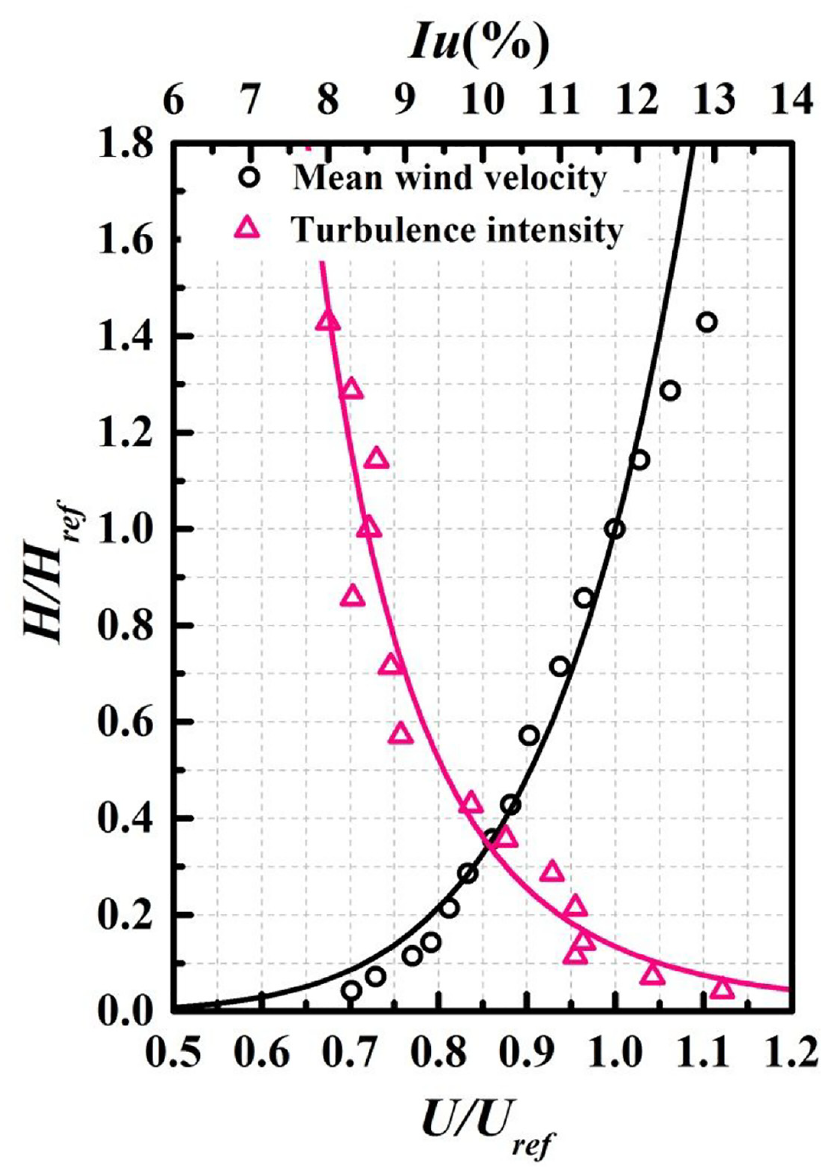
Profiles of mean wind velocity and turbulence intensity.
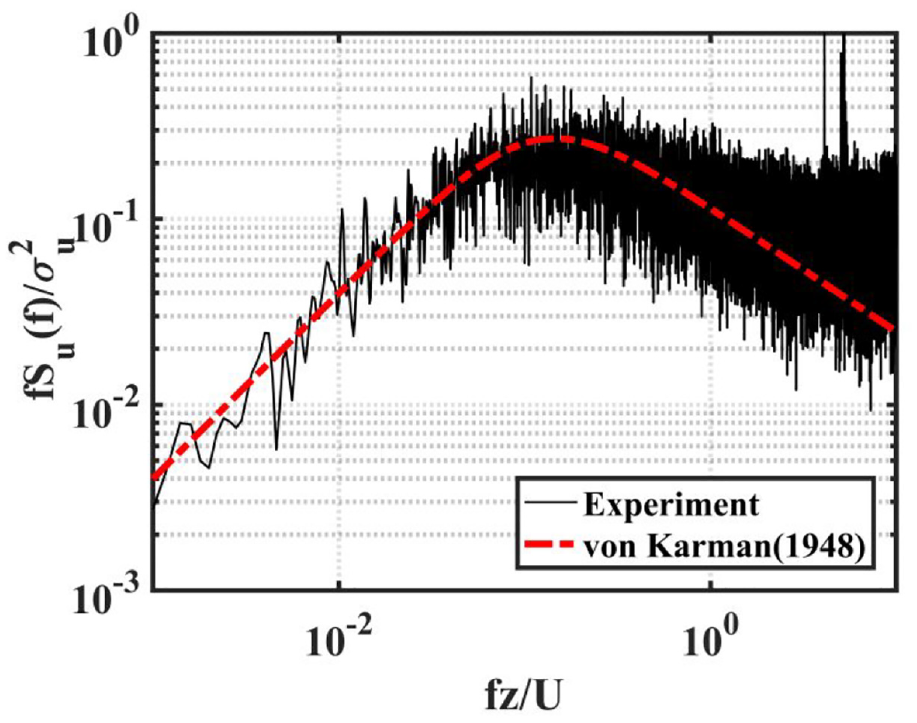
Power spectra of alongwind turbulence at the building height.
The rigid building model made of balsa wood was pivoted at the base by a gimbal arrangement which maintains the linear building mode shape in the direction along and perpendicular to the wind. The model was restrained by horizontal springs and eddy-current damper made of electromagnet was used to simulate structural damping. The setup of aeroelastic model testing is displayed in Figure 3. The building model has a width of 7 cm and height of 70 cm. The geometric scale is 1/500. The building mass ratio is

Setup of aeroelastic model testing: (a) diagram of the equipment and (b) pedestal of the equipment.
Results of response measurements
Characteristics of vibration displacement
The alongwind and crosswind displacements of the building model at 10 levels of structural damping ratio are measured when the reduced wind speed varies from 8.1 to 17.8. Figure 4 displays typical displacement time history samples at reduced wind speed
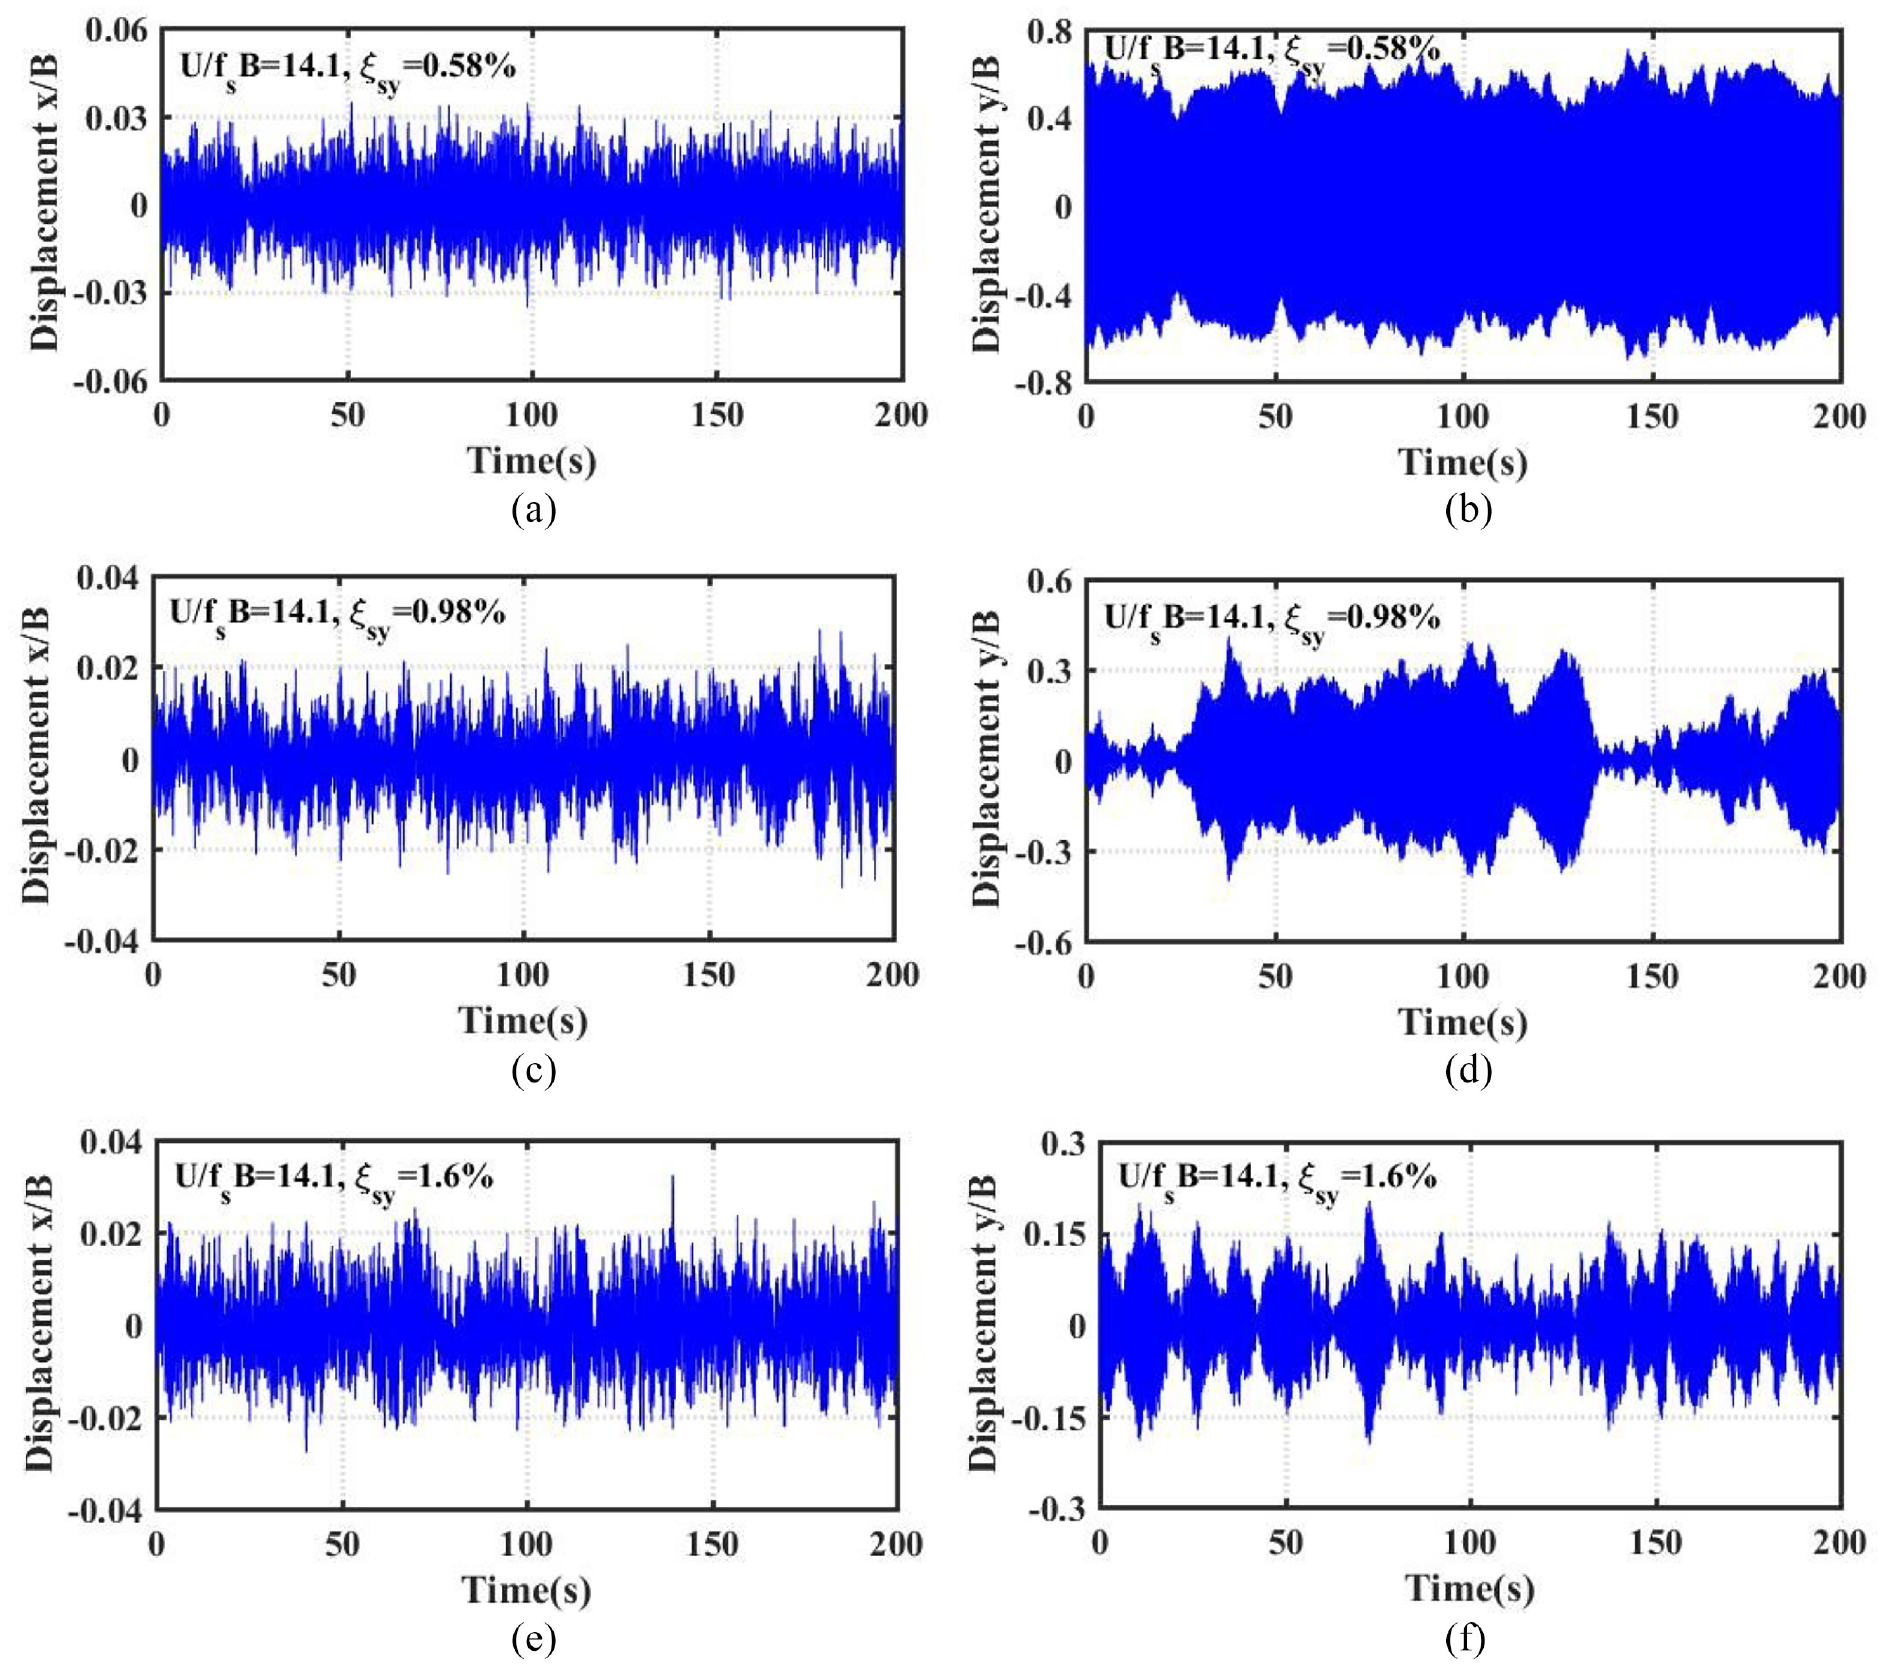
Displacement time history samples: (a) alongwind, U/fsB = 14.1, ξsy = 0.58%; (b) crosswind, U/fsB = 14.1, ξsy = 0.58%; (c) alongwind, U/fsB = 14.1, ξsy = 0.98%; (d) crosswind, U/fsB = 14.1, ξsy = 0.98%; (e) alongwind, U/fsB = 14.1, ξsy = 1.6%; and (f) crosswind, U/fsB = 14.1, ξsy = 1.6%.
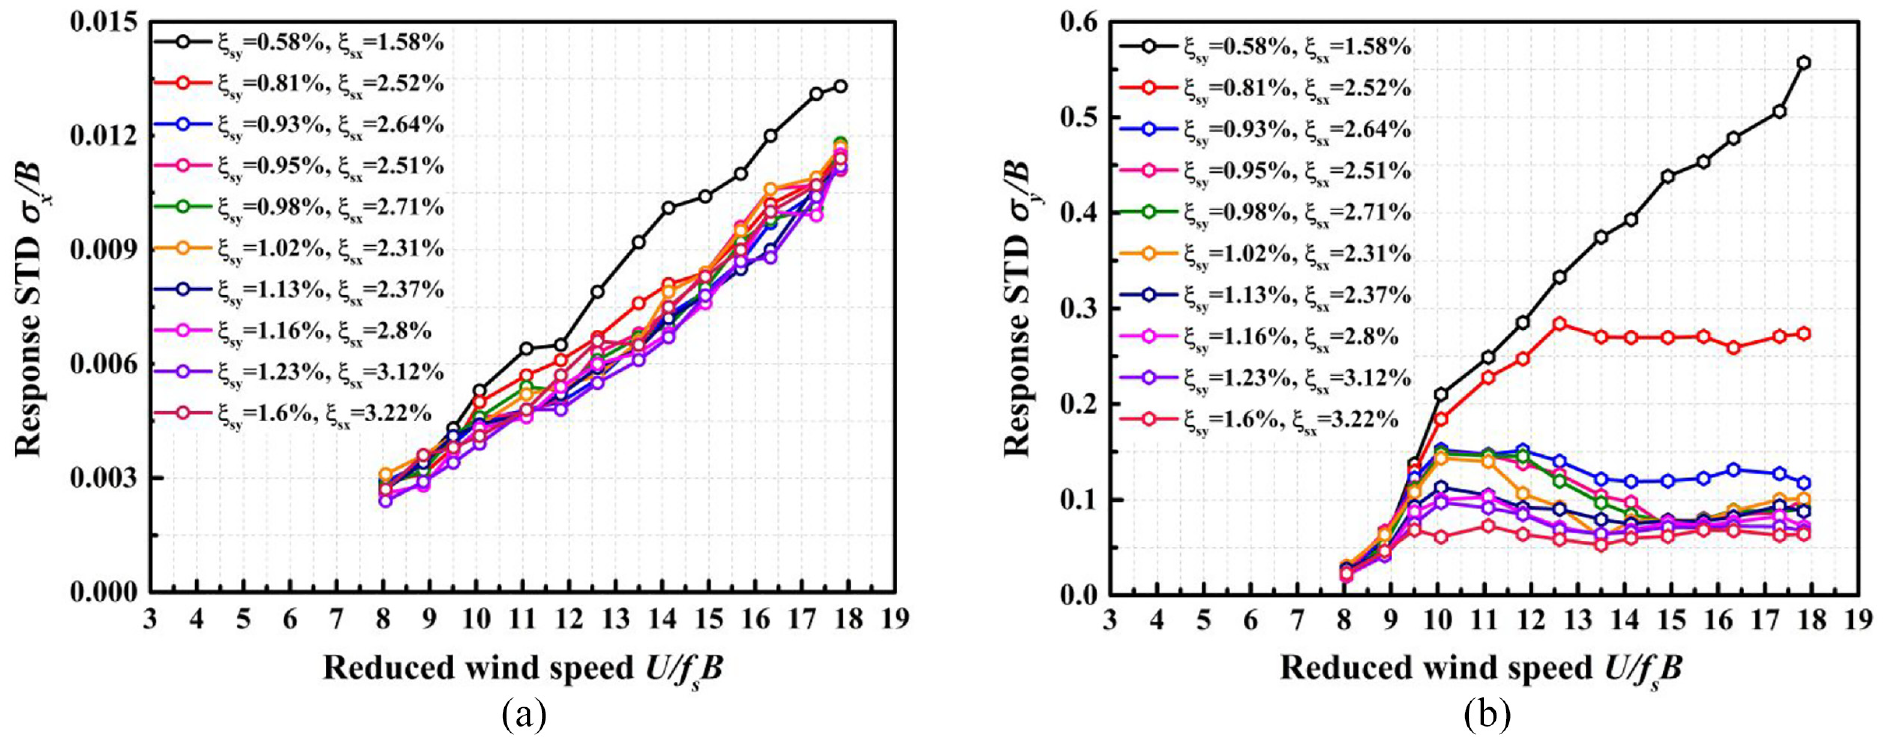
STDs of alongwind and crosswind displacement: (a) alongwind and (b) crosswind.
It can be seen that the alongwind displacements decrease slightly with the increase in structural damping ratio and increase slowly as the reduced wind speed increases, which exhibits the distinct features of random buffeting response. By comparison, the crosswind response increases rapidly as the reduced wind speed exceeds the critical vortex lock-in wind speed,
PSD of vibration displacement
The power spectra of the alongwind and crosswind displacements of the building model at multiple levels of reduced wind speed and structural damping ratio are calculated. Figure 6 displays the results at the crosswind structural damping ratio of 0.58% and reduced wind speeds U/fsB = 8.1, 10.1, 14.1, and 17.8. It can be observed that at a reduced wind speed lower than the vortex lock-in wind speed,
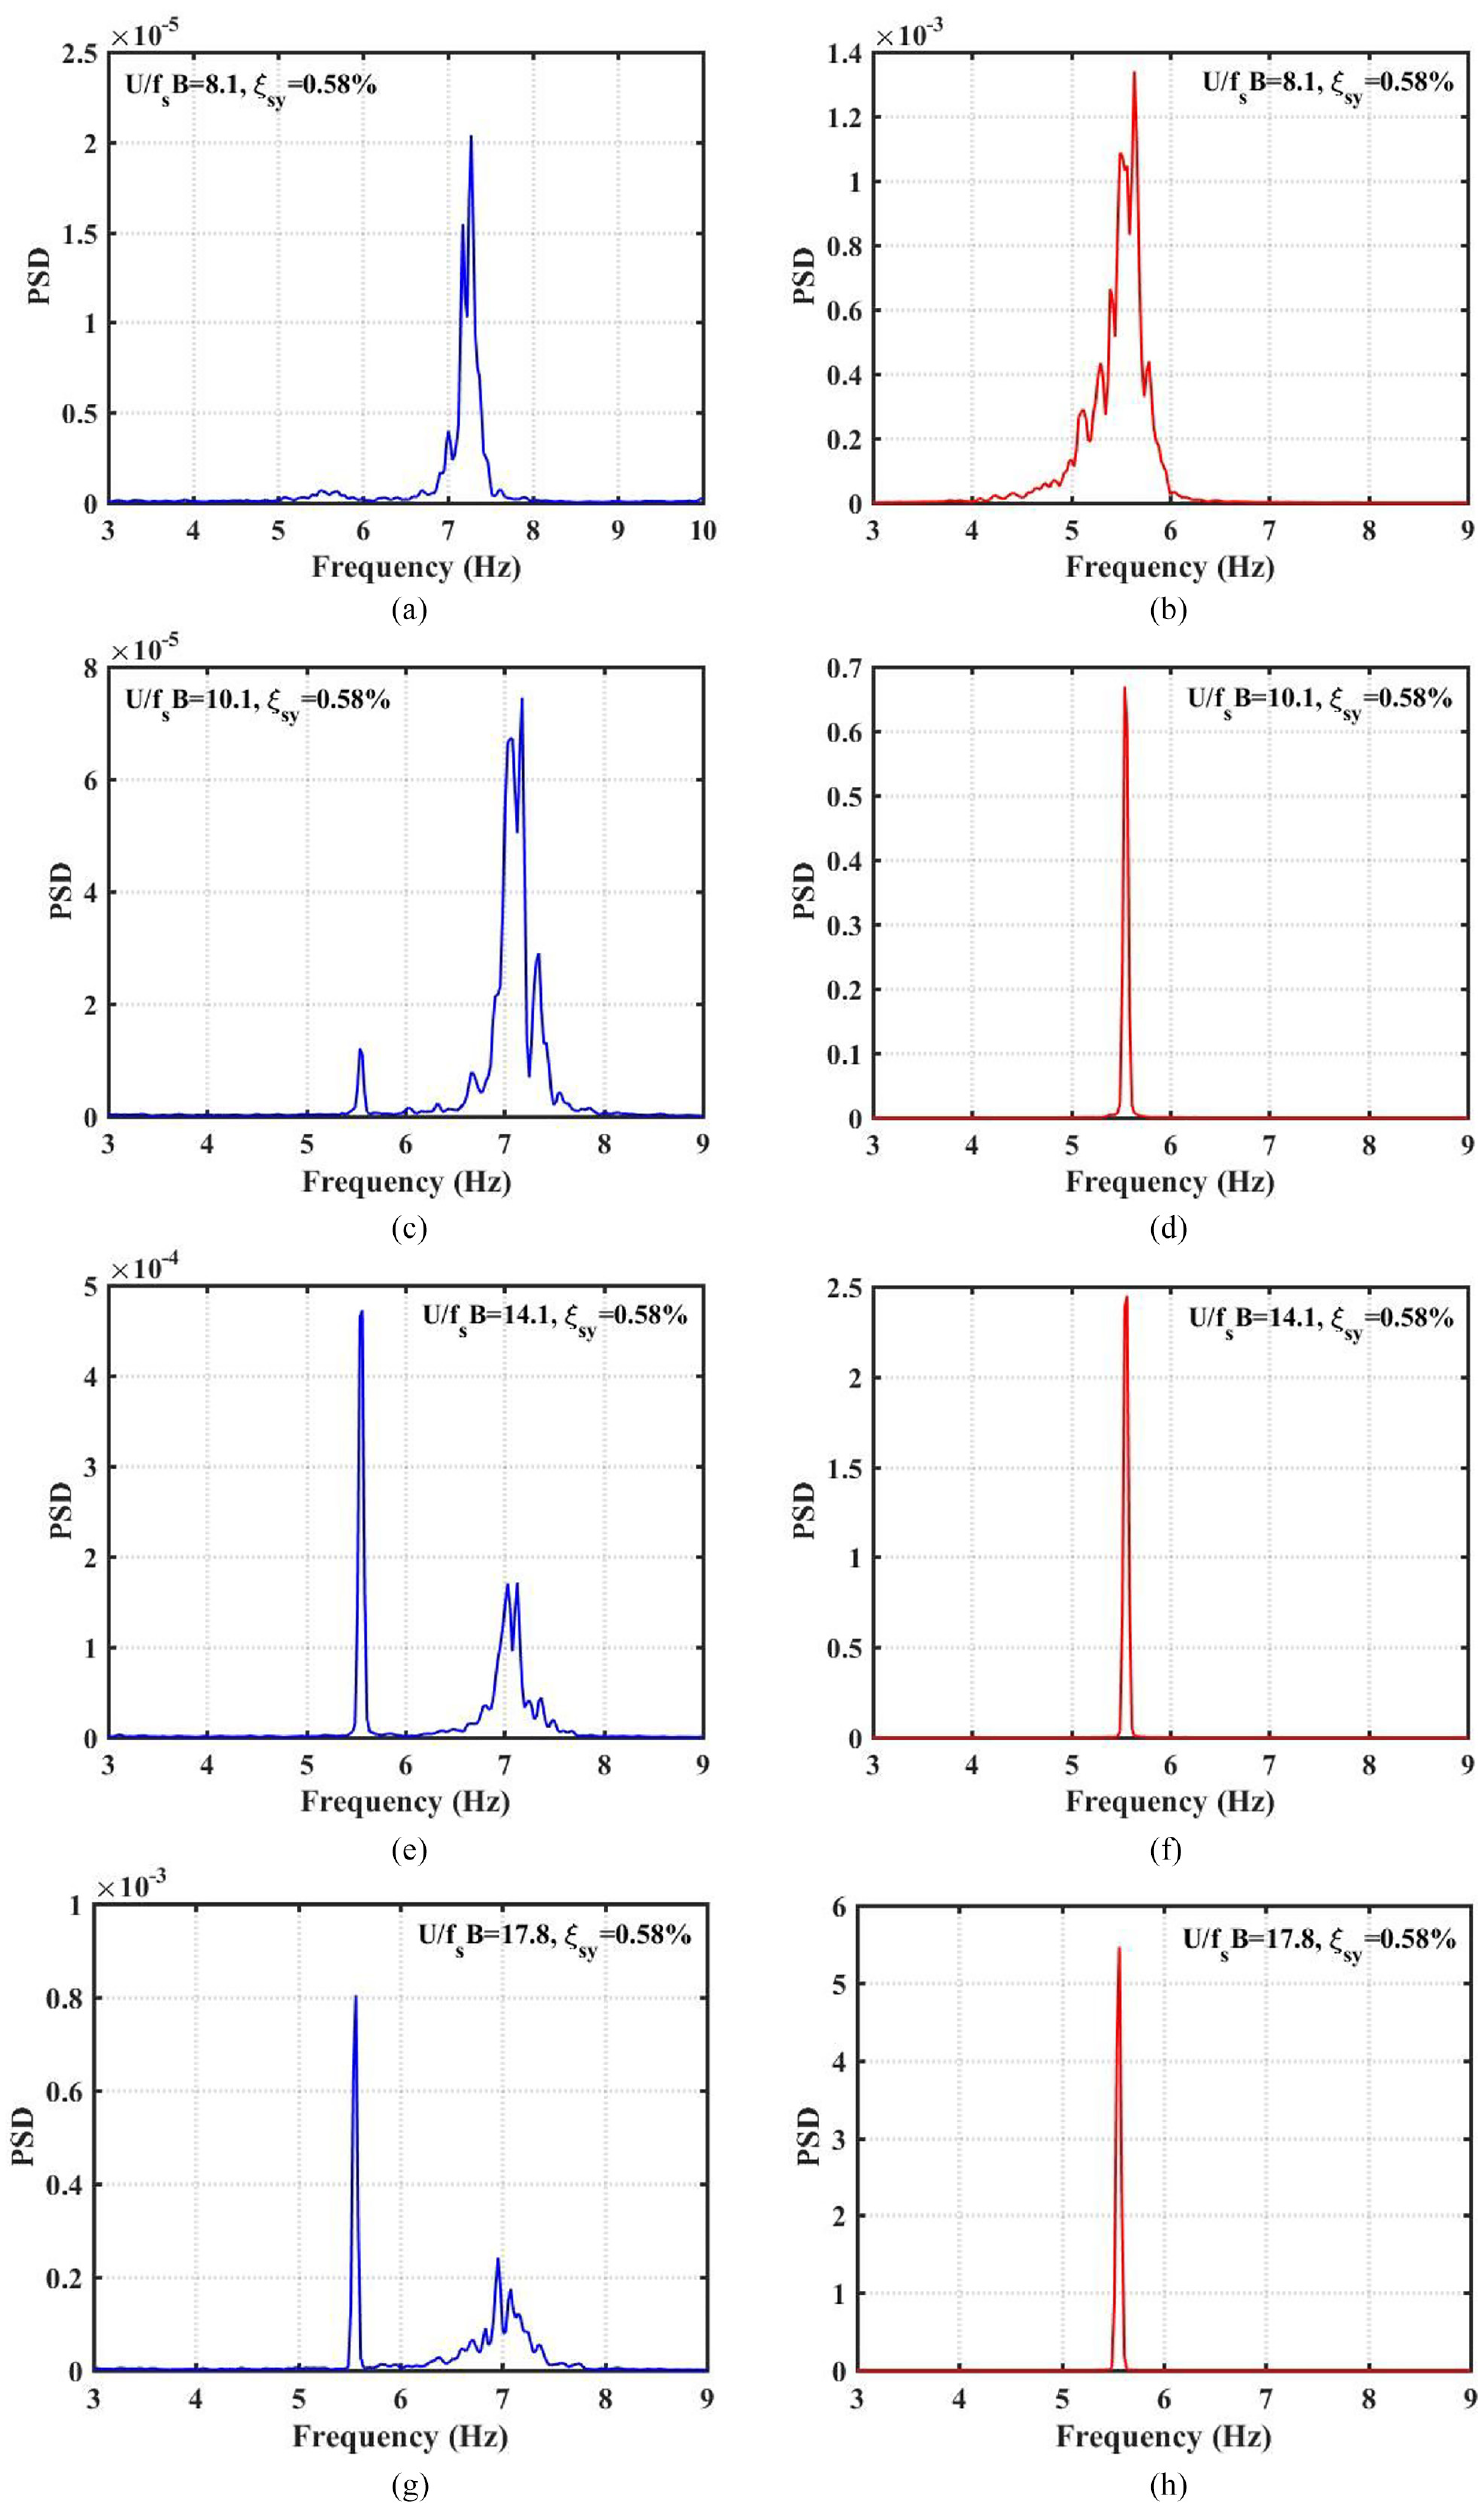
Power spectral density of displacement: (a) alongwind, U/fsB = 8.1, ξsy = 0.58%; (b) crosswind, U/fsB = 8.1, ξsy = 0.58%; (c) alongwind, U/fsB = 10.1, ξsy = 0.58%; (d) crosswind, U/fsB = 10.1, ξsy = 0.58%; (e) alongwind, U/fsB = 14.1, ξsy = 0.58%; (f) crosswind, U/fsB = 14.1, ξsy = 0.58%; (g) alongwind, U/fsB = 17.8, ξsy = 0.58%; and (h) crosswind, U/fsB = 17.8, ξsy = 0.58%.
Accordingly, the power spectra of the crosswind displacements have very narrow bandwidth and one dominant frequency, and the peak value grows rapidly as the reduced wind speed increases. Notably, the extra alongwind spectral component shows a similar variation trend, although the peak value is not comparable. As a result, the extra alongwind spectral component is likely resulted from the coupling effects between the alongwind and crosswind vibrations caused by the vortex-induced vibration.
Characteristics of coupled vibration
In order to validate the coupling effects between the alongwind and crosswind motions and ascertain the coupled vibration characteristics, the power spectra of the alongwind displacements are separated into two parts, namely the extra spectral component with only a frequency identical to that of the crosswind vibration, referred to as coupled response, and the spectral component with the alongwind natural frequency, referred to as single-frequency alongwind response.
Extraction of coupled response
The coupled response can be extracted from the alongwind displacement on the basis of frequency domain analysis. As show in Figure 6(a), (c), (e), and (g), two spectral components in the alongwind power spectra have no overlap; thus, the frequency range for each component is distinguishable. When the frequency range of the coupled response is determined, its spectral component can be picked out, and the time history can be obtained through inverse Fourier transform if the rest of the frequency is set to 0. Similarly, the time history of the single-frequency alongwind response can be derived.
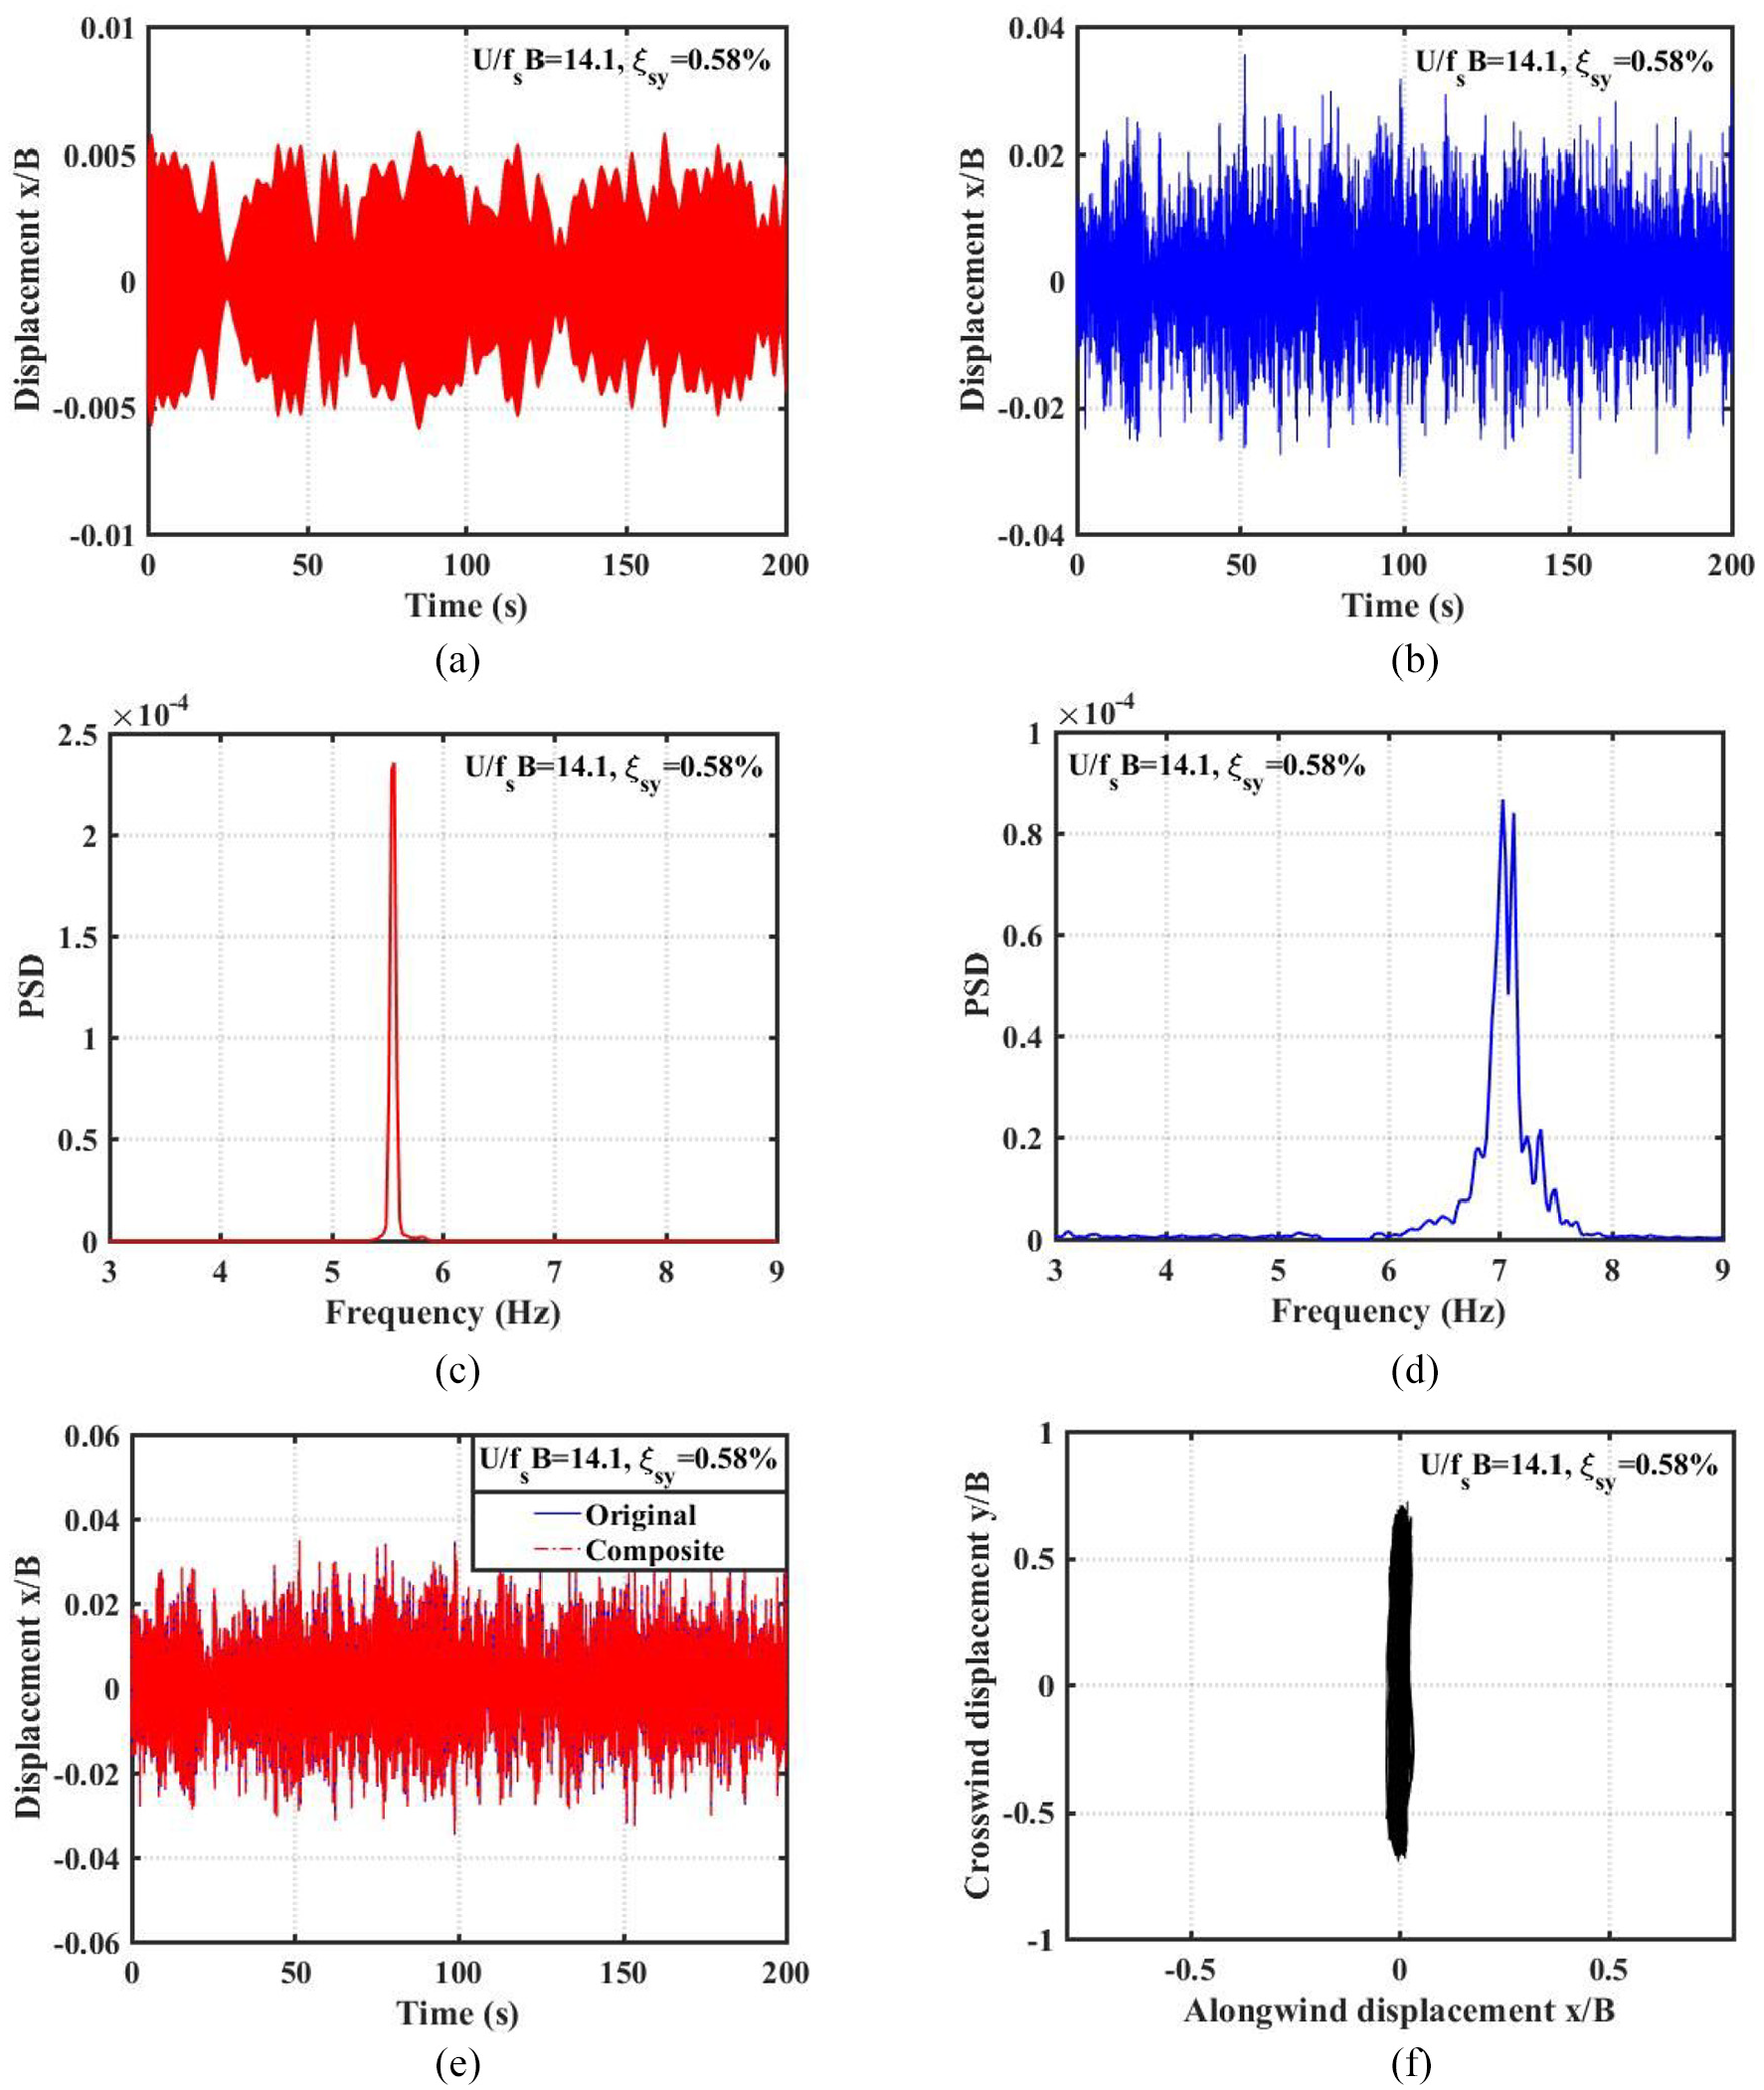
Figure 7 shows the decoupling process of the alongwind displacement at reduced wind speed of 14.1 and structural damping ratio of 0.58%. Figure 7(a) and (b) presents the time histories of the coupled and single-frequency alongwind displacements, respectively. The corresponding power spectra are displayed in Figure 6(c) and (d). To examine the accuracy of the decoupling process, the spectra of the coupled response and single-frequency alongwind response are synthesized to the alongwind response spectrum, and the displacement time history is also obtained from inverse Fourier transform. The composite displacement is compared with the original displacement in Figure 6(e), which matches well and proves the validity of the decoupling approach. Moreover, the motion trajectory at the top of the building model is derived by combining the single-frequency alongwind displacement with the crosswind displacement, as shown in Figure 6(f). The result indicates that the building primarily vibrates along the crosswind direction and the coupling effects are not stronger enough to influence the motion trajectory.
Decoupling results of alongwind displacement (
In addition, the STDs of coupled response at different levels of reduced wind speed and structural damping ratio are calculated. The results are magnified 100 times and compared with the STDs of crosswind response in Figure 8, where the reduced wind speed changes from 8.1 to 17.8 and crosswind structural damping ratio is 0.58%, 0.81%, 0.95%, 1.02%, and 1.23%, respectively. Although the coupled response is far smaller than that of the crosswind response, the variation trend is similar, except in the cases of lower structural damping ratio. This difference may be resulted from the complicated aeroelastic effects. The comparative result discloses the correlation between the coupled response and crosswind response, and further confirms the coupling effects between the alongwind and crosswind vibrations.
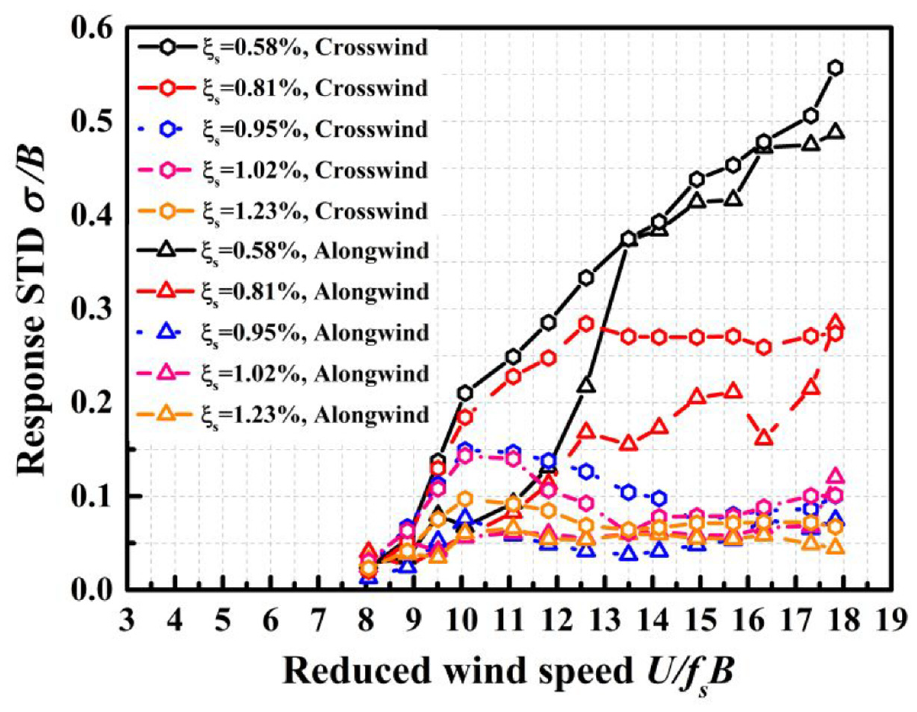
STD of coupled displacement (
Amplitude ratio and phase difference
The amplitude ratio and phase difference between the coupled response and crosswind response are analyzed when the reduced wind speed and structural damping ratio change. The instantaneous amplitude and phase of coupled response and crosswind response can be derived utilizing Hilbert transform, respectively. The amplitude ratio is the ratio of instantaneous amplitudes of coupled response to those of crosswind response. The phase difference is the difference between the instantaneous phase of coupled response and that of crosswind response.
The results at reduced wind speed of 8.1, 14.1, and 17.8 are shown in Figure 9, where the crosswind structural damping ratio is 0.58%. It can be seen that at reduced wind speeds lower than the critical vortex lock-in wind speed, the amplitude ratio and phase difference are relatively scattered, and the phase difference is positive and grows rapidly as the time increases. At a reduced wind speed beyond the vortex lock-in wind speed,

Amplitude ratio and phase difference between the coupled response and crosswind response (U/fsB = 8.1, 14.1, and 17.8,
Statistical correlation
The coherence which shows the correlation between two response components in frequency domain can be used to examine the statistical correlation characteristics, which is defined as follows
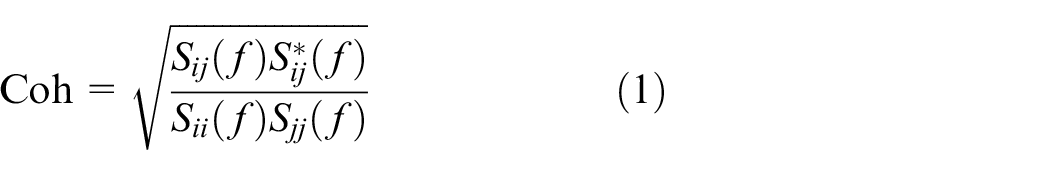
where
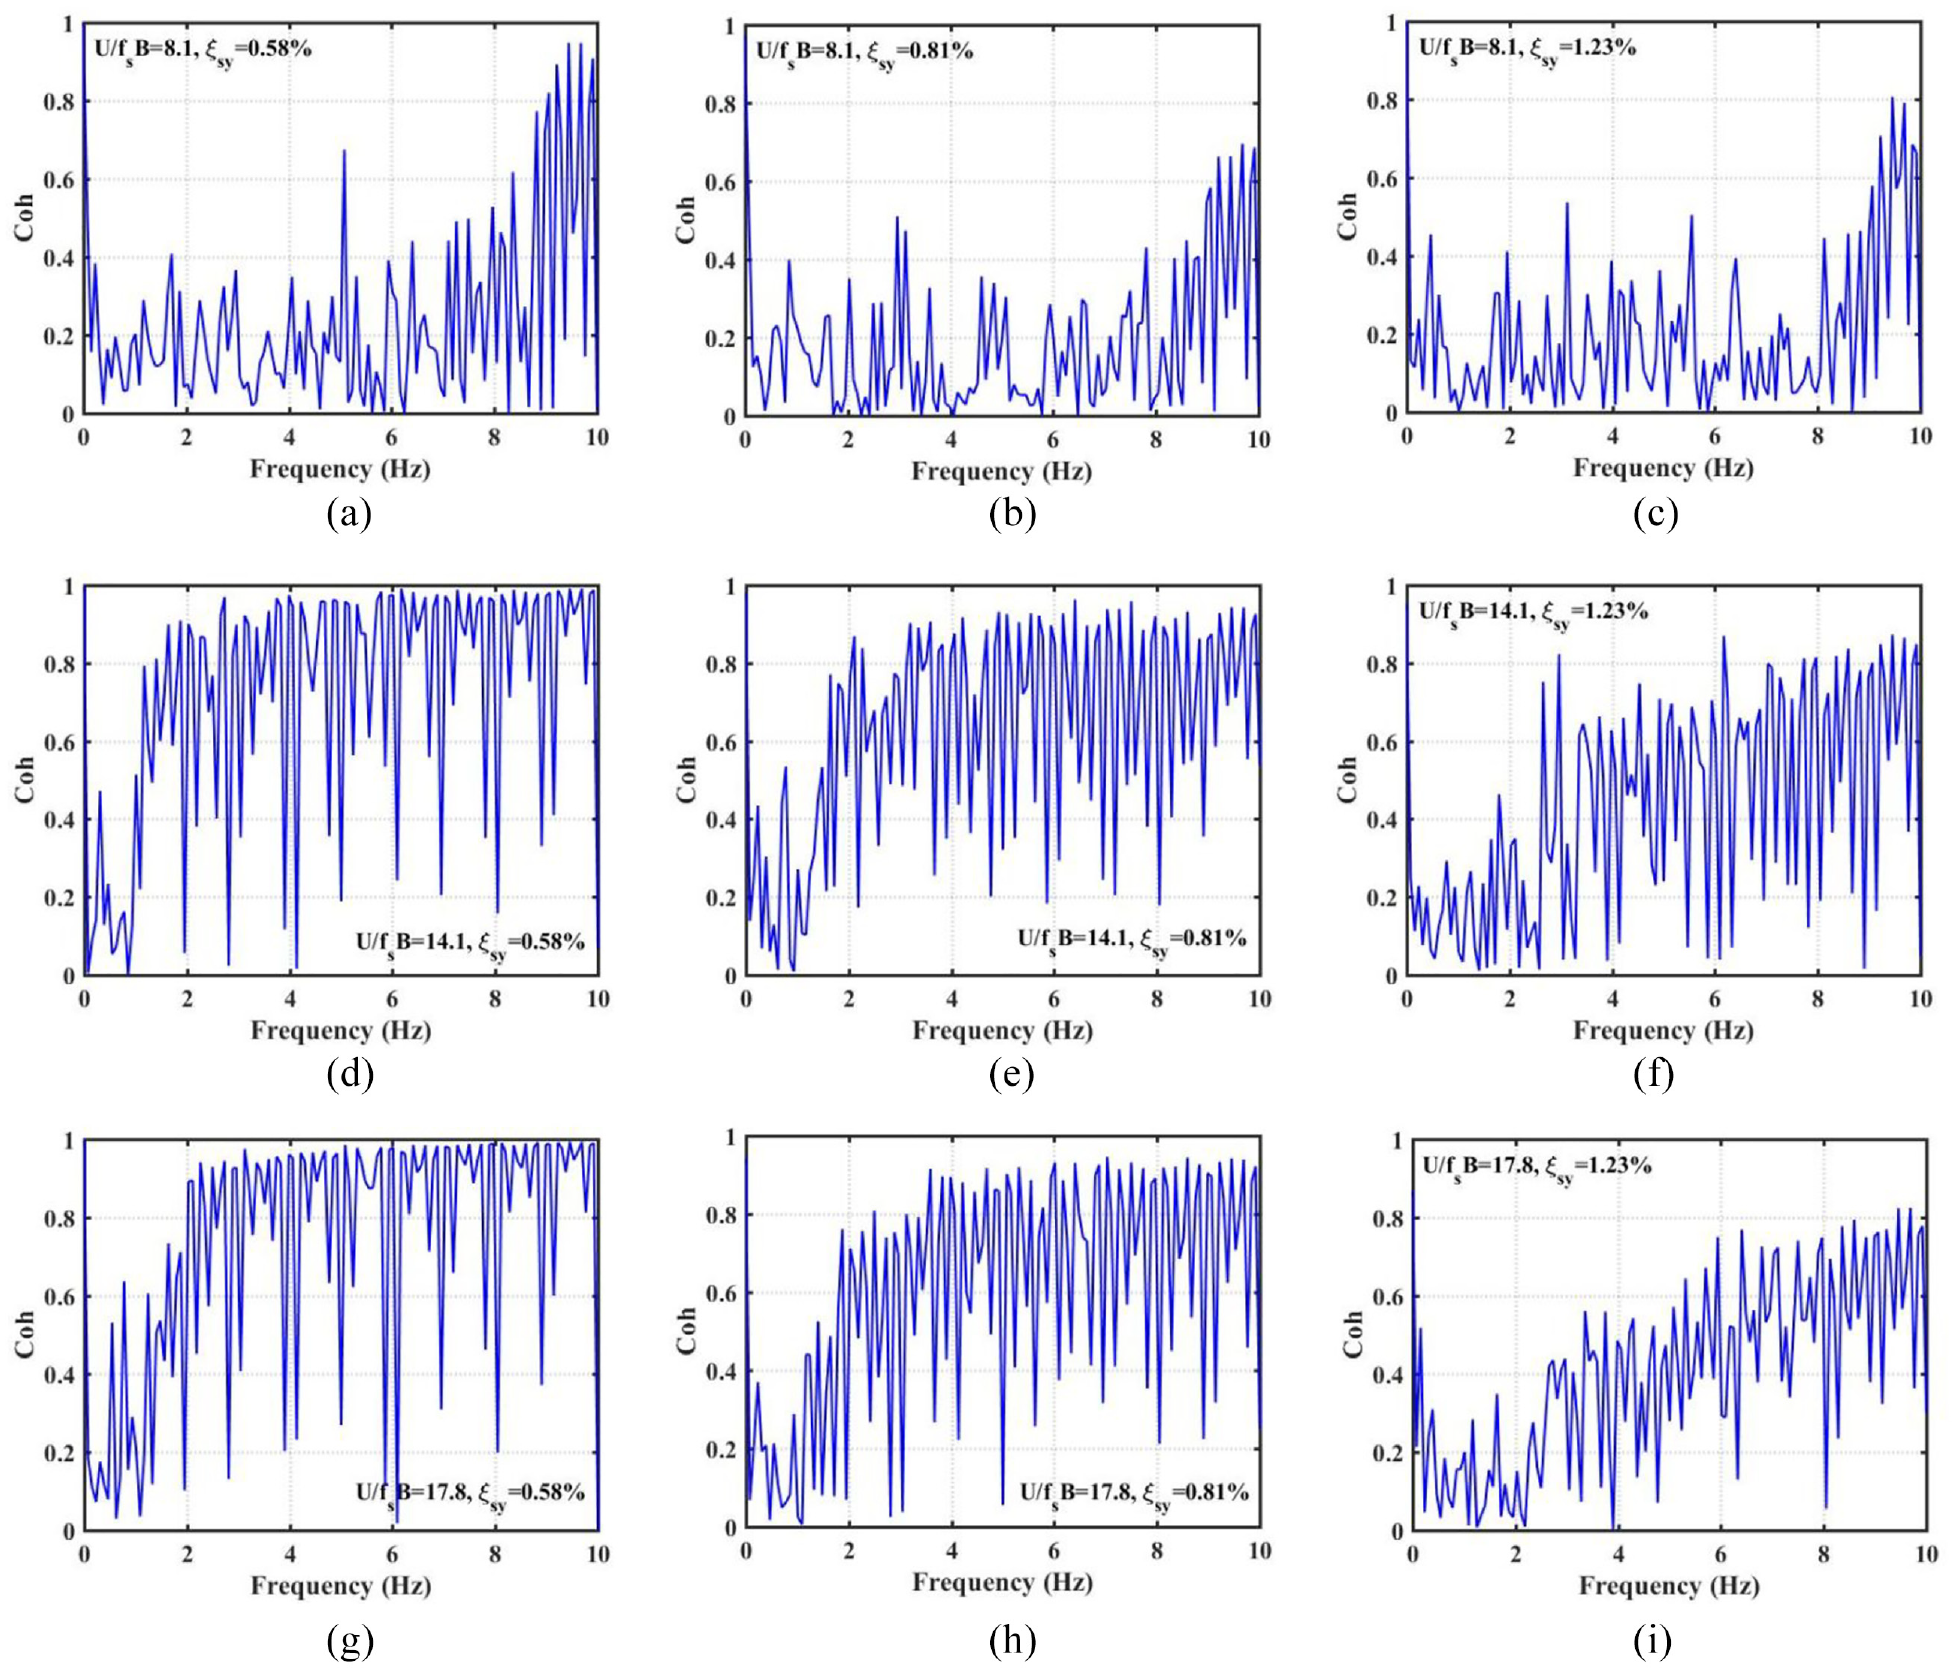
The correlation between the alongwind response and crosswind response is analyzed based on the coherence functions of amplitudes of the alongwind and crosswind displacements at varying reduced wind speeds and structural damping ratio. Figure 10 shows the coherences of the single-frequency alongwind response and crosswind response, where the reduced wind speed U/fsB = 8.1, 14.1, and 17.8, and crosswind structural damping ratio ξsy = 0.58%, 0.81%, and 1.23%. It can be found that when the reduced wind speed

Coherence between the amplitudes of the single-frequency alongwind and crosswind displacements (U/fsB = 8.1, 14.1, and 17.8; ξsy = 0.58%, 0.81%, and 1.23%): (a) U/fsB = 8.1, ξsy = 0.58%; (b) U/fsB = 8.1, ξsy = 0.81%; (c) U/fsB = 8.1, ξsy = 1.23%; (d) U/fsB = 14.1, ξsy = 0.58%; (e) U/fsB = 14.1, ξsy = 0.81%; (f) U/fsB = 14.1, ξsy = 1.23%; (g) U/fsB = 17.8, ξsy = 0.58%; (h) U/fsB = 17.8, ξsy = 0.81%; and (i) U/fsB = 17.8, ξsy = 1.23%.
Similarly, the coherences of the coupled response and crosswind response are displayed in Figure 11. It can be observed that even at a lower reduced wind speed, U/fsB = 8.1, the coherence functions at a relative higher frequency show a clear upward trend, but the values decrease with the increase in structural damping ratio. While at the vicinity of vortex lock-in wind speed, the values of coherence functions at a lower structural damping ratio are commonly larger than 0.8 over a wide frequency range, which suggests a stronger correlation between the couple response and crosswind response. In addition, there has a rapid decline in the coherences when the crosswind structural damping ratio rises to 1.23%, and this trend gets more evident as the reduced wind speed grows further.
Coherence between the amplitudes of coupled and crosswind displacements (U/fsB = 8.1, 14.1, and 17.8, ξsy = 0.58%, 0.81%, and 1.23%): (a) U/fsB = 8.1, ξsy = 0.58%; (b) U/fsB = 8.1, ξsy = 0.81%; (c) U/fsB = 8.1, ξsy = 1.23%; (d) U/fsB = 14.1, ξsy = 0.58%; (e) U/fsB = 14.1, ξsy = 0.81%; (f) U/fsB = 14.1, ξsy = 1.23%; (g) U/fsB = 17.8, ξsy = 0.58%; (h) U/fsB = 17.8, ξsy = 0.81%; and (i) U/fsB = 17.8, ξsy = 1.23%.
The preceding discussions reveal that the correlation between the coupled response and crosswind response is much more significant, and the coupling effects between the alongwind response and crosswind response can be noticeable when the crosswind aeroelastic effects are remarkable. Furthermore, the coupled response, which occupies only a fraction of the alongwind response, mainly results from the vortex-induced vibration and may contribute to modify the crosswind response induced by the aeroelastic effects.
Conclusion
This study systematically investigated the coupling characteristics between the alongwind and crosswind vibrations of tall buildings with symmetrical shape and distinct natural frequencies in two directions through a series of aeroelastic model tests. The response STDs and PSD were calculated, respectively, based on the displacement measurement results at multiple levels of wind speed and structural damping ratio. The results showed that the alongwind displacement exhibited the typical features of random buffeting response, while the crosswind displacement increased rapidly as the reduced wind speed exceeded the critical vortex lock-in wind speed and was more sensitive to the variation of structural damping ratio. At the vicinity of vortex lock-in wind speed, there existed an extra spectral component consistent with the crosswind natural frequency in the alongwind power spectra.
The coupled response was extracted from the alongwind response in frequency domain, and the STDs of the coupled response were compared with that of the crosswind response. The comparative results displayed that the variation trend of the coupled response agreed well with the crosswind response as the reduced wind speed increased, which disclosed the correlation between the coupled response and crosswind response, and confirmed the coupling effects between the alongwind and crosswind vibrations.
The amplitude ratio, phase difference, and coherence of the response components were presented. At the reduced wind speed lower than the critical vortex lock-in wind speed, the amplitude ratio and phase difference were relatively scattered. When the reduced wind speeds were beyond the vortex lock-in wind speed, the amplitude ratio and phase difference varied within a narrow range. As the reduced wind speed further increased, the fluctuations of amplitude ratio and phase difference were both reduced. In addition, the correlation between the single-frequency alongwind response and crosswind response was weak. While at the vicinity of vortex lock-in wind speed, the values of coherence functions at a lower structural damping ratio were commonly larger than 0.8 over a wide frequency range, which suggested a stronger correlation between the couple response and the crosswind response.
Footnotes
Declaration of Conflicting Interests
The author(s) declared no potential conflicts of interest with respect to the research, authorship, and/or publication of this article.
Funding
The author(s) disclosed receipt of the following financial support for the research, authorship, and/or publication of this article: This study was funded by the 111 Project (B18062) and the 1000 Foreign Experts Program (B13002) in China, the Fundamental Research Funds for the Central Universities (No. 106112017CDJQJ208849), and National Natural Science Foundation of China (No. 51720105005).