



Abstract
Eight L-shaped rigid models with different geometric dimensions were tested at four typical terrain categories in a boundary wind tunnel to investigate the characteristics of wind pressures on L-shaped tall buildings. The effects including wind direction, turbulence intensity, and geometric dimension on the characteristics of wind pressures on L-shaped tall buildings were studied. Shape factors of each face under the unfavorable wind direction were summarized. Moreover, the power spectral densities, correlation coefficients, and coherence functions were analyzed in frequency domain. Based on the testing results, it is shown that the proposed exponential functions fit the measurements well. The objective of this study is to provide useful information for the wind-resistant design ofL-shaped tall buildings.
Keywords
Introduction
With the rapid development of new building materials and advanced construction technologies, tall buildings are becoming higher, lighter, and more flexible and their shapes tend to be more irregular and unconventional than those in the past. Moreover, current wind codes and standards (Architectural Institute of Japan (AIJ), 2004; AS/NZS: 1170.2:2002, 2002; ASCE: 7-10, 2010; GB 50009-2012, 2012; National Research Council of Canada, 1995) are mainly intended for the evaluation of wind effects on tall buildings with regular and symmetric shapes. However, it has been recognized that the external shapes of tall buildings significantly affect the wind loads on tall buildings (Li et al., 2019; Quan and Gu, 2012; Xu et al., 2018). Therefore, it is necessary to conduct extensive research works on the wind loads on tall buildings with irregular and asymmetric shapes.
Kwok (1988) investigated the effect of building shape on the wind-induced responses of rectangular tall buildings based on wind tunnel tests. Hayashida and Iwasa (1990) studied the effect of building shapes on aerodynamic forces and displacement response by changing the cross sections of buildings. Stathopoulos and Zhou (1993) adopted numerical simulation methods to predict the wind pressures on the surfaces of various buildings with sharp corners. Kawai (1998) discussed the effects of corner cut and recession on aeroelastic instabilities for square and rectangular prisms by wind tunnel tests. It was found that small corner cut and recession could effectively prevent aeroelastic instability by increasing the aerodynamic damping, while large corner cut and recession would promote the instability at low-wind velocity. Tamura and Miyagi (1999) investigated the effect of corner modification on aerodynamic forces and found the rounded corners could reduce the drag force. Both wind tunnel testing and numerical simulation approach were adopted by Gomes et al. (2005) to investigate the wind effects on L- and U-shaped models for incident wind directions varying from 0° to 180°. Gu (2009) carried out wind tunnel tests on 27 typical tall building models by synchronous multi-pressure sensing system (SMPSS) and high-frequency force balance (HFFB) techniques and analyzed the characteristics of wind-induced pressures and forces on these buildings. Lam et al. (2009) measured the dynamic wind loads on a number of H-shaped tall buildings for all wind incidences with the HFFB technique in wind tunnel tests and discussed the size effects of recessed cavities on the dynamic wind loads. Merrick and Bitsuamlak (2009) performed a series of wind tunnel testing to investigate the effects of building shapes on the wind-induced response of tall buildings including square, circular, triangular, rectangular, and elliptical shapes. Cao et al. (2012) carried out wind tunnel experiments on 1:67 scaled models of a series of medium-rise buildings to study the wind-induced pressures on multilevel flat roofs. Li et al. (2013) evaluated the feasibility of wind turbines installed in the Pearl River Tower for wind-power generation and evaluated the wind pressure distributions on the tall building with irregular shape. Kim and Kanda (2013) investigated the spatial-temporal characteristics of pressure fluctuations through a series of wind pressure measurements. Chakraborty et al. (2014) investigated the wind pressure distribution on a “+”shaped tall building using wind tunnel testing and numerical simulation. Li and Li (2016) and Li et al. (2017) investigated the across-wind loads and wind-induced torques on L-shaped tall buildings. Although a number of studies have been conducted for investigation of the wind effects on tall buildings with various shapes, these studies lack systematic and comprehensive investigations of wind pressure distributions onL-shaped tall buildings.
In this article, a series of L-shaped tall building models are tested in a boundary layer wind tunnel by the SMPSS technique to investigate the characteristics of wind pressures on these buildings. The experimental results are then analyzed in both time and frequency domains. The outputs of this study are expected to provide useful information and reference for the wind-resistant design of L-shaped tall buildings.
Wind tunnel experiments
Features of approaching wind flows
The experiments were carried out in a boundary layer wind tunnel at Hunan University, China. The dimensions of the working section are 20 m long, 3.0 m wide, and 2.5 m high. Spires and roughness elements were used to simulate four typical boundary layer wind flows specified in the Loads Standard Code of China (GB 50009-2012) as exposure categories A–D. The corresponding terrain types specify the mean wind speed profiles with power law exponent of 0.12, 0.15, 0.22, and 0.30, respectively. Mean wind speeds of the approaching wind flows at the reference height of 0.60 m above the tunnel floor were set as 12 m/s. The simulated profiles of mean wind speed and turbulence intensity are illustrated in Figure 1. It can be found that the simulated profiles agree well with those specified in the Chinese design code (GB 50009-2012, 2012). The turbulence integral length scales of the approaching wind flows at the reference height are 0.32, 0.42, 0.46, and 0.53 m for the terrain categories A–D, respectively, which are equivalent to 160, 210, 230, and 265 m in prototype, while the geometric scale of the models is set as 1/500. The longitudinal velocity spectra of the simulated boundary layer flows at the reference height are plotted in Figure 2, which are in good agreement with the von Karman spectrum. In addition, the uniform flow is also considered in this study for comparison purpose.
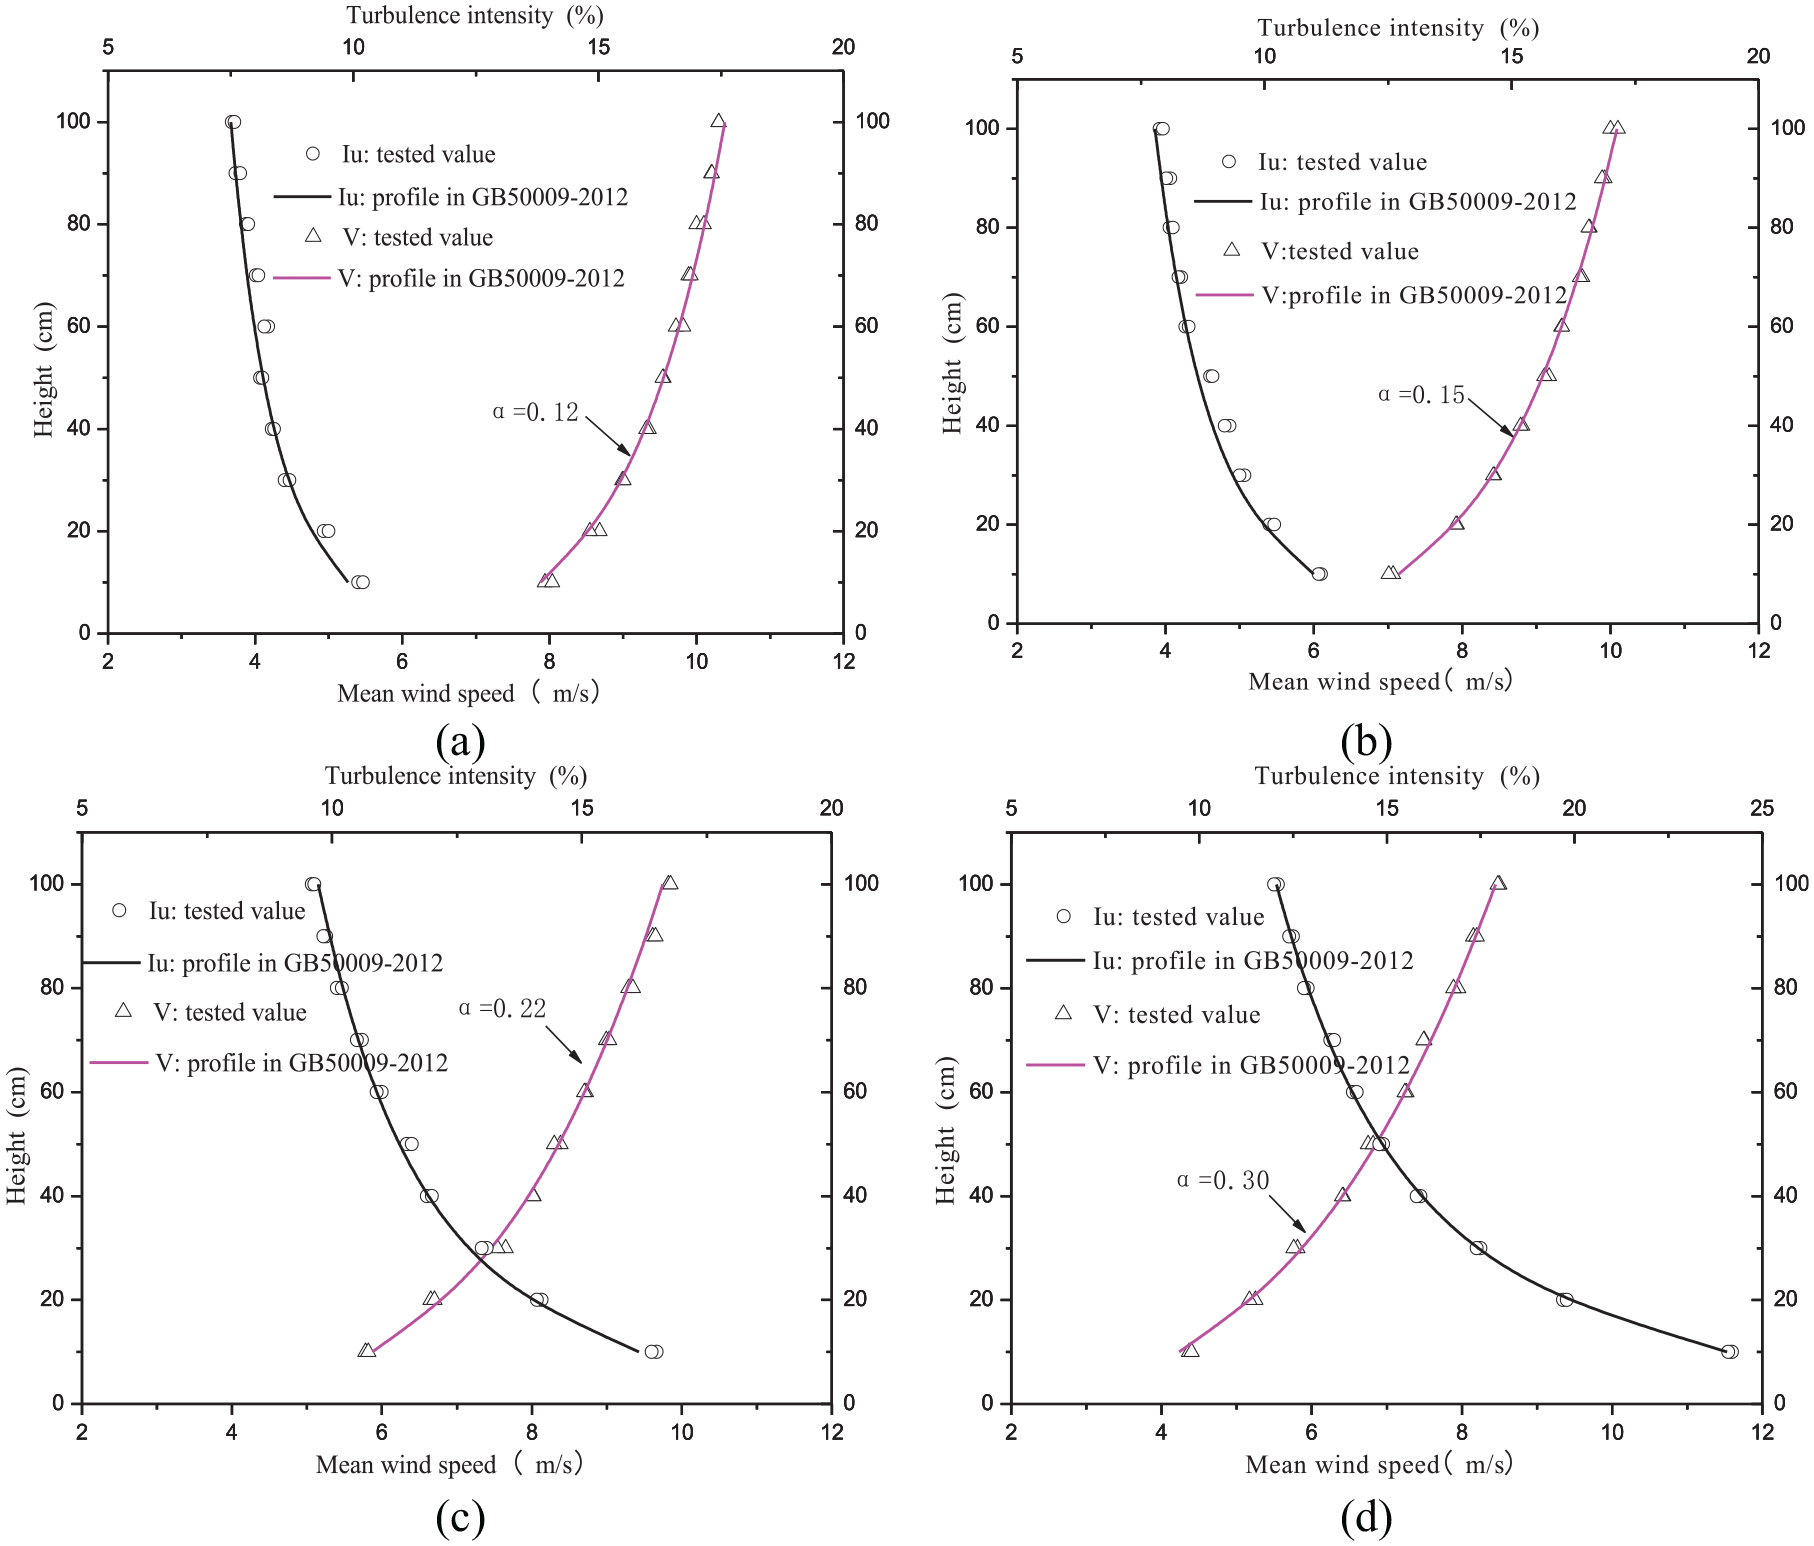
Mean wind speed and turbulence intensity profiles in different terrain categories: (a) category A, (b) category B, (c) category C, and (d) category D.

Longitudinal velocity spectra at the reference height in different terrain categories: (a) category A, (b) category B, (c) category C, and (d) category D.
Experimental setup
In order to investigate the characteristics of wind loads on L-shaped tall buildings, eight models with different L shapes (called M1, M2, M3, M4, M5, M6, M7, M8) were made and a building model with rectangular section (called MR) was also considered for comparison purpose. Table 1 displays the geometric parameters of the models used in the wind tunnel test. It can be seen that M1, M2, M3, M5, M7, and M8 are L-shaped models with different side ratios, while M4, M5, and M6 are those with different aspect ratios.
Geometric parameters of the test models.

All the test models were made of ABS (acrylonitrile–butadiene–styrene) material to ensure the strength and rigidity of the models. The pressure taps on the models were connected to the electronic pressure scanning modules by plastic tubes. Numerical compensation was employed to correct the tubing effects before data processing (Li, 2014). The maximum blockage ratio for the tested models at attack angle of 0° was about 1.3%, which was acceptable in wind tunnel tests, so that no correction for the blockage effect was made to the pressure measurements in this study.
Figure 3 shows the definition of wind direction and location of pressure taps used in this wind tunnel test. Pressure measurements on the L-shaped models were conducted for wind direction from 0° to 360° at 10° intervals, while the pressure measurements on the rectangular model were performed for wind direction from 0° to 90° at 5° intervals. Electronic pressure scanning modules (Scanivalve Inc., USA) were used to measure instantaneous wind-induced pressures on the surfaces of the buildings. The data sampling frequency was 312.5 Hz and the sampling length was 32 s for each pressure recording.
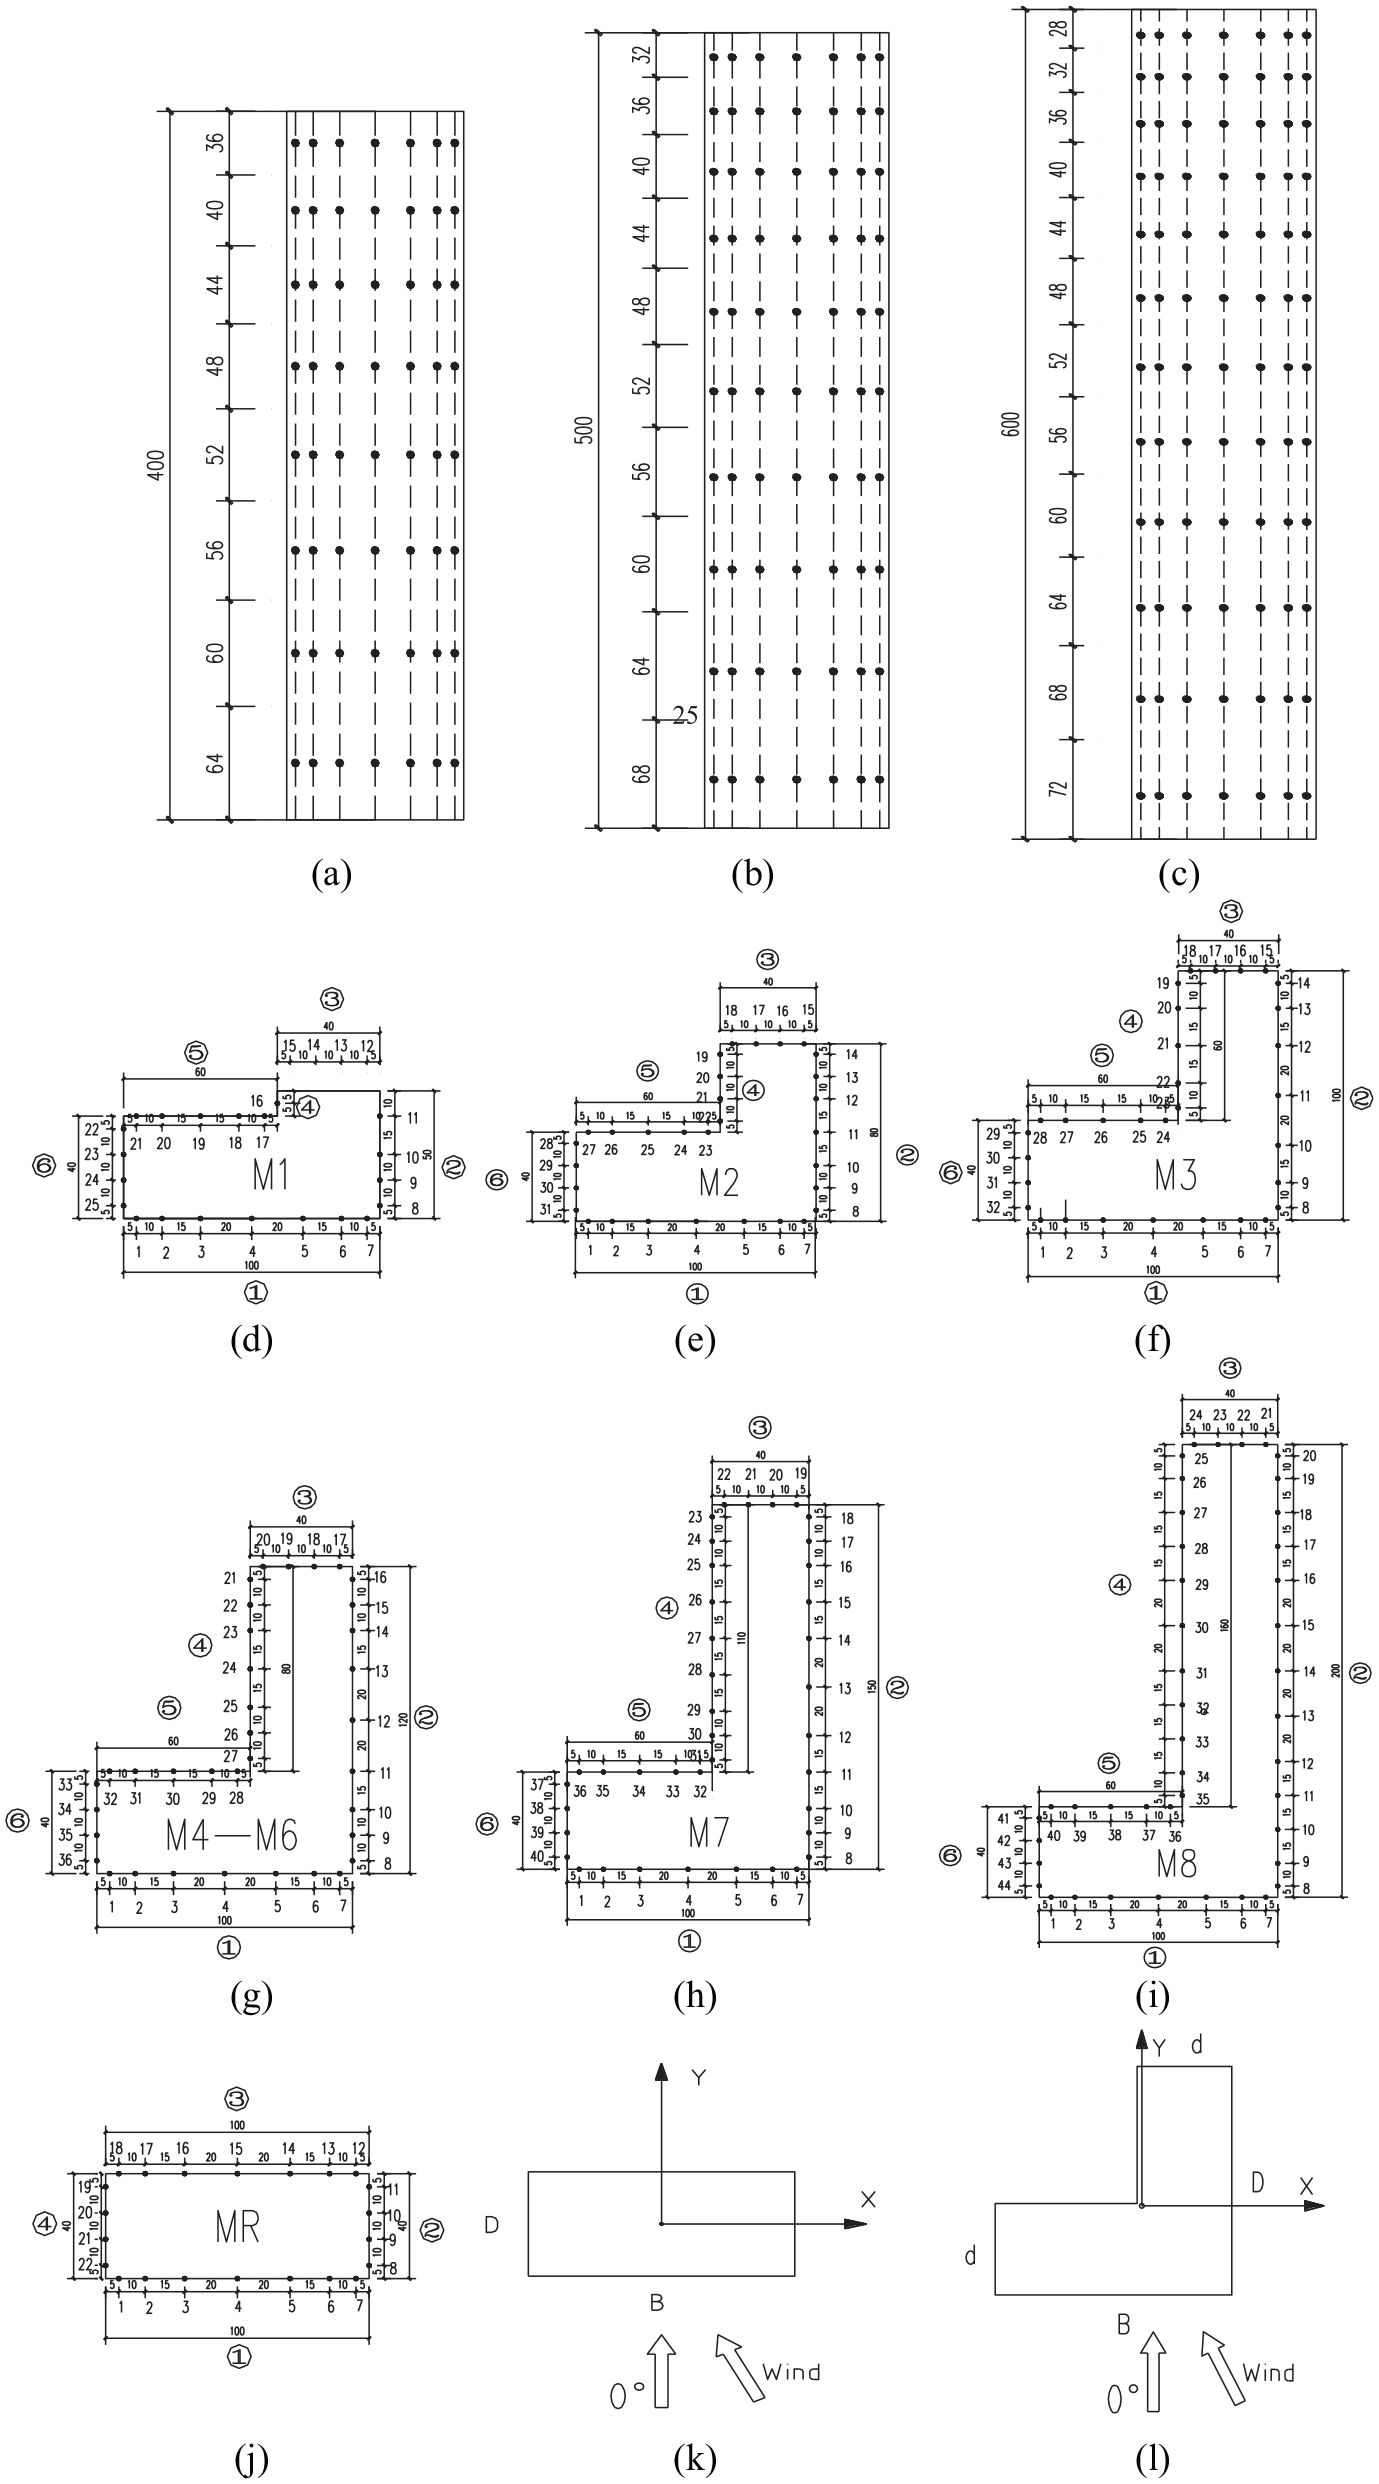
Definition of wind direction and location of pressure taps: (a)–(c) measurement layers, (d)–(j) distribution of pressure taps, and (k) and (l) definition of wind direction.
Data processing
The wind pressure coefficient

where
The mean wind pressure coefficient


where T is the sampling time and N is the sampling length.
Wind pressures on rectangular and L-shaped tall buildings
In order to investigate the variations of the wind pressures on the rectangular and L-shaped tall building models with wind direction, the results from the pressure taps along the central line of models MR and M3 are considered herein. Due to the space limit, only the test results of typical pressure taps at the fourth layer for the approaching wind flow over the terrain of category B are presented now.
Figure 4 shows the wind pressure coefficients at typical pressure taps on model MR under different wind directions, and it can be seen that the mean and RMS pressure coefficients of the rectangular tall building varied symmetrically with the wind direction. The maximum mean positive pressure on each face occurs when the incoming flow was perpendicular to the corresponding building surface. The minimum mean negative pressure on each face usually occurred when the incoming flow was parallel to the corresponding face. However, the minimum mean negative pressures on faces 2 and 4 are smaller than those on faces 1 and 3, since broader windward building surface can speed up the flow separation (Holmes, 2001). The separation of flow would further enhance the fluctuating pressures, so the unfavorable wind direction for the maximum RMS pressure coefficients was consistent with that of the minimum mean negative pressure.

Variation of wind pressure coefficients at typical taps of model MR with wind direction.
Figure 5 shows the variation of wind pressure coefficients at typical pressure taps on model M3 with different wind directions. The mean and RMS pressure coefficients on faces 1–3 and 6 of the L-shaped tall building are similar with those on faces 1–4 of the rectangular tall building, although slight differences still exist for the building models with different widths. In general, the maximum mean and RMS pressure coefficients of the L-shaped tall building in different wind directions are quite close to those of the rectangular tall building. The significant differences between the two building models are the wind pressure distributions at the corners (faces 4 and 5) of the L-shaped tall building. For the L-shaped tall building, larger mean positive pressure coefficients occurred in the wind directions from 180° to 270° and reached the maximum values in the wind direction of 225°. The minimum mean negative pressure coefficients were observed in the wind directions of 110°, 140°, 310°, and 340°, where the maximum RMS pressures were also found. The maximum RMS pressures on faces 4 and 5 of the L-shaped tall building were apparently smaller than those on the other faces due to the shielding effects.
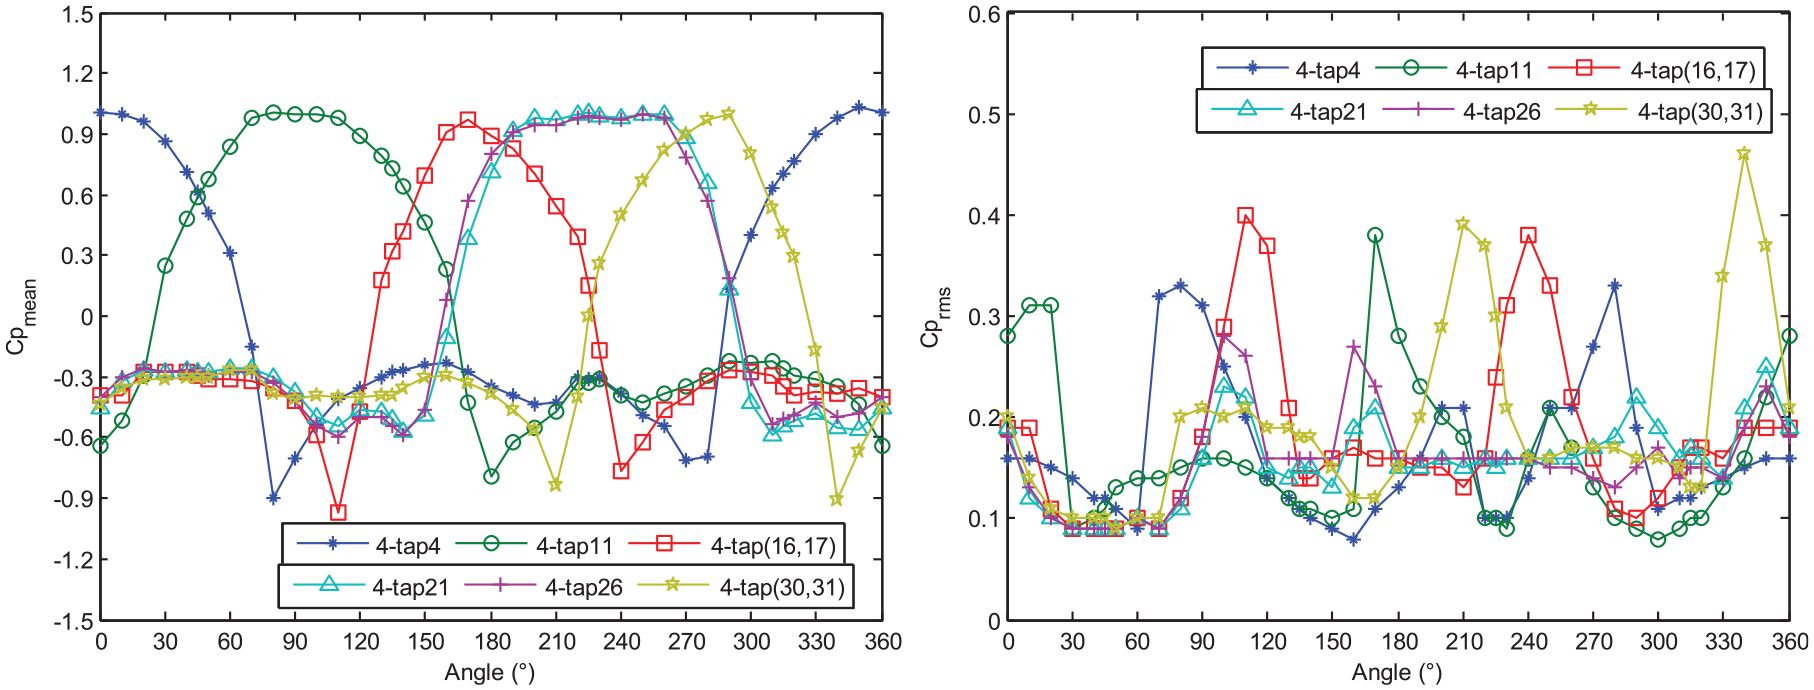
Variation of wind pressure coefficients at typical taps of model M3 with wind direction.
Time domain analysis of the results from L-shaped tall buildings
Pressure coefficients
To identify the effects of different terrains on the wind pressures on L-shaped tall buildings, typical pressure taps (taps 21 and 26 at the fourth layer) on model M3 are considered herein. Figures 6 and 7 show the variation of the mean and RMS pressure coefficients in different terrains with the wind direction. As shown in Figure 6, the different terrains have negligible effects on the variations of the mean pressure coefficients with the wind direction. Meanwhile, large variations of the RMS pressure coefficients are observed for different terrains as illustrated in Figure 7, indicating that the different upstream terrains mainly affect the fluctuating pressures. Large values of the RMS pressure coefficients were observed in certain wind directions under the uniform flow, which may be caused by turbulence induced from the L-shaped building.
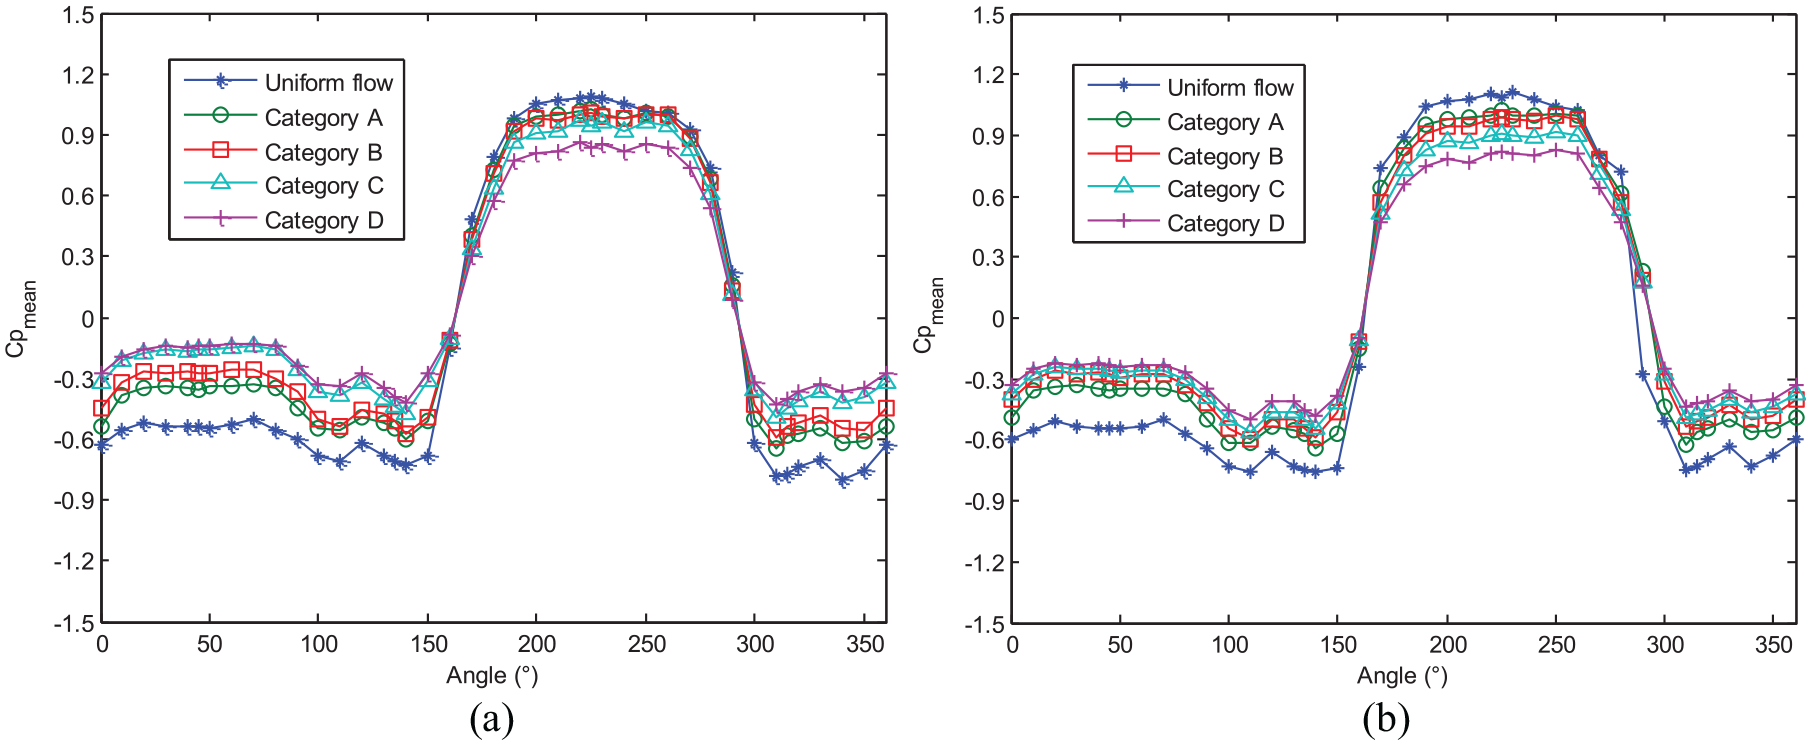
Variation of mean pressure coefficients at typical taps in different terrain categories with wind direction: (a) tap 21 and (b) tap 26.

Variation of RMS pressure coefficients at typical taps in different terrain categories with wind direction: (a) tap 21 and (b) tap 26.
Figure 8 shows the variation of the mean and RMS pressure coefficients at typical taps on model M5 with wind direction. For models M3 and M5, the side ratio is increased from 1.0 to 1.2. Compared with Figure 5, with the increase of side ratio for the L-shaped tall buildings, relatively slight changes are observed for the mean and RMS pressure coefficients. Nevertheless, the wind directions for larger mean positive pressures on faces 4 and 5 are extended from 180° to 290°. This is because the increasing width broadens the windward angles. Figure 9 shows the variation of the mean and RMS pressure coefficients at typical taps on model M4 with the wind direction. The aspect ratio is changed from 4.0 for model M4 to 5.0 for model M5. It can be found that the mean pressure coefficients remain the same as the aspect ratio increases, but the RMS pressure coefficients are increased by 5%.
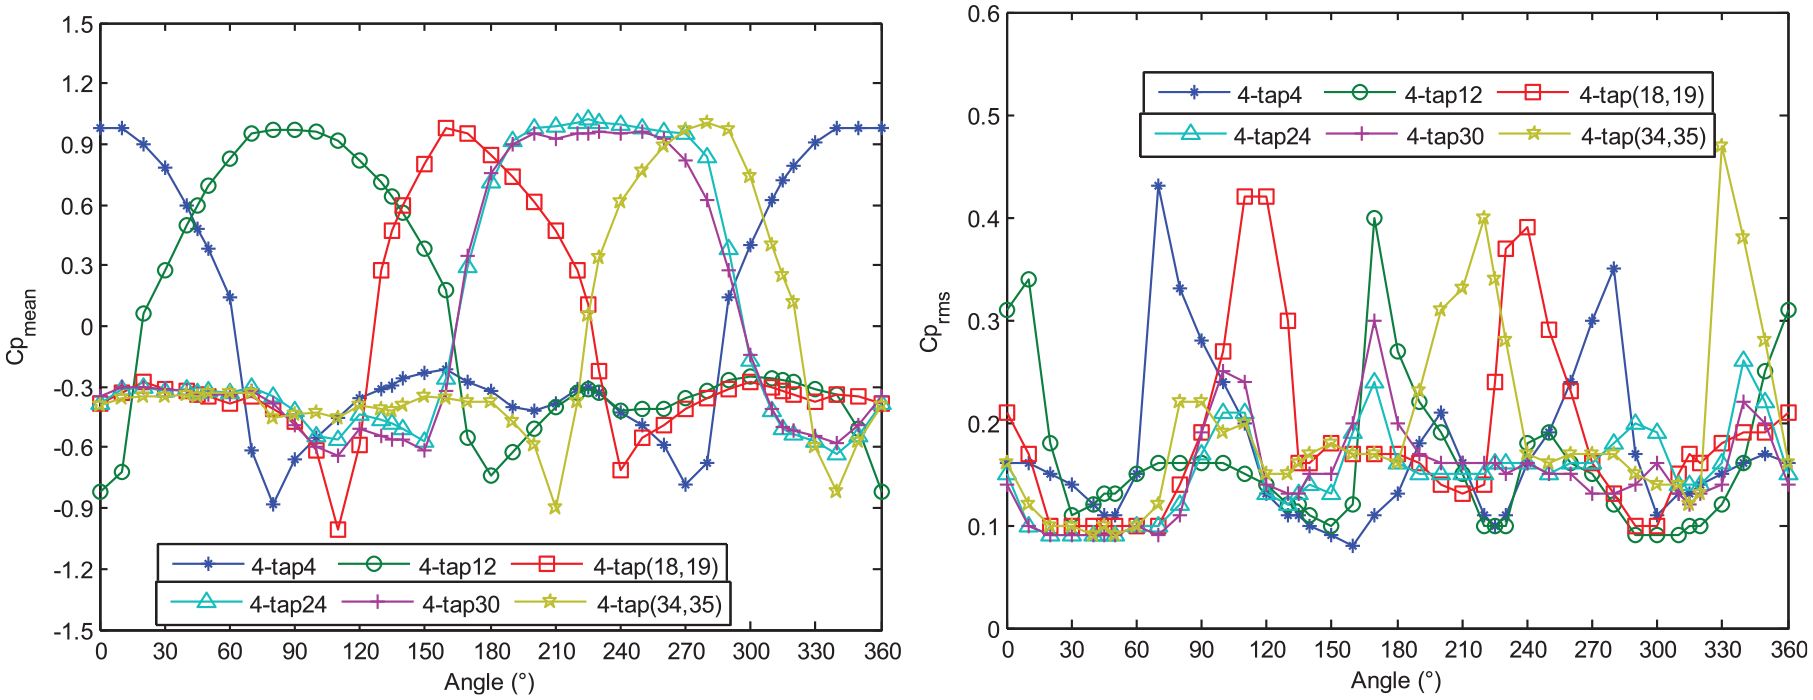
Variation of wind pressure coefficients at typical taps of model M5 with wind direction.
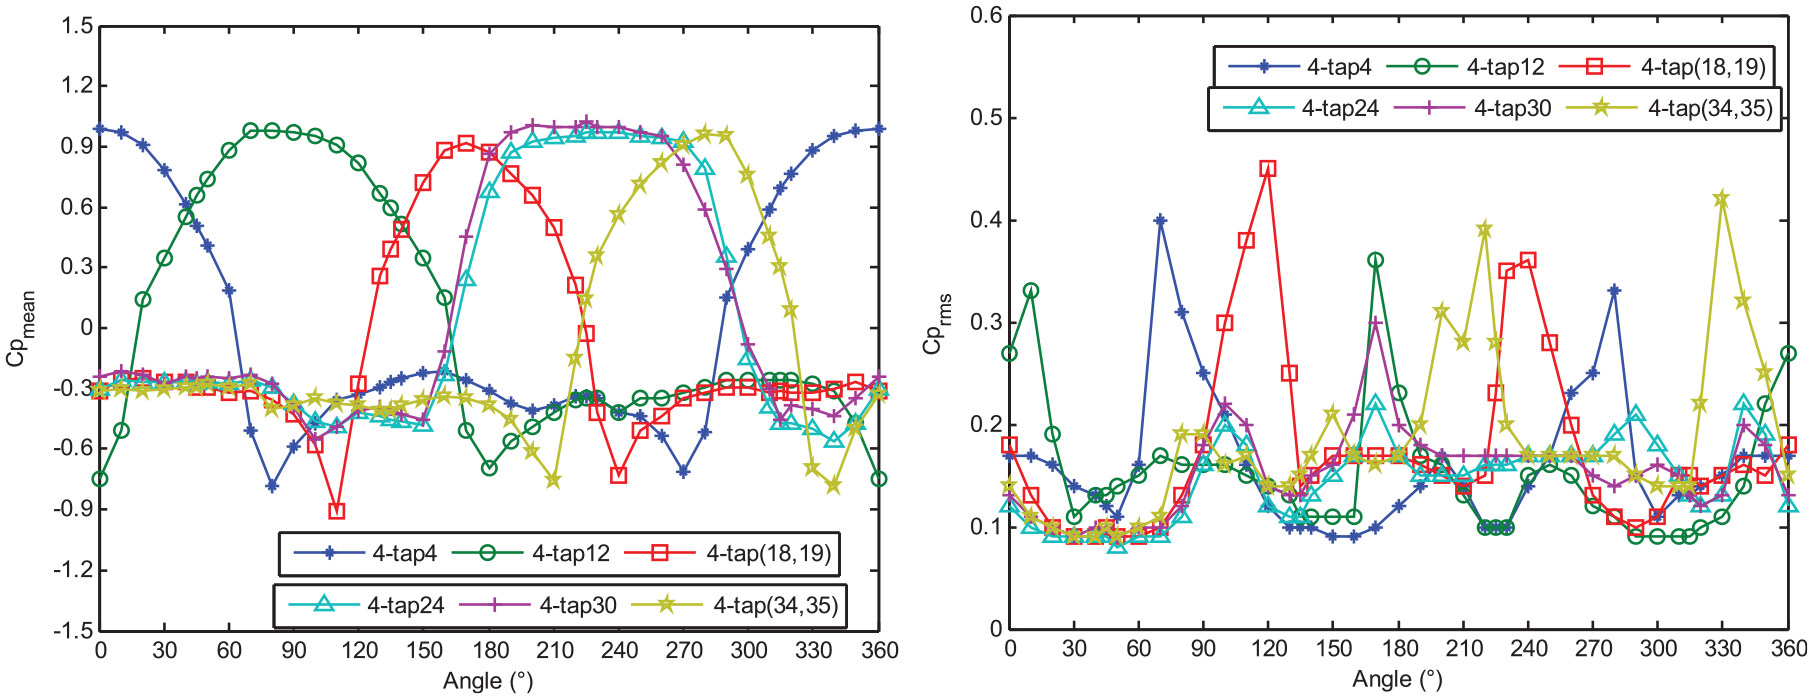
Variation of wind pressure coefficients at typical taps of model M4 with wind direction.
Shape factors
Shape factors are sometimes required in the wind-resistant design of tall buildings. Wind tunnel testing has been recognized as the main method to identify the shape factors of tall buildings, especially for buildings with complex shapes. Local shape factors of pressure tap i can be calculated by the following equation

where
For tall buildings with regular shape, global shape factors can be calculated by the following equation

where
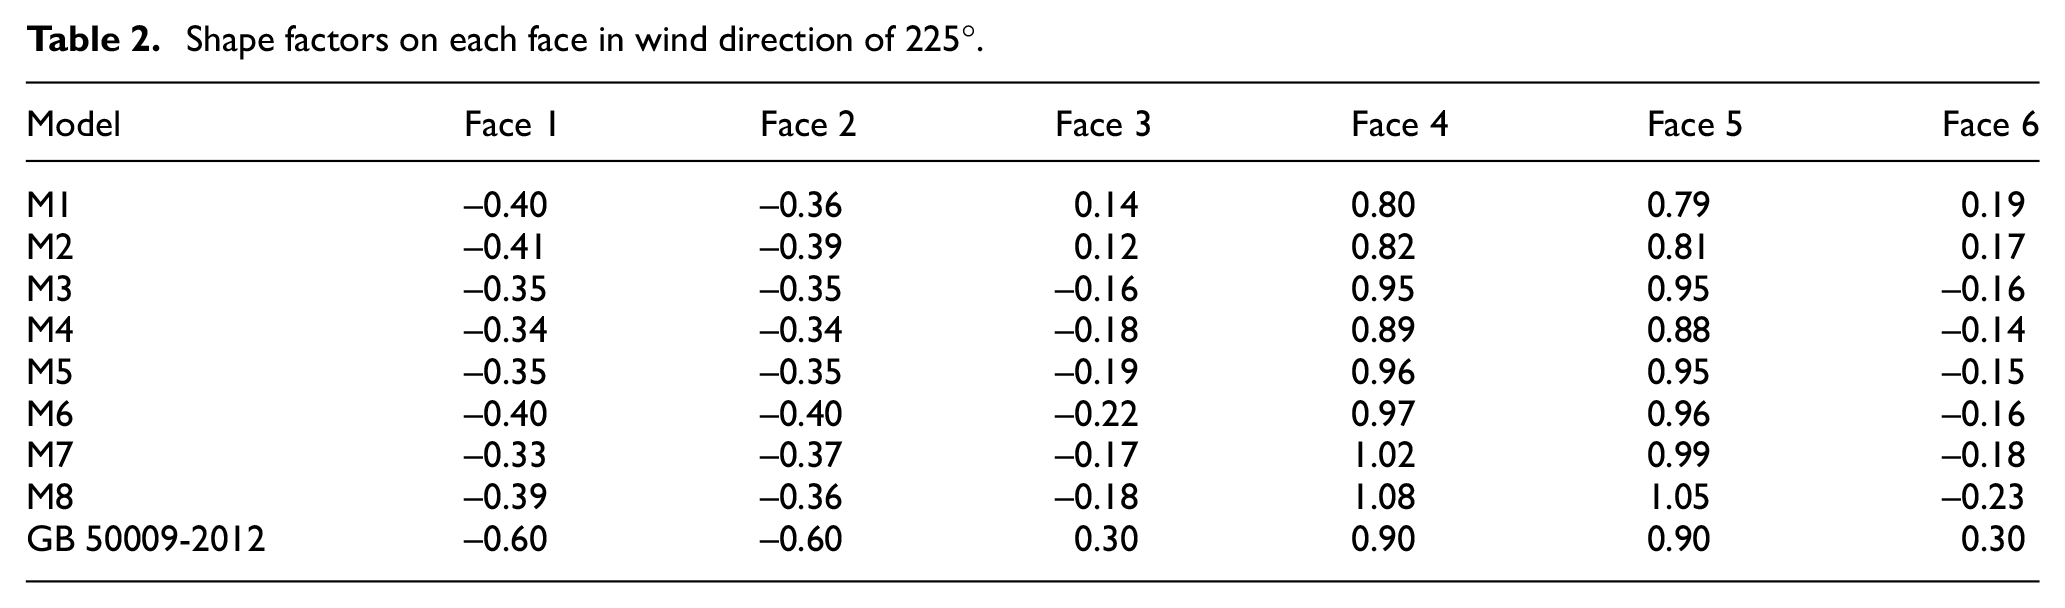
Since the shape factors are obtained by averaging the mean pressure coefficients of relevant taps, the shape factors are expected to vary with the wind direction in a similar pattern with those of the mean pressure coefficients. The shape factors on each face in the wind directions of 225° and 270° are provided herein and compared with the values suggested in the Chinese code (GB 50009-2012). Tables 2 and 3 show the shape factors of L-shaped tall buildings with different geometric dimensions in the wind directions of 225° and 270°. For wind direction of 225°, shape factors (absolute values) of faces 1 and 2 for all the models are evenly distributed at 0.37, which are smaller than the value 0.60 stipulated in the code. So, the D/B ratio has little effect on the shape factors of faces 1 and 2. However, shape factors of faces 4 and 5 gradually increase with the increase of side ratio and become even larger than those suggested in the code. When D/B is <1, shape factors of faces 3 and 6 are smaller than those suggested in the code. When D/B is ≥1, the values become negative, which are in opposite sign with those stipulated in the code, which should be paid more attention in the wind-resistant design of such tall buildings.
Shape factors on each face in wind direction of 225°.
Shape factors on each face in wind direction of 270°.
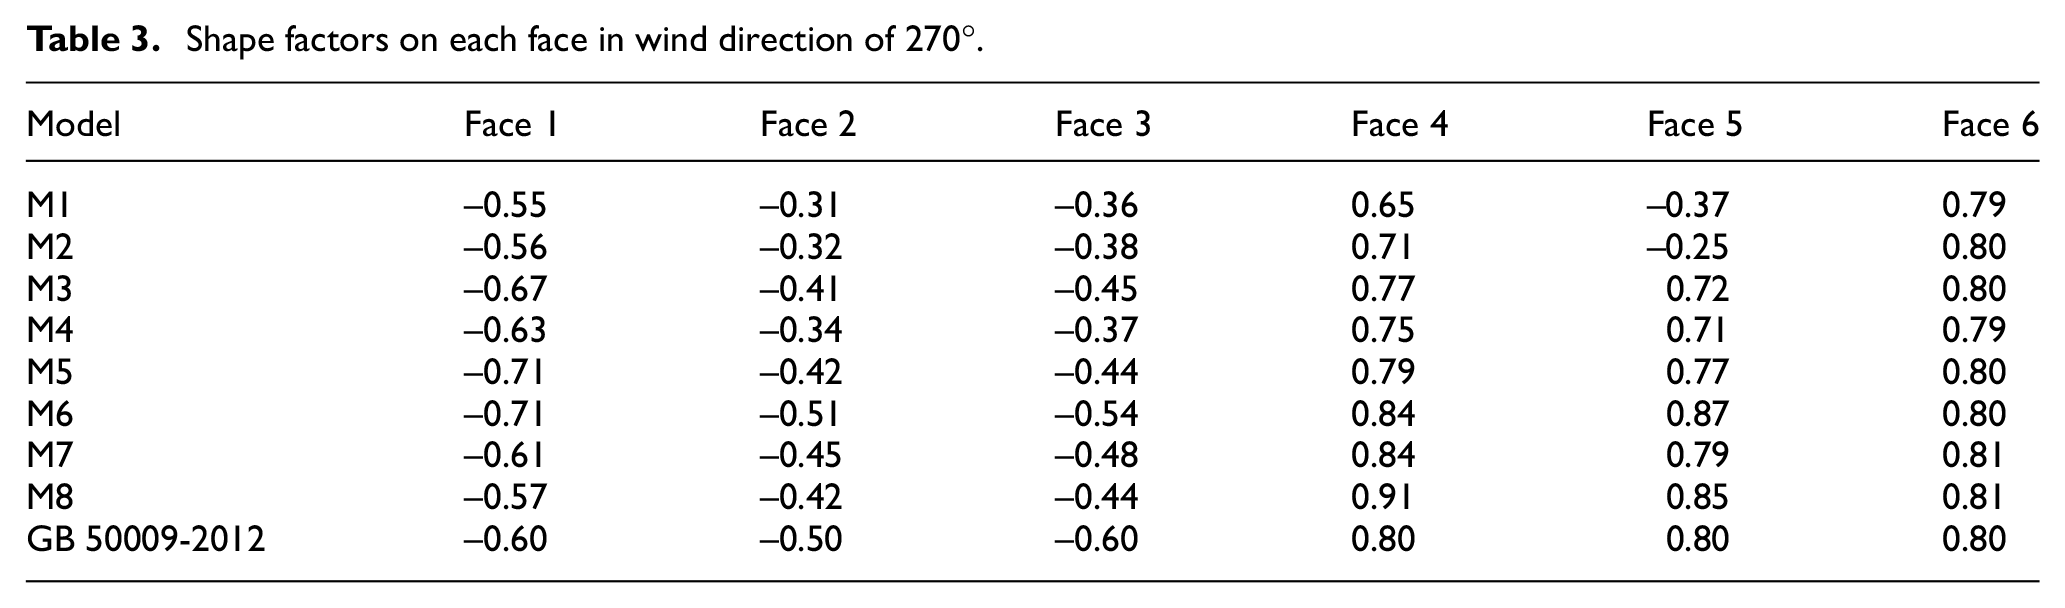
In wind direction of 270°, shape factors of faces 1 and 6 are close to the value suggested in the code. Although shape factors (absolute values) of faces 2 and 3 increase with the increase of the D/B ratio, their maximum values are still smaller than those stipulated in the code. Shape factors of face 4 are also increased with the D/B ratio. Nevertheless, shape factors of face 5 are negative and their absolute values are relatively small when D/B is <1. Once D/B is ≥1, shape factors of face 5 become positive and exceed the value suggested in the code when D/B ratio reaches 2.0. Generally speaking, slight growth is observed with the increase of the aspect ratio.
Frequency domain analysis
Power spectral densities
Taking model M3 as an example, Figure 10 presents power spectral densities (PSDs) of all the pressure taps at the fourth layer in wind directions of 225° and 270° over the terrain of category B. In the wind direction of 225°, PSDs of the pressure taps on faces 2–4 are similar with those on faces 1, 6, and 5. Dual-peak is observed in the spectra of face 2. The first peak is located at the reduced frequency of 0.067 initiated from the vortex shedding and the second peak occurs at a higher reduced frequency of 0.095 caused by flow separation. Although there is a distinct peak in the spectrum of tap D15, the energy level is quite low. Since face 4 is windward, the spectra of most taps are featured with a distinct peak, which rise from turbulence in the upstream flow. However, three spectral peaks of the middle tap D21 are observed at reduced frequencies of 0.095, 0.136, and 0.422. And the first peak coincides with those of taps on the windward face, which should result from the incoming turbulence. Meanwhile, the second peak may be caused by the backflow originated from the obstruction of face 5, which poses the highest energy level. In addition, the third peak is attributed to the interaction between the incoming turbulence and the backflow. In wind direction of 270°, PSDs of faces 4, 5, and 6 cover a wide frequency range and a distinct peak is observed in the spectra of pressure taps on face 4 near the corner. In addition, the spectrum of middle tap D26 is similar to that of tap D21 in wind direction of 225°, and three spectral peaks are also located at the identical reduced frequencies, respectively. Both faces 1 and 3 are side walls in wind direction of 270°. Thus, an obvious narrow-band peak is observed in the spectra, which is initiated by the vortex shedding. On face 3, the energy contents of pressure fluctuations are higher than those on face 1 and remain unchanged at different positions. In respect to face 1, the energy level is the highest at the pressure taps near the upwind corner and the lowest close to the downwind corner, which presents flow separation on the side wall. On the leeside (face 2), higher energy levels are recorded at the pressure taps close to the corner and lower energy at the middle of the face. This is consistent with the characteristics of wind pressure on the leeward surface of rectangular tall buildings (Ye and Gu, 2006).
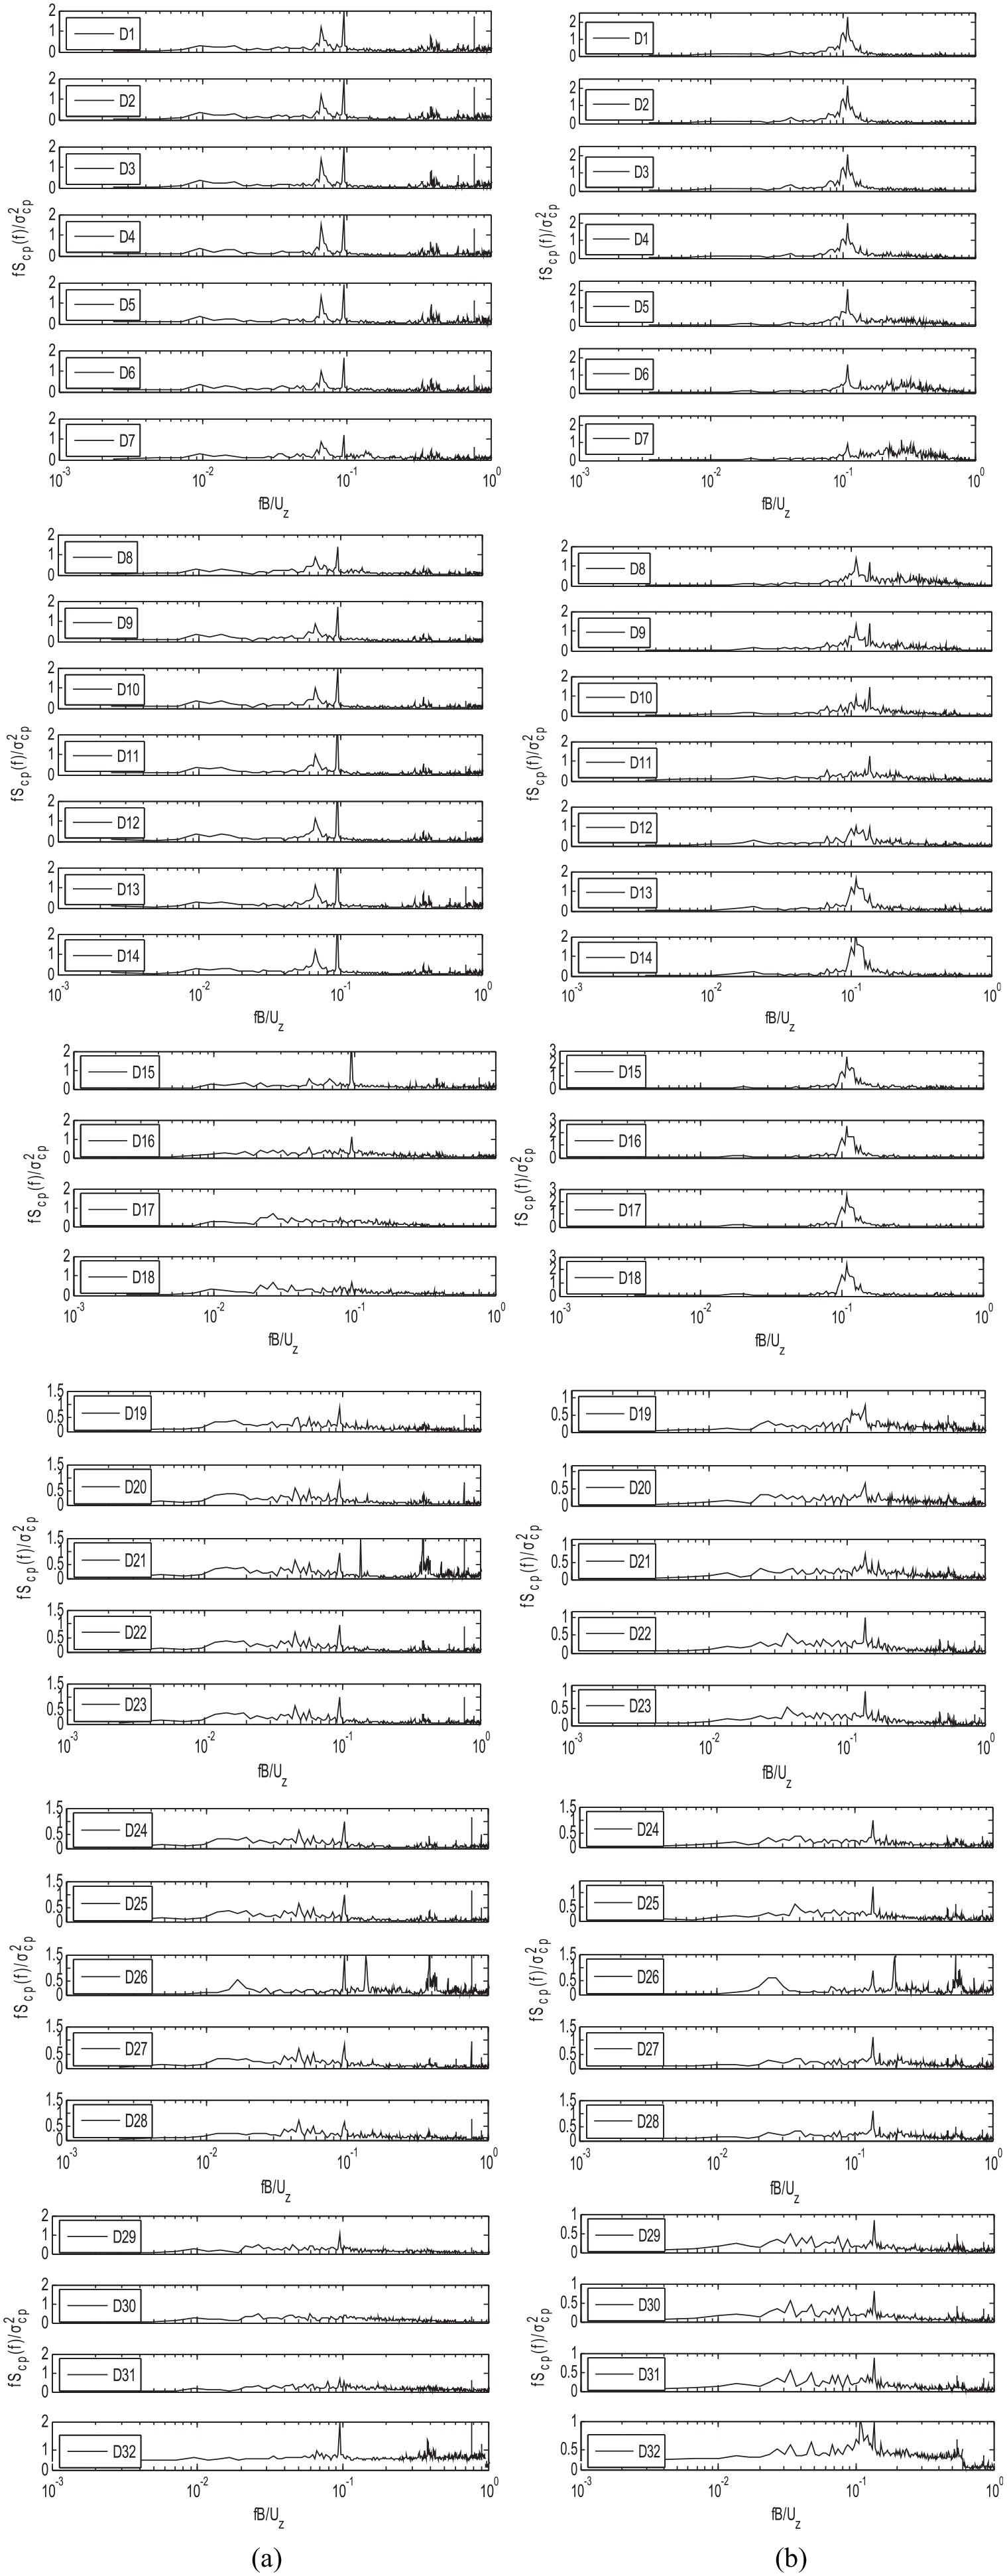
PSDs of fluctuating pressure coefficients on model M3 in category B: (a) 225° and (b) 270°.
Correlation coefficients
In this part, both horizontal correlation coefficients and vertical correlation coefficients are calculated as follows

where
Horizontal correlation coefficients
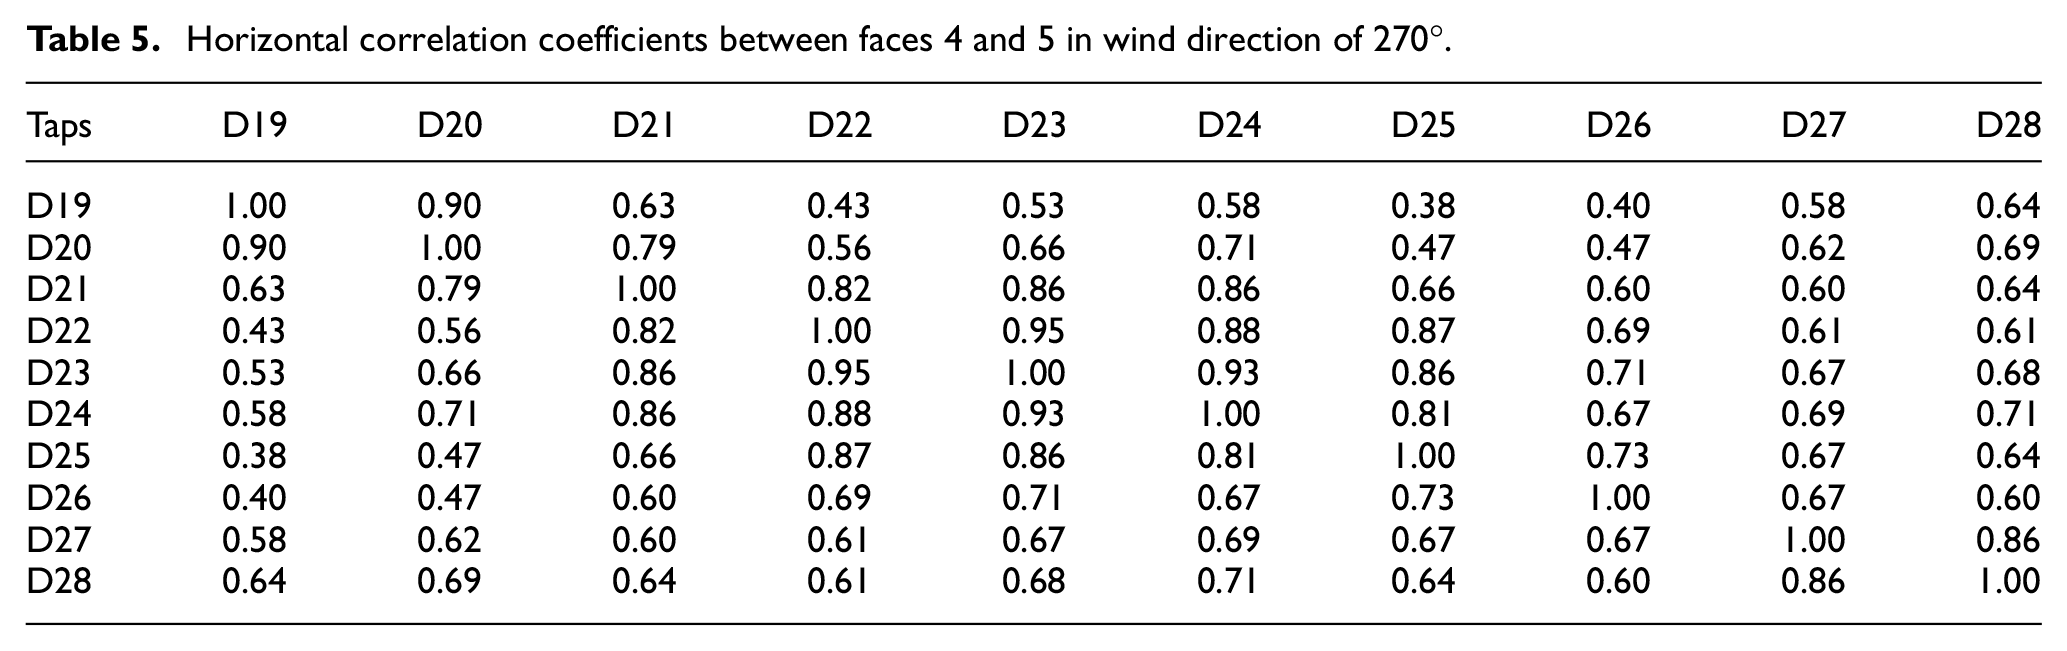
The pressure measurements at the fourth layer of model M3 in the terrain of category B are discussed and analyzed in this section. Tables 4 and 5 show the horizontal correlation coefficients between faces 4 and 5 in wind directions of 225° and 270°, respectively. It can be found out that horizontal correlation coefficients gradually decrease as the separation distance between the taps increases. And the horizontal correlation coefficients between the taps on face 4 are greater than those on face 5 in the wind direction of 270°. Moreover, pressure taps near the corner are in stronger correlation with other taps on the same face, which correspond to the backflow initiated by the corner. Meanwhile, the pressure taps on face 4 are positively correlated with the taps on face 5, which may result in unfavorable wind-induced responses. Horizontal correlation coefficients in wind direction of 225° are greater than those in wind direction of 270°, especially for the taps toward the corner.
Horizontal correlation coefficients between faces 4 and 5 in wind direction of 225°.

Horizontal correlation coefficients between faces 4 and 5 in wind direction of 270°.
Vertical correlation coefficients
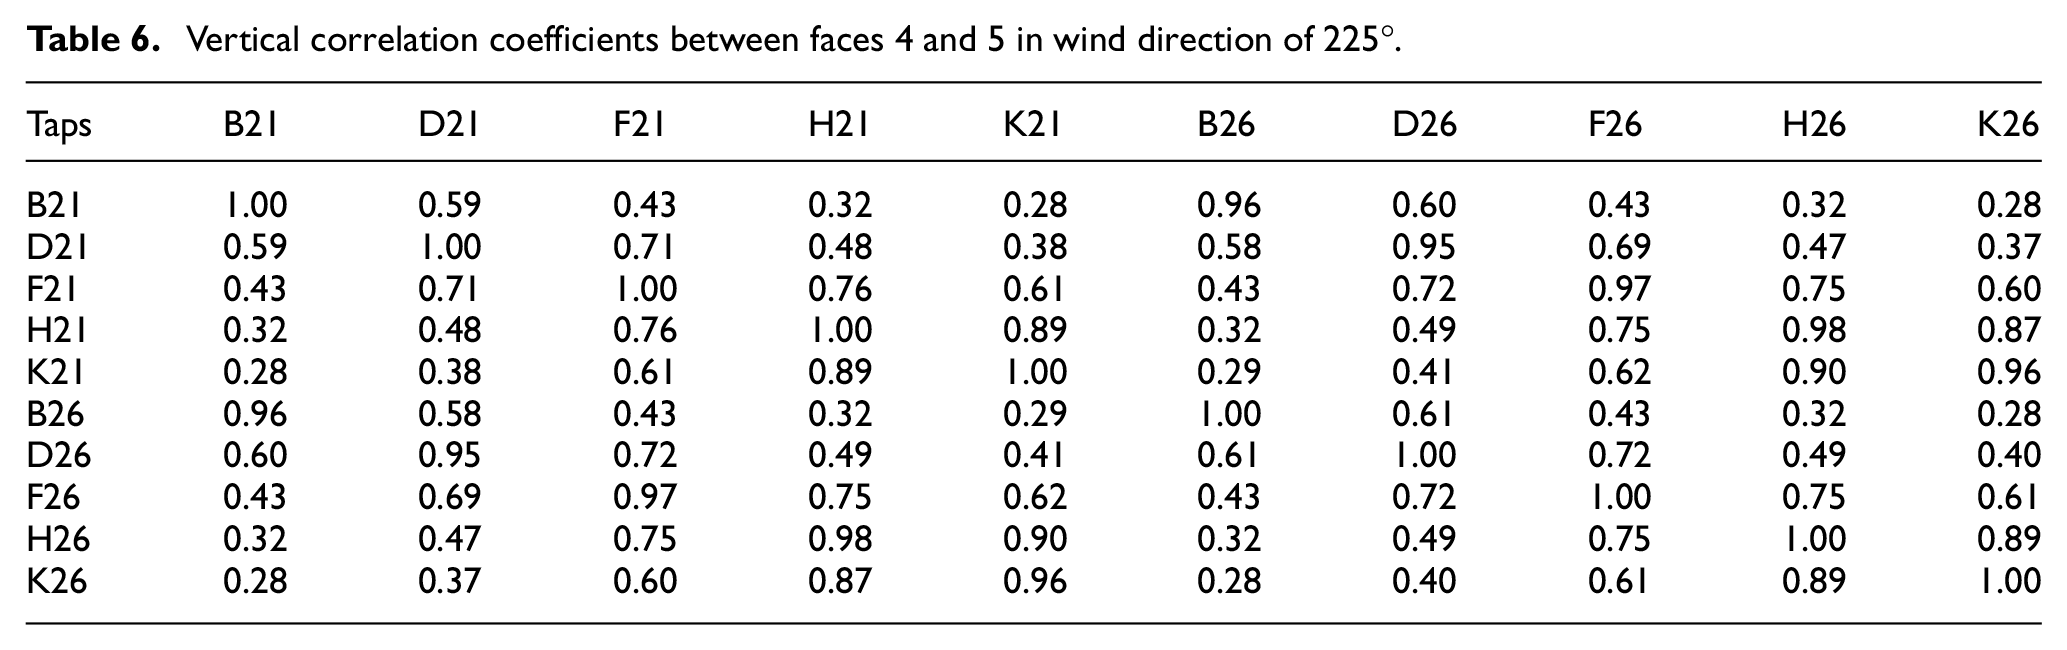
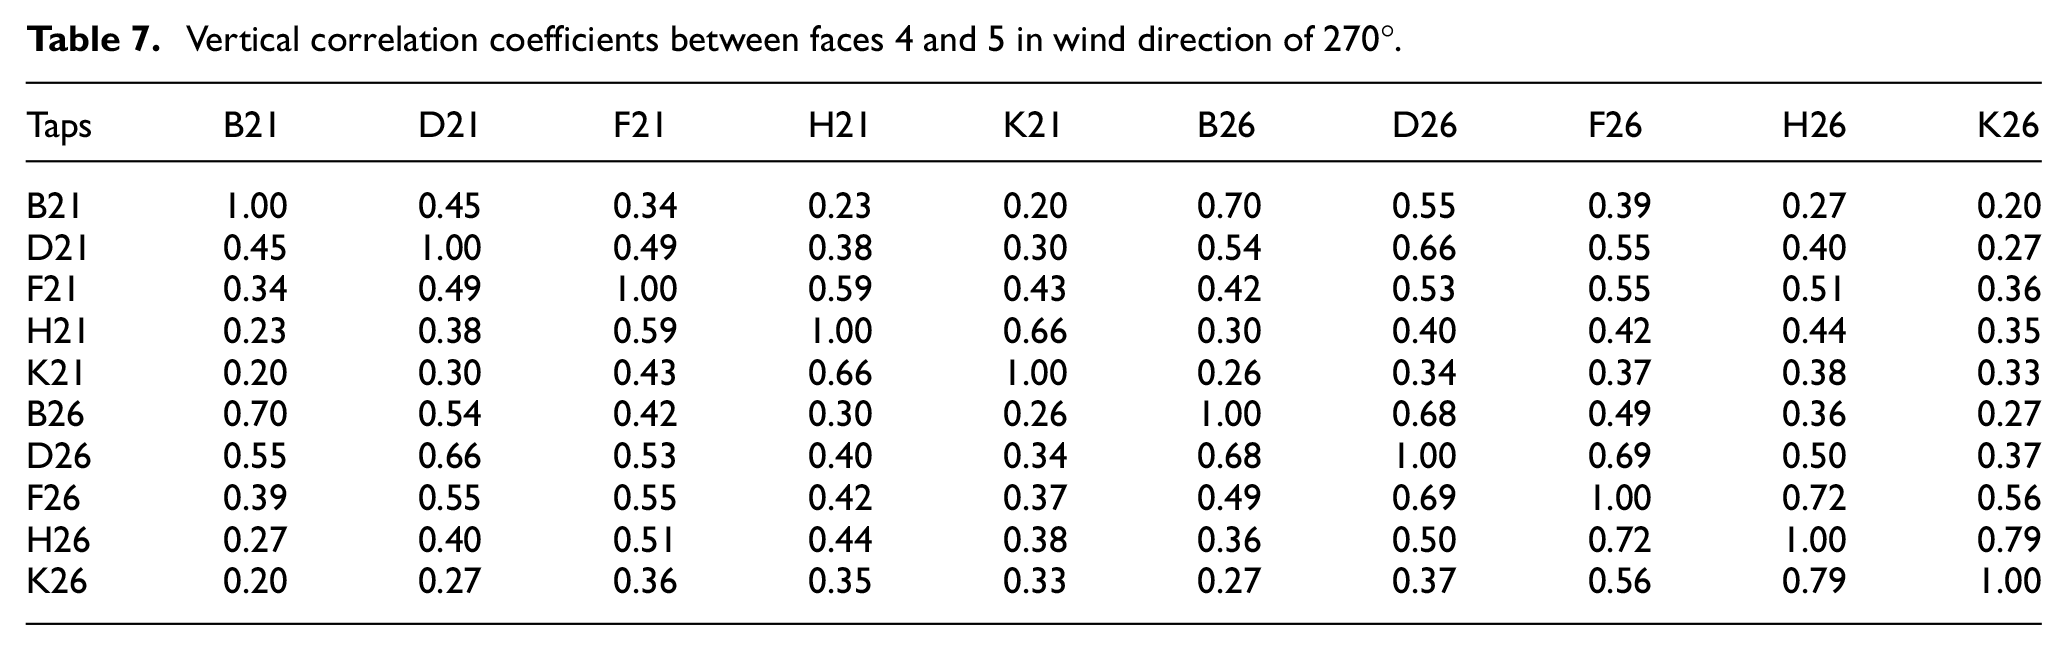
Tables 6 and 7 show the vertical correlation coefficients of faces 4 and 5 in wind directions of 225° and 270°, respectively. It can be seen that vertical correlation coefficients also attenuate with the increase of separation distance. In wind direction of 225°, the vertical correlation coefficients of face 4 are almost the same as those of face 5. It should be noted that the vertical correlation coefficients between the middle pressure taps (e.g. tap D21 and tap D26) are quite positive and the maximum value is even larger than 0.95. This phenomenon is believed to be caused by the backflow, which is also confirmed by the power spectra discussed previously. In wind direction of 270°, the vertical correlation coefficients of face 5 are greater than those of face 4, indicating that turbulence in the upstream flow is more significant than that in the backflow.
Vertical correlation coefficients between faces 4 and 5 in wind direction of 225°.
Vertical correlation coefficients between faces 4 and 5 in wind direction of 270°.
Coherence functions
Coherence functions are useful to describe the characteristics of wind loads and are essential to estimate wind-induced response of structures using the spectral method. Therefore, both the horizontal and vertical coherence functions are presented and discussed herein. Davenport (1965) proposed an exponential law to best fit the coherence function of fluctuating wind speeds on the basis of a large amount of field measurements. And the following equations are adopted to fit the horizontal and vertical coherence functions


where
Horizontal coherence function
Figures 11 and 12 show the horizontal coherence functions between typical taps of model M3 in wind direction of 225° and 270°, respectively. The exponential functions are adopted to fit the test results. In wind direction of 225°, the proposed formula can effectively fit the test results and the exponential value is about 3.0, which is close to that of fluctuating wind speed. In wind direction of 270°, face 4 is normal to wind flow and the horizontal coherence function is almost the same as that in wind direction of 225°. However, the horizontal coherences of typical taps on face 5 drop rapidly to about 0.2 in the low-frequency range and fluctuate over the higher frequency range, which is directly related to the complex wind flow in the vicinity of the surface. Although discrepancies still exist between the fitted curves on the basis of the proposed formula and the experimental measurements, the exponential function represents the characteristics of the horizontal coherence function.
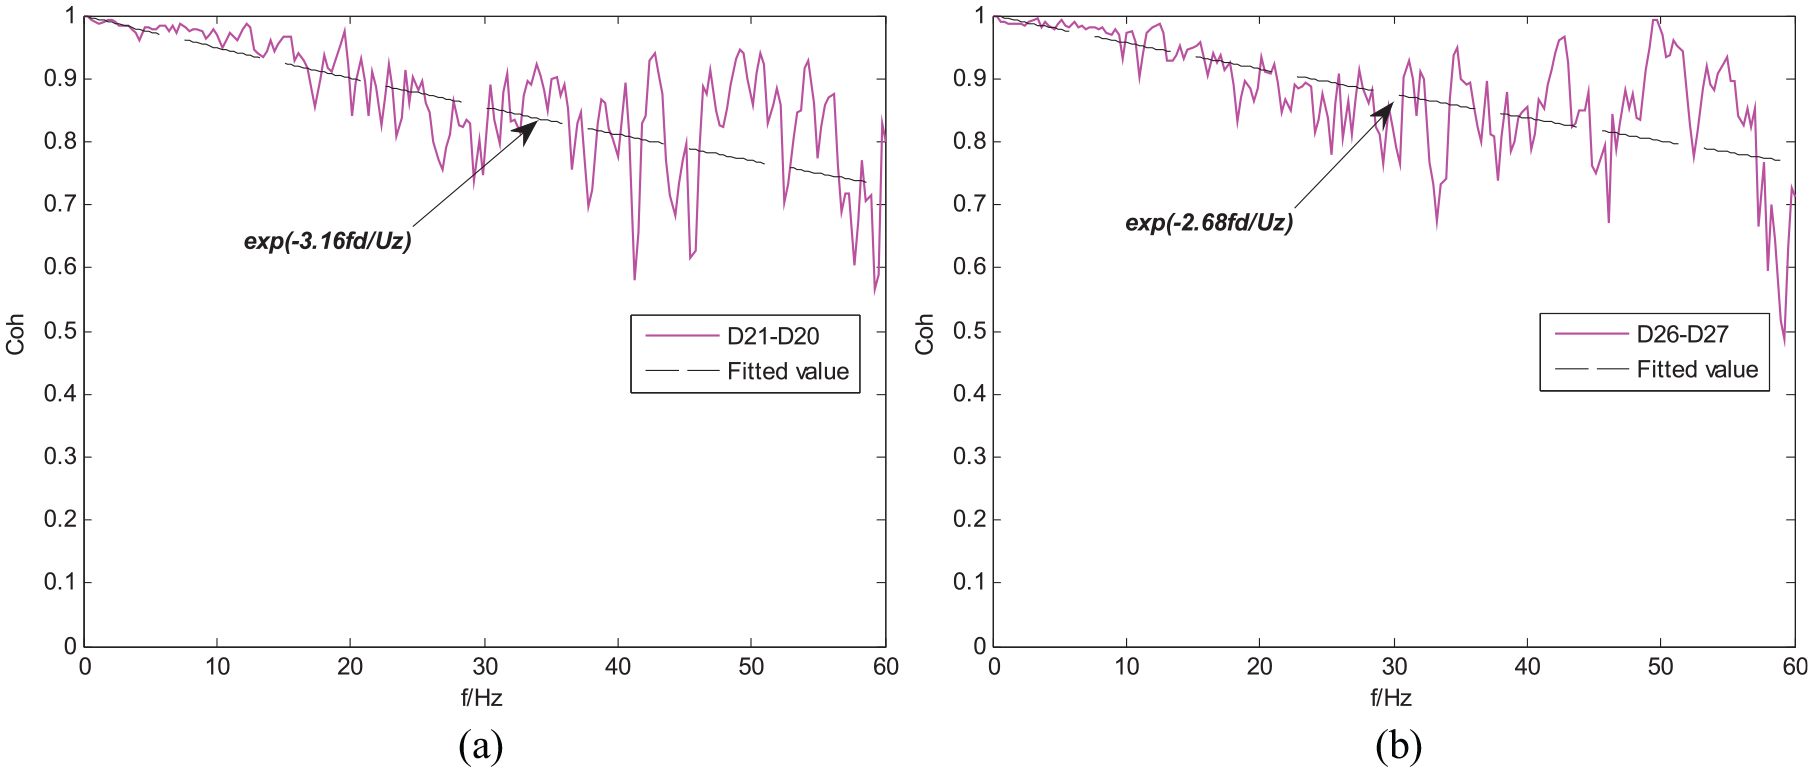
The horizontal coherence function between typical taps of model M3 in wind direction of 225°: (a) face 4 and (b) face 5.
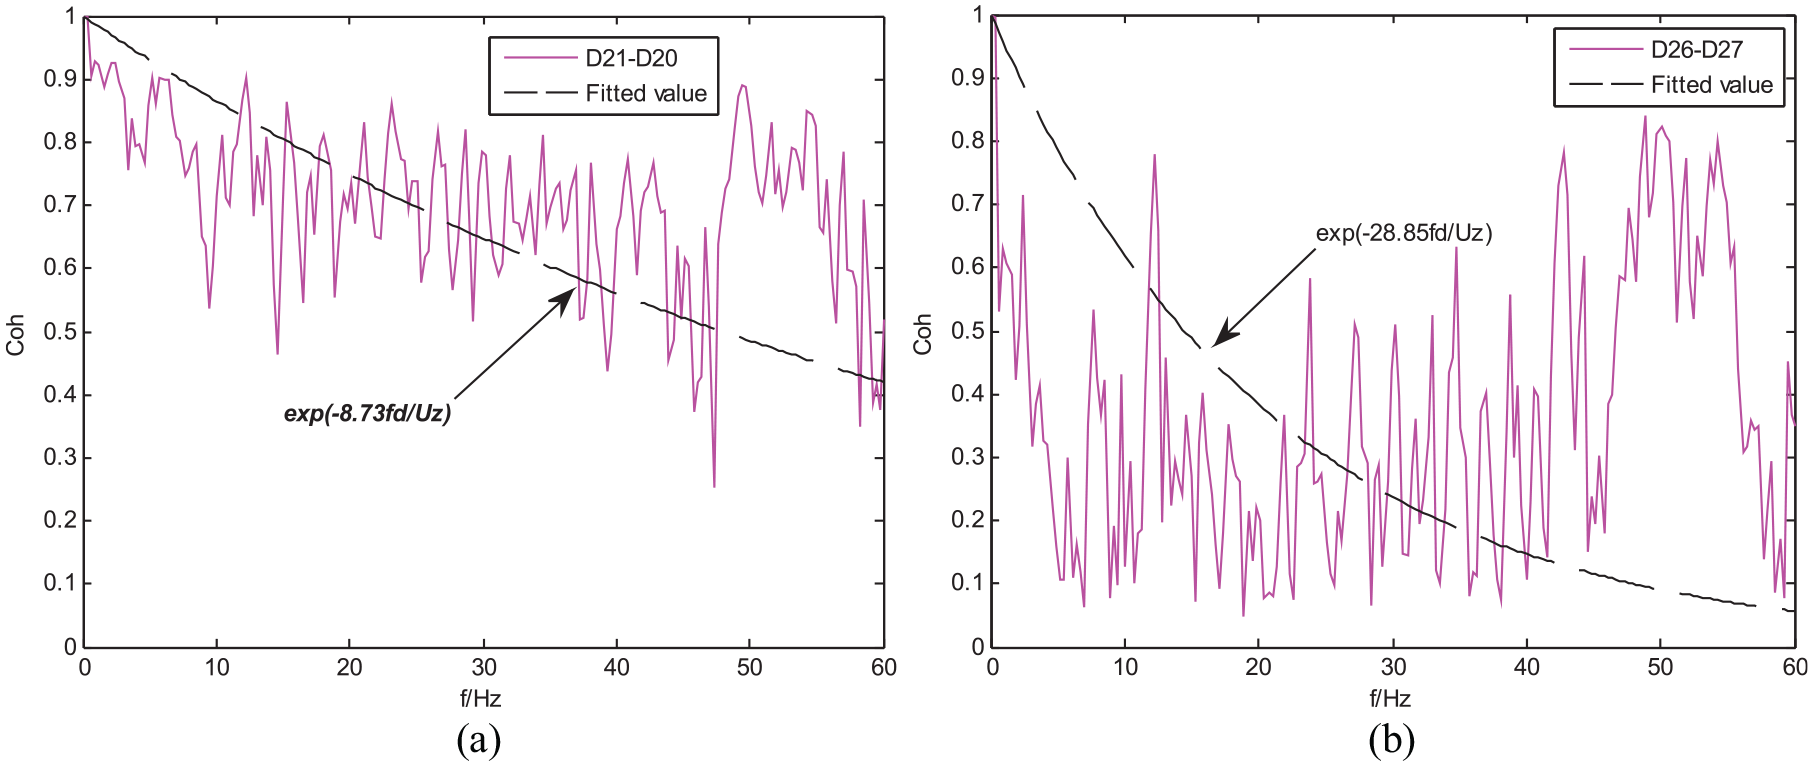
The horizontal coherence function between typical taps of model M3 in wind direction of 270°: (a) face 4 and (b) face 5.
Vertical coherence function
The vertical coherence function is more important than horizontal coherence function for the estimation of wind-induced responses of tall buildings using the spectral method. Figures 13 and 14 illustrate the vertical coherence functions between typical taps of model M3 in wind direction of 225° and 270°, respectively. In wind direction of 225°, the vertical coherence functions of faces 4 and 5 are consistent with each other and the proposed formula fit the test results well in the range of 0–40 Hz with the exponents of 6.0–7.0. In wind direction of 270°, the vertical coherence function of face 4 is different from that of face 5. And the vertical coherence function of face 4 is quite similar to that in wind direction of 225°, while the exponent is 9.25. The vertical coherence functions of typical taps on face 5 drop rapidly to about 0.3 in the low-frequency range and the test results are fitted by the proposed function with the exponent of 13.29.
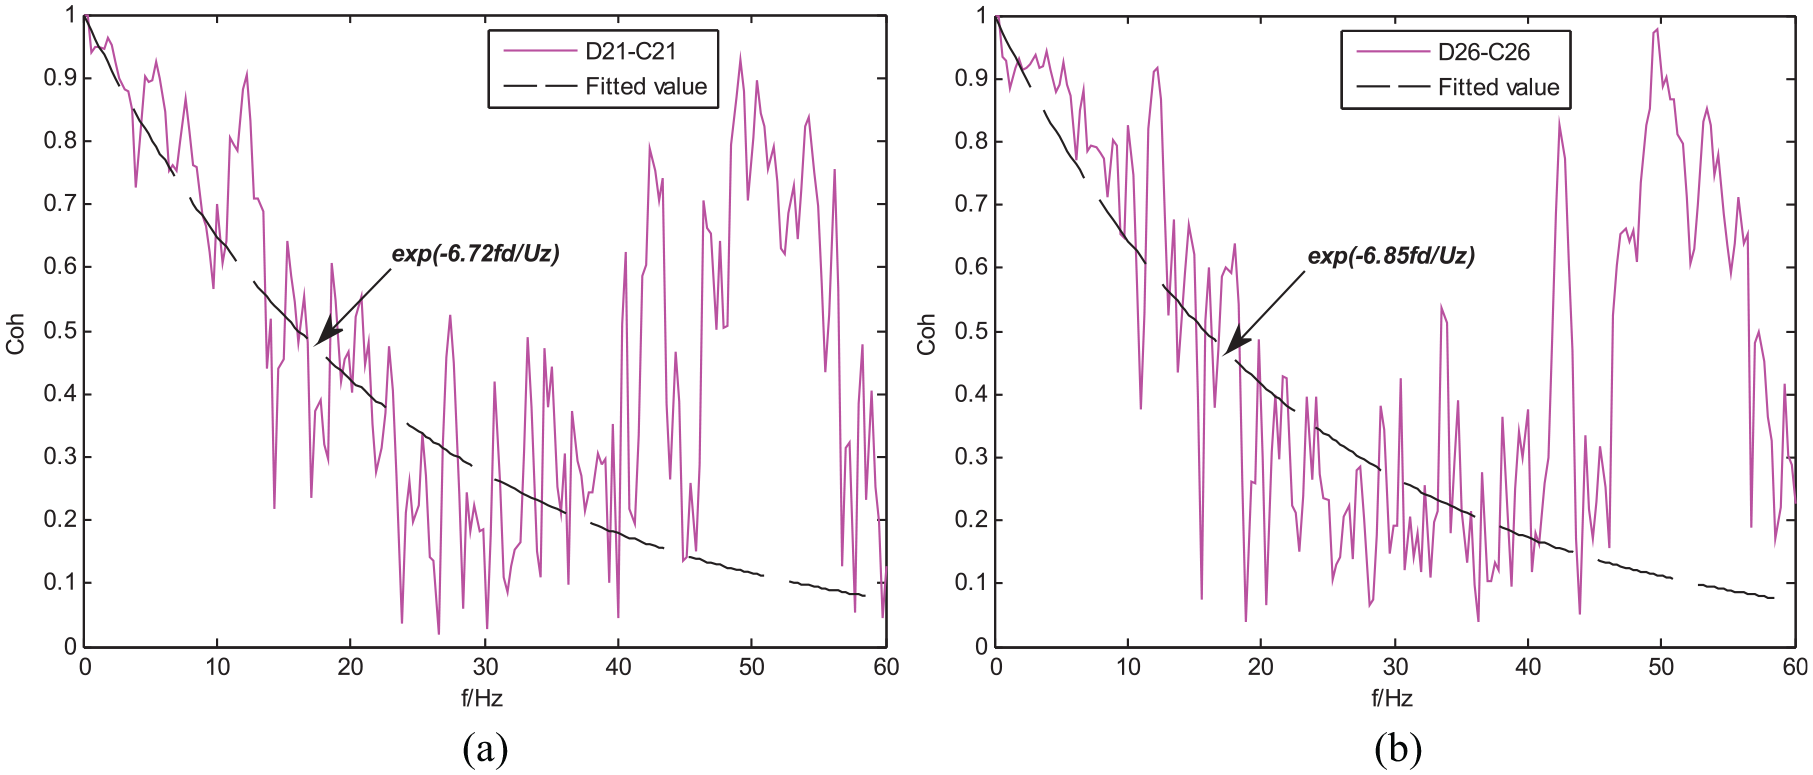
The vertical coherence function between typical taps of model M3 in wind direction of 225°: (a) face 4 and (b) face 5.
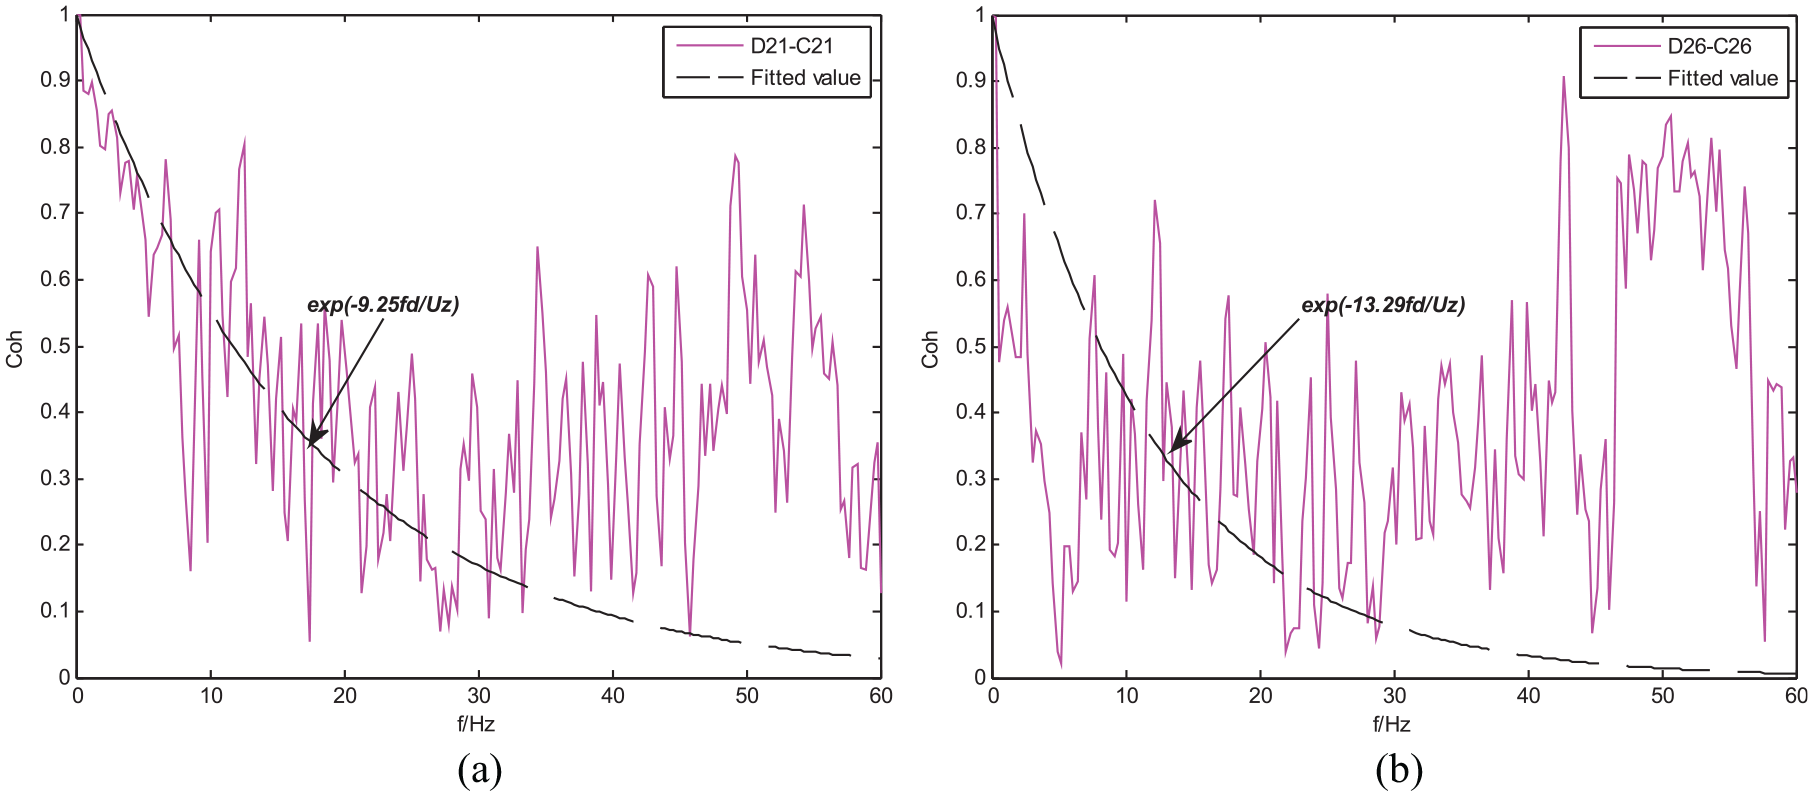
The vertical coherence function between typical taps of model M3 in wind direction of 270°: (a) face 4 and (b) face 5.
Conclusion
Based on the extensive wind tunnel test on L-shaped tall building models with different geometric dimensions, the characteristics of wind pressures acting on L-shaped tall buildings are comprehensively investigated. The major findings of this experimental study are summarized as follows:
Comparing the wind pressures on rectangular and L-shaped tall building models, the significant differences are the wind pressure distributions at the corner of L-shaped tall buildings.
The effects of terrains on the wind pressures on the L-shaped tall buildings were investigated with five different upstream flows. It is found that the mean pressure coefficients are less affected with the increase of turbulence intensity, while the RMS pressure coefficients were greatly increased.
The side ratios of L-shaped tall buildings have negligible effects on the mean and RMS pressure coefficients, and the RMS pressure coefficients are slightly increased as the aspect ratio increases.
Shape factors of wind loads on L-shaped tall buildings with different geometric dimensions at typical wind directions were summarized, which can be used for the wind-resistant design of similar L-shaped buildings. The side ratios of L-shaped tall buildings have a great influence on the shape factors of wind loads.
The PSDs of all the pressure taps at the fourth layer were discussed in detail. In wind direction of 225°, three spectral peaks of the middle tap D21 were observed at reduced frequencies of 0.095, 0.136, and 0.422, which also emerged in the spectrum of middle tap D26 in wind direction of 270°.
Both the horizontal and vertical correlation coefficients gradually decrease as the distance of pressure taps increase in the typical wind directions of 225° and 270°. The horizontal correlation coefficients in wind direction of 225° are greater than those in wind direction of 270°, especially for the taps toward the corner. In wind direction of 225°, the vertical correlation coefficients between the middle pressure taps have strongly positive correlation with each other, and the maximum value even reaches above 0.95. Wind engineers should pay more attention to this phenomenon in estimation of wind effects on L-shaped tall buildings.
Both the horizontal and vertical coherence functions decrease as frequency increase. And the decay rate of the vertical coherence function is faster than that of the horizontal coherence function. Finally, it is shown that the proposed exponential laws for horizontal and vertical coherence functions can effectively fit the test results.
Footnotes
Declaration of Conflicting Interests
The author(s) declared no potential conflicts of interest with respect to the research, authorship, and/or publication of this article.
Funding
The author(s) disclosed receipt of the following financial support for the research, authorship, and/or publication of this article: The work described in this paper was fully supported by the grants from National Nature Science Foundation of China (Project nos 51708207, 51878271, 51778554, and 51978593) and from Hunan provincial Education Department (Project no. 18B206). The authors are very grateful to the reviewers for their helpful comments.
