
Abstract
This article presents an experimental and numerical study on seismic performance of semi-tenon joints reinforced by steel angle in traditional timber buildings. Five specimens with two different reinforced connections and one unreinforced connection subjected to low-cyclic reversed loading on the bending moment are examined. The unreinforced connection consists of left and right beams inserted into the column that has been used in setting up the mortise before assembly. The first type of reinforced connection is formed by bottom steel angles bolted to the column and jointed to the beam by means of bolts. The second type of reinforced connection is made up of top and bottom steel angles bolted to the column and connected to the beam relying on vertical and transverse bolts. Moreover, two reinforcement techniques aimed at enhancing the seismic performance of semi-tenon joints are investigated, including the change of steel angle limb length and the variation of steel angle limb thickness. The test setup, joint connection, reinforced conditions, and material properties are introduced through detailed account of the experimental results and observations. The key behavioral patterns are identified from the experiments and the main response characteristics such as hysteresis, stiffness, flexural capacity, energy dissipation, and the failure mechanism. This article demonstrates that the steel angle can enhance the flexural capacity of the semi-tenon joints significantly. Besides, the use of greater limb thickness steel angle is shown to be an effective detail for adequately increasing the flexural capacity and rotation stiffness of the joints. Finite element simulations of experiments are also conducted, together with a detailed description of the modeling methods, so as to gain further insight into the influence of various factors on the behavior of joints.
Keywords
Introduction
As a renewable natural resource with low embodied energy, wood clearly offers an environmentally responsible and a highly practical choice as a construction material, especially in terms of carbon storage potential, construction economy, and lightness (Coulson, 2014). The fact proves that mass timber constructions will be an alternative to concrete and steel structures in the building industry (Kremer and Symmons, 2015). In China, wood has been widely used to build residential buildings such as palaces, temples, and pagodas (Liang, 1984). For the majority of timber buildings, they have been constructed about hundreds or even thousands years ago with unique architectural style and structural system. Simultaneously, it also derived the form of the wooden house suitable for citizens. Traditional Chuan-Dou style timber construction is a common form of multifamily residential buildings in Southwest China, as depicted in Figure 1(a). The main frame of the structure is composed of Chuan Fang, Dou Fang, and wooden columns, as shown in Figure 1(b). This kind of structure makes full use of the local wood resources to build distinctive buildings.

Traditional Chuan-Dou style timber building:(a) wood multifamily residential buildings and (b) Chuan-Dou style timber structure.
The Southwest China is located in the area with high seismic intensity and frequent earthquakes. Some investigations about the earthquake destruction in recent years have found that the failure of mortise-and-tenon joints lead to varying degrees of connection damage or even collapse of the whole wooden structure in traditional residential buildings, which seriously affects the life and property safety of residents. Therefore, it is urgent to study the seismic reinforcement of traditional wooden structures.
The effective reinforcement structural systems combine the reinforced materials advantages to make up for the self-disadvantage of structure material to achieve significant levels of seismic performance. In this context, the behaviors of reinforced wood beam–column connections have been subjected to a number of studies (Dorn et al., 2013; Shanks et al., 2008). Available investigation includes the study by Xie et al. (2019), which suggested combining the hyperelastic, high strength, and recoverable behaviors of shape-memory alloy (SMA) with the steel to create a beam–column strengthened connection device of high rotational stiffness for Chinese ancient timber joints. Likewise, the use of SMA bars and tubes as dowels for timber connection has been studied by Huang and Chang (2017). However, SMA is restricted in practical engineering because it is relatively expensive. Other research works on the reinforced timber structure include reinforcement method for the typical damage problems of timber joints in the Palace Museum in China. Zhou and Yan (2015) conducted low-cyclic reversed loading tests on mortise-and-tenon joints reinforced by the iron hook, carbon fiber–reinforced polymer (CFRP), and steel components, respectively. The restriction of the reinforcement device on the relative slip between mortise and tenon greatly weakened the energy dissipation capability.
Substantial research works on timber connections with dowel-type fasteners (such as bolt, nail, and screw) regarding the mechanical behavior and corresponding failure mode have been investigated (Blaß and Schädle, 2011; Tannert, 2016; Tomasi et al., 2010). These works demonstrated that such connections are potentially ductility because of the nonlinear embedment behavior of wood in compression and the bending of the steel fasteners. The steel and bolts are used not only for the reinforcement of timber structures but also as the key connecting parts of beams, columns, and the wall panels in modern wooden buildings (Dias et al., 2018; Gattesco and Boem, 2016; Matteo et al., 2018; Omar et al., 2018). Such timber–steel hybrid systems exhibit excellent mechanical properties and connection performance.
To sum up, there are many mechanical research works on the ancient timber joints and modern wood frame beam–column joints, as well as its reinforcement methods. However, few were involved into the traditional timber dwellings in Southwest China, especially about the joint of the timber frame and its seismic performance after being reinforced. There are many connection forms of mortise-and-tenon joints in the traditional wooden structure dwellings, among which semi-tenon joint is a typical and commonly used connection form. The beams are inserted into the column and disconnected in the middle of column, which leads to the low stiffness and flexural capacity of the joint. The tenon is easy to be pulled out under the action of load, resulting in the failure of connection. As one of the most commonly used building reinforcement materials, steel angle is widely used in various aspects for its easy reprocess and low cost, especially in remote regions. Hence, this article deals with the seismic response of reinforced connections by steel angle between wooden beams and columns according to the semi-tenon joint failure characteristics by means of finite element (FE) and experiment studies and analyzes the influence of different design steel angle parameters.
Five specimens with a 1:1.33 scale are tested under low-cyclic reversed loading on increasing bending action. Two reinforced connection configuration alternatives are examined. Detailed FE models are presented and validated through the experimental results. These models make use of the foundation method, which was initially suggested by Malhotra and Bazan (1980) and Hong (2007), and was recently improved by Xu et al. (2009). In addition, a series of FE models were established to analyze the influence of the steel angle yield strength, limb thickness, and length on the bending behavior of the joints. This study can give guidance for the design of timber joint reinforced by steel angle. In addition, the research results can be referenced for the anti-seismic reinforcement and protection of traditional timber buildings.
Experimental arrangement and specimen details
Test setup
Figure 2 shows the experimental setup used for testing the semi-tenon joints reinforced by steel angle under low-cyclic reversed loading. In order to reflect the response of the joints used in timber structure under the earthquake, the columns were placed vertically and the beams were placed horizontally during the test. The root of the column was fixedly connected with the rigid ground beam using the steel sleeve to accurately measure the relative rotational performance between beam and column during the loading process. The loading plane displacement limiting device consisting of steel pipe and angle were arranged on the top of the column, as depicted in Figure 2(a). A hydraulic jack applying a constant axial load to the design value of 10 kN was assembled on the top of the column. Two hinged MTS synchronization hydraulic actuators operating in rotation angle control were attached to the end of beam.
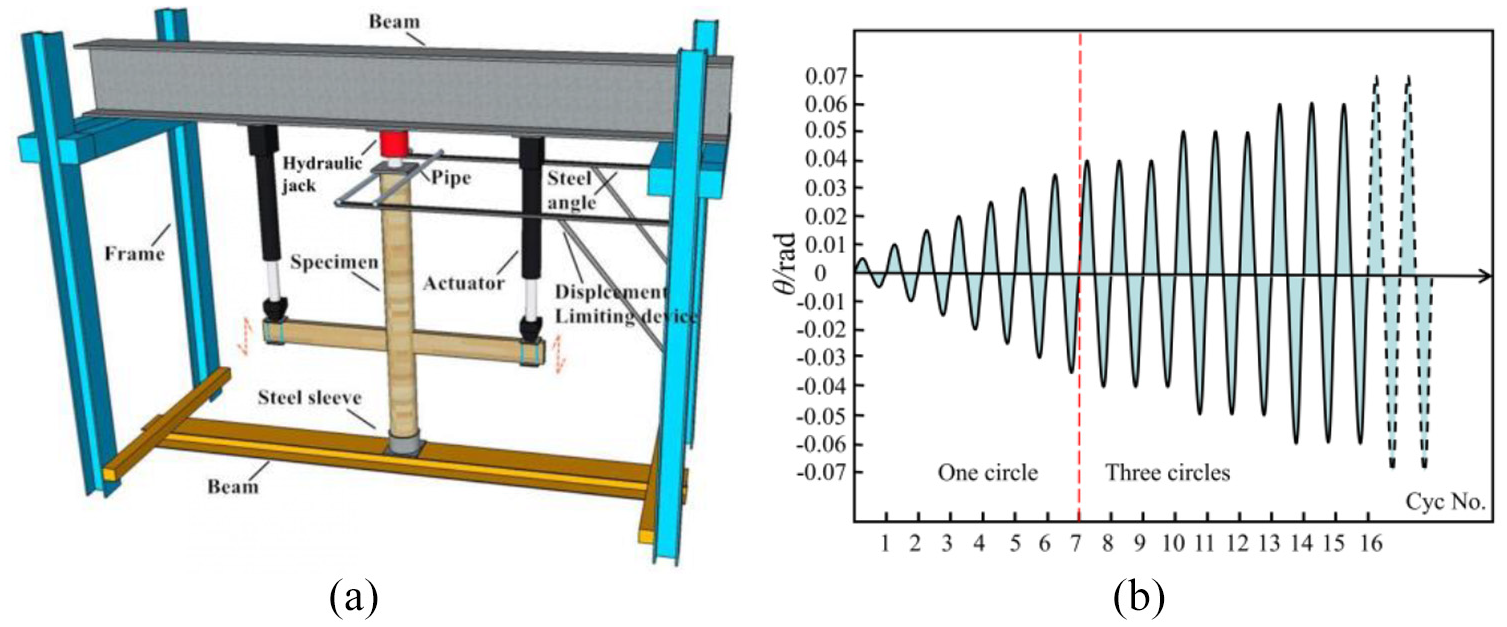
Loading setup and protocol: (a) loading setup and (b) loading protocol.
The test loading protocol (Figure 2(b)) was carried out by means of variable amplitude rotation angle control. Before the joint rotation angle reached 0.04 rad, only 0.005 rad was used as the incremental step, and the circle was repeated one time. After that, the rotation angle was increased by 0.01 rad, and the circle was repeated three times under each load until a clear connection failure was observed.
Specimen fabrication
As noted earlier, five specimens with two different reinforced connections and one unreinforced connection with a 1:1.33 scale subjected to low-cyclic reversed loading on increasing bending action are examined. The unreinforced connection type (referred to as type A) incorporates left and right beams into the column that have been setup with the mortise before assembly. The first reinforced connection type (referred to as type B) is formed by bottom steel angles bolted to the column and the beam through long bolts. The second reinforced connection type (referred to as type C) is made up of top and bottom steel angles bolted to the column and the beam by means of transverse and vertical bolts. Further specimen details are given below.
Unreinforced connection of semi-tenon joint (type A)
For type A, it is composed of two wooden beams (left and right) and one wooden column. The left and right beams containing tenon were inserted into a column with a prearranged mortise to form the semi-tenon joint. The wood used in the test is cedar, and the size of each component is determined according to the actual practice of the traditional wooden structure in Southwest China. This type includes one specimen (specimen BS), which acts as a comparison specimen. Table 1 and Figure 3(a) and (b) provide the details of type A.
Design parameters of specimens.

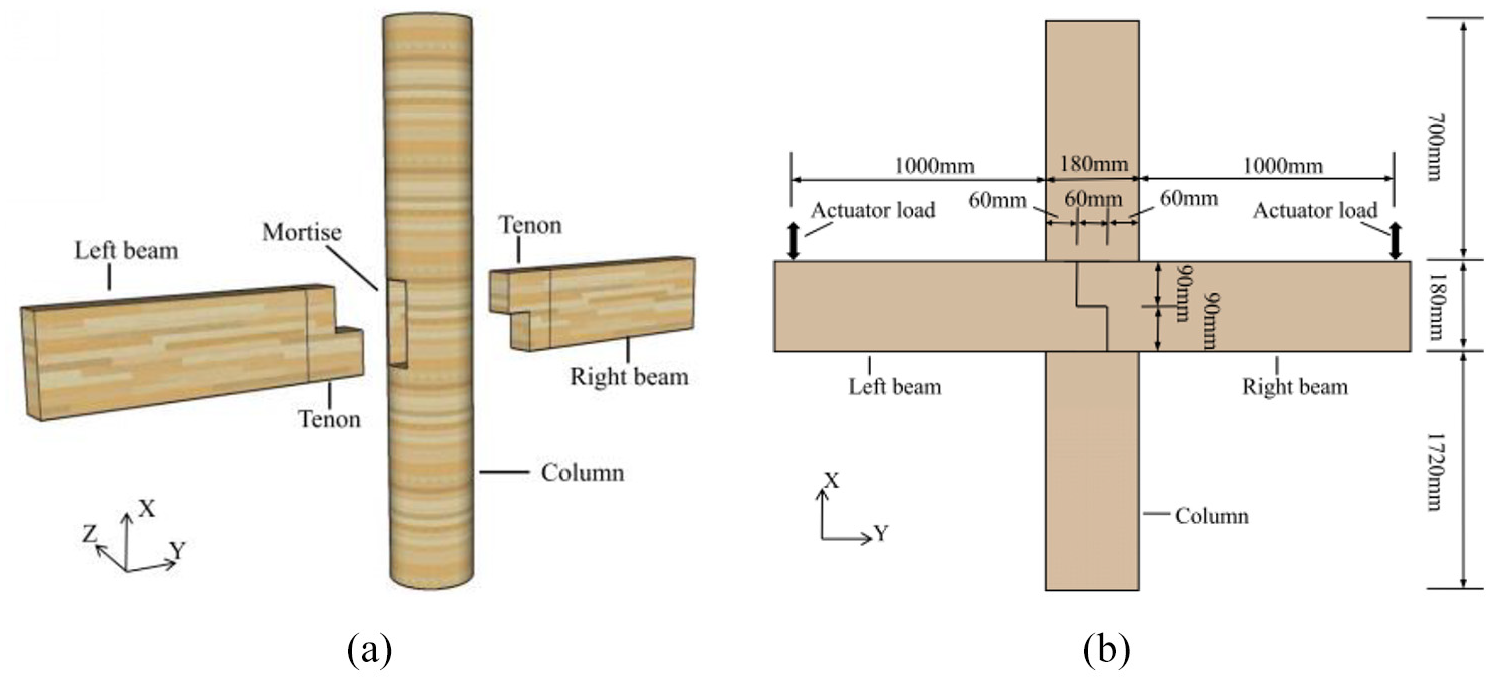
Sketch of type A (specimen BS) (a) axonometric view (semi-tenon joint) and (b) front view.
Reinforced connection of semi-tenon joint (type B)
The unilateral reinforced connection configuration adopted for type B is depicted in Figure 4(a). Two L100 × 100 mm angles made of Q235B steel were bolted to the wooden column and beam by means of M10 Grade 5.6 bolts. In order to avoid the effect of nut embedding into the wooden beam, two steel plates were arranged on the top surface of the beam, and the bolt was connected with the steel angle and plate by axial tension. The hardness of cedar wood is relatively small, and the tensile force value is only used to connect the steel parts firmly. Table 1 and Figure 4(a) and (c) provide the details of the test carried out on type B (specimen JG-1).
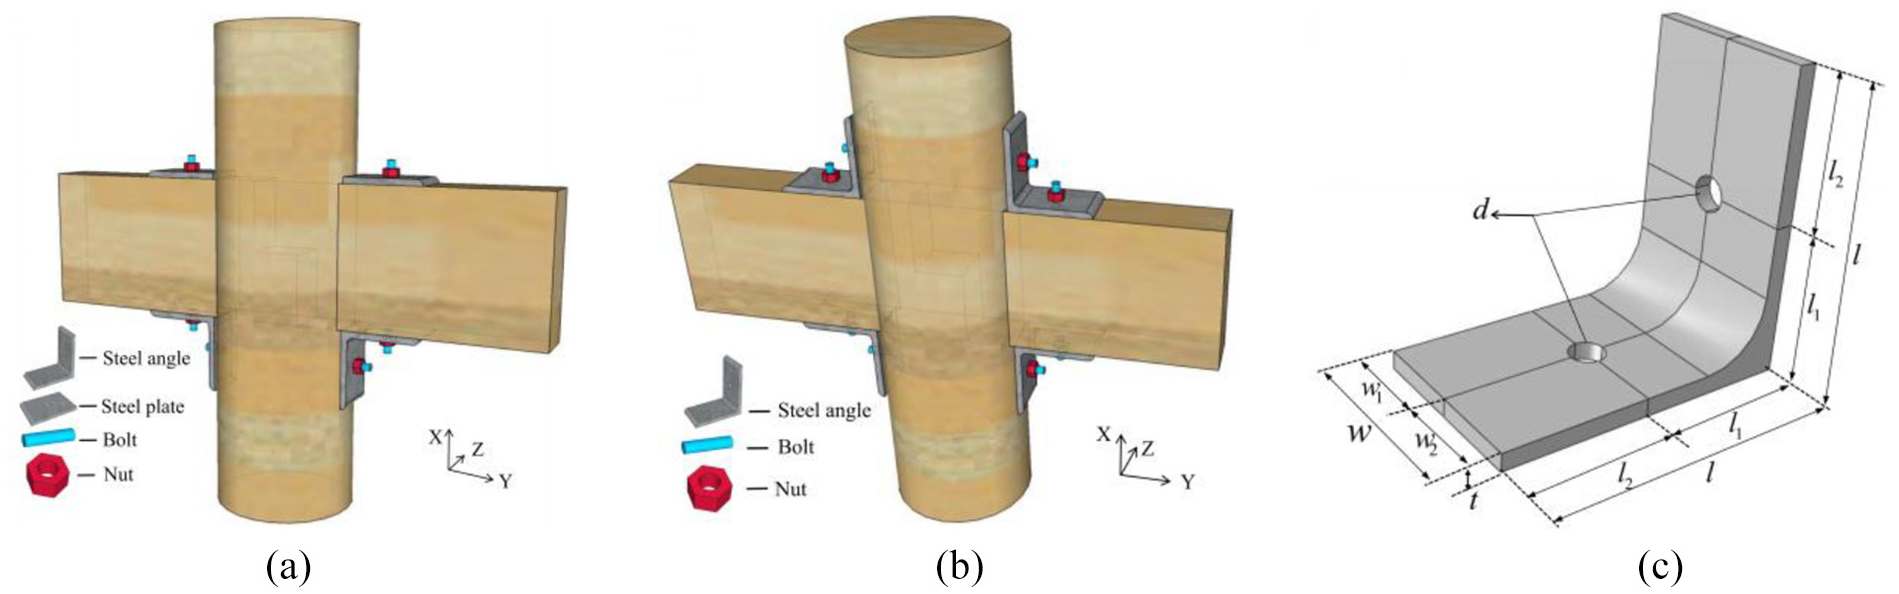
Details of reinforced connection: (a) type B (specimen JG-1), (b) type C (specimens JG-2–JG-4), and (c) steel angle dimensions.
Reinforced connection of semi-tenon joint (type C)
The bilateral reinforced connection configuration adopted for type C is depicted in Figure 4(b). This connection adopts four angles made of Q235B steel, which were bolted to the wooden column and beam by means of M10 Grade 5.6 bolts and tightened with nuts. A total of three specimens were performed on this connection. Details of type C are given in Table 1 and Figure 4(b) and (c).
Material characterization
In order to characterize the material properties of the structural components, a detailed experimental evaluation was carried out. The wood included compression tests in both parallel and perpendicular to the grain direction, as well as tension tests. All tests were performed in accordance with the Chinese Standard GB/T 1928 (2009), and their corresponding results are summarized in Table 2 in terms of mean values obtained from at least 16 samples in each case. In addition, the steel tests were carried out to obtain the mean yield strength values of the steel components by the Chinese Standard GB/T 228.1 (2010).
Summary of the mechanical properties for wood and steel angle.
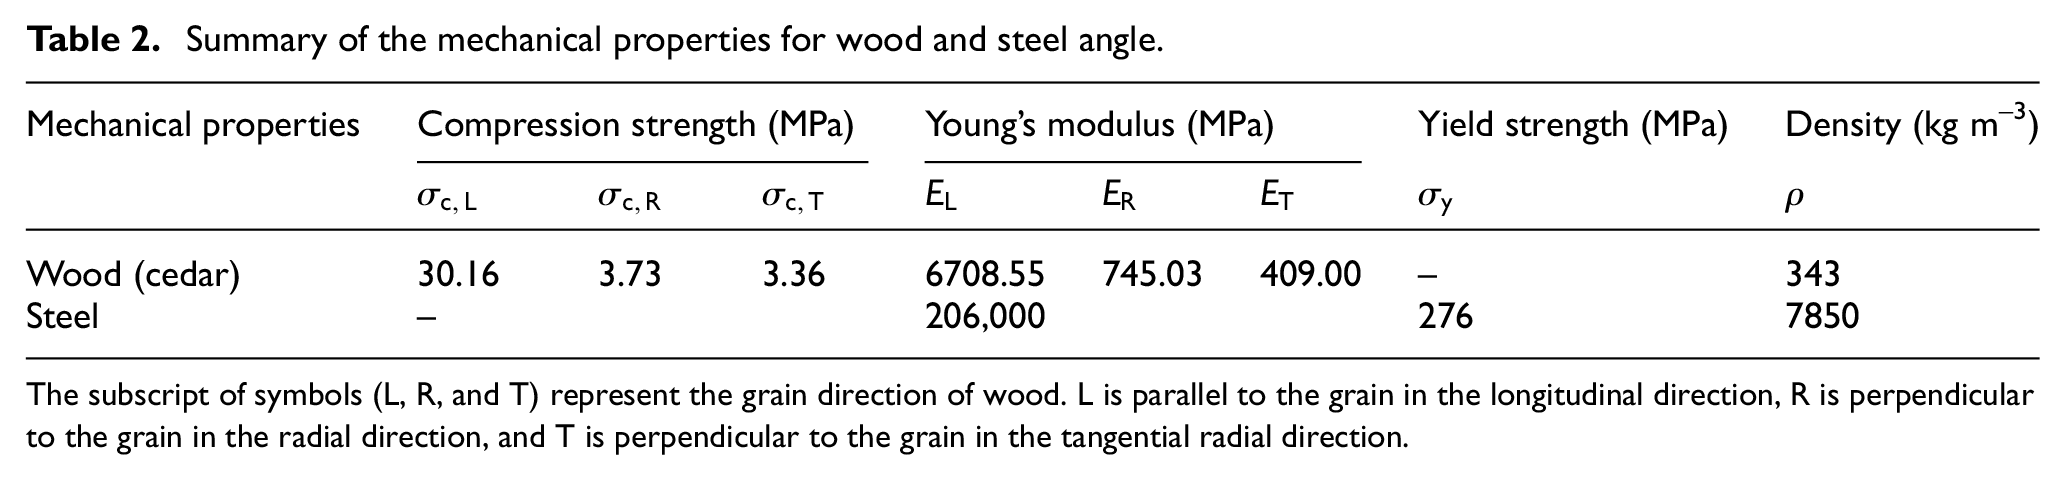
The subscript of symbols (L, R, and T) represent the grain direction of wood. L is parallel to the grain in the longitudinal direction, R is perpendicular to the grain in the radial direction, and T is perpendicular to the grain in the tangential radial direction.
Data acquisition
The displacement transducer and load cell incorporated within the actuator were employed to record the applied displacement and corresponding load at the tip of the beam, respectively. Based on this, the moment resistance of specimen under the low-cyclic reversed loading is expressed by equation (1)

where P is the load being applied on the beam and H is the distance between the load point and the edge of the column.
Besides, four inclinometers (Q1–Q4) were attached to the beam and column to measure the joint rotation angle. The position of beam relative to the column was continuously monitored by means of inclinometers, and the angle from sensors Q1 (Q3) and Q2 (Q4) were used to calculate the joint rotation angle. In the test, the joint rotation angle can be expressed by equation (2), and digital acquisition instrument was employed to gather this data
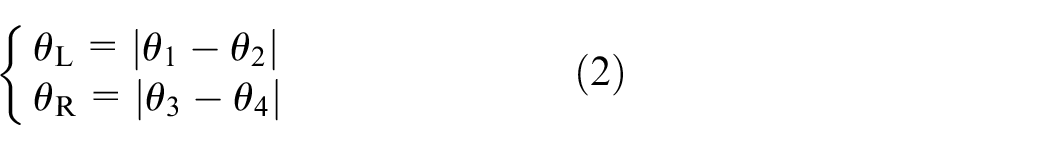
where θL is the angle of left beam relative to the column, θR is the angle of right beam relative to the column, θ1 (θ3) is the angle from sensors Q1 (Q3) being applied on the column, and θ2 (θ4) is the angle from sensors Q2 (Q4) being applied on the beam.
Experimental phenomena and failure modes
Type A (specimen BS)
In specimen BS, initially, slight compression deformation appeared on the left and right sides of the joint. When the joint angle reached 0.02 rad, the contact surfaces between mortise and tenon showed obvious compression deformation with a slight squeaky sound during the rotation process. The tenon of the right beam was pulled out by 1 mm, while the tenon pullout length of left beam was 0 mm. When the joint angle reached 0.03–0.05 rad, it emitted a clear “creak” sound, which was frequent and louder. The extrusion deformation between mortise and tenon increased, and the tenon pullout length of the right beam increased to 8 mm, while the tenon of left beam increased to 6.5 mm. When the joint angle reached 0.06 rad, it was observed with embedded compression deformation with the cracking sound of wood. After three cycles, the tenon pullout length of right beam was prominent, which was measured to 20 mm, and the tenon pullout length of left beam increased to 16 mm. When the joint angle reached 0.07 rad, the tearing sound of wood was intensified. The tenon pullout length of the right beam increased sharply to 60 mm, and the tenon was pulled out from the column. The test phenomena and failure mode of BS are shown in Figure 5(a) to (c).
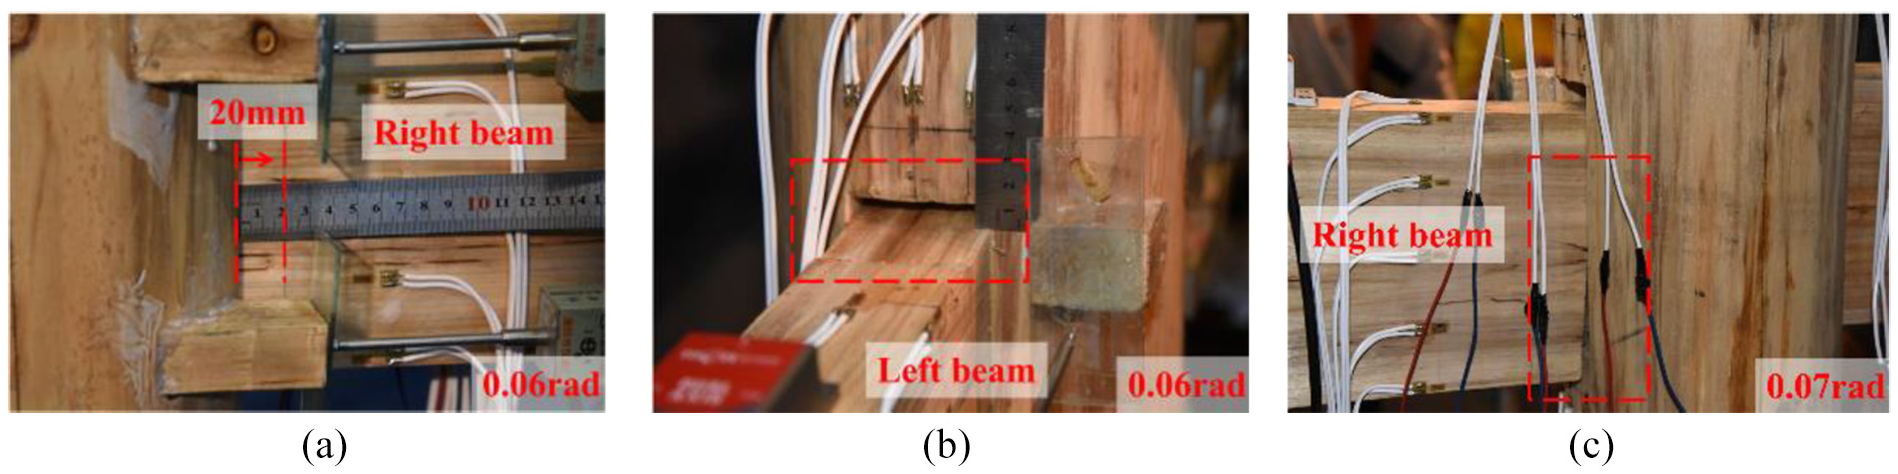
Test phenomena and failure mode of type A (specimen BS): (a) part of pullout tenon, (b) compression deformation, and (c) the pullout tenon.
Type B (specimen JG-1)
In specimen JG-1, at the initial stage of loading, the mortise and tenon were only slightly deformed by extrusion. With the joint angle increase, the deformation of steel angle began to increase, and the extrusion gap between mortise and tenon increased continuously. When the joint angle reached 0.035 rad, the tenon pullout lengths of the right and left beams were feeble, and a slight tearing sound of wood was heard. When the joint angle reached 0.05 rad, the contact surfaces between mortise and tenon showed obvious extrusion deformation, and part of surfaces were in an arch shape. When the joint angle reached 0.06 rad, the horizontal cracks began to appear in the beam. With the loading in progress, the test specimen presented a continuous wood splitting sound, and the horizontal cracks in the beam continued to grow. When the joint angle reached 0.09 rad, the mortise compression deformation was more serious, and the fibers on the surface of tenon were warped and with a loud sound, serrated oblique cracks appeared on the right beam. When the joint angle reached 0.13 rad, the tenon of right beam was completely fractured, and the loading progress was terminated. In the whole loading process, the tenon pullout lengths of the right and left beams were small. The test phenomenon and failure mode of JG-1 are shown in Figure 6(a) to (c).

Test phenomena and failure mode of type B (specimen JG-1):(a) horizontal and oblique cracks of tenon, (b) the tenon fracture, and (c) deformation of reinforced steel parts.
Type C (specimens JG-2–JG-4)
In specimens JG-2–JG-4, the test phenomena of JG-2–JG-4 were similar to JG-1 in the early stage of loading. When the joint angle reached 0.03–0.05 rad, the horizontal cracks began to appear in the beam with the cracks developing slowly along the grain in the longitudinal direction, and the tenon was pulled out slightly. When the joint angle reached 0.06–0.07 rad, the cracks in the beam developed rapidly along the grain in the longitudinal direction, accompanied by the continuous wood splitting sound. Subsequently, when the angle of specimen JG-2 reached 0.08 rad, jagged oblique cracks appeared near the bolt hole section of the left beam with a loud noise. The crack developed downward, and the extrusion deformation of the mortise and tenon was serious. When the angle of joint reached 0.1 rad, the left beam was completely broken, and the loading progress was terminated. Similarly, when the angle of specimen JG-3 reached 0.12 rad, the left beam was broken completely. When the angle of specimen JG-4 reached 0.13 rad, the right beam was completely broken. The test phenomenon and failure mode of JG-2–JG-4 are shown in Figure 7(a) to (h).
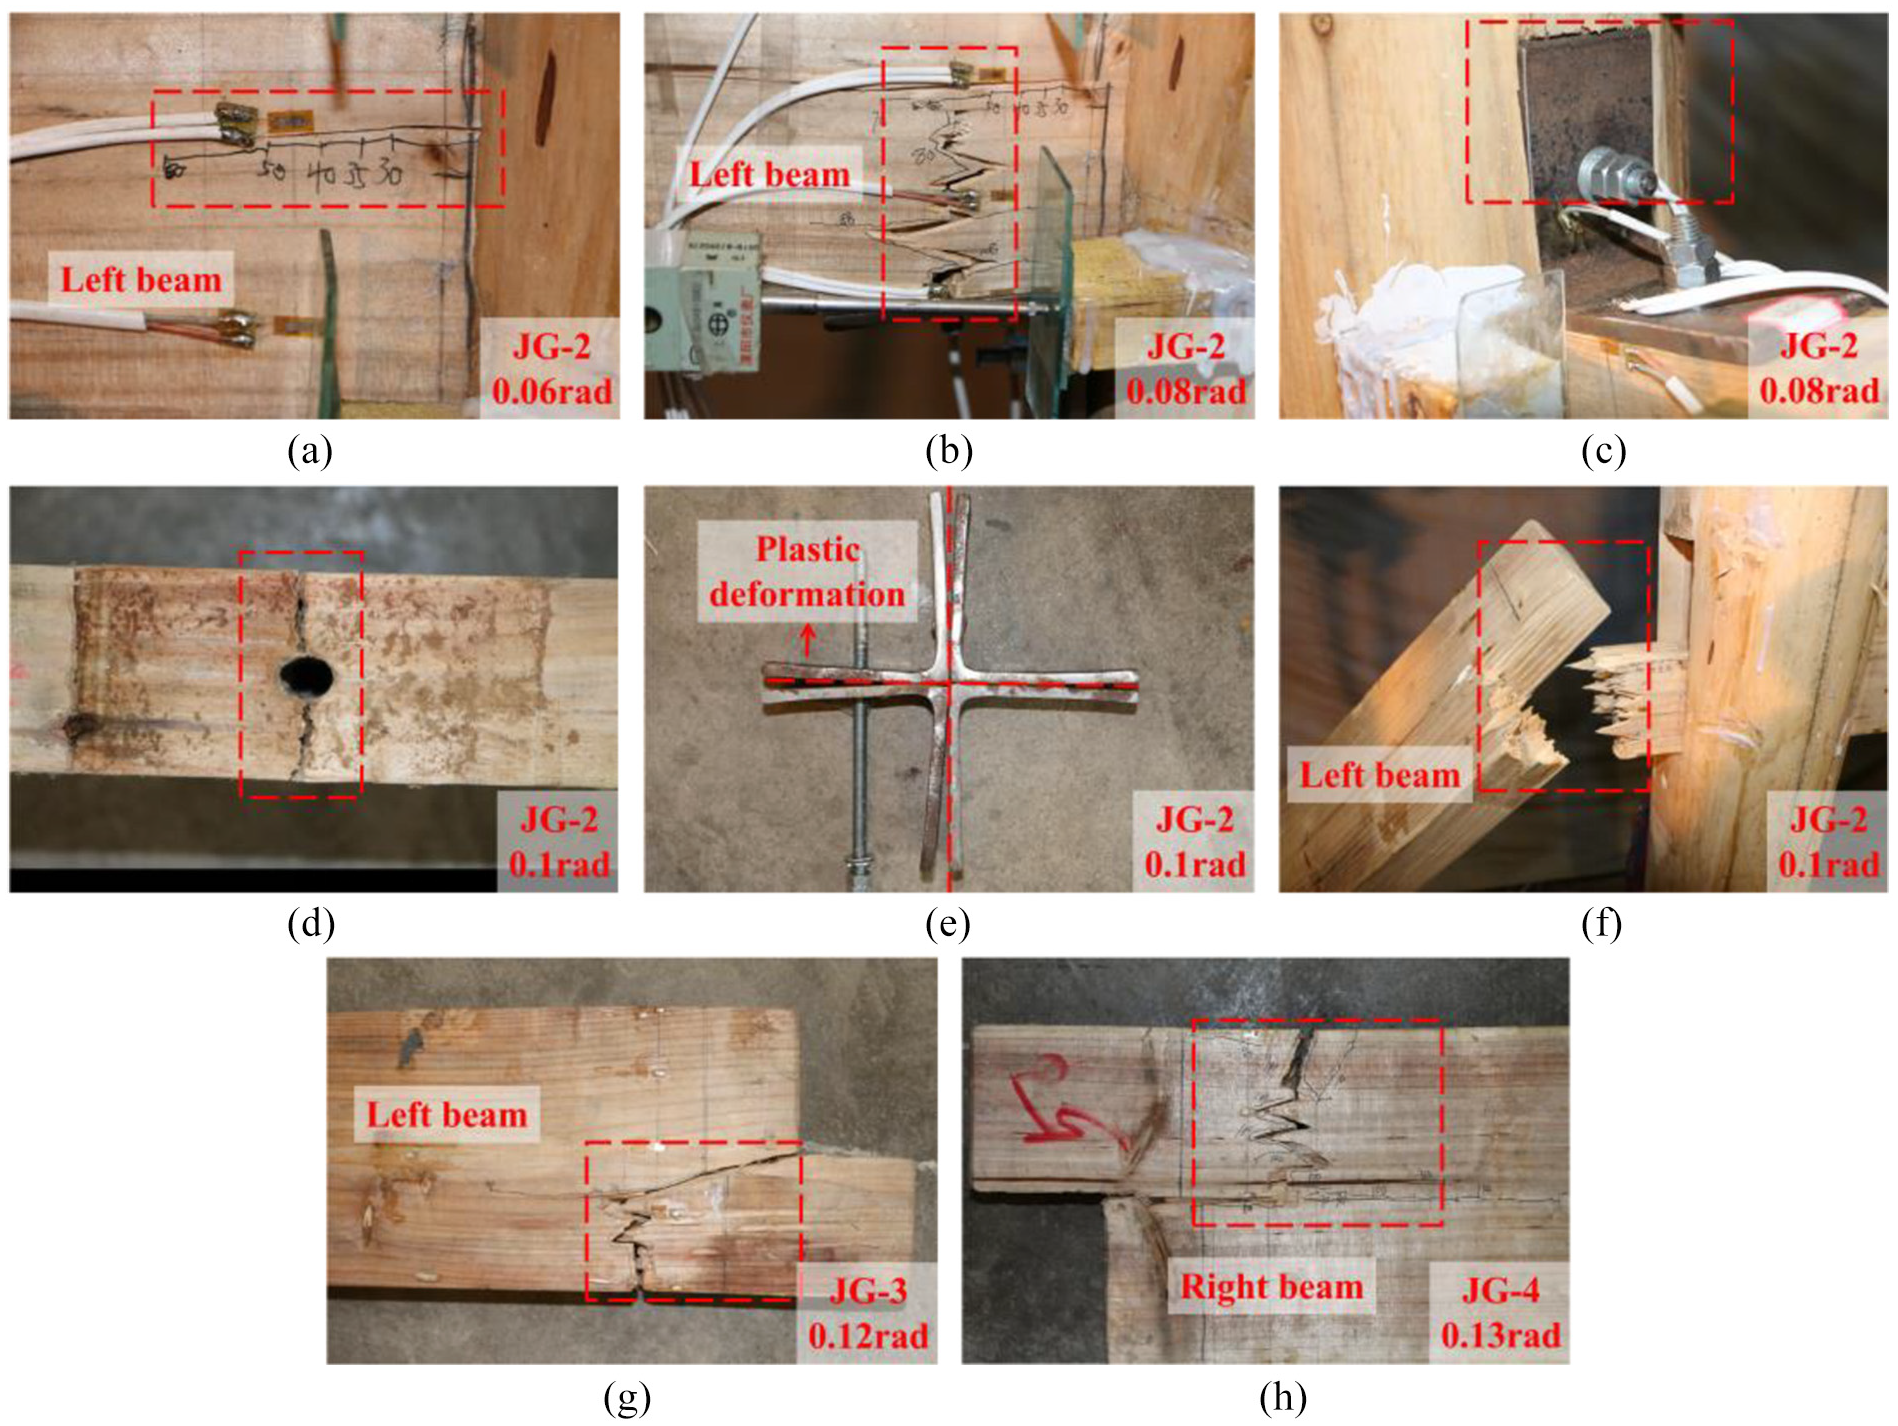
Test phenomena and failure mode of type 3 (specimens JG-2–JG-4):(a) horizontal crack, (b) vertical cracks, (c) steel angle embedded in wood,(d) horizontal crack along bolt hole, (e) deformation of reinforced steel parts, (f) fracture of JG-2, (g) fracture of JG-3, and (h) fracture of JG-4.
Experimental results and discussion
For the convenience of description, it is stipulated that the loading directions of the hydraulic actuators on both sides of the left and right beams are pushed positively and pulled negatively.
Hysteresis and envelope curves
The seismic responses of five specimens are discussed based on the hysteresis curves presented in Figure 8(a) to (e). The hysteresis curves on the left and right sides of all specimens show good symmetry.

Test hysteresis and envelope curves of specimens:(a) BS, (b) JG-1, (c) JG-2, (d) JG-3, (e) JG-4, and (f) envelope curves of specimens.
The hysteresis curve of specimen BS presents a typical “Z” shape, and the pinch effect is obvious, which indicates that the large frictional slippage of joints occurred during the loading process. In the initial loading progress, the growth rate of rotation angle is faster than the moment, and the slope of the hysteresis curve is smaller. This is because the gap between mortise and tenon is not compact. When the joint angle reached 0.02 rad, the slope of the hysteresis curve shows an upward trend, and the mortise begins to squeeze with the tenon. After that, the bearing capacity of the joint increases. With the increase in rotation angle, the slope of the hysteresis curve gradually becomes gentle and finally declines until the end of loading.
The hysteresis curves of semi-tenon joints reinforced by steel angle are obviously plumper than that of the unreinforced joint, and the “pinching” effect is weaker. The hysteresis curves are fusiform shaped in the initial stage of loading progress and “S” shaped in the later stage. The longer and thicker the steel angle limb is, the fuller hysteresis curve exhibits. At the same rotation angle, the negative hysteresis curve area of specimen JG-1 is significantly greater than that of positive hysteresis curve area for the unilateral reinforcement style, and the negative hysteresis curve area of specimens JG-2–JG-4 are almost the same as the positive hysteresis curve area for the bilateral reinforcement style.
To study the mechanical properties of unreinforced and reinforced connections of semi-tenon joints, Figure 8(f) depicts the average value of envelope curves on the left and right sides of each specimen. As indicated in Figure 8(f), the bearing capacity and stiffness of the reinforced specimens are obviously improved, compared with the unreinforced specimen.
The influence of reinforcement style on the connection response can be verified by comparing the results of the specimens BS, JG-1, and JG-2, as presented in Figures 8(f) and 9. It can be observed from Figure 9 that the positive ultimate capacity of specimen JG-2 was 36.6% higher than that of JG-1, and the positive ultimate capacity of specimen JG-1 was 80.4% higher than that of BS. Similarly, the negative ultimate capacity of specimen JG-2 was 4.6% higher than that of JG-1, and the negative ultimate capacity of specimen JG-1 was 158.2% higher than that of BS. This significant difference in ultimate capacity is the result of the improved stiffness experienced by connections with different reinforced style, and the specimen reinforced by bilateral steel angle is better than the specimen reinforced by unilateral steel angle. Meanwhile, no matter which kind of reinforced style is adopted, the ultimate capacity of the specimen with steel angle reinforcement is greater than that without reinforcement. These enhancements are attributed to the action of steel angle.

The change in ultimate capacity of specimens.
The effects of reinforced steel angle limb thickness (t) on the response of the connection can be explored by comparing the experimental results of specimens BS, JG-2, and JG-3, as shown in Figures 8(f) and 9. As Figure 9 suggests, the influence of reinforced steel angle limb thickness (t) on the ultimate capacity of specimen is relatively remarkable. The thicker the steel angle limb is the higher the stiffness and connection capacity will be. It can be observed from Figure 9 that the positive ultimate capacity of specimen JG-3 was 40.9% higher than that of JG-2, and the positive ultimate capacity of specimen JG-2 was 146.4% higher than that of BS. Likewise, the negative ultimate capacity of specimen JG-3 was 47.5% higher than that of JG-2, and the negative ultimate capacity of specimen JG-2 was 170.0% higher than that of BS.
The influence of reinforced steel angle limb length (l) on the response of the connection can be discussed by comparing the experimental results of specimens BS, JG-3, and JG-4, as expressed in Figures 8(f) and 9. As indicated in Figure 9, the positive ultimate capacity of specimen JG-3 was 247.3% higher than that of specimen BS, whereas the positive ultimate capacity of specimen JG-4 was 6.4% lower than that of JG-3. Equally, the negative ultimate capacity of specimen JG-3 was 298.2% higher than that of specimen BS, whereas the negative ultimate capacity of specimen JG-4 was 15.3% lower than that of JG-3. It shows that the capacity of reinforced specimens did not increase with the steel angle limb length. Conversely, the greater steel angle limb length will have adverse effects on the reinforcement effect. These adverse effects are brought about by the increase in the moment arm acting on steel angle, and the reinforced steel angle applied on the specimen JG-4 are more likely to reach the yield strength than that of specimen JG-3.
Stiffness degradation
Stiffness is an important indicator in the evaluation of the seismic performance for a resisting system. During the loading process, the stiffness of the joints degenerates. It can be characterized by the secant stiffness of the specimen under low-cyclic reversed loading tests. The secant stiffness of the specimens can be calculated by equation (3)
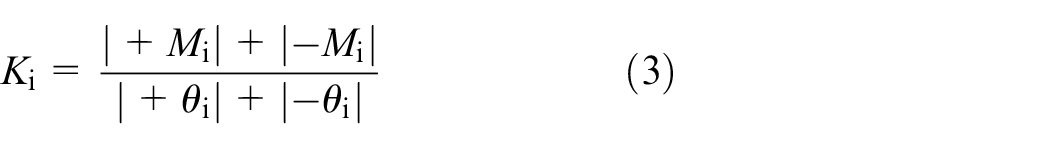
where +Mi(–Mi) is the peak moment in the positive (negative) direction of the ith cycle, and +θi(–θi) is the corresponding rotation angle. The calculation results are shown in Figure 10.

Stiffness degradation curves of specimens.
As shown in Figure 10, the stiffness changing trends of five specimens are similar, and it decreases with the increase in rotation angle. The stiffness of each specimen degrades rapidly before the rotation angle reaches 0.02 rad. This is mainly due to some initial gaps between tenon and mortise, and the slip of beam relative to column results in rapid degradation of the stiffness. After that, the stiffness decreased steadily. This is mainly due to the gradual vanishing of some initial gaps between components. With the increase in rotation angle, the accumulated damage in the joint increases continuously, and the stiffness continues to decline until the failure of specimen.
The initial stiffness in the reinforced specimens JG-1–JG-4 were improved by 249.6%, 252.7%, 310.2%, and 315.5%, respectively, compared with the unreinforced specimen BS. When the joint rotation angle is about 0.06 rad, the specimen BS is nearly to be damaged by the tenon pulling out, and the joint stiffness drops to a lower value. At the same rotation angle, the stiffness of specimens JG-1–JG-4 are obviously improved by 90.5%, 143.1%, 188.5%, and 188.5%, respectively, compared with specimen BS. As indicated in Figure 10, the stiffness of the steel angle reinforced specimens have been significantly improved, and the good reinforcement effects have been achieved. Comparing the specimens JG-1 and JG-2, it can be observed that the stiffness of the unilateral reinforced specimen is smaller than that of the bilateral specimen. By comparing JG-2–JG-4 specimens, it can be found that the stiffness of specimen increases obviously with the steel angle thickness, while the length of steel angle limb has less influence on the specimen stiffness.
Energy dissipation
Under the low-cyclic reversed loading, energy dissipation occurred through internal frictions, yielding steel members and nonrecoverable deformations in tenon. A measuring method of this energy dissipation is obtained by evaluating the area of hysteresis loops from the moment–rotation curves for each cycle (Chopra, 1995). It takes the sum value of energy dissipation on the left and right sides of each specimen, to obtain the cumulative energy dissipation for each cycle. The cumulative energy dissipation for specimens BS and JG-1–JG-4 are shown in Figure 11.
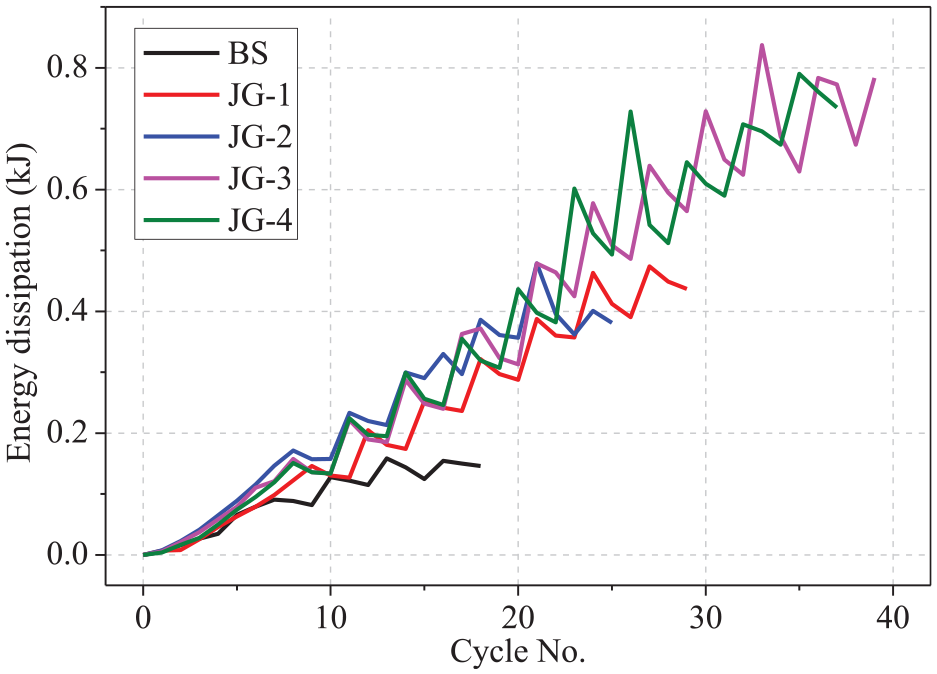
Cumulative energy dissipation for each cycle.
It is apparent from Figure 11 that the semi-tenon joints reinforced by steel angle show a strong energy dissipation capacity compared with the unreinforced specimen. The hysteresis energy dissipation was similar during the first four groups of loading cycles, indicating that the specimens behaved approximately slippage to the 0.02 rad. After that, the cumulative energy dissipation starts changing. This is mainly because that the steel angle used in the reinforced specimens plays a different role in energy dissipation. The energy dissipation of specimen reinforced by unilateral steel angle was slightly less than that of bilateral reinforcement. The energy dissipation of specimens JG-2, JG-3, and JG-4 shows little difference, and this demonstrates that the steel angle limb thickness and length have nearly the same effect on energy dissipation.
Pulling out degree of tenon
The tenon of specimen was likely to be pulled out under low-cyclic reversed loading as shown in Figure 5(c), and it is a dynamic changing process. Therefore, the variation of tenon pullout length (expressed by “Δ”) at different rotation angle was observed for each specimen, when the actuator was in its initial position. According to the above procedure, the tenon pullout length of specimens can be measured accurately and continuously. The results are shown in Figure 12, and the data are the maximum amount of the tenon pulled out in the right and left beams.
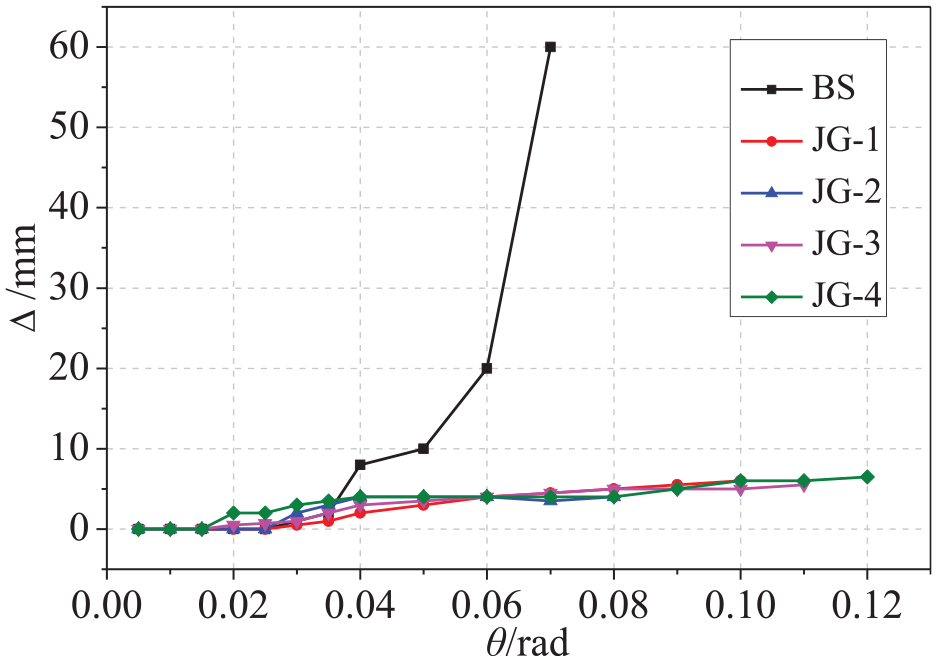
The tenon of specimens pullout degree in the rotation.
It is observed from Figure 12 that the tenon pullout length of all specimens increases with the rotation angle. Initially, the rotation angle is 0.02 rad, and the tenon pullout length of beam for each specimen is the same and relatively small, which is due to the initial gap between mortise and tenon, as analyzed above. However, it presents a different variation in the tenon pullout length for reinforced and unreinforced specimens, after the rotation angle is above 0.02 rad. The tenon of right beam pulling out quantity of unreinforced specimen BS increases rapidly with the rotation angle, and it exceeds 60 mm of the ultimate value when the rotation angle is 0.07 rad. Whereas the tenon pullout length of reinforced specimens JG-1–JG-4 rises slowly and changes linearly, and it remains below 10 mm until the end of test. This indicates that the semi-tenon joint reinforced by steel angle can effectively limit the tenon pulled out from the mortise. In addition, the pullout length of tenon does not change obviously with the reinforced style, steel angle thickness, and limb length.
Numerical analysis
The experimental results and observations presented in the previous section provide necessary information for the validation of numerical and analytical models of the semi-tenon joints reinforced by steel angle proposed herein. Thus, this section describes in detail numerical models by the general FE program ABAQUS for the purpose of simulating the response of the steel angle yield strength and limb thickness as well as limb length. The modeling method is presented below in details by describing the modeling parameters and validation researches.
Material properties and modeling techniques
The material properties of wood and steel components are based on the data obtained from the tests described in the previous section. The orthogonal anisotropy of wood material properties was considered in the process of establishing the FE model, ideal elastic–plastic model, and elastic model were undertaken in compression and tension of wood, respectively. The ideal elastic–plastic model was undertaken in compression and tension of steel. The elastic modulus, yield stress, and corresponding plastic strain of wood and steel are defined according to the results of material property tests shown in Table 2.
Detailed three-dimensional (3D) models were built using the FE program ABAQUS. Material orthotropic was defined using the “Engineering Constants” in the elastic stage of wood, and the “Hill” function was applied to define the different yield stresses in all directions of wood. To meet the requirement of the joint large deformation, the solid element of type “C3D8R” was adopted to control the mesh size of the main deformation areas of the mortise-and-tenon joint as well as steel components. The “General Contact” for the interactions of all components contact surface was invoked, and the “hard contact” was used to simulate the normal behavior in ABAQUS. The coefficient of friction between mortise and tenon, which ranged from 0.2 to 0.4 based on the previous results by Bejo et al. (2000), was taken as 0.35 in this article. However, the coefficient of friction between wood and steel was 0.2, according to the research in the previous study (Lemoine et al., 1970).
Model validation
The FE models described above were validated with the results of the experimental program described in section “Experimental results and discussion.”Figure 13 shows the comparison between numerical simulation and experimental curves of specimens JG-1 and JG-2. Figure 13 demonstrates that reasonable estimation of stiffness and bearing capacity can be obtained using the above detailed FE model. The FE estimation and the test moment–rotation relationships have some differences between 0.02 and 0.06 rad. This phenomenon can be attributed to initial gaps and defects of joint that impact its bearing capacity in the tests, whereas these imperfections were not observed in the numerical model. The results of the experiment and FE are approximations in the other stages. However, the numerical estimations agree well with the experimental moment capacity for both specimens.

Comparison of moment–rotation response between experimental and FE model for types B and C: (a) JG-1 and (b) JG-2.
Figure 14 illustrates the deformation patterns of specimens JG-1 and JG-2 at 0.07 rad, together with the corresponding numerical estimations. From Figure 14, it is evident that the deformation and plastic mechanisms are well captured by the proposed FE model. Similarly, the bolts nonlinear stresses observed are also captured by the numerical simulations.

Comparison of deformation patterns (stress in MPa):(a) JG-1 (θ = 0.07 rad) and (b) JG-2 (θ = 0.07 rad).
The yield strength of steel angle
As shown in section “Specimen fabrication,” the strength grade of steel angle used in the experiment is Q235B. However, a variety of steel angle grades with appropriate strength will be used for reinforcement in practical engineering. It is necessary to conduct further analysis on the seismic performance of reinforced semi-tenon joints with different steel angle strength grades. Specimens JG-1 and JG-2 are the referred samples selected for modeling, and the models were remarked as series MFU (referring to the unilateral reinforced specimen JG-1) and MFB (referring to the bilateral reinforced specimen JG-2). The yield strength fy of steel angle was selected as the change parameter to analyze the influence for reinforced semi-tenon joints with fy = 195, 235, 276, and 345 MPa, respectively.
Figure 15 presents a comparison in different steel angle yield strength about the numerical moment–rotation responses of MFU and MFB. The slope of each moment–rotation curve changes little with the increase in steel angle yield strength in the process of positive and negative loading, which indicates that the steel angle yield strength has no great influence on the initial stiffness of strengthened joint. The bearing capacity is similar when the rotation angle is 0–0.03 rad. After the rotation angle is beyond 0.03 rad, the bearing capacity starts to be different. This is due to the varying steel angle yield strength of different level bearing capacity. It can be observed from Figure 15(a) that the higher the yield strength of steel angle, the greater the bearing capacity of joint. Figure 15(b) shows a similar phenomenon. This is because the moment resistance of joint is also improved when the higher yield strength of steel angle is used.
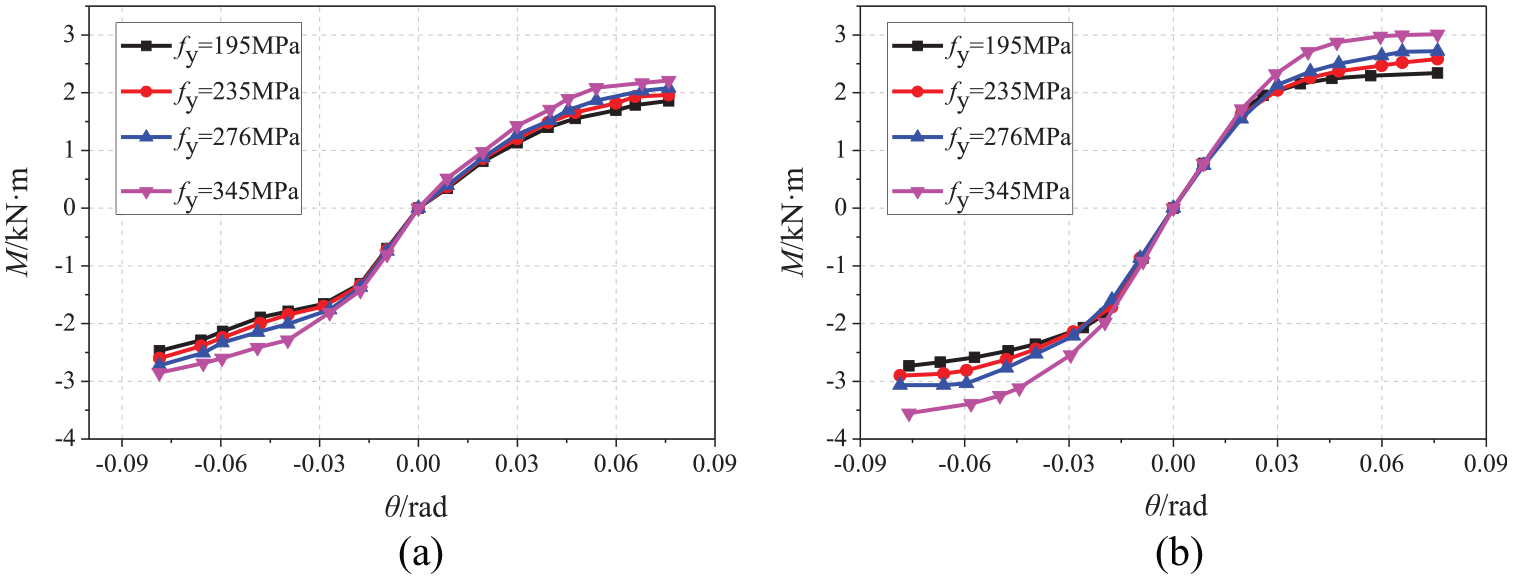
Comparison of moment–rotation response in different steel angle yield strength for MFU and MFB connections:(a) MFU and (b) MFB.
The limb thickness of steel angle
The experiment suggests that the influence of the reinforced steel angel limb thickness (t) on the ultimate capacity of the specimen is relatively remarkable, and the steel angel limb thickness significantly enhances the connection stiffness and bearing capacity. In order to further and better research the influence of the steel angle limb thickness on the bearing capacity, FE analysis were carried out with t = 6, 7, 8, and 10 mm, respectively. The models were remarked as series MTU (referring to the unilateral reinforced specimen JG-1) and MTB (referring to the bilateral reinforced specimen JG-2).
Figure 16 suggests that the flexural capacity increases with the increase in steel angle limb thickness, and the reinforced style has no effect on the bearing capacity. The bearing capacity of bilateral reinforcement is better than that of unilateral reinforcement in each stage by comparing Figure 16(a) and (b). The bearing capacity is different at the initial loading stage. This is due to the difference in steel angle thickness for different stiffness.

Comparison of moment–rotation response in different steel angle limb thickness for MTU and MTB connections:(a) MTU and (b) MTB.
The limb length of steel angle
The influence of steel angle limb length on the flexural capacity and stiffness of specimen was analyzed in the test, and the steel angle limb length did not have a distinct effect on the flexural capacity and stiffness. The steel angle limb length was changed for further study with l = 90, 100, 110, and 125 mm, respectively. These models were remarked as series MLU (referring to the unilateral reinforced specimen JG-1) and MLB (referring to the bilateral reinforced specimen JG-2).
Figure 17 depicts that the flexural capacity enhanced with the rotation angle. As suggested in Figure 17(a) and (b), the steel angle limb length has little influence on the joint bearing capacity before 0.05 rad, and the steel angle limb length has changed slightly after 0.05 rad. The bearing capacity decreases with the steel angle limb length at the same rotation angle. Nonetheless, the bearing capacity of models has no great difference. This is due to the increase in the force arm of steel angle limb when the steel angle of longer limb was used as explained before.

Comparison of moment–rotation response in different steel angle limb length for MLU and MLB connections:(a) MLU and (b) MLB.
Conclusion
The seismic behaviors of semi-tenon joints reinforced by steel angle in traditional timber buildings have been studied by means of experimental and numerical models. The main conclusions are as follows:
The failure mechanisms of unreinforced and reinforced semi-tenon joints connections were identified. For unreinforced semi-tenon joint, the tenon of beam was pulled out from the column, and this process develops slowly with the loading progress. For reinforced semi-tenon joints, the tenon of beam was broken, and this process develops from the tenon crack horizontally. The hysteresis curve of the unreinforced specimen is Z-shaped with the pinching and sliding effects. However, the hysteresis curves of reinforced specimen by steel angle are obviously plumper, and the “pinch” effect is weaker.
With the change in reinforced parameters, the bearing capacity of the specimens increases to a different level on every loading procedure. For ultimate flexural capacity, the specimen reinforced by bilateral steel angle is better than the specimen reinforced by unilateral steel angle. The influence of the steel angel limb thickness on the ultimate flexural capacity of reinforced specimen is relatively remarkable, and the steel angel limb thickness significantly enhances the flexural capacity of the connection. Conversely, the longer length of the steel angle limb will have adverse effects on the reinforcement effect.
The stiffness of the steel angle reinforced specimens has been significantly improved, and better reinforcement effect has been achieved. The stiffness of unilateral reinforced specimen is smaller than that of bilateral reinforced specimen, and it increases obviously with the steel angle thickness, while the length of the steel angle limb has little influence on the specimen stiffness.
The reinforced and unreinforced specimens have good deformation capacity. The semi-tenon joint reinforced by steel angle can effectively limit the tenon pulled out. In addition, the pullout length of tenon does not change obviously with the reinforced style, steel angle thickness, and limb length.
A series of FE models were developed to simulate the response of the steel angle in detail. The steel angle yield strength and limb thickness are helpful for the flexural capacity in the rotation. Whereas the steel angle limb length has little effect on flexural capacity.
When the semi-tenon joint of timber structure is inevitably used, bilateral steel angle reinforcement is a better choice. The steel angle thickness and strength within a reasonable range increases as much as possible. But the steel angle limb length should not be too long.
Footnotes
Declaration of Conflicting Interests
The author(s) declared no potential conflicts of interest with respect to the research, authorship, and/or publication of this article.
Funding
The author(s) disclosed receipt of the following financial support for the research, authorship, and/or publication of this article: This work was financially supported by the National Natural Science Foundation of China (Grant No. 51678478), National Key R&D Program in the 13th Five-year of China (Grant No. 2017YFC0703505), and Shaanxi Key Science and Technology Innovation Team project (Grant No. 2019TD-029).