



Abstract
The U-shaped steel–concrete composite hollow waffle floor is an innovative slender large-span floor system, where severe vibration may occur under human-induced excitations. In this research, a theoretical analysis and experimental testing are performed to explore the vibration behaviour of the composite hollow waffle floor. First, the natural frequency formula is proposed based on orthotropic thin plate theory, and the main rigidity calculation for the composite hollow waffle floor is given. Second, the mode shape, frequency and damping ratio of the composite hollow waffle floor are captured by on-site tests and validated by analytical and numerical methods, indicating that the floor has a low-frequency with a low damping ratio. Third, the vibration response of the composite hollow waffle floor is obtained by walking and running tests considering the influence of the frequency, spatial position, group size and route; in addition, the relationships between the values involved in the vibration evaluation are discussed. Finally, the composite hollow waffle floor presents satisfactory vibration performance evaluated by the threshold values among the current codes.
Keywords
Introduction
The U-shaped steel–concrete composite hollow waffle (CHW) floor is an innovative floor system proposed by Prof. KeJian Ma. The floor is made up of a reinforced concrete (RC) slab and composite hollow beams, where the upper beams, web members and lower beams form the latter (Figure 1). The height of the web members is smaller than the width, leading to a large shear stiffness and small height of the floor. The ample openings between the web members enable ducts and pipes to pass through without compromising the floor height; hence, the mass and earthquake action decrease. Moreover, the decrease in mass causes a load reduction on the supporting columns and beams, leading to smaller sized structural members and better economic efficiency.

The CHW floor: (a) components of the floor, (b) a factory building in Guiyang and (c) the gymnasium at Heilongjiang University of Chinese Medicine.
The slab and upper beams are in compression, and the lower beams are in tension under vertical loads. When the floor spans larger than 24 m, large cracks appear in the concrete lower beams. The U-shaped steel plates are placed at the side and bottom of the lower beams to delay the crack development of the concrete and enhance the tensile strength of the lower beams, hence the floor span is further enlarged. In addition, the U-shaped steel plates act as formwork during construction. Compared to a conventional floor (Fernanda et al., 2019; Lasheen et al., 2018; Pavic et al., 2001; Varela and Battista, 2011), the CHW floor presents superior structural performance for large span floors.
The CHW floors have been widely used in gymnasium buildings, large commercial buildings and museums in China. A two-story factory building with a span of 9 m × 12 m in Guiyang first adopted the CHW floor in 2001 (Figure 1(b)). The U-shaped plate was connected by a welded connection; however, larger residual deformation occurred owing to the high temperature of welding, which had a negative influence on the floor appearance. Since then, high strength bolts have been used to connect the U-shaped plates. The four-story gymnasium at Heilongjiang University of Chinese Medicine (2007) with a span of 39 m × 57 m is the largest span CHW floor in a multi-story building (Figure 1(c)).
Innovative large span floor systems such as the CHW floor, prestressed cable RC truss floor (Zhou et al., 2016), cable-supported beam structure-concrete slab composite floor (An et al., 2016), hybrid composite floor (Abeysinghe et al., 2013) and composite cold-formed steel (CFS) trusses and mortar slab floor (Tian et al., 2019) with fewer composite materials or high-strength materials induce a low fundamental frequency and damping of the floor, yielding large vibrations under excitation. The most common vibration sources are human activities, containing resonant excitations (walking and running) and impulse excitations (jumping and heel-drop). Low-frequency floors are mainly influenced by the former, and high-frequency floors are affected by the latter. Resonance occurs when the fundamental frequency of a floor approaches the range of human activities (Jones et al., 2011). Larger vibrations prompt people to feel uncomfortable or even panic (Salyards and Hua, 2015). Once the serviceability problem occurs, the maintenance cost is very large (Parnell et al., 2010). Thus, it is necessary to explore the dynamic behaviour of CHW floors due to human activity.
Researchers have conducted analytical (Chen et al., 2014; Li et al., 2018), numerical (Abeysinghe et al., 2013; da Silva et al., 2014) and experimental assessments (Nakamura and Kawasak, 2006; Racic and Pavic, 2010) on various floors under human excitations. Acceptable criteria have been published for vibration evaluation, including the AISC Design Guide #11 (Murray et al., 2016), International Standards Organization ISO 10137 (2007), British Standards Institution BS 6472-1 (2008), The Concrete Centre CCIP-016 (2005), Chinese Design Code for Concrete Structures (GB 50010-2010) and Chinese Technical Specification for Concrete Structures of Tall Buildings (JGJ 3-2010). Generally, the frequency and amplitude threshold are used for vibration control (Ebrahimpour and Sack, 2005). The analytical method for natural frequency is straightforward at the design stage. However, most of the formulas for predicting the frequency simplify the floor as simple-supported equivalent beams rather than a slab, which is inaccurate for a complicated orthotropic floor with ribbed beams, composite materials, and variable boundary conditions (Middleton and Brownjohn, 2009). The amplitude value is more accurate since it is directly related to the vibration response. However, the criterion values differ among the codes. Generally, the peak acceleration, root mean square (RMS) acceleration and vibration dose values (VDVs) are used for vibration evaluation.
It is difficult to stimulate a variety of human activities considering pacing routes by finite element analysis (FEA). In addition, there is no recommended damping ratio for a CHW floor. Thus, conducting experimental testing is essential and critical. Static tests (Hu and Ma, 2012) show that CHW floors have a significant stiffness and excellent bearing capacity similar to a plate. However, serviceability requirements govern large span floor systems rather than strength criteria (Rijal et al., 2015). There is still a lack of studies on the vibration response under human activities. Given this, this article focuses on a theoretical analysis of the natural frequency and experimental testing on the dynamic behaviour of a CHW floor and gives a comprehensive vibration evaluation of the floor.
The aims of this research are as follows:
To derive the fundamental frequency formula for the CHW floor based on orthotropic thin plate theory and give the simplified calculation method for the main rigidity.
To obtain the accurate damping ratio, frequencies, and mode shapes of the CHW floor from ambient vibration tests (AVTs) and validate the measurement by analytical and numerical analyses.
To capture the vibration response under walking and running excitations considering the influence of the frequency, spatial position, size number and route.
To discuss the relationship between the values involved in the vibration evaluation and evaluate the vibration serviceability performance of the CHW floor according to the current codes.
Experimental programme
Configuration of the research building
Field tests were conducted on a twin-tower building with a skirt commercial building located in Beijing, where the 27 m × 36 m roof of the skirt building adopts the CHW floor (Figure 2). The 1.4-m high experimental floor is supported by perimeter frames spaced at 9 m. The floor contains an 80-mm thick slab and multi-equally spaced (2.4 m) hollow beams. The sizes of the upper beams and lower beams are 400 mm × 400 mm (width × height) and 400 mm × 300 mm, respectively, combined with the 700-mm height of the web members. The U-shaped steel plates that wrap the lower beams are 16 and 8 mm along the x-direction and y-direction, respectively. High strength bolts are used to connect the U-shaped plates. Shear studs that are welded inside the U-shaped plates guarantee the cohesion of the steel and concrete. The structural frame was completed before the installation of any non-structural components during the tests.

The research building: (a) overview of the building and (b) on-site tests of the CHW floor.
The vibration behaviour of the CHW floor contains the modal properties and vibration response under human-induced excitation. Before conducting the ambient tests for the modal properties and human-induced excitation for the vibration response, pretest analyses were performed to determine suitable measurement points (MPs) for the ambient tests, as implemented by the finite element programme ABAQUS/CAE (2009). The material properties in the finite element model were in accordance with the measurements, where the steel elements had a density of 7800 kg m−2, an elastic modulus of 206 GPa, and Poisson’s ratio of 0.3, and the concrete elements had a density of 2600 kg m−2, an elastic modulus of 32.5 GPa and a Poisson’s ratio of 0.2. Shell elements (SR4) were selected for the simulation of the U-shaped steel plates and eight-node linear brick solid elements (C3D8R) were chosen for the concrete. Complete interaction was considered between the U-shaped plates and lower beams since enough studs were used to prevent slip. As a roof floor, the boundary condition was fixed at the bottom of the columns. A global size of 0.1 m was chosen for accurate calculation; moreover, the RC slab was divided into three meshes along the thickness to ensure the accuracy of the analysis. In total, 35 uniform grids of MPs spaced at 4.5 m (small dot in Figure 2(b)) were chosen based on the auto modal assurance criterion (MAC) values of the simulated mode sets to ensure that the mode shapes were separate from each other and that the modal properties are accurate.
FEA shows that the fundamental frequency of the floor is 5.99 Hz. Thus, the low-frequency floor is prone to vibrate under resonant excitations. Walking and running excitations are typical resonant excitations. Continuous walking is the worst possible loading scenario (Smith et al., 2007). Running excitations are more severe than walking excitations with a higher pacing frequency. Hence, the walking and running excitons are chosen as the human-induced excitations on the CHW floor.
Ambient tests for the modal parameters
AVTs were conducted to obtain the damping, mode shapes, and frequencies of the CHW floor. The testing devices contain a dynamic acquisition instrument (TST3827E; Test Electron, Jingjiang, Jiangsu, China) and five accelerometers (TST 126; Test Electron) with a bandwidth ranging from 0.25 to 100 Hz, a sensitivity of 3 V/g and a mass of 0.80 kg. For the limitation of the accelerometers 35 measurements were divided into nine sets according to the order of the MP numbers. Each set had one mutual reference sensor (large dot in Figure 2(b)) near the mid-span of the floor and four roving sensors, where the last set had only three roving sensors. Namely five accelerometers were needed for the first eight sets and four accelerometers were needed for the last set. The duration was 300 s for each set with a sampling frequency of 200 Hz.
Human-induced tests
The route, pacing frequency and tester numbers influence the vibration response during walking and running tests. Hence, two routes along the x-direction and y-direction were considered. The routes through the floor centre were 24-m long with five accelerometers equally spaced at 4.5 m (Figure 2(b)). The tests consisted of one-person walking and running with varying frequencies and multiple-people walking or running at a fixed frequency. ISO 10137 indicates that the common frequency ranges from 1.2 to 2.4 Hz for walking and 2 to 4 Hz for running. Hence, a person (weighing 70 kg) walked along routes with varying frequencies from 1.75 to 2.25 Hz and the same person ran along the routes with a varying frequency ranging from 2.70 to 3.45 Hz. In addition, 2–5 people (average mass of 75, 73.5, 70 and 70 kg) walked and ran along the route with fixed frequencies of 2 and 3 Hz, respectively.
Free vibration test results and theory analysis
Natural frequency prediction
A CHW floor with a span-to-height ratio larger than 20 can be idealized as an orthotropic thin plate. Sanchez and Murray (2010) stated that four built-in edge predictions could be accurate for the prediction of the natural frequency of large span floor systems. The experimental CHW floor is the roof of the skirt building, which is constrained by a dense column, deep beams and a twin tower. The columns are steel-reinforced concrete (SRC) columns, and the section of the beam is 600 mm × 2500 mm. Thus, clamped boundary condition is appropriate. Natural frequencies fmn of the plate satisfying the Kirchhoff hypothesis (He et al., 2010) can be derived using the energy method presented as follows (Cao, 1983)
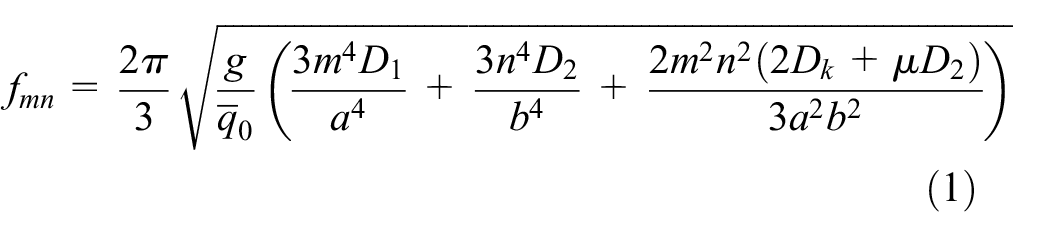
where a and b are the length of the plate along the x-direction and y-direction, Figure 3 shows the sketch for the calculation of the natural frequencies of the CHW floor; D1 and D2 are the flexural rigidities along the x-direction and y-direction; Dk is the torsional rigidity of the plate; μ is the Poisson’s ratio; g is the gravity acceleration;
The flexural rigidities D1 and D2 of the CHW floor associated with the x-direction and y-direction can be split into the flexural rigidities of the slabs and hollow beams per metre as expressed in equation (2)

where Ec and Es are the elastic moduli of the concrete and steel; I11 and I21 are the inertial moments of the slab to the centroid of all sections per metre along the y-direction and x-direction, respectively; I12, I13 and I22, I23 are the inertial moments of the concrete and U-shaped plates of a beam to the centroid of all sections in the y-direction, and I22 and I23 are the inertial moments of the concrete and U-shaped plates of a beam to the centroid of all sections in the x-direction; and a1 and b1 are the distances between the adjacent beams in the x-direction and y-direction, respectively, as shown in Figure 3.
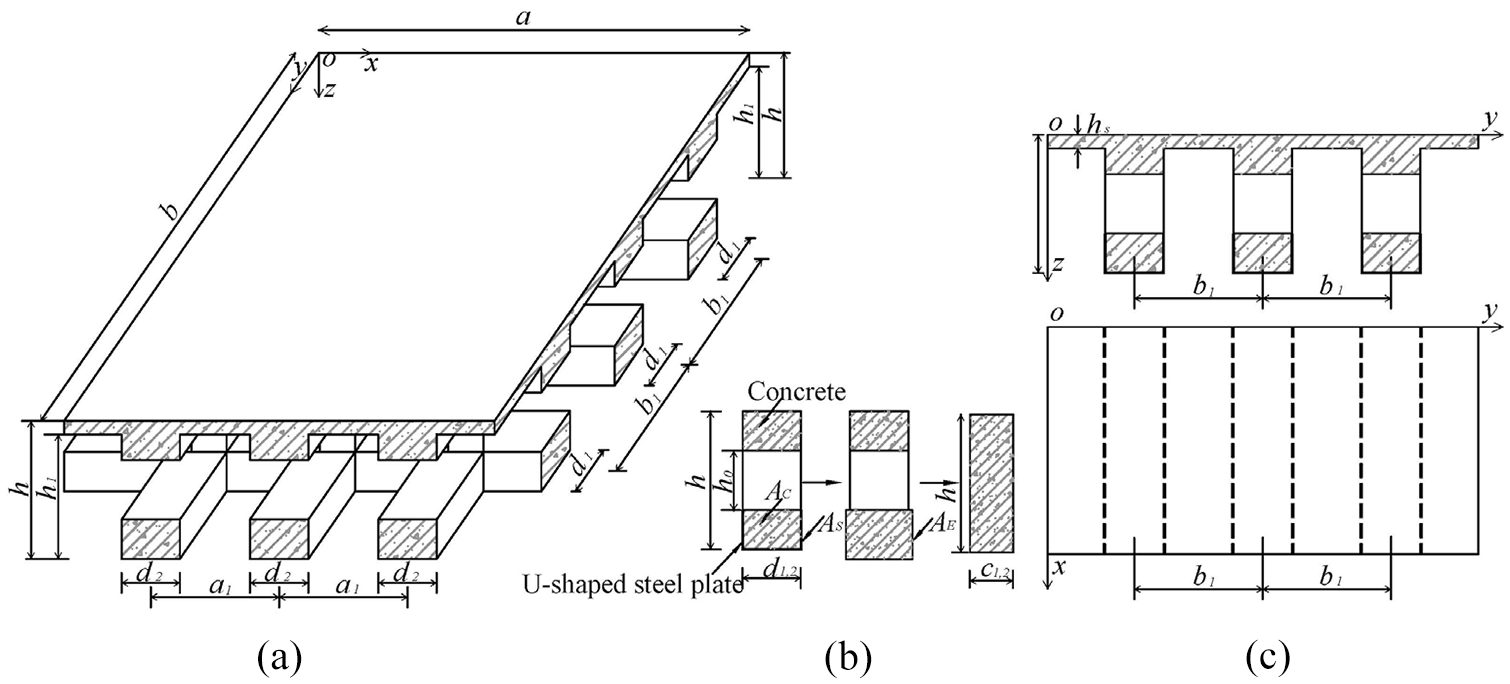
Sketch for the calculation of the natural frequencies of the CHW floor: (a) three dimensional sketch, (b) stiffness equivalent of the hollow beam, and (c) sectional drawing and plan.
The combined rigidity D3=2Dk+μD2 can be approximately calculated as follows
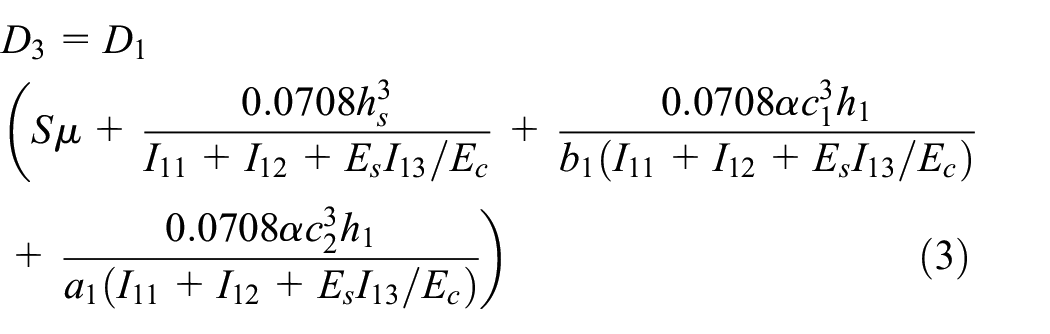
where h1 is the height of the beam calculated from the bottom of the slab (Figure 3(a)); hs is the thickness of the slab; c1 and c2 are the equivalent widths of the hollow beams (taking equal inertial moments for the steel–concrete hollow beam and solid concrete beams with the same height as shown in Figure 3(b)) along the y-direction and x-direction; and α is the coefficient listed in Table 1.
Coefficient α for the prediction of D3.

Modal properties from the ambient tests
Enhanced frequency domain decomposition (EFDD) overcomes the limitations of frequency domain decomposition with accurate damping (Altunisik et al., 2011; Pioldi et al., 2016). In this article, EFDD was used to ascertain the modal properties. Measurements from the ambient tests were filtered to eliminate the static component below 0.5 Hz and the burrs caused by mixed noises above 40 Hz before the operational modal analysis.
Figure 4 shows that the fundamental frequency of the floor is 6.25 Hz with a damping ratio of 2.35%, indicating that the CHW floor is a low-frequency floor system with low damping. The fundamental frequency from the analytical method is 5.1% (6.57 Hz) larger than the experimental value (6.25 Hz) and the numerical value (5.99 Hz) is 4.2% smaller than the experimental value. All methods are sufficiently accurate for the natural frequency prediction of the CHW floor. The floor behaves similar to a plate in free vibration. Specifically, the first mode is whole vertical bending with the largest amplitude occurring at the mid-span, and the second and third modes are bending along the short-span. The MAC values are used for comparisons between the numerical results and measured results, where the values are 0.951, 0.942 and 0.936 for the first three modes, providing further evidence of the vibration modes and suggesting that the data were good-quality data. As a critical parameter for energy dissipation, damping influences the intensity of vibrations. The damping ratio of the CHW floor obtained from the operational modal analysis is slightly larger than the value suggested by the codes, with a range of 0.8%–2% for the bare steel–concrete composite floor.
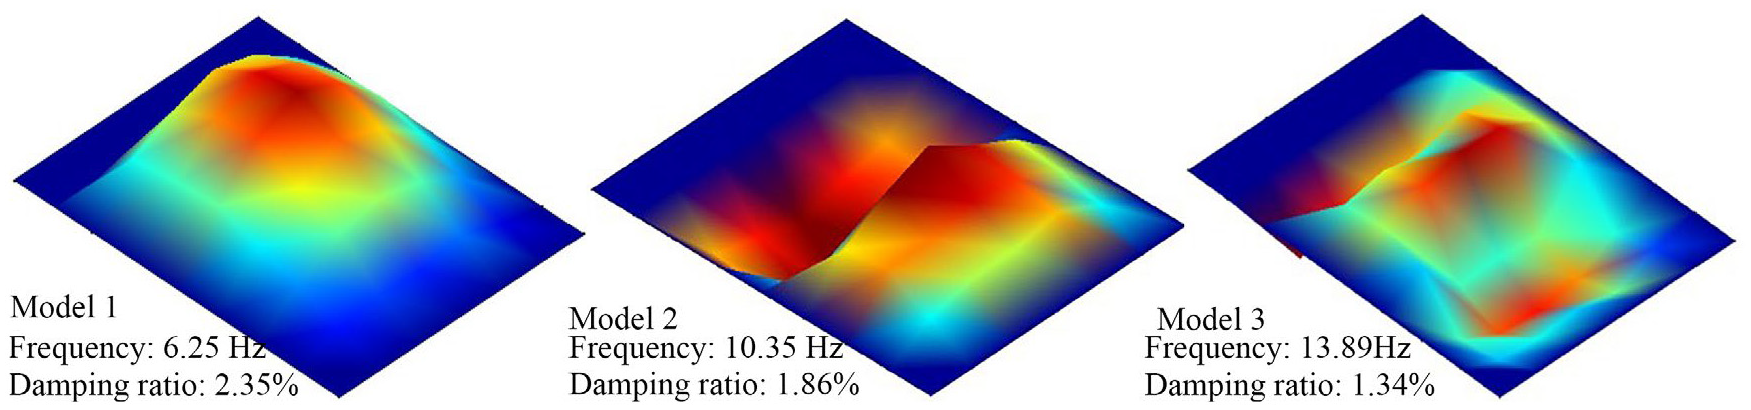
Modal properties of the CHW floor system from EFDD.
Human-induced test results and discussion
Representative value for the vibration evaluation
The RMS acceleration and VDV are the most commonly used values for vibration evaluation. The second edition of AISC DG 11 (2016) calculates the equivalent sinusoidal peak acceleration (ESPA) in terms of 1- or 2-s RMS acceleration with a multiplying factor of

where αw(t) is the frequency weighted acceleration adopting the weighing function given in BS 6472-1; t is the time and N is the number of MPs under a specific period. Smith et al. (2007) suggested an average of 1 s for the calculation of the RMS acceleration.
The British Standard Institute BS 6742-1 recommends the VDV as a better alternative criterion for both steady-state and transient excitations. The VDV is much more strongly impacted by vibration amplitude rather than duration, and the value can be calculated using equation (5)
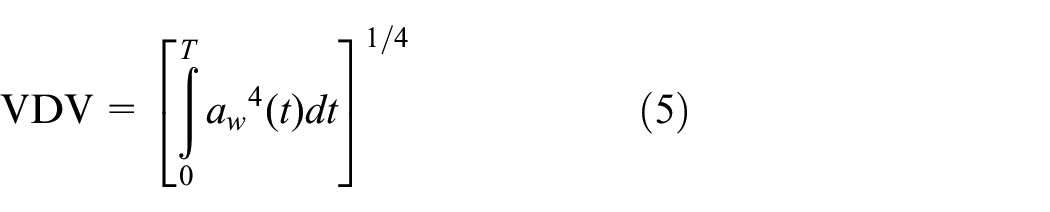
where αw(t) is the frequency weighted acceleration, t is the time and T is the total duration of the whole vibration response. In this article, the peak acceleration, αpeak; RMS acceleration, αRMS; peak 1-s RMS acceleration, α1-sRMS and VDV are used to assess the floor vibration.
Walking test results
Figure 5 shows the typical acceleration time curve and spectral power curve under a person walking at a speed of 1.6 ms−1 with a pacing frequency of 2 Hz. The walking curve is smooth, and the most severe vibration occurs at the mid-span. The power spectrum characterizes how the energy passed to the floor system from the impact of walking. Resonance occurs when the pacing frequency of walking matches the natural frequency of the floor, and the peak amplitude of the power in the frequency domain will occur at the natural frequency of the floor. As shown in Figure 5(b), the largest energy is concentrated at 6.25 Hz, which is the fundamental frequency of the floor. The CHW floor is a complicated composite orthotropic floor system with a nonuniform distribution of the mass and rigidity. A larger energy is also concentrated at the high modes with frequencies ranging from 25 to 35 Hz.
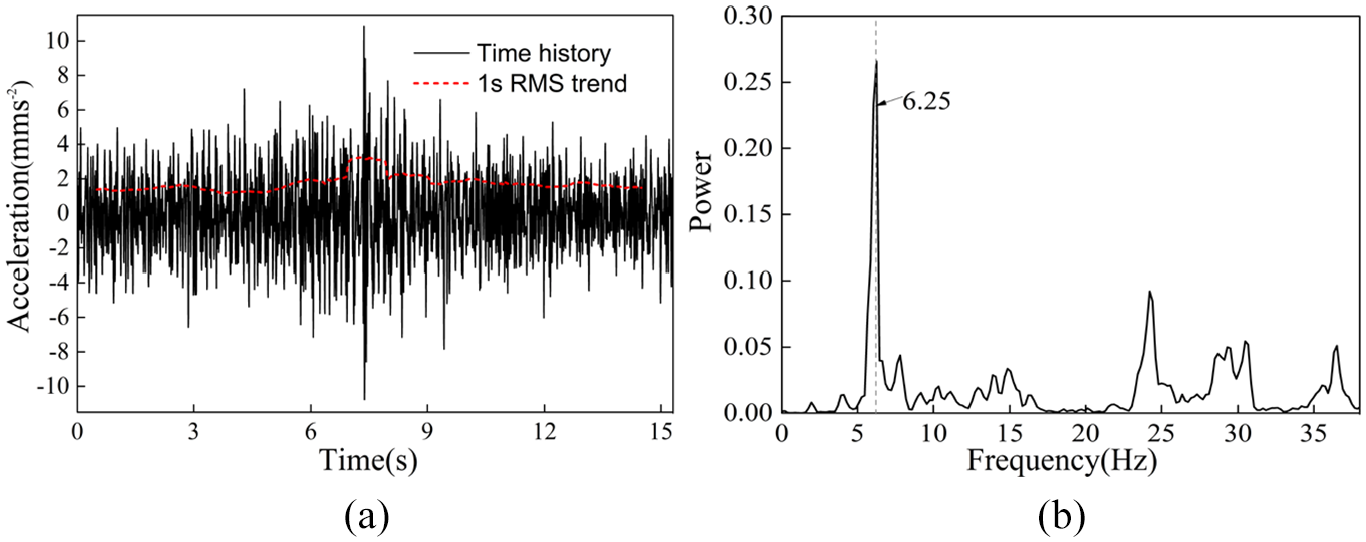
Typical time domain curve and frequency domain curve under tests for a single-person walking: (a) acceleration responses and (b) corresponding power spectrum.
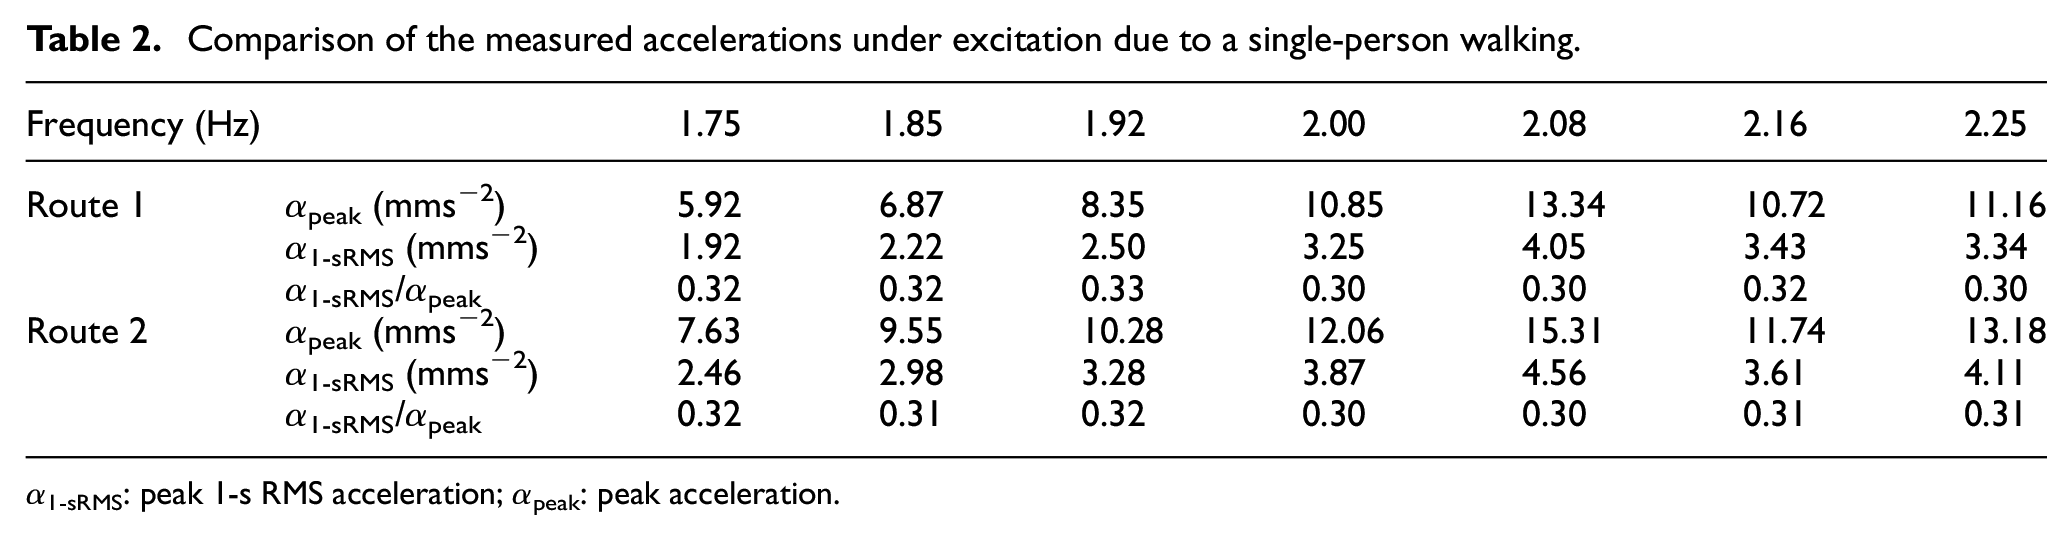
The mixed noise was eliminated by taking a low filter to remove the frequency above 40 Hz from the measurements. The vibration response measured at the floor centre under one-person walking is assessed in terms of the peak acceleration and peak 1-s RMS acceleration (Table 2). Generally, the vibration response increases with the increase in frequency, and the most significant acceleration occurs at the frequency of 2.08 Hz, which is the third harmonic of the fundamental frequency; this value is approximately 30% larger than the near frequency of 2 and 2.16 Hz. The accelerations obtained from route 1 (short-span) are smaller than those obtained from route 2 (long-span) at the same frequency. This is because the short span has a larger stiffness than the long span. Both route lengths are 24 m. As seen from Figure 2(b), the end of route 1 approaches the floor edge, with stronger constraints from the perimeter frame, yielding a smaller vibration response.
Comparison of the measured accelerations under excitation due to a single-person walking.
α 1-sRMS: peak 1-s RMS acceleration; αpeak: peak acceleration.
Table 2 shows that the ratios of the peak 1-s RMS acceleration to the peak acceleration (α1-sRMS/αpeak) under tests for one-person walking change slightly from 0.3 to 0.33. Based on the measurements, this article recommends that the peak acceleration should be multiplied by 0.32 for the quick calculation of the 1-s RMS acceleration under excitation due to a single-person walking. Figure 6 indicates that the vibration response weakens from the centre to the edge despite the varying frequency or group size. Larger group sizes generate more severe vibrations with a fixed 2 Hz pacing frequency. Specifically, the peak acceleration under one-person walking along route 2 is 12.06 mms−2, and the accelerations under two-people, three-people, four-people and five-people walking along route 2 are 1.88, 2.67, 3.25 and 3.89 times the value of a single-person walking. The peak acceleration per person decreased with increasing numbers of people, even when synchronization within a crowd takes place (Zivanovic et al., 2005). Although crowd walking was conducted following the metronome with a constant frequency (2 Hz), perfect synchronization was unlikely to be achieved.

Parametric study on the acceleration distribution under walking tests along route 2: (a) the influence of the frequencies and (b) the influences of the group sizes at a fixed frequency of 2 Hz.
Running test results
Figure 7 shows the typical acceleration time response and the corresponding spectral power due to a single-person running at a speed of 3.2 ms−1 with a frequency of 3 Hz. Running excitation is much more vigorous than walking, and the peak accelerations and the peak 1-s RMS accelerations are 4 times larger than the walking values. Different from the walking tests, the vibration response under running excitation is more dispersed. The power spectrum also indicates that the most significant energy concentration is at a fundamental frequency of 6.25 Hz. The second largest energy occurs at a frequency of 30 Hz, showing that high-order vibration modes may induce a severe vibration response.
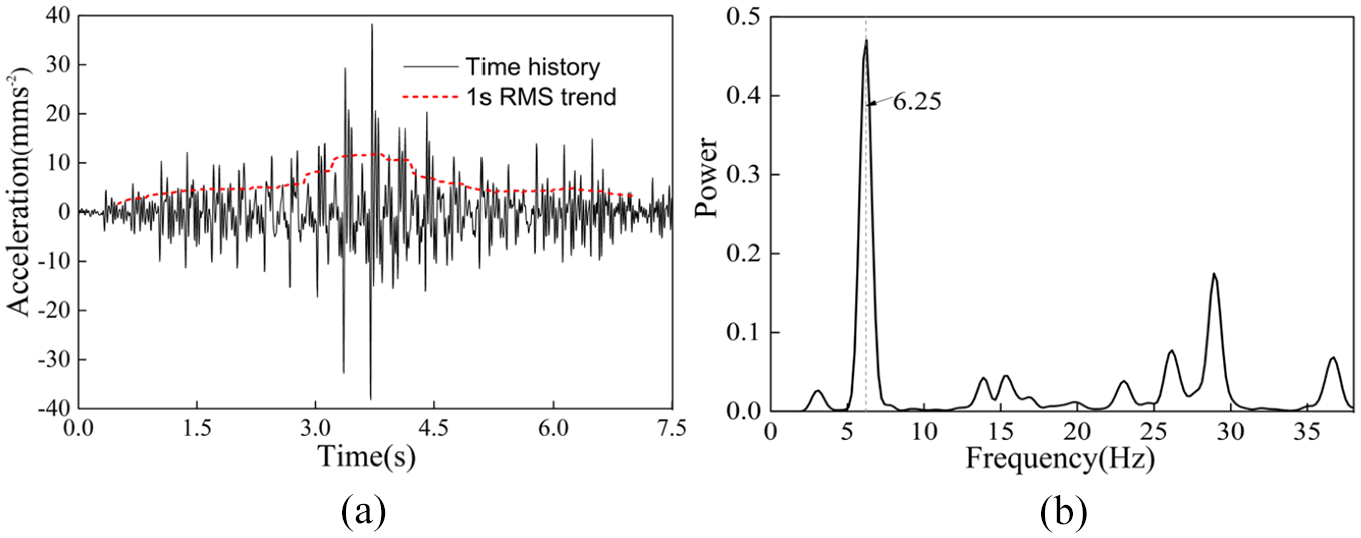
Typical time domain curve and frequency domain curve under excitation from a single-person running: (a) acceleration responses and (b) corresponding power spectrum.
Both the peak acceleration and peak 1-s RMS acceleration presented in Table 3 show that the largest vibration under tests for one-person running occurs at the second harmonic of the fundamental frequency, with a value of 3.12 Hz, and the peak acceleration is 77.13 mms−2, which is approximately 50% larger than the near frequencies of 3.0 and 3.25 Hz; the second largest value occurs at a frequency of 3.45 Hz, with a peak acceleration of 68.72 mms−2, which is the third harmonic of the second mode, and the largest running frequency. The vibration shows the characteristic of the transient response at a higher running frequency. Different from the walking tests, the ratio of α1-sRMS/αpeak decreases sharply from 0.33 to 0.2 with the increase in the frequency, where the minimum ratio occurs at the second harmonic of the fundamental frequency.
Comparison of the measured accelerations under excitation from a single-person running.

α 1-sRMS: peak 1-s RMS acceleration; αpeak: peak acceleration.
Figure 8 shows the accelerations from the running tests along route 2. The most dramatic response occurs at the floor centre. The vibration response decreases as the distance from the floor centre increases; the decline is sharper at a higher frequency. Generally, larger frequencies and group sizes generate a more dramatic vibration response, where the latter is more influential. The peak amplitude per person decreases more notably for the running test than for the walking tests with an increasing number of participants. Specifically, the peak acceleration under one-person running at a frequency of 3 Hz is 49.45 mms−2, and the accelerations under two-people, three-people, four-people and five-people running are 1.78, 2.45, 2.93 and 3.39 times the value of a single-person running. The amplification factor with an increased number of people running is smaller than that for the walking tests, indicating that the higher frequency and amplitude are for the activities, the harder it is to synchronize.
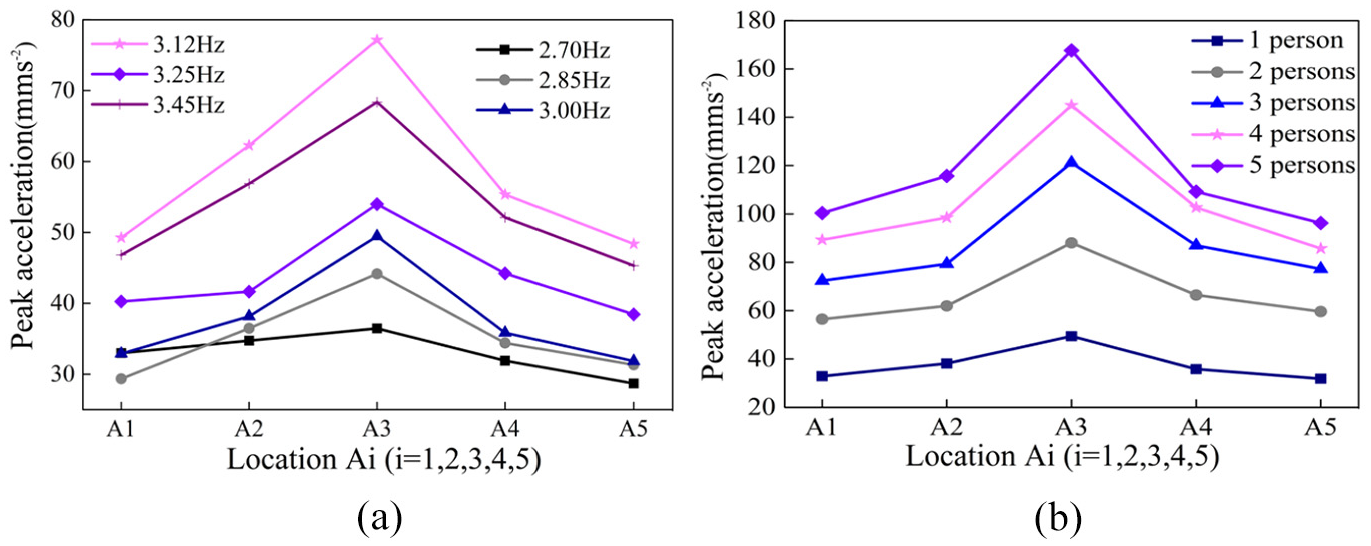
Parametric study on the acceleration distribution under running tests: (a) the influence of the frequency and (b) the influences of the size numbers at a fixed frequency of 3 Hz.
Summary and discussion
The measurements mentioned above show that running excitation is much more severe than walking excitation. Peak accelerations occur at the lowest nth harmonic frequency at the floor centre, the vibration decreases from the centre to the edge, and larger group sizes generate more severe vibrations. Walking tests present the characteristics of the steady-state and running excitations and show transient properties at a high frequency.
Griffin (1986) stated that if the ratio of the peak value to the RMS value (considering the full period of the vibration response) CF is larger than 6, the VDV should be used instead of the RMS value. In addition, BS 6742-1 provides an estimated vibration dose value (eVDV) calculation suitable for the CF value ranging from 3 to 6 described in equation (6)

where αRMS is the root-mean-squared value of the frequency-weighed acceleration and t is the total duration of the vibration exposure.
Tables 4 and 5 present the comparison between the VDV and eVDV with different CF values under excitations due to a single-person walking and running. Both results indicate that the CF values increase with the loading frequency; severe vibration occurs at the nth harmonic frequency. The ratio of eVDV/VDV (βe) decreases as the CF value increases. Table 4 shows that the βe ratio ranges from 0.95 to 1.08 under walking excitations, and the CF values range from 4 to 6. The data show that the empirical formula for the VDV calculation fits well for the real VDV under excitation due to one-person walking.
Comparison of the VDV and eVDV under excitation due to a single-person walking.

VDV: vibration dose value; eVDV: estimated vibration dose value.
Comparison of the VDV and eVDV under excitation due to a single-person running.

VDV: vibration dose value; eVDV: estimated vibration dose value.
Table 5 shows that the CF value is located in the range of 5–9 under excitation due to one-person running; most of the values are beyond the threshold value of 6 recommended by BS 6472-1. Different from the walking tests, the eVDV underestimates the VDV under running tests. Specifically, when the CF value is below 6, the βe ratio is underestimated by approximately 10%; when the CF value reaches 8.72, the βe ratio is undervalued by 27%. The difference is because running excitation is much more severe than walking excitation. The VDV is more sensitive to vibration than the RMS acceleration; when the vibration increases, the VDV increases sharply; however, the eVDV represented by the RMS acceleration increases slowly; hence, the eVDV underestimates the real value for running tests.
Assessment of the floor vibration response
Humans are the excitation source, vibration receiver and energy absorber. The frequency, amplitude, and duration of the excitation directly affect human perception. However, there is no globally agreed guide for floor vibration evaluation. The Chinese codes take the combination of the frequency and peak acceleration as the threshold. AISC DG 11 suggests the equivalent sinusoidal peak acceleration as the criterion. ISO 10137 adopts the RMS acceleration, and BS 6742-1 recommends the VDV for vibration assessments. Table 6 shows the values used to evaluate the vibration response of the CHW floor by the above codes from the measurements.
Accelerations and the VDV for vibration assessment.

VDV: vibration dose value; ESPA: equivalent sinusoidal peak acceleration.
GB 50010-2010 and JGJ 3-2010
GB 50010-2010 stipulates only the frequency threshold, and it recommends 3 Hz as the minimum value for the fundamental frequency of long-span public buildings. JGJ 3-2010 takes the combination of the frequency and peak acceleration as the threshold, which also suggests that the fundamental frequency of the floor should be no less than 3 Hz. The CHW floor meets the fundamental threshold with a value of 6.25 Hz. According to the commentary of JGJ3-2010, the acceleration value refers to ISO 2631-2 (1989), where ISO 2631-2 suggests a maximum 1-s RMS acceleration for the calculation of the maximum transient vibration value (MTVV). As a floor hanging garden with open-air restaurants and coffee houses, the peak acceleration of the floor should satisfy the shopping mall threshold by JGJ3-2010 (2010), with a threshold value of 150 mms−2. Table 6 indicates that the MTVV under excitation due to a single-person walking is merely 3.87 mms−2. Even with the largest vibration response under excitation due to five-people running, the MTVV of 41.87 mms−2 is much smaller than the threshold value of the shopping mall. Thus, the CHW floor presented excellent vibration performance by GB 50010-2010 and JGJ3-2010.
AISC guide
AISC DG 11 divides the floor into a low-frequency floor and high-frequency floor with a boundary of 9 Hz. For the low-frequency floor such as the CHW floor, AISC takes the c threshold for vibration serviceability with a multiplying factor for the ISO base curve. The ESPA value is in terms of the running RMS acceleration with a multiplying factor of
ISO 10137
ISO 10137 uses the RMS acceleration for the vibration assessment of continuous excitation. The criterion is also described as a multiplying factor for the base curve. For stadiums and assembly hall floors, a multiplying factor of 200 (1 ms−2) is recommended for comfort assessments in terms of the peak 10-s RMS acceleration α10-sRMS, and a multiplying factor of 400 (2 ms−2) is recommended for panic criterion in terms of peak the 1-s RMS acceleration α1-sRMS. As shown from the values in Table 6, the CHW floor can easily satisfy the threshold of ISO 10137.
BS 6472-1
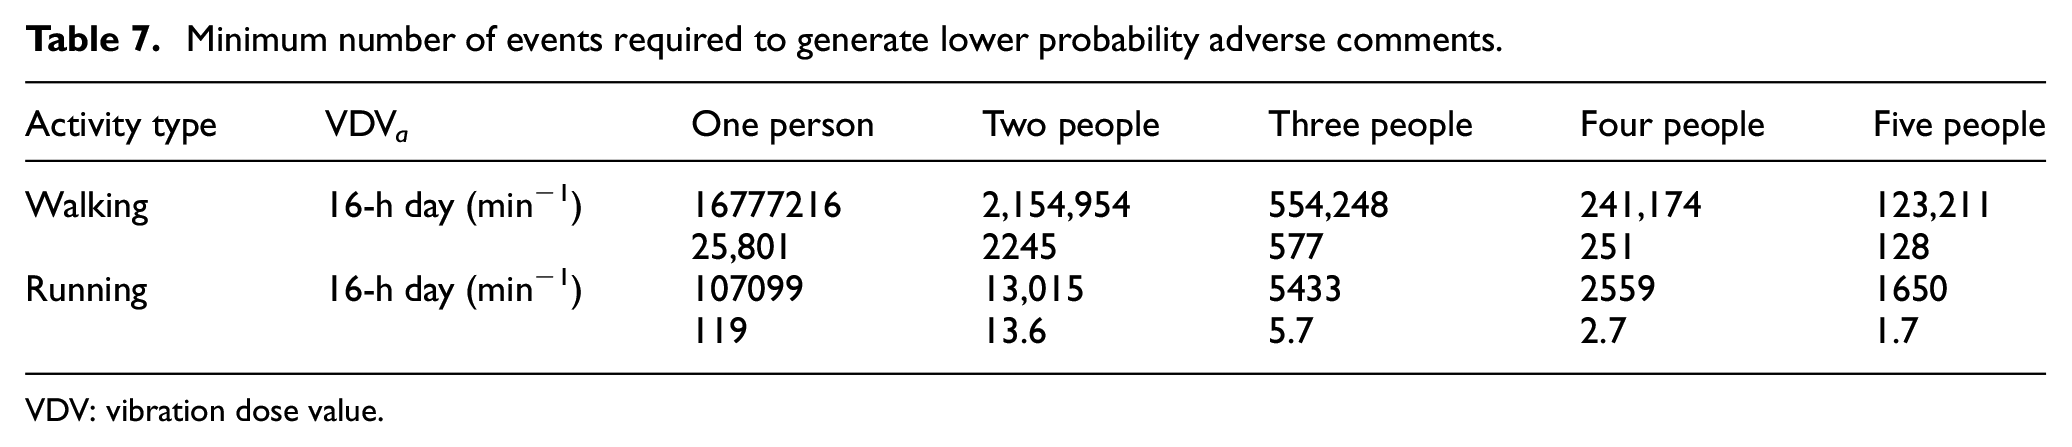
BS 6472-1 recommends the use of the VDV for vibration evaluation. The low probability of an adverse threshold value given by BS 6472-1 is 0.4 and 0.1 ms−1.75 during a 16-h day and 8-h night for the CHW floor. The minimum number of events na to exceed the threshold is defined in equation (7)

where VDV a is the threshold of the daily or nightly events. Table 7 summarizes the minimum numbers of walking and jumping activities for a low probability of an adverse threshold. The activities mainly occur during the day for a commercial building. Five people running 1.7 times/min have a low possibility in a commercial building during the day, and five people walking 128 times/min is very unlikely to happen. The CHW floor has a low possibility of exceeding the low probability of the adverse threshold; hence, the CHW floor shows excellent vibration performance by the threshold of BS 6472-1.
Minimum number of events required to generate lower probability adverse comments.
VDV: vibration dose value.
Based on the measurements, we carried out a numerical study on the parameters that influence the dynamic behaviour of the CHW floor system. In short, the small span (smaller than 20 m) CHW floor might experience a severe vibration response under human excitations, and the fundamental frequency of the large span CHW floor (larger than 40 m) approaches the frequency of human activities, leading to resonance; the medium-sized long-span (approximately 30 m) floors present the best vibration serviceability performance. In addition, controlling the span-to-height ratio at a small value is the best way to control floor vibration for the CHW floor system.
Conclusion
A comprehensive study was conducted to investigate the dynamic behaviour of an innovative long-span U-shaped steel–concrete CHW floor. The main conclusions are summarized as follows:
A fundamental frequency formula for the CHW floor is derived based on orthotropic plate theory, and the simplified calculation method of the main rigidity is given.
The modal parameters obtained from the ambient tests prove that the CHW floor is a low frequency (6.25 Hz) floor with a small damping ratio (2.35%). The fundamental frequency obtained from the analytical method and numerical model agree well with the measurement. The mode shapes show that the floor behaves similar to a plate.
Running excitations are 4 times larger than excitations from the walking tests. Peak accelerations occur at the lowest nth harmonic of the fundamental frequency at the floor centre, the vibration decreases from the centre to the edge and larger group sizes induce more significant vibration.
Walking tests present the characteristics of a steady-state, and running excitations show transient properties at a higher frequency. The ratio of the peak 1-s RMS acceleration to the peak acceleration remains constant at 0.32 for walking tests with varying frequencies; however, the ratio decreases sharply from 0.34 to 0.2 with a rising frequency of running. The eVDV formula for an approximate calculation of the VDV is suitable for walking excitations; however, the value is underestimated by running tests.
The CHW floor presents satisfactory vibration perceptibility by the threshold of the frequency, ESPA acceleration, peak RMS acceleration and VDV according to the Chinese codes AISC-DG 11, ISO 10137 and BS 6742-1.
Footnotes
Declaration of Conflicting Interests
The author(s) declared no potential conflicts of interest with respect to the research, authorship and/or publication of this article.
Funding
The author(s) disclosed receipt of the following financial support for the research, authorship and/or publication of this article: The work was supported by the National Natural Science Foundation of China (Grant number: 51374212).
