




Abstract
Three full-scale exterior beam–column joints with anti-seismic steel reinforcement were tested under quasi-static cyclic loading and column axial compressive loading. The test variables were column axial load ratio and joint core hoop reinforcement ratio. Experimental results, including failure mode, hysteretic curve, ductility, energy dissipation, stiffness degradation, and decoupling of deformations, were presented and analyzed. The tests revealed that the anti-seismic rebar resulted in good joint seismic performance and that column axial load ratio and joint core hoop reinforcement ratio impose limited influence of joint performance when the joint failed in beam flexural failure. The calibrated finite element models developed based on OpenSees were then used to simulate the behavior of joint specimens. Parametric studies via finite element modeling were performed to study the influence of various parameters on the performance of beam–column joints.
Keywords
Introduction
Based on extensive observation and investigation on damaged reinforced concrete (RC) structures after earthquakes, it is known that the failure of beam–column joints has been identified to be the main reason leading to the collapse or losing the stability of RC structures (Alaee and Li, 2017; Lee and Chang, 2017). Three main failure modes of RC beam–column joints were identified by Fenwick and Megget (2003), that is, flexural or shear failure of the beam, shear failure of joint core, and bond failure of the longitudinal reinforcement in the beam. Key factors exert influence on the failure mode and seismic performance of RC beam–column sub-assemblages, including axial load ratio, hoop reinforcement (or stirrups) ratio in joint core, and other parameters like concrete compressive strength and bond strength between steel bar and concrete (MacGregor et al., 1997; Park and Paulay, 1973).
For RC beam–column joints tested under quasi-static cyclic load, Ashtiani et al. (2014) found that the axial load ratio had little influence on the seismic performance of exterior and interior beam–column joints when the beam end flexural failure was dominated. The analysis of total lateral deflection of exterior beam–column joints indicated that lower axial load applied on column resulted in a larger ratio of shear deformation to total deformation (Ashtiani et al., 2014). However, if the shear failure of a joint dominated failure mode, larger axial load ratio contributed to a more obvious enhancement on joint ductility (Li and Leong, 2014), and the energy dissipation capacity increased with the increase of axial load ratio when the story shear force was small (Gao et al., 2019). The test results of four full-scale RC beam–column joints under different axial load ratios revealed that the failure mode shifted from beam end flexural failure to shear failure of joint core resulted in a smaller deformation capacity (Masi et al., 2013), which was favored by Haach et al. (2014) who further indicated that it was ultra-necessary to determine how to design a joint with target failure mode.
In terms of the effect of the joint core hoop reinforcement ratio on the structural response of RC beam–column joints, many interesting findings have been revealed so far. One interesting thing is that the conclusions vary with different failure modes. Ashtiani et al. (2014) designed six full-scale RC interior beam–column joints as per New Zealand Standard (NZS 3101, 2006). The joints were failed by excessive rotation of the plastic hinges of the beam end close to the face of the column. The results indicated that the joint core hoop reinforcement ratio showed little influence on the seismic performance of the joint and that the code specified stirrup arrangement was conservative since no yield of stirrups was observed. For joints failed in shear, however, the ductility increased as the increase of joint core reinforcement ratio (Gao et al., 2019); the hoop reinforcement in joint core could enhance the seismic and shear capacities and played a key role in the later stage of loading (Alva et al., 2007) or at lower ductility levels of joints (Durrani and Wight, 1985). Nevertheless, when the joint core hoop reinforcement ratio increased from 0.41% to 1.10%, no obvious differences were observed for both interior and exterior joints (Fujii and Morita, 1991).
The experimental and numerical results showed that the concrete compressive strength exerted an insignificant influence on the seismic performance of exterior (Li and Kulkarni, 2009) wide beam–column joints. Other researchers found that the concrete compressive strength was a major parameter that affected the shear failure and shear capacity of RC joints (Alva et al., 2007). Joints designed as per different philosophies may fail in different modes, therefore resulting in different seismic responses, for example, bond critical failure for gravity load design and joint shear failure for “Non-ductile” as well as “Ductile” design (Sasmal et al., 2013).
Based on the above review of existing studies, the influence of parameters on the structural performance of RC beam–column joints varies with different joints’ failure modes. To further investigate the influences of axial load ratio, joint hoop reinforcement ratio, concrete compressive strength, and longitudinal reinforcement ratio in beam element on the seismic performance of RC beam–column joints, extensive experimental and numerical studies were carried out in the current study. Some critical indicators for the evaluation of the seismic performance of joint, for example, failure mode, ductility, hysteresis response, energy dissipation, stiffness degradation, and so on, were presented, compared, and analyzed. In addition, the relative contributions of different components to the overall specimen deflection were quantified.
Experimental program
RC beam–column joints
Three full-scale exterior RC beam–column joints with high-strength reinforcement (HRB500E is the designation of the reinforcement used in the current tests) were designed and fabricated as per Chinese design code GB 50010-2010 (2010). The joint specimens were labeled as SP1, SP2, and SP3. The geometric properties and reinforcement details of joints are shown in Figure 1(a) and Table 1. The cross-section for beam element was 300 mm in width and 400 mm in depth. Both the top and bottom longitudinal reinforcements for beam element were comprised of four steel bars with a diameter of 16 mm (Figure 1(a)), and the thickness of the concrete cover was 25 mm. The transverse reinforcing steel bars for beam element within the critical region were 10 mm diameter arranged in an 80-mm center-to-center spacing. The column element had a square cross-section with a 400-mm side length. The longitudinal reinforcement comprised of twelve 20-mm diameter steel bars, as shown in Figure 1(a). The hoop reinforcement was arranged at a 100-mm center-to-center spacing.

Details of tests: (a) detailing of SP1 (unit: mm) and (b) schematic of test setup.
Details of specimens.
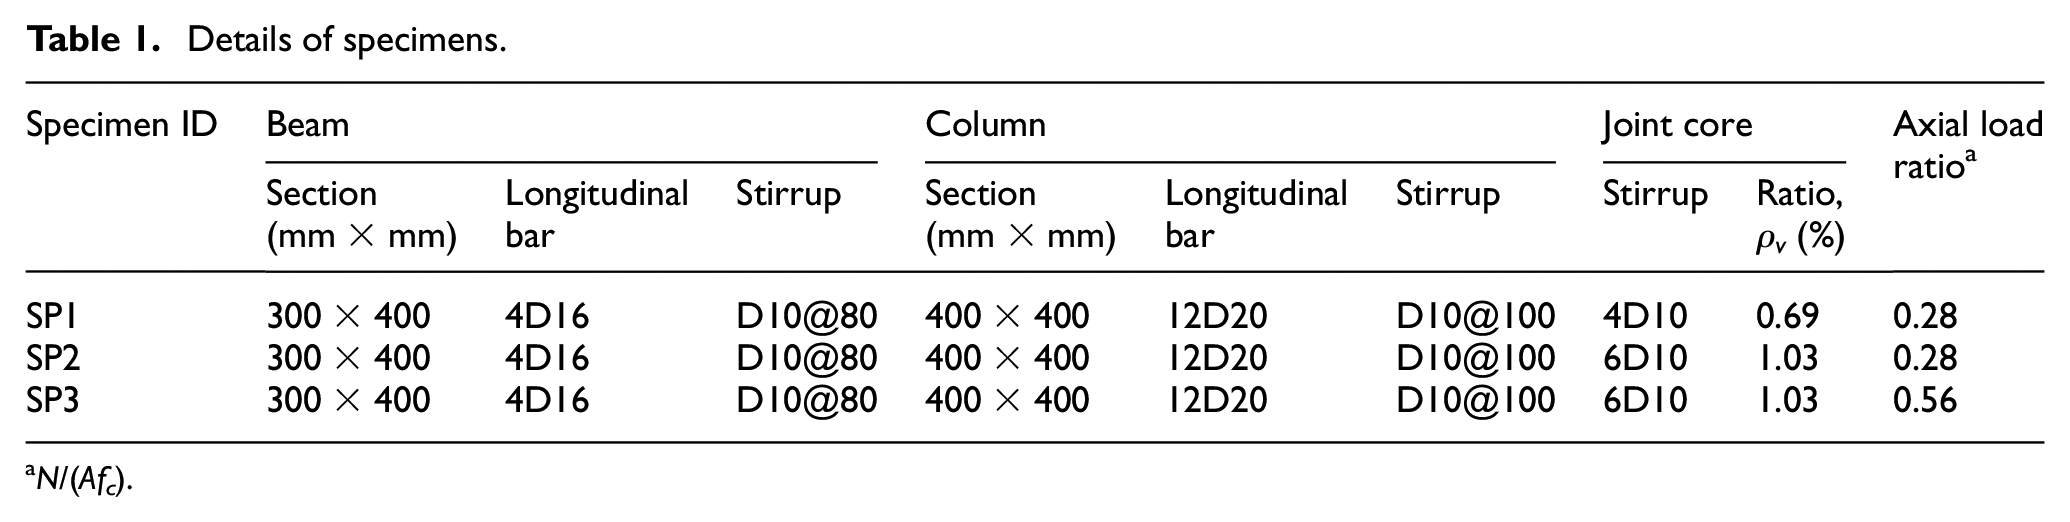
N/(Afc).
The dimensions and reinforcement details for SP1 are illustrated in Figure 1(a), which is the same as that of SP2 and SP3 except for the joint core hoop reinforcement ratio. The main test variables were joint core hoop reinforcement ratio and axial force ratio, which were 0.687% (SP1), 1.03% (SP2), and 1.03% (SP3), as well as 0.28 (SP1), 0.28 (SP2), and 0.56 (SP3), respectively.
Material properties
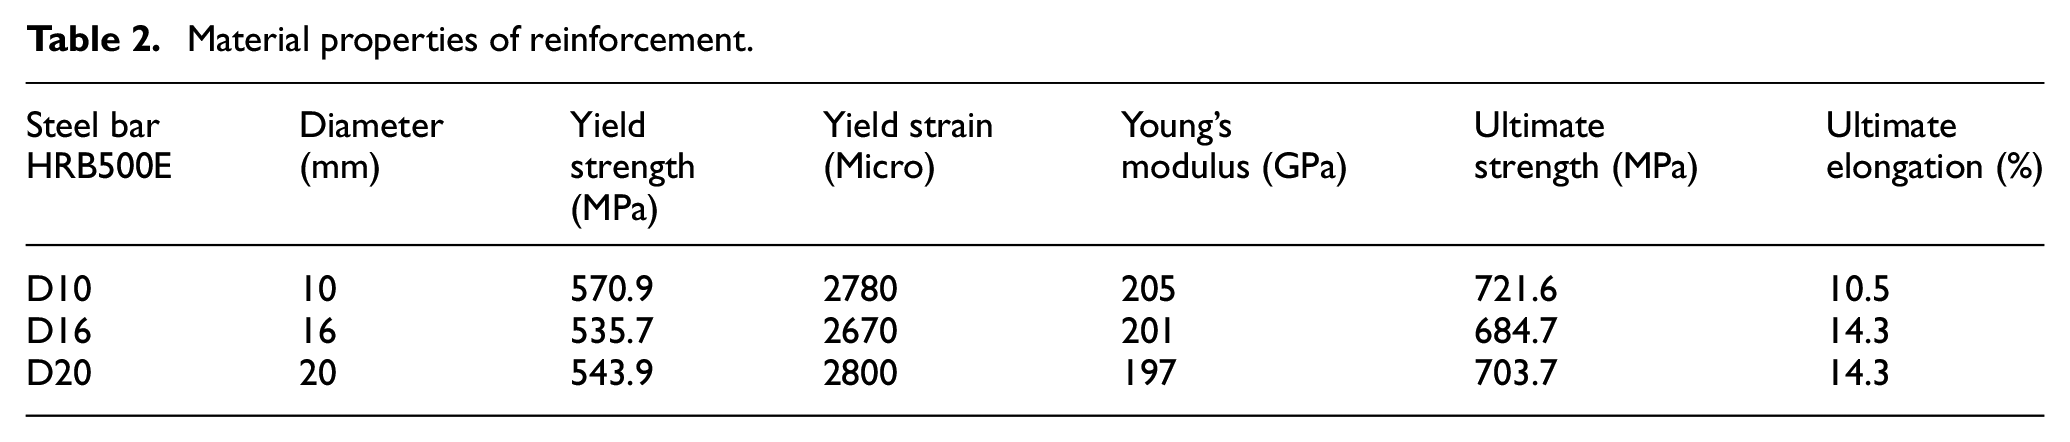
Following ASTM A370 (2012), the mechanical properties of the reinforcing bars were evaluated by standard coupon tests. The average values of three bars for each type of steel reinforcement (HRB500E, with a diameter of 10, 16, and 20 mm) are given in Table 2. The concrete used in the tests was designed to be grade C50 (compressive strength = 50 MPa). Concrete cubes (100 × 100 × 100 mm3) were cast with the same batch of concrete and cured under the same condition as the joint specimens. The average concrete compressive strength from those cubes was 48.8 MPa. All the three RC joints were tested within 1 week; thus, the compressive strength of concrete obtained was supposed to be the same on the day when the joint tests were conducted.
Material properties of reinforcement.
Test setup, loading regime, and instrumentation
The test rig is shown in Figure 1(b). Each joint specimen was subjected to quasi-static load reversals that simulated earthquake loads. Constant axial load magnitudes
Both the force and displacement control modes were adopted in applying the quasi-static load reversals. A force control loading manner was utilized before the yield of longitudinal reinforcement. The magnitude of the load was set at ±0.3Py, ±0.6Py, and ±0.9Py, where Py represents the yield load of the beam element. Once the longitudinal reinforcement yield, displacement control was adopted, the magnitudes of which were set at ±1Δ y , ±2Δ y , ±3Δ y up to the failure of the joint specimen, where Δ y represents the yield displacement. Both the force and displacement loading cycle were repeated two times, as shown in Figure 2(a). The test was terminated when the residual peak force of the hysteretic loop is below 0.85Fmax, where Fmax is the load capacity of the joint specimen.
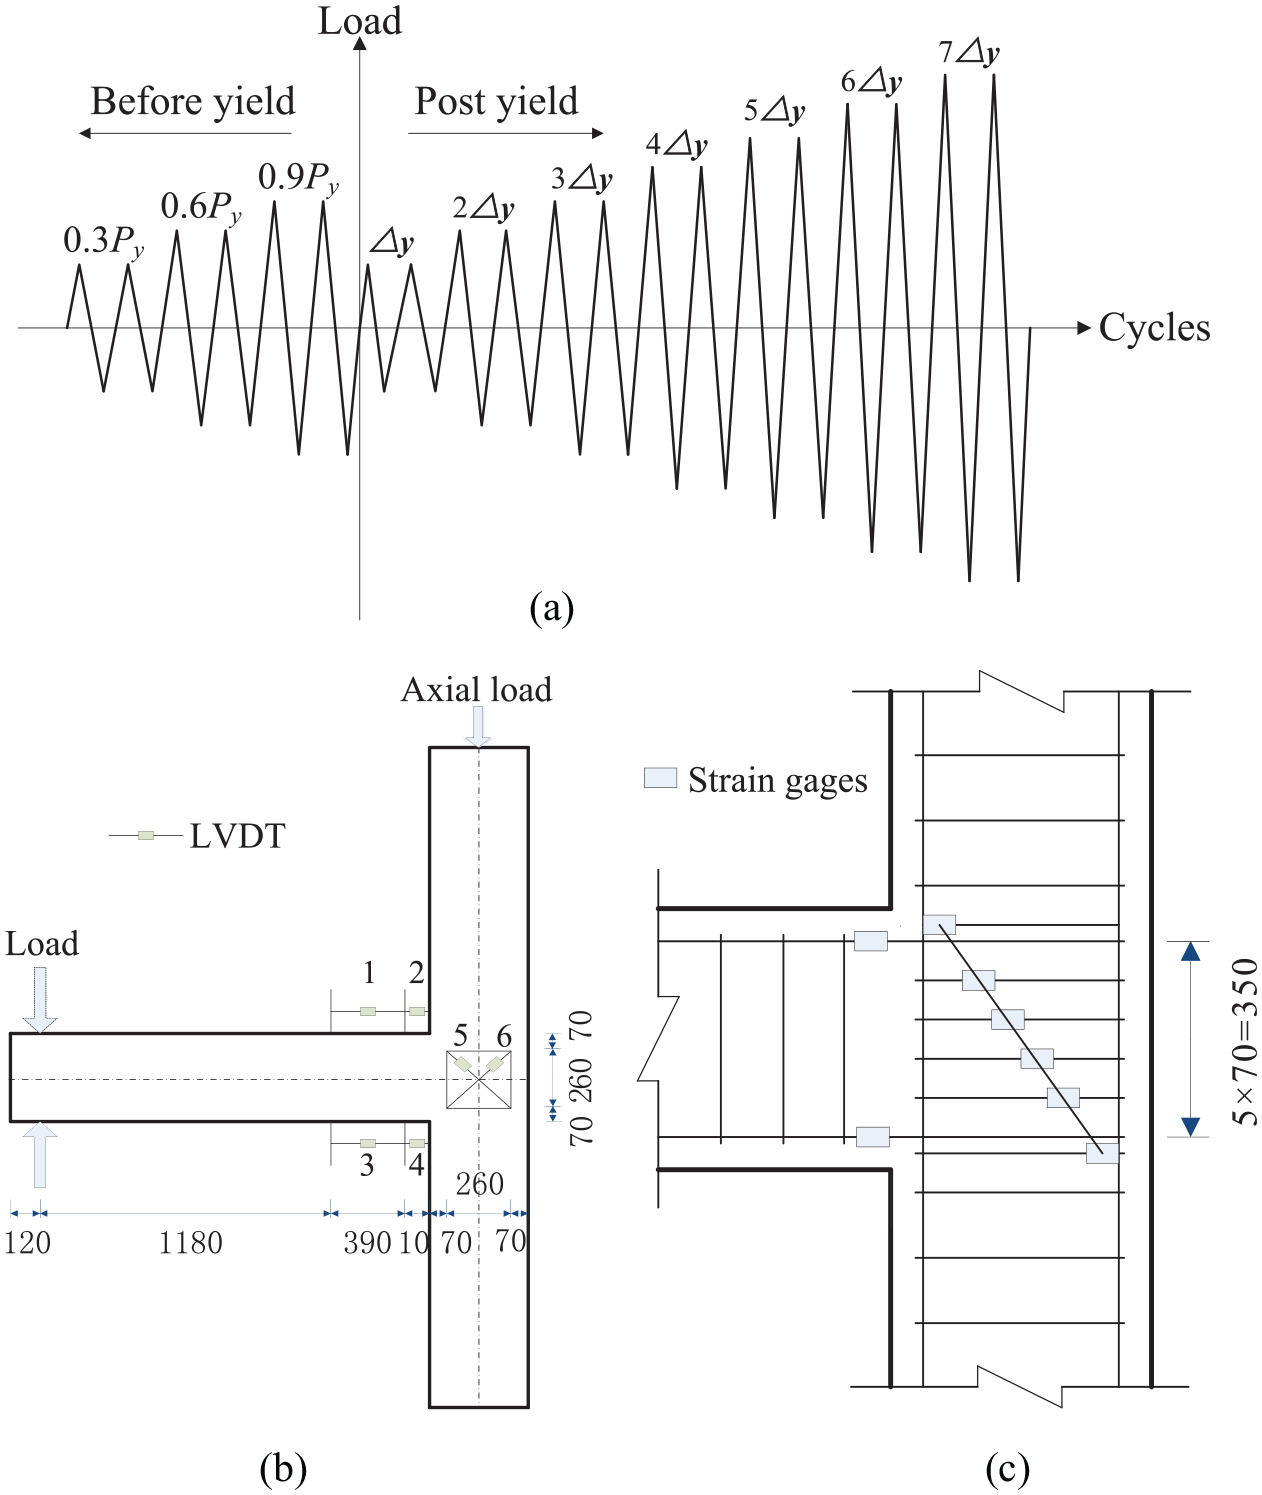
RC beam–column joint test: (a) loading regime, (b) LVDTs, and (c) strain gauges.
The specimens were instrumented with measuring devices such as strain gauges and linear variable differential transformers (LVDTs) to understand their behavior such as strains, deformations, and cracking patterns when subjected to cyclic loading. The recorded load during a test and the corresponding displacements, deformation, and strain data were then used to analyze the structural behavior of the RC beam–column joints under cyclic loading. The position of measuring devices is shown in Figure 2(b) and (c).
Experimental results and analysis
Cracking process and failure modes
Figure 3(a) to (d) shows the crack propagation of SP1 at different selected loading levels. A hand-held crack width comparator was utilized to measure the crack width values for both beam component and joint core. Shortly after load reversals reaching 0.3Py, three to four flexural cracks were observed in the upper and lower sides of the beam, and those cracks with the maximum crack width of 0.13 mm were distributed within a 300-mm length from the column face. When the load reversals increased to 0.6Py, the existing flexural cracks in upper and lower sides became inclined and penetrated the beam section. Meanwhile, the maximum crack width increased to 0.33 mm. Diagonal cracks appeared in the joint core when the external load increased to 0.9Py, among which the maximum crack width was around 0.05 mm (Figures 3(a) and 4(b)). The principal stresses formed in the joint core will cause diagonal cracking when the principal stresses are larger than the cracking resistance of concrete (Hu and Wu, 2017; Wu and Hu, 2017).
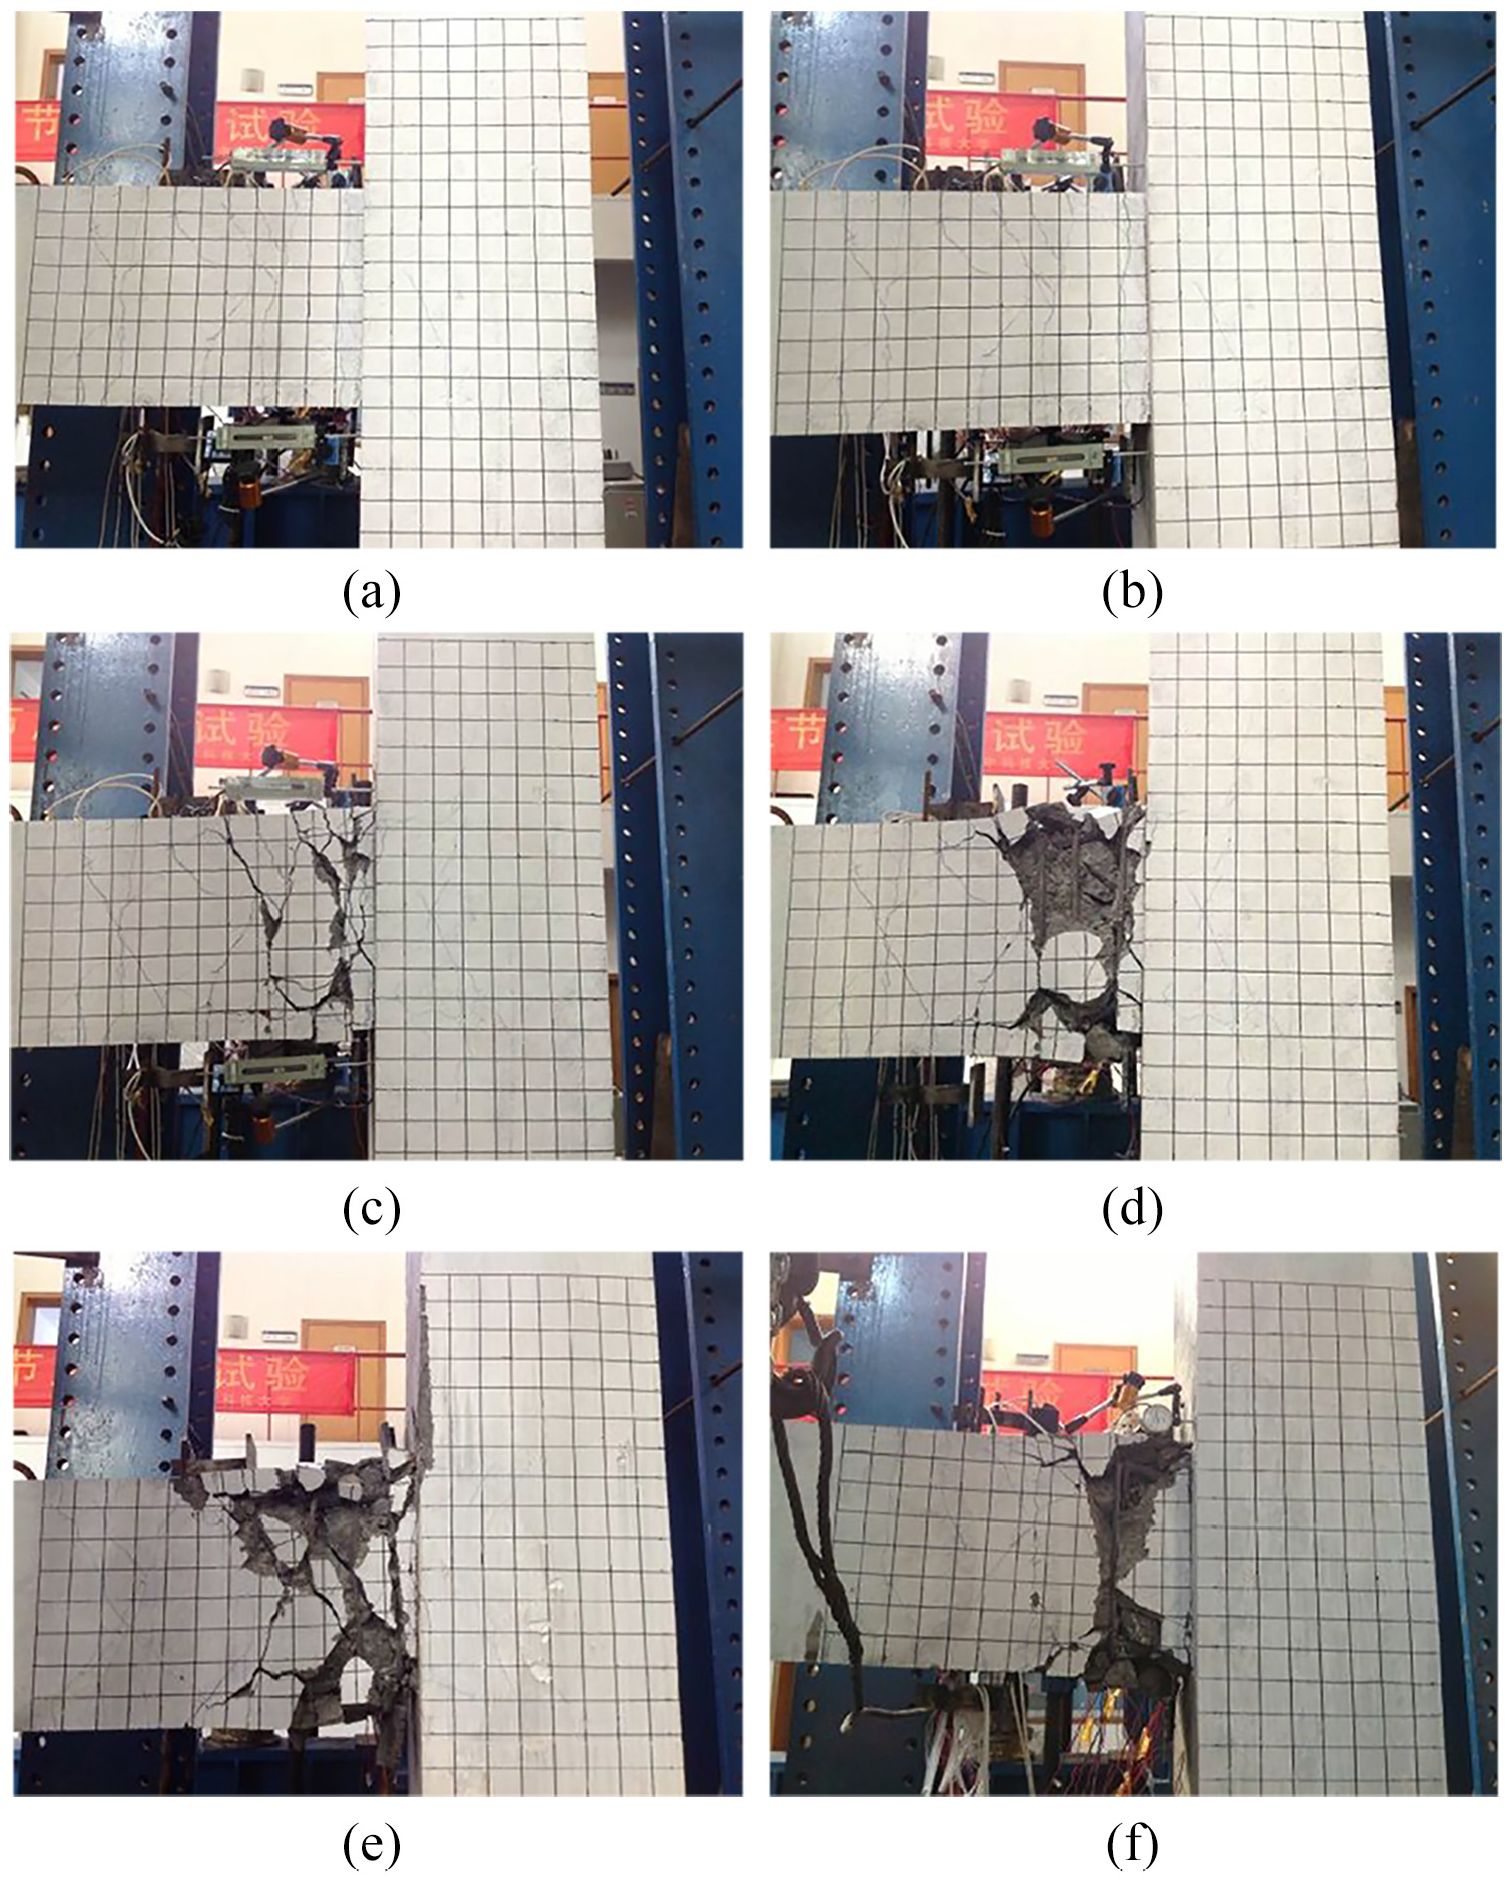
Cracking patterns: (a) 0.9Py (SP1), (b) Δ y (SP1), (c) 5Δ y (SP1), (d) 7Δ y (SP1), (e) SP2 (ultimate state), and (f) SP3 (ultimate state).

Crack width: (a) crack width in the plastic hinge zone and (b) crack in the joint panel.
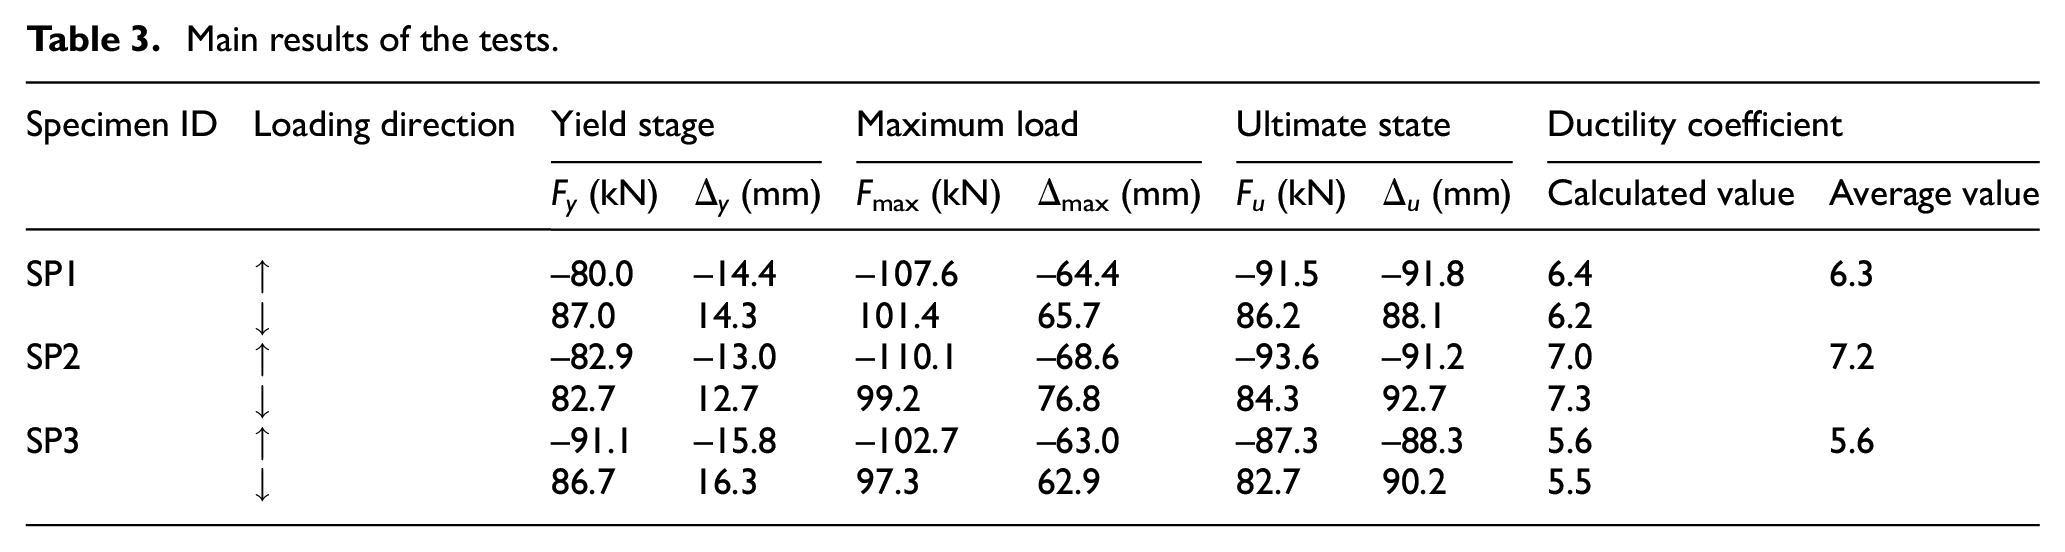
Once the yield of flexural steel was detected by strain gauges, displacement control took over. Notably, the strain gauges installed on hoop reinforcement in the joint core did not work at the time of testing possibly due to the casual damage caused during concrete casting. With the gradual increase in displacement, the inclined cracks in the beam propagated and widened gradually. When the displacement came to 2Δ y , the maximum crack width for beam and joint core were 2.0 and 0.07 mm, respectively (Figure 4(a) and (b)). Concrete blocks near the face of the column slightly peeled off when the load reversals came to 3Δ y , and the maximum crack width in the beam was 3.0 mm. The load capacity of beam, which was +101.4 and –107.6 kN, was reached at 5Δ y load reversals, associated with the relatively more significant concrete peeling and exposure of stirrups (Figure 3(c)). Significant damage of beam in the so-called plastic hinge zone was observed at load reversals of 7Δ y (Figure 3(d)). The test was stopped when the externally applied load decreased to a value (78.9 kN) less than 85% of the capacity of the joint (86.2 kN), as depicted in Figure 3(d). The cracking processes and crack patterns of SP2 and SP3 were similar to that of SP1, as shown in Figure 3(e) and (f), respectively.
The maximum crack width in the plastic hinge zone of the beam at different load levels is compared in Figure 4(a). It seems that either larger joint core hoop reinforcement ratio or axial load ratio contributed slightly to restrain the crack width of the beam component under a joint failed by beam flexural failure. This may be because the longitudinal beam reinforcement of the exterior joint is anchored by hooks, the bond of which is improved by an increase in the confinement by the joint transverse reinforcement and column axial load (Kim and LaFave, 2007). The measurement of crack width was abandoned when the crack width is larger than 5 mm. Figure 4(b) shows the comparison of the crack width in the joint core of SP1, SP2, and SP3. The diagonal cracks in the joint core of SP1 with a low joint hoop reinforcement ratio occurred earlier than that of SP2 with high joint hoop reinforcement ratio. Because more joint transverse reinforcement provided more even constraining force, which could delay the joint core crack and slow the propagation of the cracks down. This is consistent with the existing findings (Kim and LaFave, 2007; Sasmal et al., 2013). For SP3, as the increase of axial load ratio, the opening of diagonal cracks was well restrained, resulted in the extreme smaller crack width that could not be detected by the hand-held crack width comparator.
Hysteretic responses
The load–displacement curve was obtained by recording the load and vertical displacement of the loading point at the beam end. The hysteretic responses during cyclic loading for the three specimens are shown in Figure 5(a) to (c), based on which the ductility capacity and energy dissipation efficiency can be evaluated. Although the main parameters, that is, axial load ratio and joint hoop reinforcement ratio, were different, their overall hysteretic curves are generally similar.
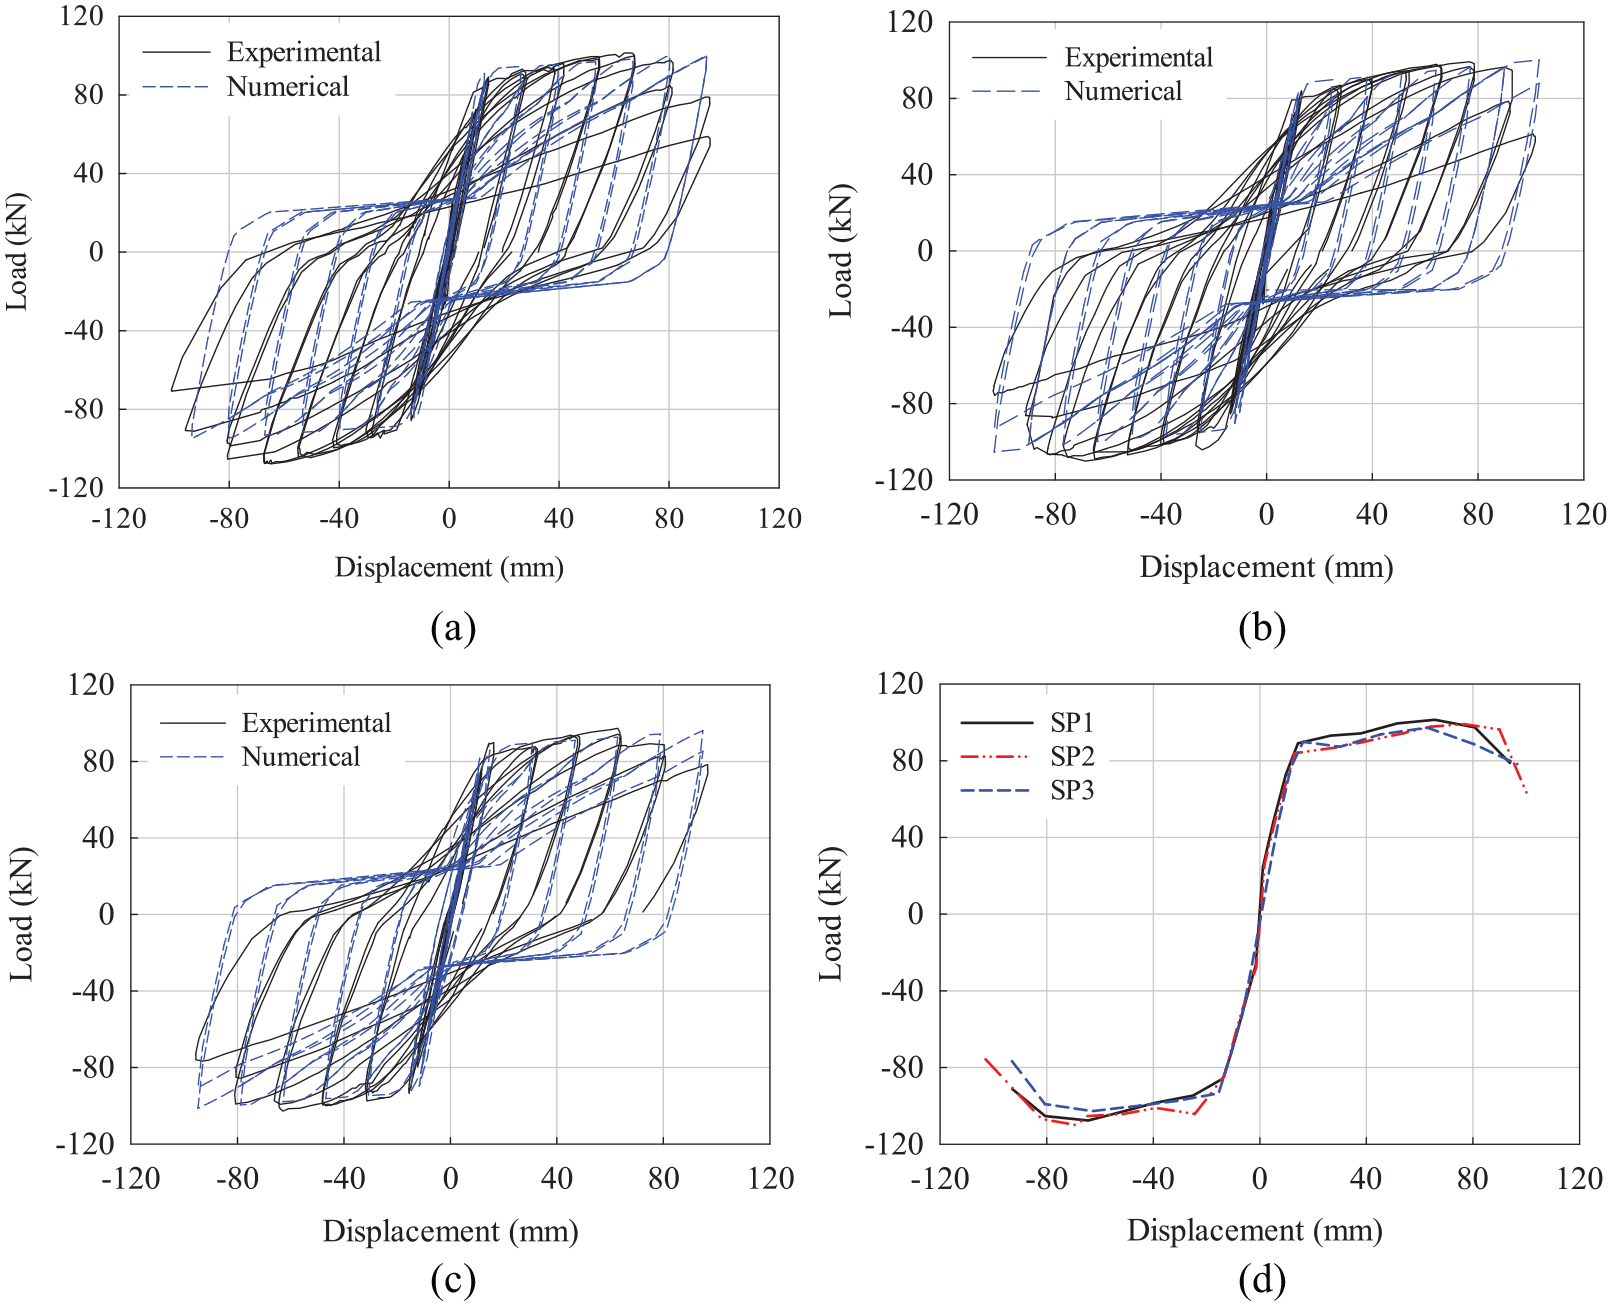
Load–displacement curves and envelops of hysteretic loops: (a) SP1, (b) SP2, (c) SP3, and (d) envelops of hysteretic loops.
Figure 5(a) shows the hysteretic response of SP1. Within the load-controlled stage, SP1 was in the elastic state, represented by the linear shape of hysteretic loops. Once the yield of longitudinal reinforcement occurred, the hysteretic loops became full and fusiform covering a larger area, which represents the starting of energy dissipation. As the extent of plastic response increases, at the end of positive unloading of 3Δ y (displacement back to zero), slippage of the beam longitudinal steel bars occurred, and the diagonal cracks in the plastic hinge zone of the beam were not completely closed. As the increase of negative loading, part of the displacement loading first came to offset the residual deformation caused by slippage of the longitudinal and unclosed cracks, which resulted in a reduced stiffness. Once the residual deformation being offset, the stiffness of the beam increased again. During this period, the hysteretic loop witnessed a concave, which was the so-called pinching phenomenon. As the beam plastic deformation increases, the pinching phenomenon of the hysteretic loop became increasingly obvious. When the displacement reached 6Δ y , the peak load and stiffness of the beam element at the second loading cycle reduced significantly than those at the first cycle. This is because of the excessive slip of beam longitudinal rebar and severe concrete peeling. At 7Δ y , the hysteretic loop was like S shape with a sliding platform caused by the more serious concrete loss and the slip of longitudinal bars. Similar hysteretic responses of SP2 and SP3 were observed, as shown in Figure 5(b) and (c). Compared with the last two hysteretic loops of SP1, the corresponding loop of SP2 experienced slighter pinching phenomenon mainly because the higher joint hoop reinforcement ratio in SP2 enhances the bond and anchor of beam longitudinal reinforcement. SP3 had a high axial load ratio (0.56); the area covered by the hysteretic hoops was smaller than that of SP1 and SP3, which will be represented by the energy dissipation and ductility capacity indicators as discussed subsequently. However, the effect of the axial load ratio on the seismic performance of beam–column sub-assemblages has been an argued issue among different researchers (Kim and LaFave, 2007; Li and Kulkarni, 2009; NZS 3101, 2006).
The envelop curves of hysteretic responses for those three specimens are shown in Figure 5(d). The curves all had a similar variation trend and could be divided into three stages: elastic, plastic strengthening, and descending stage due to excessive damage. As summarized in Table 3, the yielding load, the maximum load capacity, and the ultimate load as well as their corresponding deflections at positive and negative loading directions are given. Since the beam element served as the weakest link and failure mode of those beam–column sub-assemblages was flexural failure of beam, the effect of axial load ratio and joint core hoop reinforcement ratio seems to impose little influence on the key points (yielding points, peak load point, and the ultimate point) on envelop curves.
Main results of the tests.
Discussion
Ductility
Ductility is an important indicator that should be considered in seismic design for any structural elements. It is described as the capacity of a structure to undergo large deformation in the inelastic range without a substantial reduction in load-carrying capacity (Park, 1988). The nondimensional term, displacement ductility factor (µ), indicating the capacity of inelastic deformation is used herein to evaluate the test specimens and is defined as µ = Δ µ /Δ y . The yield displacement, Δ y , is determined corresponding to the yielding of longitudinal reinforcement, and the ultimate displacement, Δ u , is defined as the displacement corresponding to the post-peak point where the applied load drops to 85% of the peak load. This factor, µ, specified by various typical design code provisions may vary in the range from 1 for elastically responding structures to as high as 7 for ductile structures but is typically between 3 and 6 (Park, 1988).
Table 3 summarizes the ductility factors of the three test specimens. The experimentally measured ductility factors for SP1 in positive and negative directions were, respectively, 6.2 and 6.4, and that for SP2 as well as SP3 were 7.3 and 7.0 as well as 5.5 and 5.6, respectively. The results indicate that all the specimens turned out to have a good ductility since the ductility factors are closing to the upper range as recommended by Park (1988), indicating the excellent ductility enhancement provided by HRB500E. More specifically, the comparison between SP1 and SP2 indicates that higher joint core transverse reinforcement ratio results in better ductility performance, which is consistent with the existing test results (Haach et al., 2008). This is because more stirrups in the joint core provide more even confinement on concrete and thus improve the anchorage of longitudinal reinforcing bars, which reduces the yielding displacement and enhances the joint post-peak behavior. Compared with SP3 under higher axial compression, SP2 subjected to lower axial compression exhibited a larger ductility factor.
Energy dissipation
The energy dissipation of the specimens under cyclic loading had been calculated from the enclosed area of load–displacement curves at different loading levels or drift ratios. Figure 6(a) shows per-cycle-energy (PCE) dissipation for all the specimens, indicating a generally similar trend during the whole loading period. The PCE dissipation for SP3 with an axial load ratio of 0.56 was the largest in the whole loading duration. However, after 5Δ y , the PCE dissipation value for SP3 was almost identical to that of SP2 under an axial ratio of 0.28, indicating the native effect of higher axial load at larger column deformation. Before 5Δ y , PCE dissipation values for SP1 and SP2 were approximately the same. However, after 5Δ y , PCE dissipation for SP2 was obviously larger than that of SP1, possible due to the fact that higher transverse reinforcement ratio in joint core played a part at larger joint deformation. At Δ y , for all specimens, the PCE dissipation was very small and stayed at almost the same level within two repeat cycles. Notably, for SP1 and SP2, the PCE dissipation in the second cycle began to be smaller than that in the first cycle when the displacement loading reached or exceeded 5Δ y . This is because of the damage accumulation in concrete and the weakened bond of longitudinal reinforcement as the joint deformation increased.
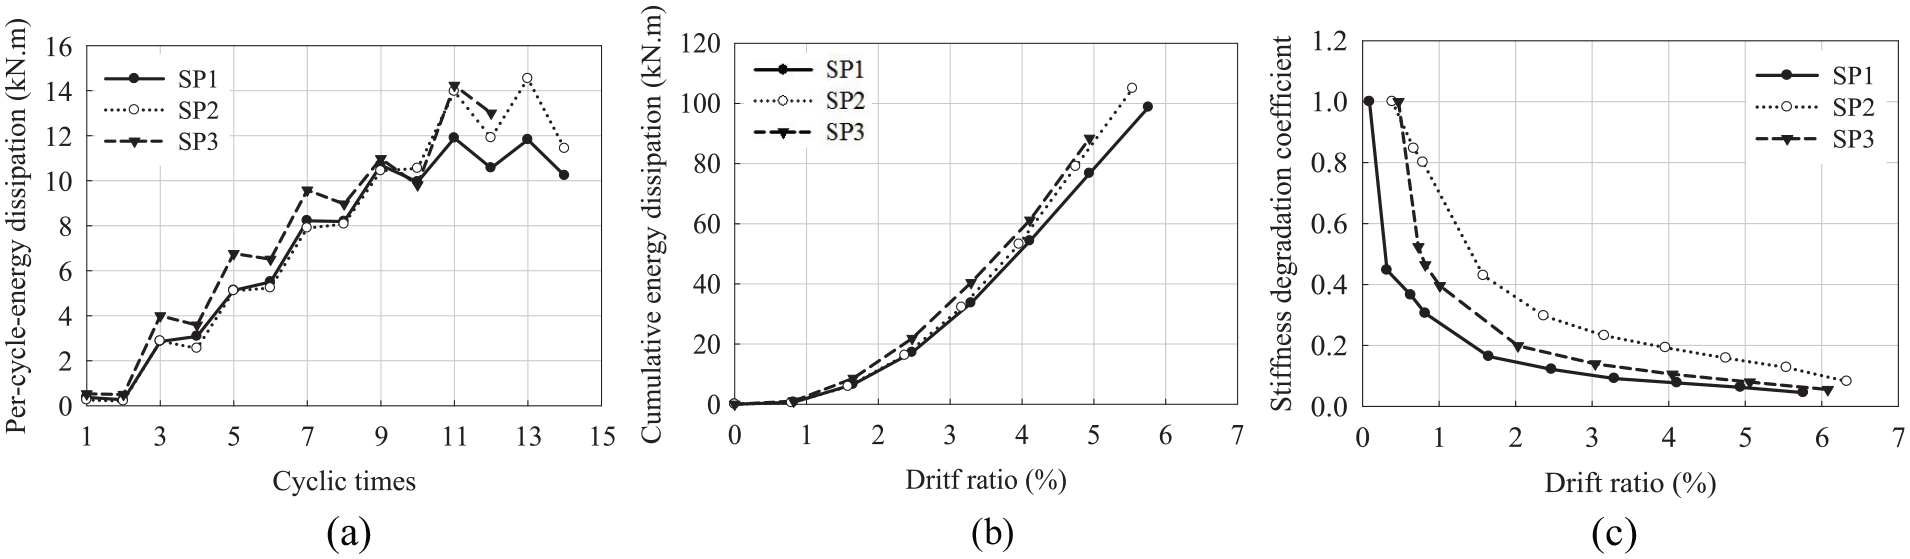
Energy dissipation and stiffness degradation: (a) per-cycle-energy dissipation, (b) cumulative-energy dissipation, and(c) stiffness degradation.
Figure 6(b) compares the cumulative-energy (CE) dissipation against the drift ratio (θd) for all the specimens. When θd < 5%, the CE dissipation for SP3 with the highest axial load ratio (0.56) was the largest. When θd < 3%, the CE dissipation of SP1 and SP2 were generally the same, however. SP2 with a higher joint core transverse reinforcement ratio (1.03%) dissipated around 12% more CE than SP1 (with joint core transverse reinforcement ratio 0.69%) with θd at 5.5%. When θd < 3%, SP3 had a higher energy dissipation compared with SP2, and the difference showed an upward trend; when θd > 3%, however, the difference began to decrease.
Stiffness degradation
The degradation of stiffness is a significant indicator for performance evaluation of RC structures subjected to earthquakes, which may be attributed to the individual or coupled effects of flexural and shear cracking, distortion of the joint core, nonlinear behavior of concrete, loss of concrete cover, and slippage of reinforcement (Li and Leong, 2014). In the present study, stiffness degradation is defined by the variation in secant modulus corresponding to the peak point at each drift ratio. The lateral stiffness at different cycles (only the first reversal cycle was considered) was calculated as

where Ki is the secant modulus at the ith load level, and Fi and Δ i are the peak load of the hysteretic loop and corresponding displacement at the ith load level. The stiffness degradation coefficient, herein, that is, Ki/K1, was used to judge the stiffness degradation.
Figure 6(c) compares the stiffness degradation coefficient for all specimens. Notably, for all specimens, the rate of stiffness degradation at the lowest drift ratio was the maximum, which slowed down gradually in the subsequent cycles under certain drift ratios. The stiffness dramatically reduced by approximately 75%, 85%, and 90% for SP2, SP3, and SP1 at a drift ratio of 3%, respectively. At a drift ratio of around 6%, the remaining stiffness for all the three specimens was below 10% that of their initial stiffness. Compared with SP1, SP2 that had more joint hoop reinforcement experienced smaller stiffness degradation at the same drift ratio. Similar test results were observed by Durrani and Wight (1985). This is because the increased hoop confinement improved the restraining capability of cracking in joint core concrete (although the joint failed by flexural failure of the beam, shear cracks in the joint panel can be restrained) and the bond of beam tension reinforcement. Specimen SP3, subjected to an axial load ratio as high as 0.56, showed a larger stiffness degradation compared with SP2 under a half axial load ratio. This indicates that excessively larger axial load ratio reduced member stiffness, which is consistent with existing studies (Li and Kulkarni, 2009; Li and Leong, 2014).
Decupling of different components to overall drift
The overall deformation of a beam–column sub-assemblage comprises the deformations that stem from the beam, column, and joint. The total beam drift ratio would be decomposed into four different components: the deflection of the beam, the shear deformation of the joint, slippage of the beam longitudinal reinforcement, and the deflection of the column. The drift ratio θp contributed by the deflection of the beam was obtained by the measured deformation

where Δ1 and Δ3 are the values measured by DS1 and DS3, respectively, and h0 is the effective height of the beam section.
The drift ratio contributed by shear deformation of joint core (θsh) was obtained by the measured value of the diagonal deformation of the joint panel. Figure 7(a) shows the schematic diagram for calculating the shear deformation of the joint core. The average shear deformation in diagonal joint core X is calculated as follows (Yuan, 2008)


Relative contributions of different components to overall drift: (a) calculation of shear deformation, (b) SP1, (c) SP2, and (d) SP3.
The geometrical relationship illustrated in Figure 7(a) gives the following formulas
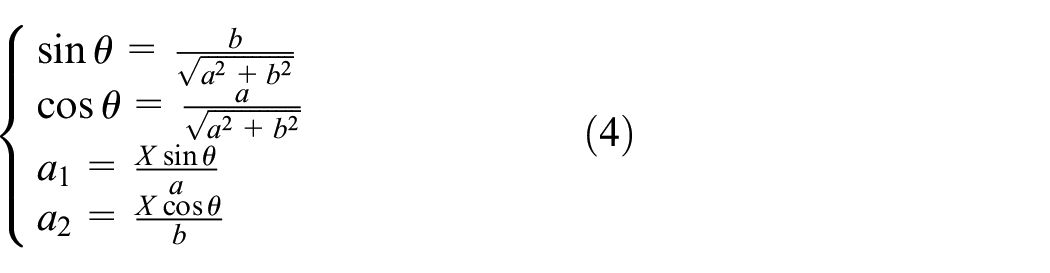
where a and b represent the width and the height of a panel, respectively; θ indicates the angle between diagonal line and side a; and a1 and a2 denote the shear angle due to the vertical and horizontal shear deformation, respectively

The drift ratio contributed by the slip of beam longitudinal reinforcements (θsl) was obtained by

where s2 represents the bar slippage in the upper location of the beam.
The drift ratio contributed by the deflection of column (θc) was obtained by the following formulas (Ashtiani et al., 2014)



where Δ c is the contribution of column flexural deformation in the over drift, F is the lateral force applied at the top of the column, Ec is the elastic modulus of concrete based on Chinese Concrete Standard (GB 50010-2010, 2010), and Ic is the effective column moment of inertia taken as 56% of the total value for the uncracked section.
Figure 7(c) and (d) shows the contributions of different components to the overall displacement of all specimens at the last loading stage. The component contributions were almost the same among all specimens. More precisely, column flexural displacements, joint shear, and bar-slip displacements accounted for 3% to 5%, 4% to 10%, and 2% to 7%, respectively, while beam flexural displacements occupied 75% to 95% of the whole joint deflection, which was the largest part. Contributions of the joint shear deformations in SP1, SP2, and SP3 at 6Δy were 9.5%, 6.6%, and 2.7%, respectively, which meant higher axial load ratio and core stirrup ratio decreased the deformation contribution of the joint shear panel.
Numerical analysis
The finite element (FE) package OpenSees (2010) was used to simulate the tested specimens. The beams and columns were both modeled using “Nonlinear-Beam-Column” elements with two-dimensional (2D) fiber sections available in OpenSees. The beam–column joint core was approximated using the “Beam-Column-Joint” element developed by Mitra and Lowes (2004). “Beam-Column-Joint” element in OpenSees was originally developed by Lowes and Altoontash (2003), which was then modified by Mitra and Lowes (2004), who contributed to improve the simulation of bar-slip spring force demands, to simulate strength loss resulting from cyclic loading as well as anchorage-zone damage, and to propose a new and more accurate bar-slip response model (Mitra and Lowes, 2007). The detailed features of the “Beam-Column-Joint” element were well documented by Mitra and Lowes (2007).
Modeling of concrete
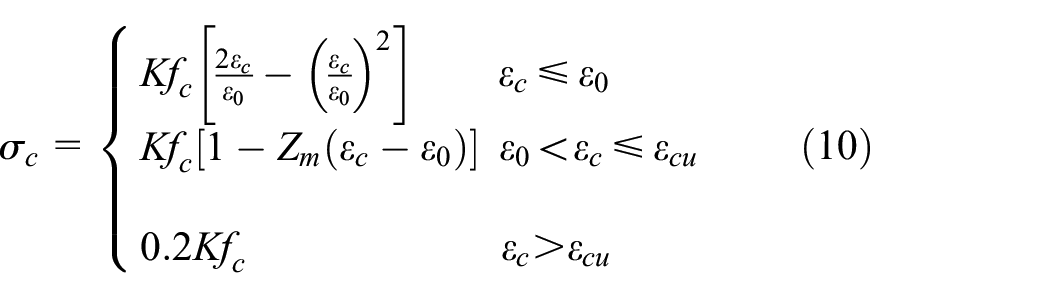
Following Mitra and Lowes (2007), the concrete was modeled by the “Concrete 01” material model belonging to the library of OpenSees (2010). Although using “Concrete 02” or “Concrete 03” may lead to more precise results, the use of “Concrete 01” in the current work was motivated by simplifying the problem. The constitutive relationship of concrete, as illustrated in Figure 8(a), was represented by the modified model (Scott et al., 1982) based on Kent–Park model (Kent and Park, 1971) and considered only compression response, while the tensile strength was neglected. The model is defined as
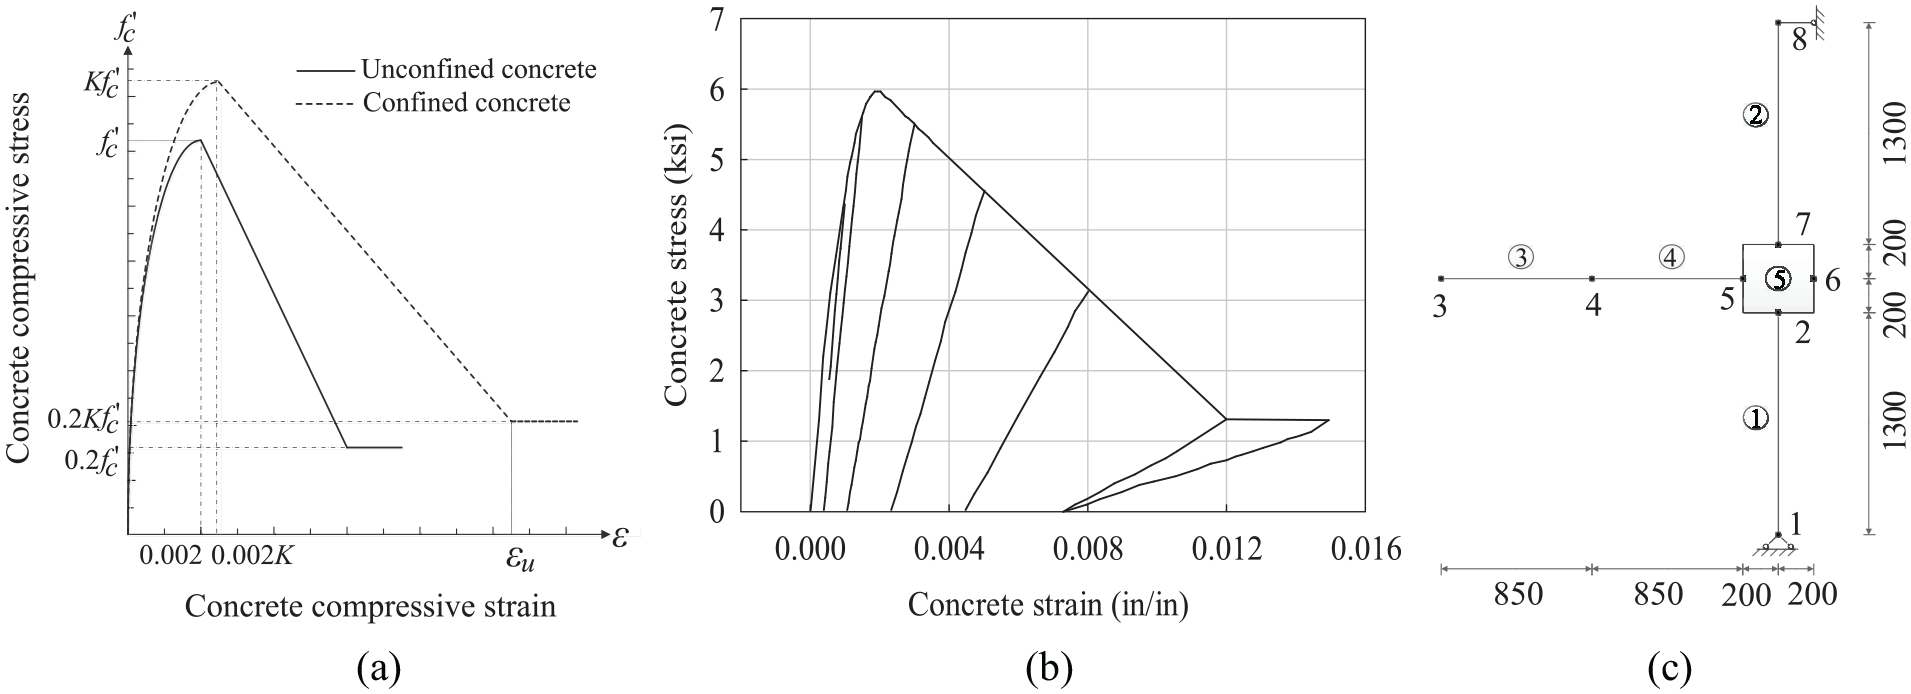
Stress–strain behavior of concrete and FE model: (a) uniaxial compression, (b) model of “Concrete 01,” and (c) FE model.
where σc is the stress of concrete; εc is the strain of concrete; fc is the compressive strength of concrete; ε0 and εcu are compressive strain at peak stress and ultimate compressive strain of concrete, respectively; K is the constraint increasing coefficient caused by transverse reinforcements; and Zm is the slope of descending branch.
For confined concrete, consider the following



where fyh is the yield strength of transverse reinforcement, ρs is the transverse reinforcement ratios in joint core zone,
Modeling of steel
The “Steel 02” material model available in the library of OpenSees was used to simulate the behavior of steel reinforcing bars, which employs a bilinear envelop and a curvilinear unload–reload response. The model was originally developed by Menegotto and Pinto (1973) and was then modified by Filippou et al. (1983), which is able to consider isotropic strain hardening rule and Bauschinger effects (Mazzoni et al., 2007). The parameters involved in the model were obtained from material tests or determined as per OpenSees recommendations. Since the model has been extensively used for simplicity reason, the “Steel 02” material model was not repeated here, whereas it was detailed elsewhere (Elmorsi, 1998).
In the OpenSees analysis platform, beams and columns are represented using fiber elements. The macro-FE model of the simplified beam–column sub-assemblages consisted of two beam elements, two column elements, and a shear panel, as illustrated in Figure 8(c). The material properties of the concrete and reinforcing steel bars were modeled based on the above description. Similar boundary conditions as occurred in the experimental setup were applied to the FE models. The constant axial load on the top of the column was applied as concentrated loading, and the vertical load at the loading point of the beam was applied through a displacement control mode.
Verification of the FE model
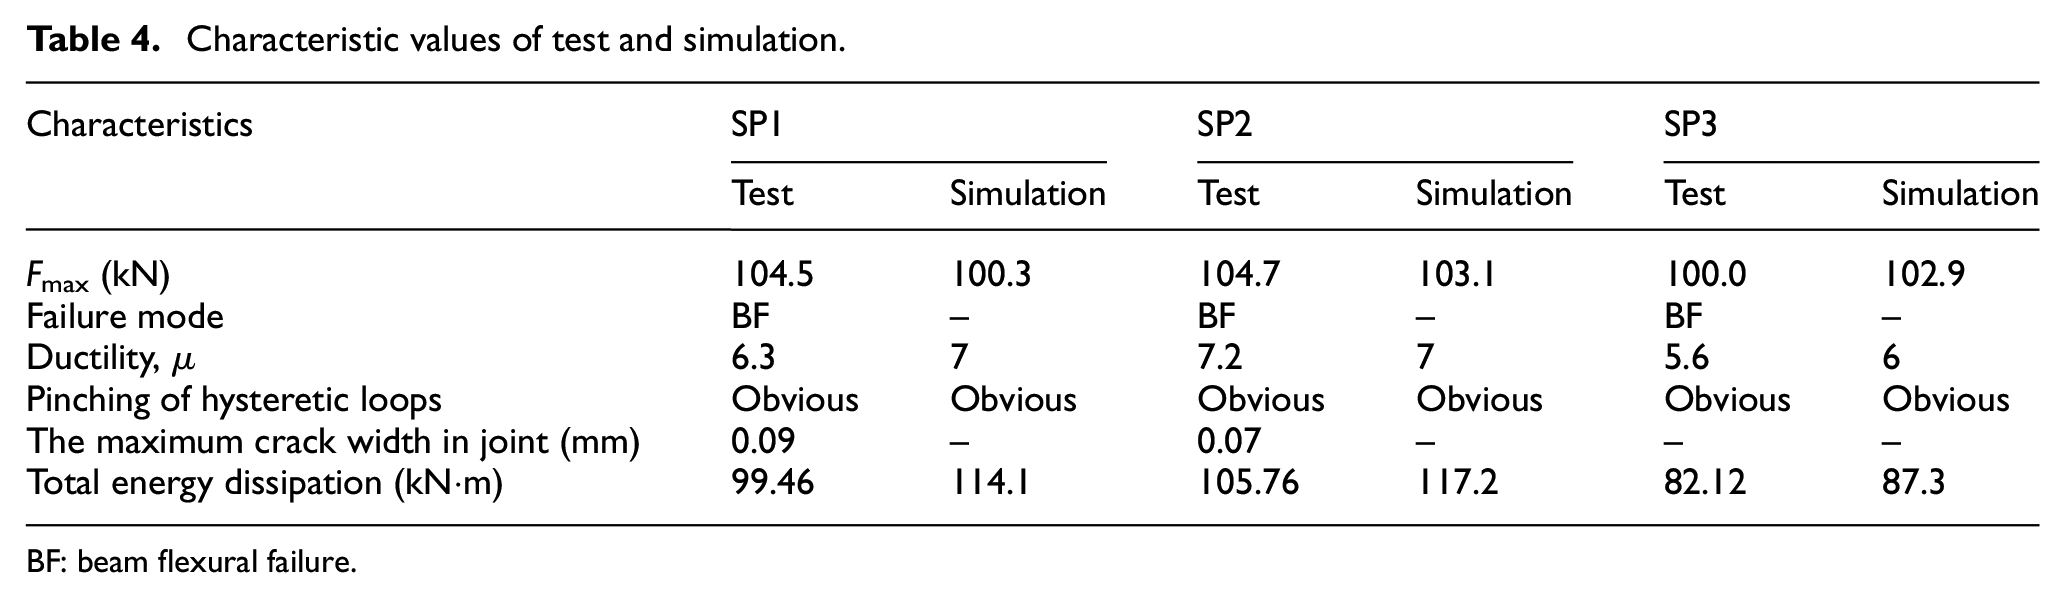
Figure 5(a) to (c) compares the experimentally and numerically obtained force–displacement hysteretic curves for all specimens. Although some differences existed between FE predicted and experimental results, the FE models can generally simulate both the hysteretic hoops and pinching effects of all the specimens. Besides, as summarized in Table 4, in terms of peak load as well as total energy dissipation, the ratios of experimental to simulating values for SP1, SP2, and SP3 are 1.04, 1.02, and 0.98 as well as 0.87, 0.90, and 0.94, respectively, indicating that the results predicted by the proposed FE models are in good agreement with the experimental data. The simulated strength deterioration lag behind the test results due possibly to the reason that the crushing of concrete cover could not be simulated in the numerical analysis. Nevertheless, the proposed FE models can be used to predict the actual load capability and energy dissipation of RC beam–column joints.
Characteristic values of test and simulation.
BF: beam flexural failure.
Parametric study
Using the verified FE model, this section presents an extensive and systematic parametric study to provide more information on the complex behavior of exterior RC beam–column joints. The effects of four key parameters, that is, longitudinal reinforcement ratio of beam component, hoop reinforcement ratio in the joint core, axial load ratio, and concrete grade on the structural response of the joint were investigated under cyclic loading. The geometrical dimensions of the joint for the parametric study are shown in Figure 1(a). The same boundary conditions and loading histories as those used in the experimental tests of the specimens were applied herein. For simplicity, only the skeleton curves are presented in this section. However, some key indicators for the elevation of hysteretic performance are also provided.
Influence of longitudinal reinforcement ratio of the beam component
To investigate the influence of the longitudinal reinforcement ratio of beam component (ρlb) on the hysteretic performance of the joints, five FE models were modeled with the values of ρlb varying from 0.71% to 1.61% with 0.18% intervals. In the FE models, concrete compressive strength, steel grade, joint hoop reinforcement ratio, and axial force ratio were 50 MPa, HRB 500E, 0.687%, and 0.28, respectively. The skeleton curves are shown in Figure 9(a), and more detailed information derived from hysteretic hoops is summarized in Table 5. The increase of reinforcement ratio enhanced the peak load and accumulated energy dissipation until a value of 1.43%; afterward, the enhancement can be neglected. This is because the highest reinforcement ratio of 1.61% contributed to transferring the shear forces and bending moments to the joint core, which in turn changed the failure mode from the flexural failure of the beam to shear failure of the joint core. Larger longitudinal reinforcement ratio prevented the flexural failure of beam element, and transferred more shearing forces to the joint core, which eventually resulted in the shear failure of joint core. Besides, as can be observed in Figure 9(a), for specimen with reinforcement ratio of 1.61%, the skeleton curve shows no yielding plateau, which is a typical response of member experiencing flexural failure. Instead, the skeleton curve drops suddenly as soon as the peak point reached. This also indicates that the specimen experienced joint core shear failure. The displacement ductility factor decreased from 6.5 to 3.0 as the longitudinal reinforcement ratio of the beam increased from 0.71% to 1.61%.
Influence of longitudinal reinforcement ratio of beam component.
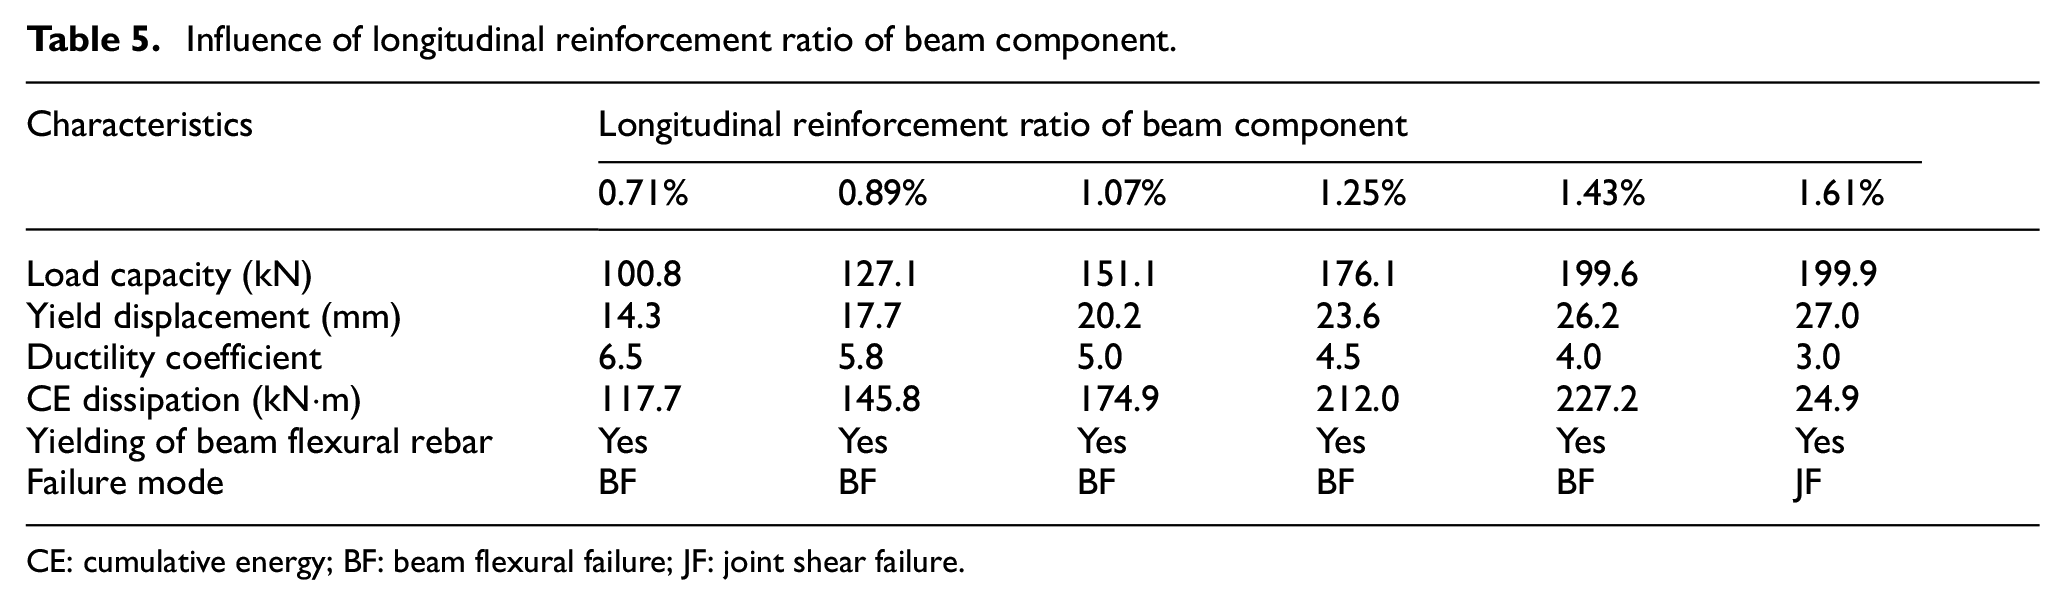
CE: cumulative energy; BF: beam flexural failure; JF: joint shear failure.
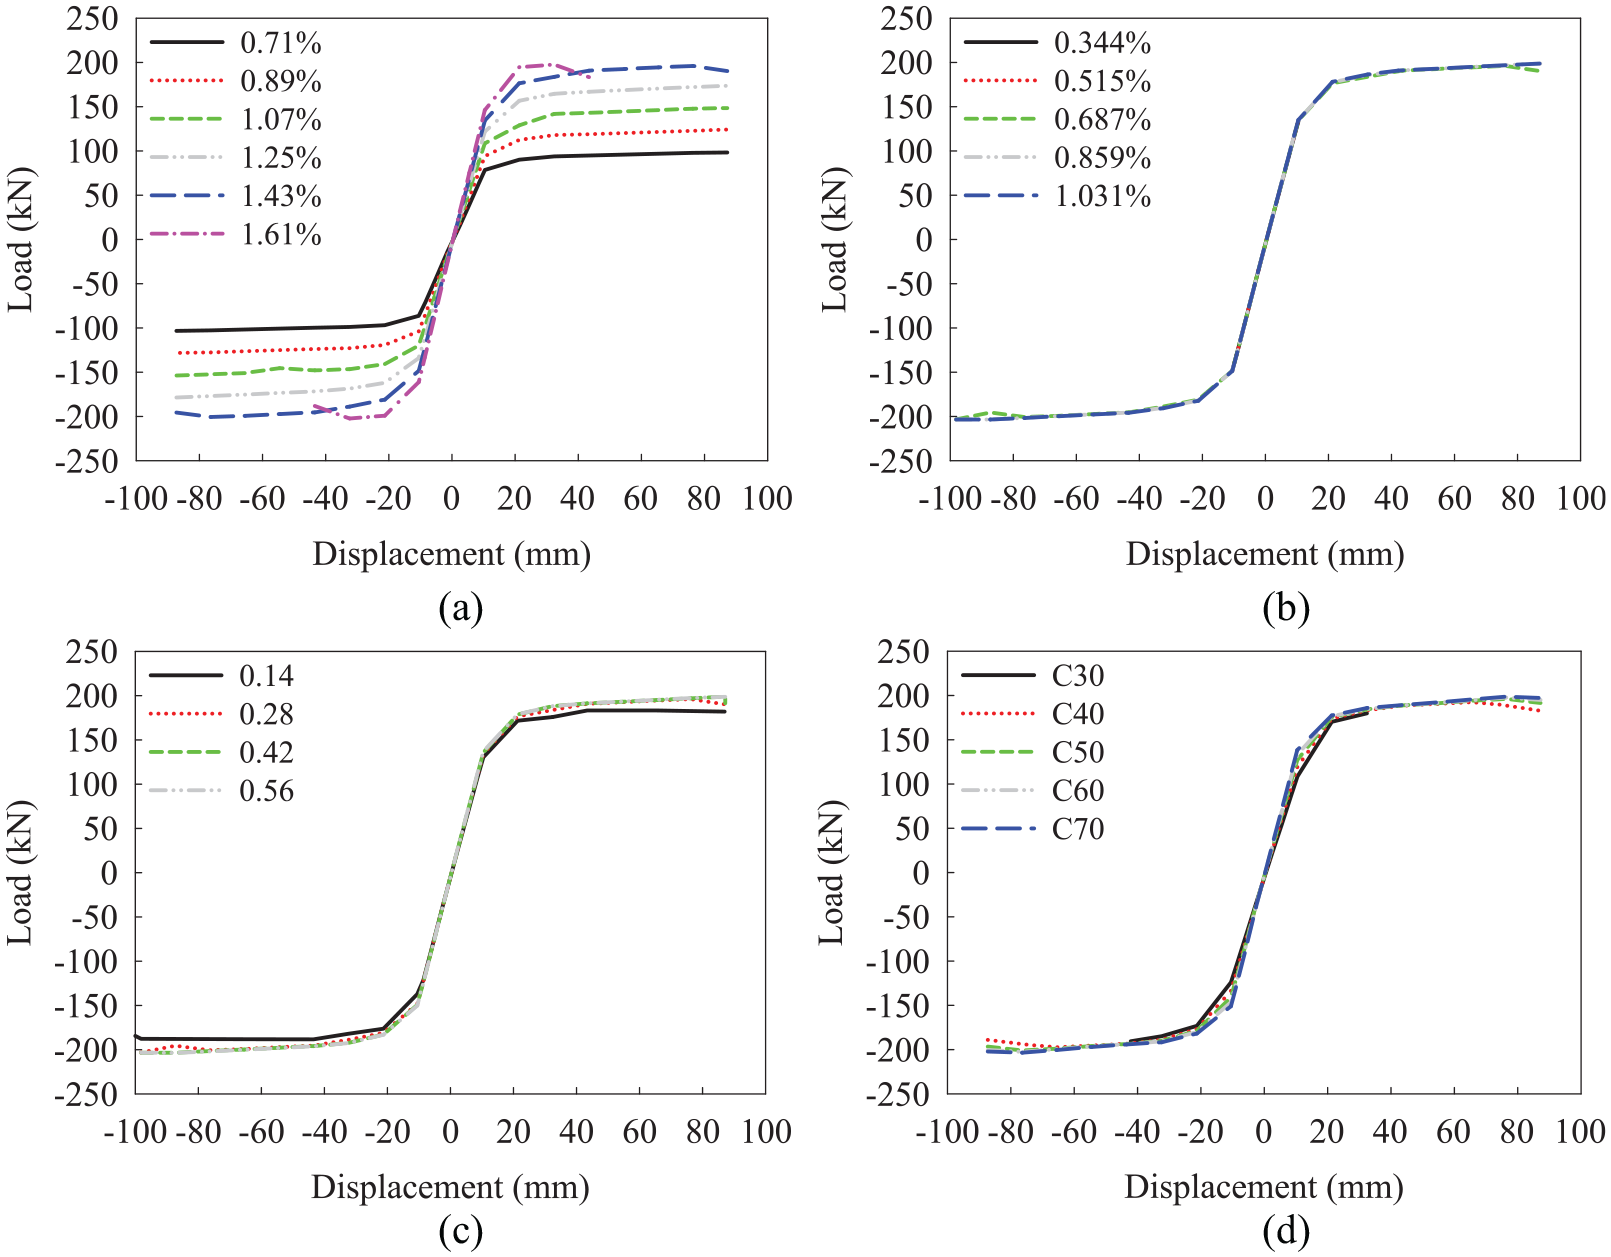
Effects of parameters on envelops of hysteretic loops: (a) beam flexural reinforcement ratio, (b) joint hoop reinforcement ratio, (c) axial load ratio, and (d) concrete grade.
Influence of hoop reinforcement ratio in joint core
The skeleton curves obtained from different joint core hoop reinforcement ratios (ρv) of 0.344%, 0.515%, 0.687%, 0.859%, and 1.031% are shown in Figure 9(b). The concrete compressive strength, steel grade, axial force ratio, and beam longitudinal reinforcement ratio were 50 MPa, HRB500E, 0.28%, and 1.43%, respectively. As summarized in Table 6, the critical value of ρv was between 0.515% and 0.687%, since the failure mode of the joint shifted from shear failure of the joint core to flexural failure of the beam when ρv was larger than the critical value. As a result of changed failure mode, the peak load and accumulated energy dissipation increased with ρv until a value of 0.687% was reached. Afterward, the improvement due to increasing ρv could be neglected since the failure mode was the flexural failure of the beam. The displacement ductility factors were 0.8, 0.9, 4, 5.1, and 6.2, respectively, corresponding to ρv values of 0.344%, 0.515%, 0.687%, 0.859%, and 1.031%.
Influence of hoop reinforcement ratio in joint core.
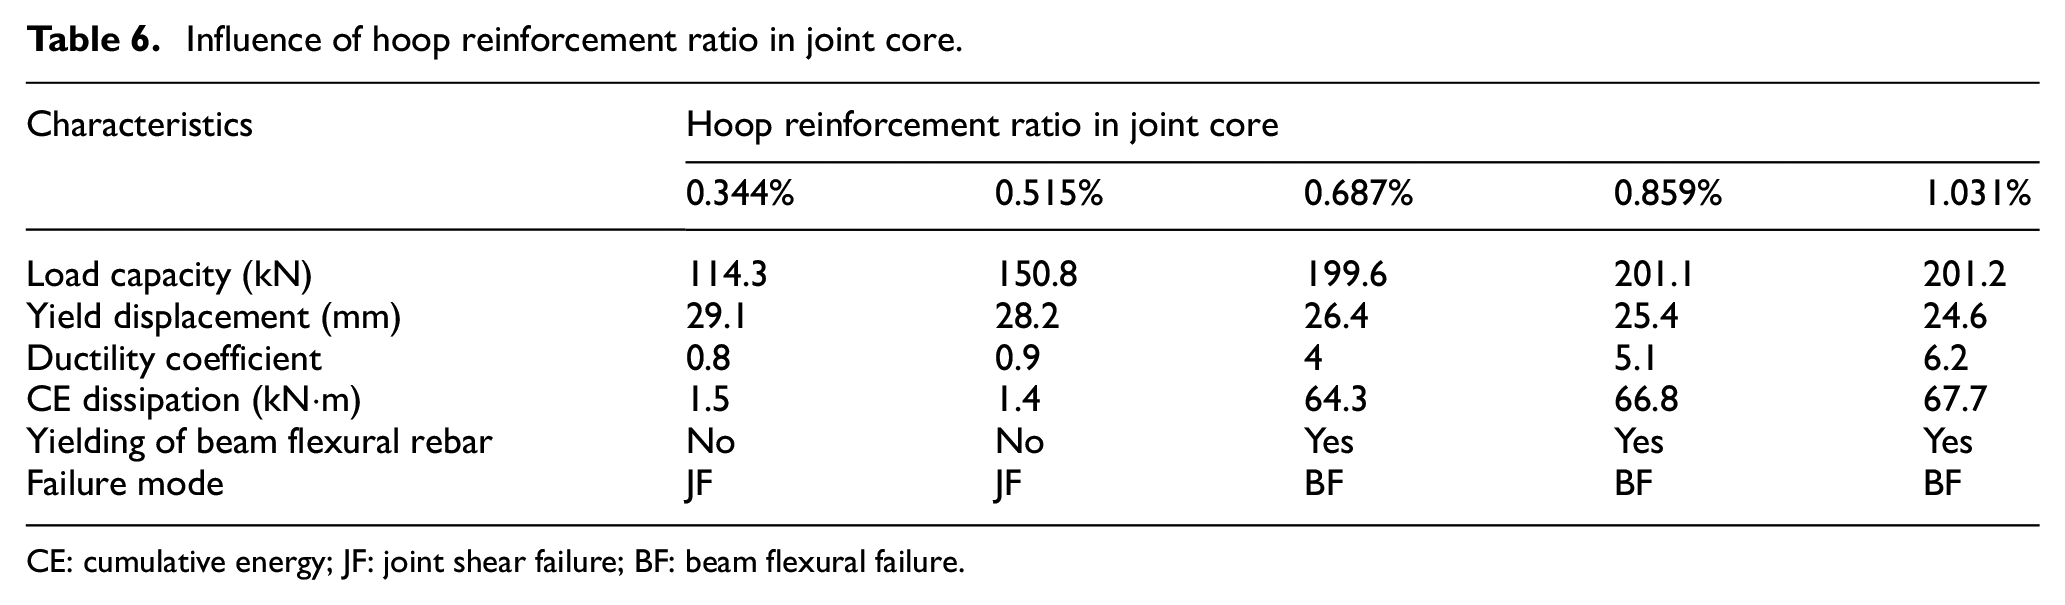
CE: cumulative energy; JF: joint shear failure; BF: beam flexural failure.
Influence of axial load ratio
What level of column axial load positively or negatively influences the behavior of the RC beam–column joint is an argued issue among different researchers (Li and Leong, 2014). Qualitatively, the column axial compression adds to the strong column–weak beam behavior and moves the neutral axis toward reducing the tensile stress of the longitudinal column reinforcement. Thus, certain column axial compression enhances the steel rebar bond and contributes to a somewhat better force flow mechanism to resist vertical joint shear demand (Kim and LaFave, 2007). However, once the axial load is beyond a critical value, a further increase in axial load is proved to be detrimental and decreased its strength and stiffness (Li and Leong, 2014). Quantitatively, as per NZS 3101 (2006), the contribution of the strut mechanism is considered provided that the axial load ratio (υa) is larger than 0.1. The axial load contributed to the improvement of joint performance if the υa was smaller than 0.25 for exterior wide beam–column joints (Li and Kulkarni, 2009) and 0.3 for high-strength interior concrete beam–column joints (Li and Leong, 2014).
The skeleton curves under varying υa (0.14, 0.28, 0.42, and 0.56) are shown in Figure 9(c), and other performance evaluation indicators are summarized in Table 7. The concrete compressive strength, steel grade, hoop reinforcement ratio in joint core, and beam longitudinal reinforcement ratio was 50 MPa, HRB500E, 0.687%, and 1.43%, respectively. The load capacity and total energy dissipation increased by 7.4% and 46.8%, respectively, as the axial load ratio increased from 0.14 to 0.28. Further increase of axial load imposes little influence on load capacity, ductility coefficient, and energy dissipation. Notably, at the smallest axial load ratio of 0.14, the failure mode was a joint shear failure, and the failure mode changed to beam flexural failure as the axial load ratio increased to 0.28 and above.
Influence of axial load ratio.
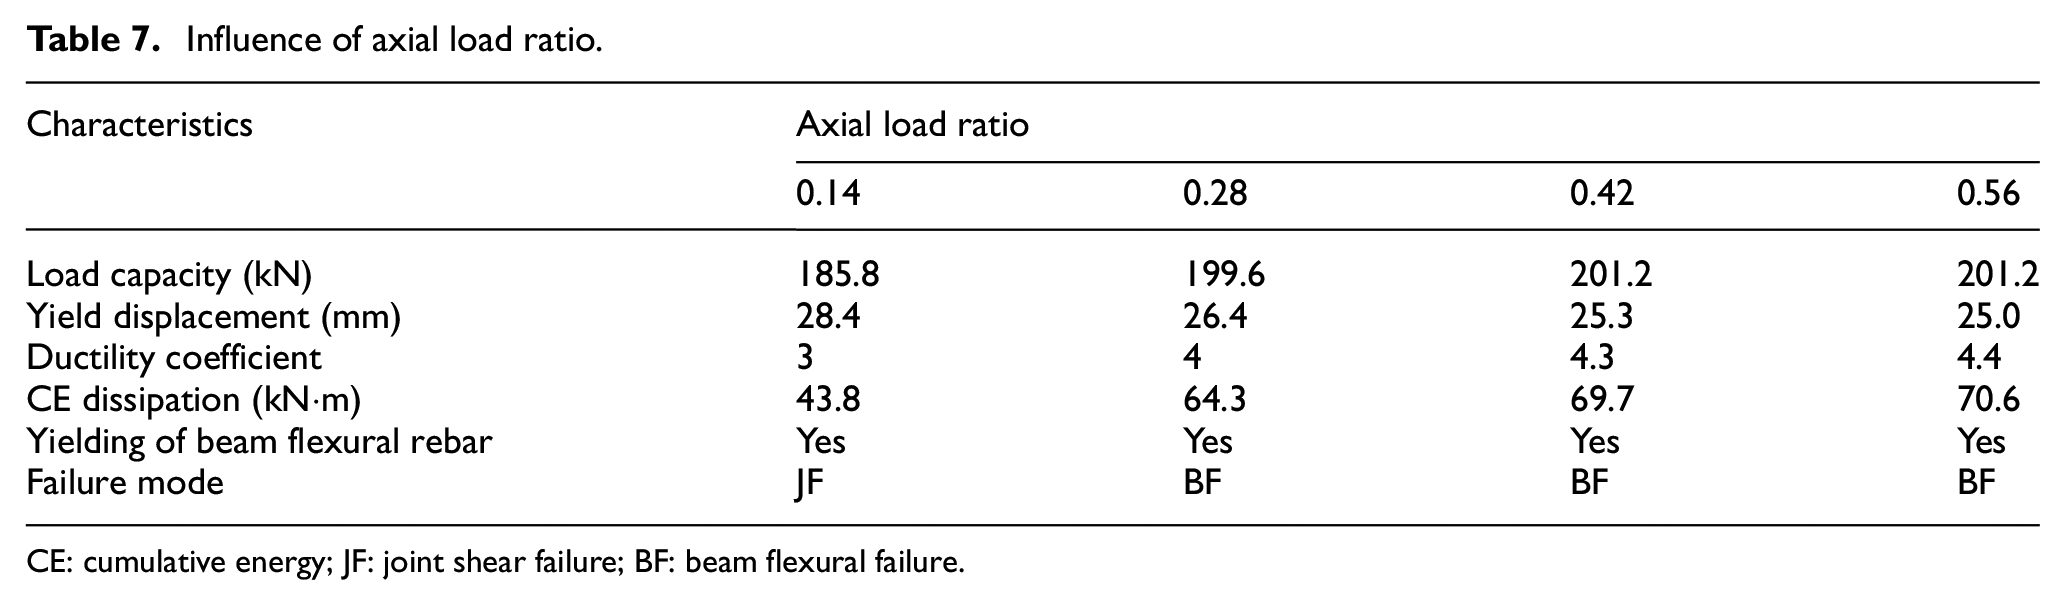
CE: cumulative energy; JF: joint shear failure; BF: beam flexural failure.
Influence of concrete compressive strength
The influence of concrete grade on the seismic behavior of the RC beam–column joint was numerically investigated, and the skeleton curves corresponding to concrete compressive strength ranging from 30 to 70 MPa with a constant interval of 10 MPa are shown in Figure 9(d). The axial compressive ratio, steel grade, hoop reinforcement ratio in joint core, and beam longitudinal reinforcement ratio was 0.28, HRB500E, 0.687%, and 1.43%, respectively. As summarized in Table 8, at the lowest concrete grade (C30), the failure mode was a joint shear failure, whereas the joint failed by beam flexural failure when concrete grade increased to C40 or above. The load capacity increased by approximately 8.6% as the concrete grade increased from 30 to 70 MPa. Besides, the ductility coefficients and accumulated energies were 2, 3.8, 4.0, 5.1, and 6.0 as well as 16.2, 50.9, 52.7, 53.7 and 55.3 kN·m, respectively, corresponding to the concrete grade of C30, C40, C50, C60, and C70, respectively. However, that improvement turned out to be rather insignificant when the strength was greater than a certain level, that is, 50 MPa, as indicated in this parametric analysis.
Influence of concrete grade.

CE: cumulative energy; JF: joint shear failure; BF: beam flexural failure.
Conclusion
In this study, three beam–column joints reinforced with HRB500E were designed, fabricated, and tested under reversed cyclic loading and axial compression loading. The effects of axial load ratio and joint hoop reinforcement ratio on seismic performance of joints were experimentally investigated. In addition, FE models, developed based on OpenSees, were used to simulate the tested specimens, and good agreement between experimental and numerical results was reached. Finally, a set of parametric studies were carried out using the calibrated FE models. Based on the research findings in the current work, the following conclusions can be made:
All of the specimens had good seismic performance. Test results indicated that both the axial load ratio and joint hoop reinforcement ratio had a certain but limited influence on the hysteretic responses of joints failed by beam flexural failure.
The average ductility factor increased slightly from 6.3 (SP1) to 7.2 (SP2) as the joint hoop reinforcement ratio increased from 0.63% to 1.03%. More even confinement due to a larger amount of joint core hoop reinforcement contributed to improving the anchorage of longitudinal reinforcing bars, which reduces the yielding displacement and enhances the joint post-peak behavior. The ductility factor decreased from 7.2 to 5.6 as the axial load ratio increased from 0.28 (SP2) to 0.56 (SP3), indicating an optimized value of axial load ratio may have existed.
Both the PCE and CE dissipation for SP3 under the highest axial load ratio (0.56) were the largest under the same loading level. The joint core hoop reinforcement ratio showed no effect on PCE and CE of joints until at very large plastic deformation.
At a drift ratio of 3%, the stiffness loss of SP1, SP2, and SP3 were 90%, 75%, and 85%, respectively, indicating that joint core hoop reinforcement ratio showed a positive effect on maintaining joint stiffness, while larger axial load ratio affected inversely. Compared with SP1, SP3 with larger joint core hoop reinforcement ratio and higher axial load ratio experienced slower stiffness degradation, which needs further investigation since the parameter range in the current research is limited.
The comparison of hysteretic curves, load capability, and energy dissipation between FE and experimental results indicated that FE analysis generated a generally reliable prediction of the joint structural response.
Parametric studies revealed that both load capacity and CE dissipation increase with increasing flexural reinforcement ratio of the beam until a certain value that shifted the failure mode from beam flexural failure to joint shear failure. Critical joint hoop reinforcement ratio value that avoids the brittle shear failure of joint and effectively dissipates energy as indicated in the current work is 0.687%. Excessively small axial load ratio may change the failure mode of the joint from beam flexural failure to joint core shear failure. Too much larger axial load ratio contributed little to load-carrying capacity and CE dissipation.
Footnotes
Declaration of Conflicting Interests
The author(s) declared no potential conflicts of interest with respect to the research, authorship, and/or publication of this article.
Funding
The author(s) disclosed receipt of the following financial support for the research, authorship, and/or publication of this article: The work described in this paper was supported by the National Natural Science Foundation of China (Grant No. 51978308) and Key Interdiscipline Research Plan of Huazhong University of Science and Technology (Grant No. 2016JCTD113).
