
Abstract
Precast shear wall is an important structural form of building industrialization and housing industrialization. In order to improve the seismic performance of precast shear wall, the reinforced tenon is presented to improve the shear performance of precast shear wall joints. In order to grasp the further difference of mechanical properties of reinforced tenon precast shear wall under different axial compression ratios, the low cyclic reversed loading tests were carried out on a cast-in-situ shear wall specimen and two reinforced tenon precast shear wall specimens with different axial compression ratios respectively. According to the test results, the hysteresis characteristics, bearing capacity, steel strain, energy dissipation capacity, rigidity degeneration and other seismic performance parameters of the three specimens were analyzed. The test results show that the failure modes of the three specimens were same, which was compression-bending failure. Connection form of reinforced tenon has good shear resistance. The reinforced tenon precast shear wall with the larger axial compression ratio has the worse ductility, the higher bearing capacity and stronger the rigidity.
Keywords
Introduction
With the development and upgrade in construction industry in recent years, due to the advantages of precast building technology in economy, environment and technology, the application of precast technology has been widely used (Gou et al., 2018; Yee, 2014). But some certain precast technology should satisfy performance requirements before put into applications, such as the precast shear wall technology. In fact, precast shear wall technology is more demanding in China because the high population density in south and east China results in the widely using of high-rise resident building, which relies on shear wall structure to obtain sufficient capacity and rigidity (Yee, 1976; Yao et al., 2018), while, the high earthquake risk in most of the China’s territory result in higher seismic requirements on precast shear wall technology. To achieve better seismic performance in precast shear wall technology, the joint interface properties of precast shear wall is the key and should be properly solved (Brunesi et al., 2019; Im et al., 2013; Qin et al., 2020; Wu et al., 2015, 2019a, 2019b; Zhang et al., 2019).
In recent years, some scholars have carried out studies on the precast tenon connection (Chen, 2020a, 2020b; He, 2019; Hou, 2019; Li, 2016). Some research results show that the tenon at the precast shear wall joint interface can effectively improve joint shear performance (Foerster et al., 1989; Soudki et al., 1995a, 1995b, 1996). Relevant study carried out by Sun et al. (2020) on seismic performances of precast shear walls with rabbet-unbound joint and with flat interface joint shows that the precast shear wall with rabbet-unbound joint has good shear capacity, ductility and energy dissipation capacity. However, at present, most of the precast tenons are plain concrete and the tenon sizes are small, which is limited to achieve higher capacity and ductility. The quasi-static tests carried out by Zhang et al. (2016, 2017, 2020) on two precast shear wall specimens with tooth tenon connection show that the strength of the tenon connection specimen is not enough, and low ductility brittle failure occurs, which is caused by the small sizes and plain concrete in the tenon.
To improve the mechanical properties of the tenon, a new type of reinforced tenon precast shear wall (RTPW) is proposed. The structure is shown in Figure 1, and arrangement plan of the steel bars is shown in Figure 2. Φ40 metal bellows are reserved at the bottom of the edge constraint member of the shear wall, and reinforcement is reserved on the surface of the lower beam (Wu, 2016). The two are connected by reserved grouted anchor overlap. The length of grouted anchor overlapping connection is 600 mm. There are no longitudinal connection steel bars in non-edge constraint component. After the installation of the precast components, the high strength grouting material is used to complete the whole one-time grouting of the metal bellows and the tenon area to complete the connection of the upper and lower walls. Functional area distribution of RTPW. Steel bars arrangement plan of RTPW.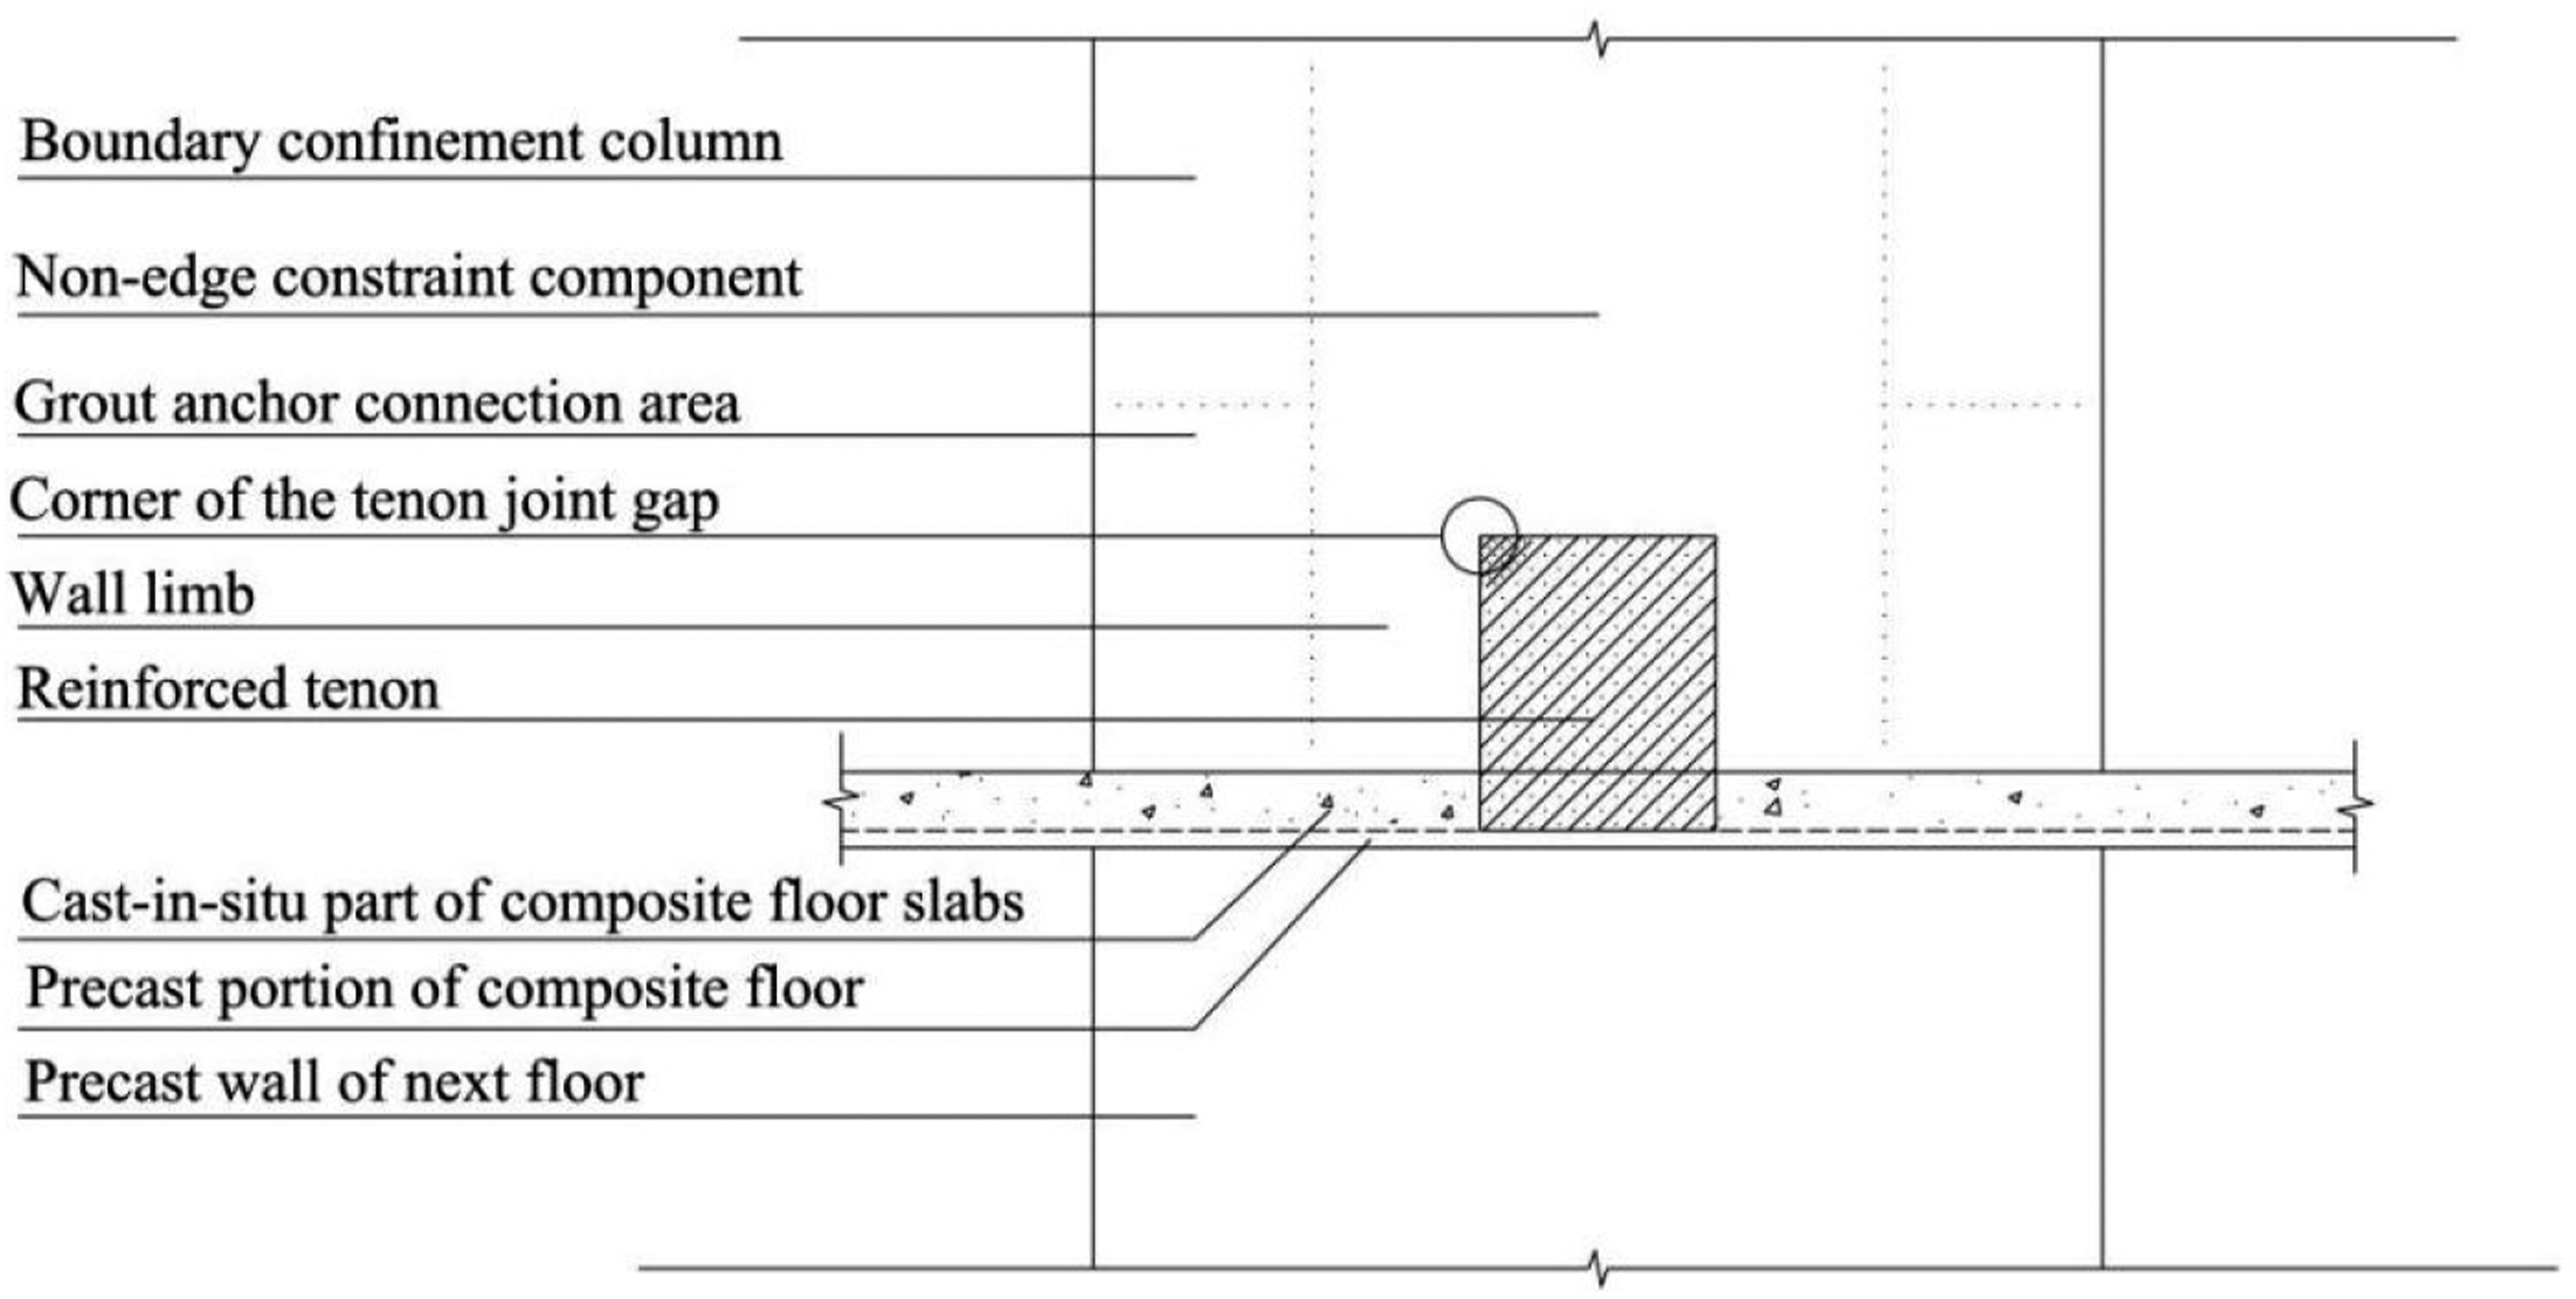

After this new precast shear wall joint was put forwarded, the mechanical properties of RTPW should be completely understood before put into widely application. So, this study carried out low cycle reversed loading test on a cast-in-situ shear wall specimen and two RTPW specimens with different axial compression ratios. Through the test results, the influence of the parameters such as bearing capacity, energy dissipation capacity, hysteresis characteristics and ductility of the reinforced tenon were compared and analyzed.
Test Scheme
Design and Fabrication of Test Specimens
Design parameters of shear wall specimens.
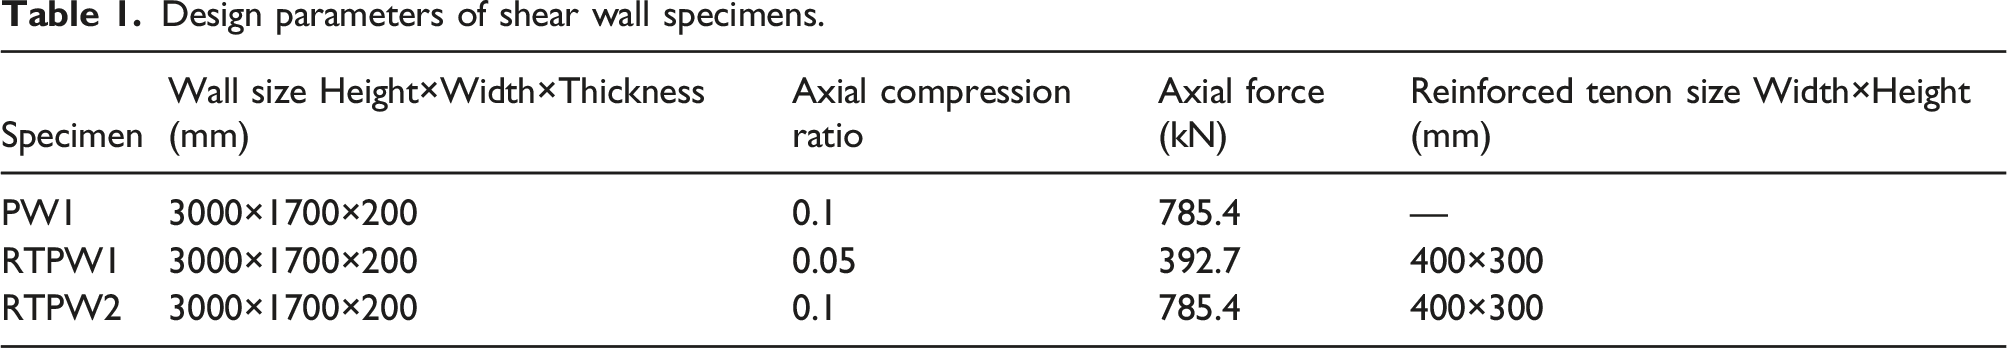
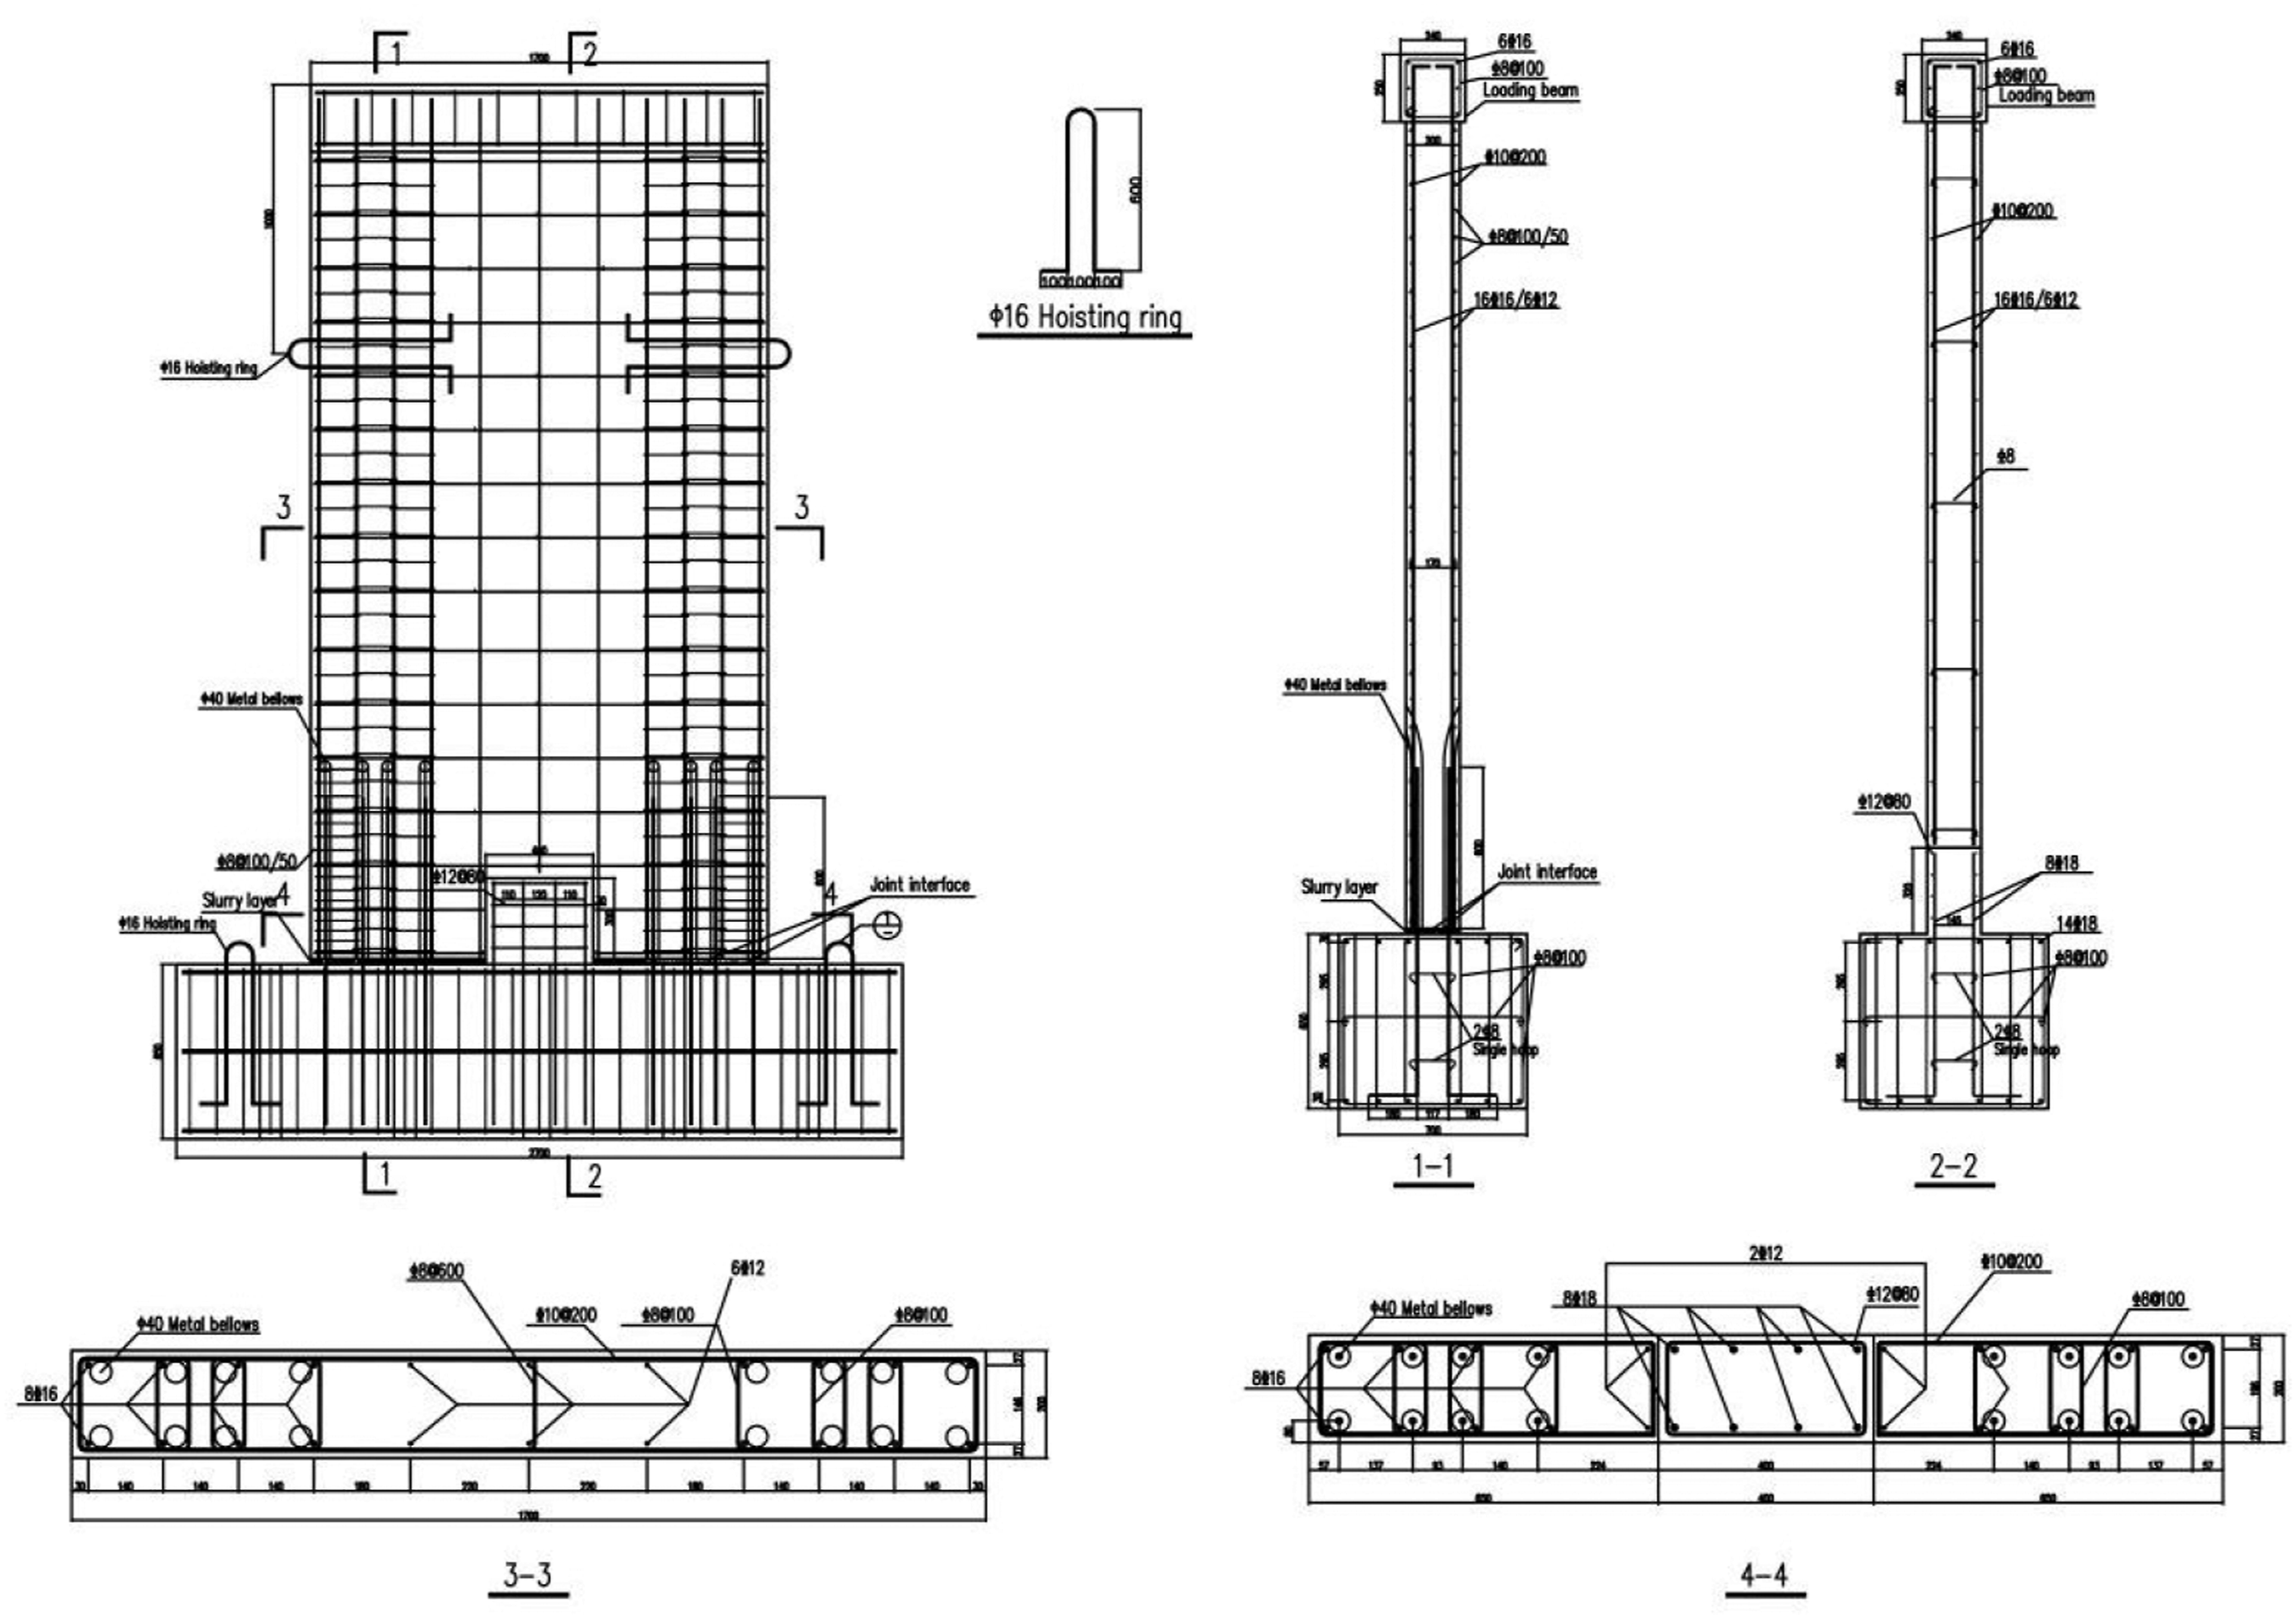
The reinforcement details of the test specimens are shown in Figure 3 and Figure 4. 16C16 (sixteen HRB400 grade steel bars with diameter of 16 mm) are configured at the edge-constrained area of the specimens. The stirrups in the bottom lap area are encrypted to B8@50(HRB335 grade steel stirrups with diameter of 8 mm arranged at spacing of 50 mm), and the stirrups in other parts are B8@100(HRB335 grade steel stirrups with diameter of 8 mm arranged at spacing of 100 mm). C12@200(HRB400 steel bars with diameter of 12 mm arranged at spacing of 200 mm) as the longitudinal steel bars and B10@200(HRB335 steel bars with diameter of 10 mm arranged at spacing of 200 mm) as the horizontal distribution steel bars are arranged at the non-edge constraint area of the specimens. The axial compression ratio of RTPW1 is 0.05, and the axial compression ratio of PW1 and RTPW2 is 0.1. Reinforcement details of PW1. Reinforcement details of RTPW1/2.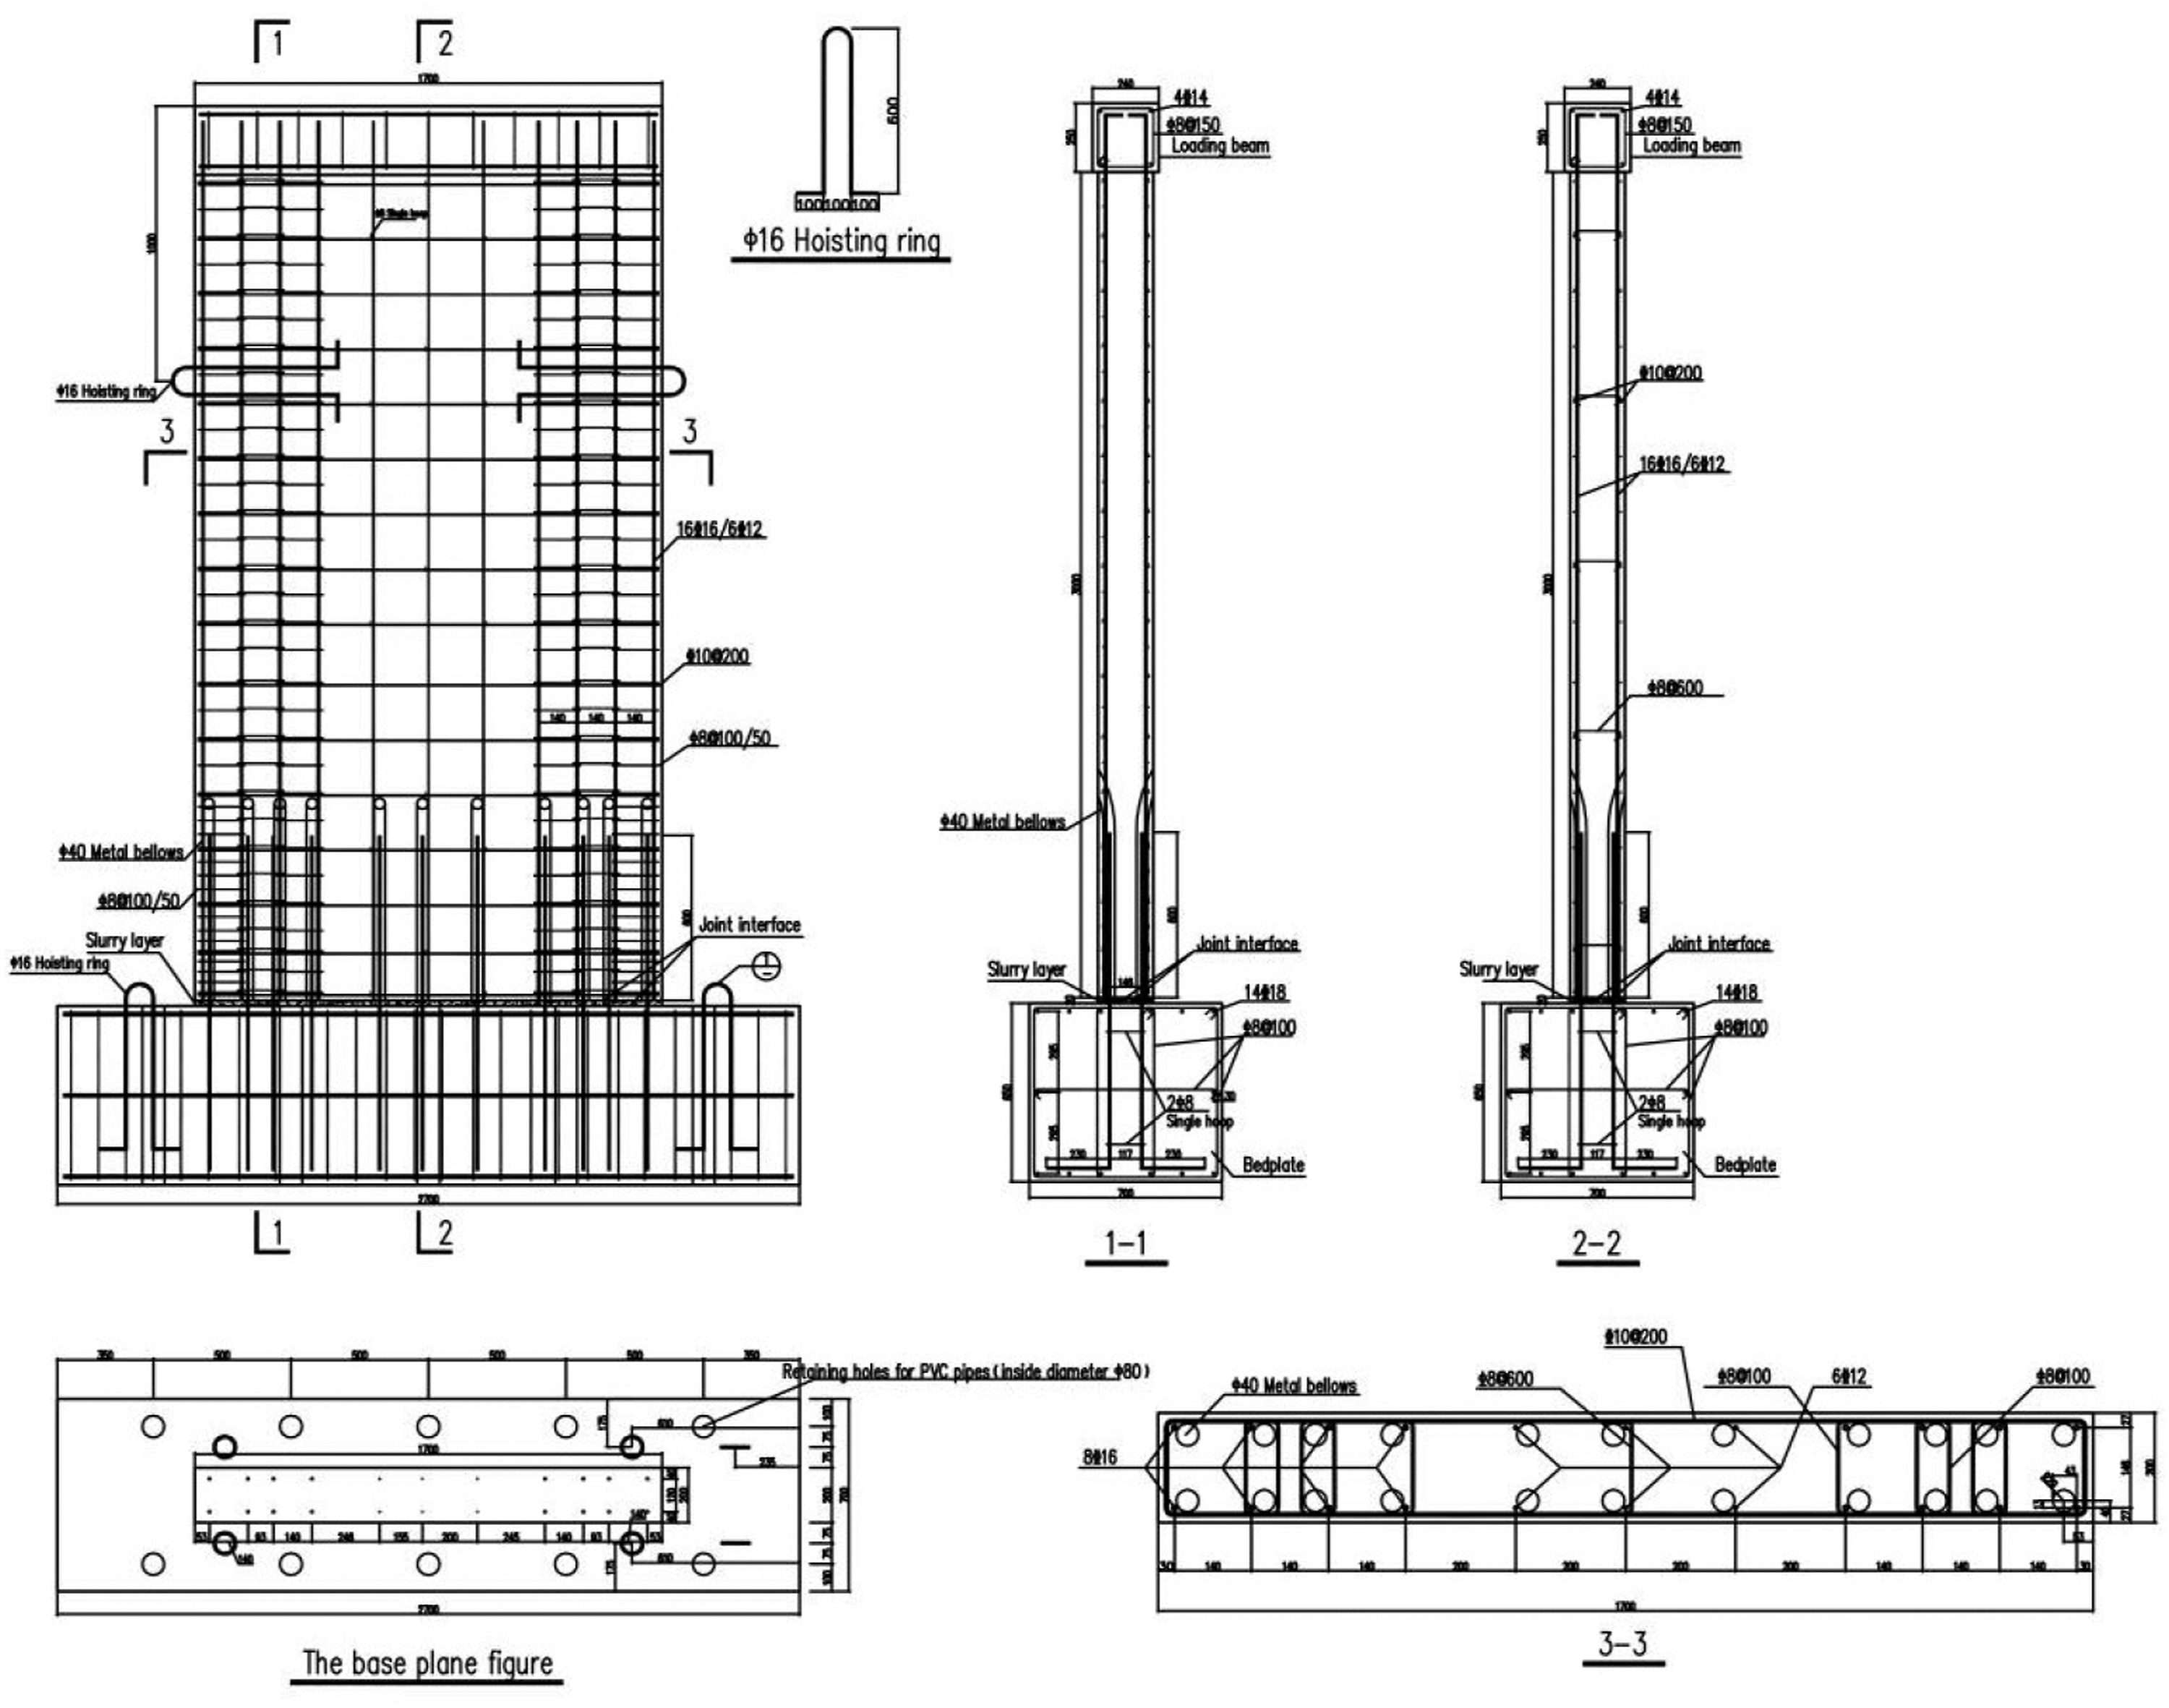
Materials
Cubic compressive strength of concrete (MPa).

Mechanical properties of reinforced materials.

Loading Setup
The loading device is shown in Figure 5, which includes vertical loading device and horizontal loading device. The vertical load is exerted by two 100t hydraulic jacks and the horizontal load is exerted by 1500 kN Mechanical Testing and Simulation (MTS). The low cyclic reversed loading test was adopted in this test, which includes force-controlled loading stage and displacement-controlled loading stage. The force-controlled loading stage was adopted when the reinforcement had not yet yielded. The load of each step was increased by 50 kN and was repeated for one time. The strain values collected by the steel strain gauges (JFL-1/2 and JFR-1/2, as shown in Figure 6) on the longitudinal connection steel bars at the precast joint were used to determine the yielding. The displacement-controlled loading stage was adopted after the steel bars yielded. The displacement increment at each step was the yield displacement ( Test loading device. Steel strain gauges arrangement.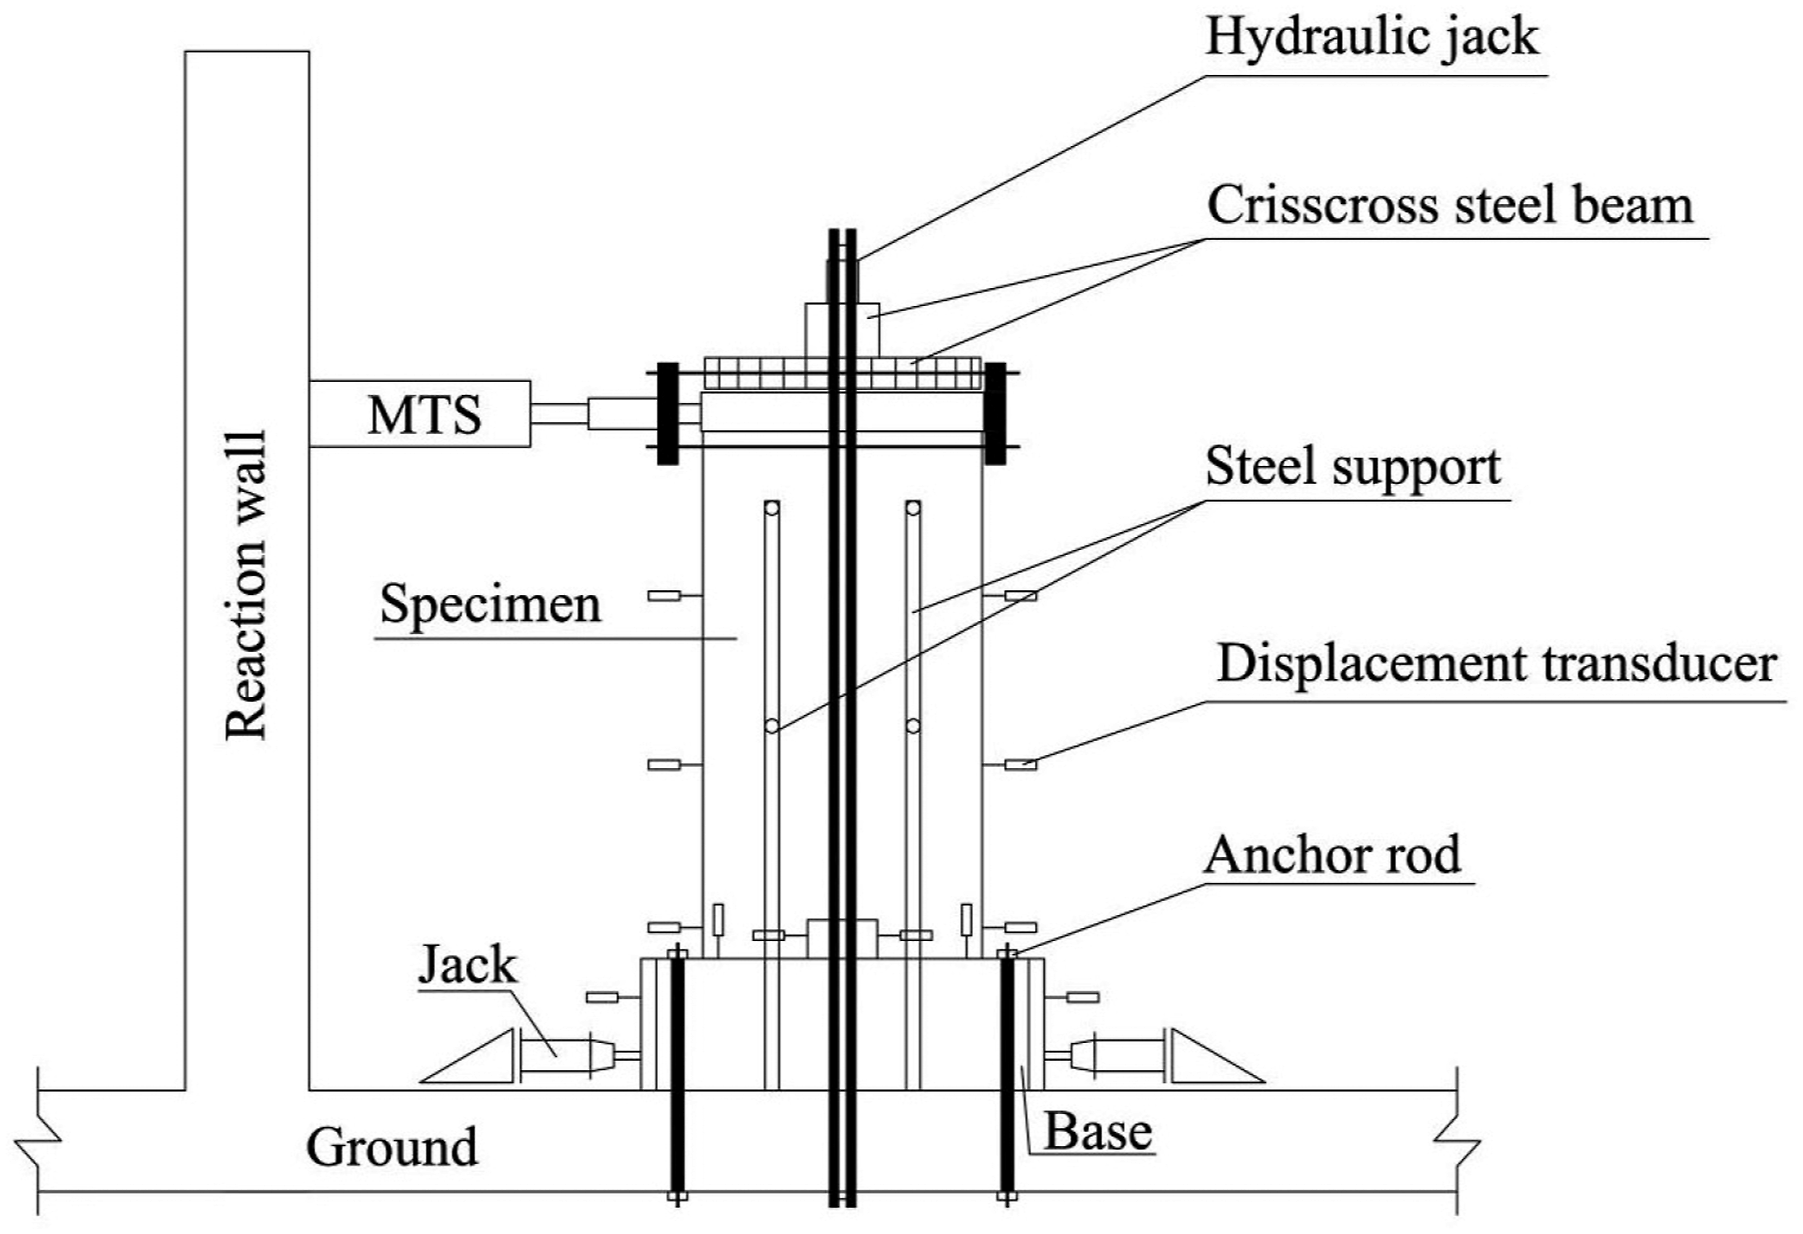

Measurement Method
The steel strain gauges arrangement is shown in Figure 6. During the test, the steel strain of the precast shear wall was observed by the steel strain gauges. Two displacement transducers are arranged at 0.1 m, 1m, and 2m above the precast joint of the specimen, and two displacement transducers are arranged in the vertical direction on both sides of the wall to observe the vertical joint opening displacement. The type of displacement transducers is the D100.
Test Result
Cracks and Damage
The crack distribution of PW1 is shown in Figure 7. Failure form of PW1.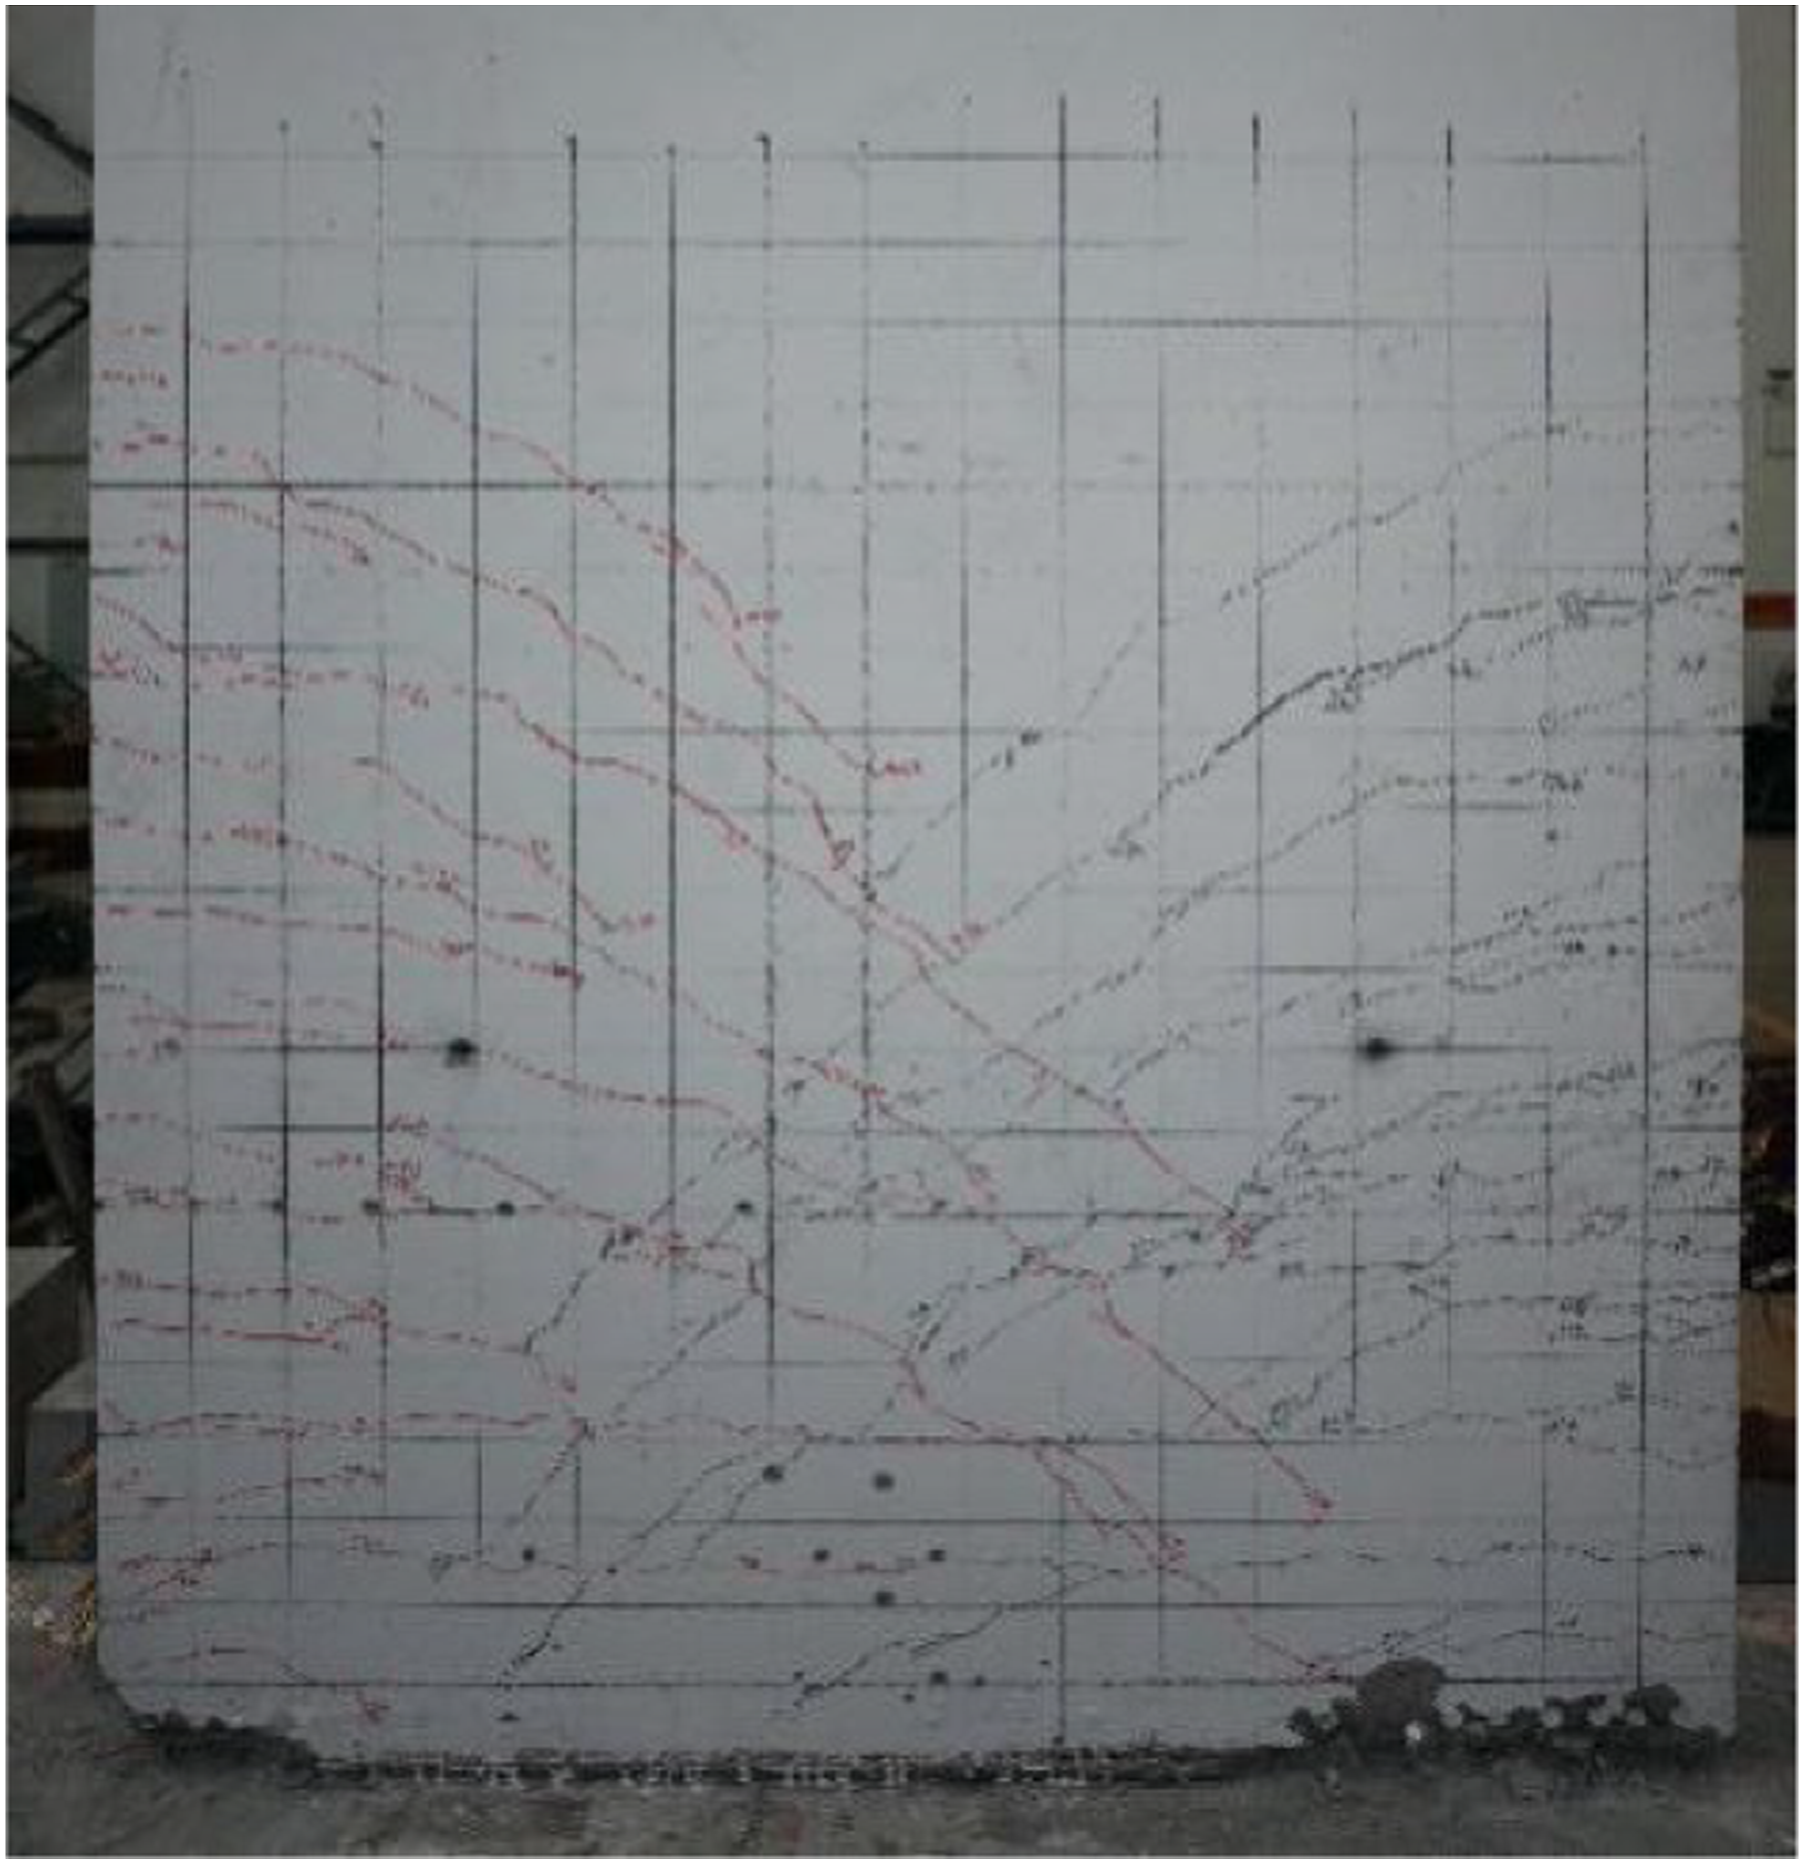
At the initial loading stage, there was no obvious crack. The specimen was in the non-cracking state, and the load–displacement curve tended to be linear. When the load reached ±350 kN, the first batch of horizontal cracks appeared on the shear wall joint interface. When the load reached ±450 kN, new horizontal cracks appeared at the outlet hole position on the wall, which is also the edge of the slurry anchor overlap. When the load reached ±500 kN, the specimen began to yield. At this time, the displacement of the specimen was 8.85 mm and −10.98 mm, and the maximum relative slip of the joint interface was 1.4 mm. The loading mode turned into displacement-controlled stage. In this stage, the horizontal relative slip increased gradually, and the specimen cracked and damaged continuously. When the displacement reached 2
The crack distribution of RTPW1 is shown in Figure 8. Failure form of RTPW1.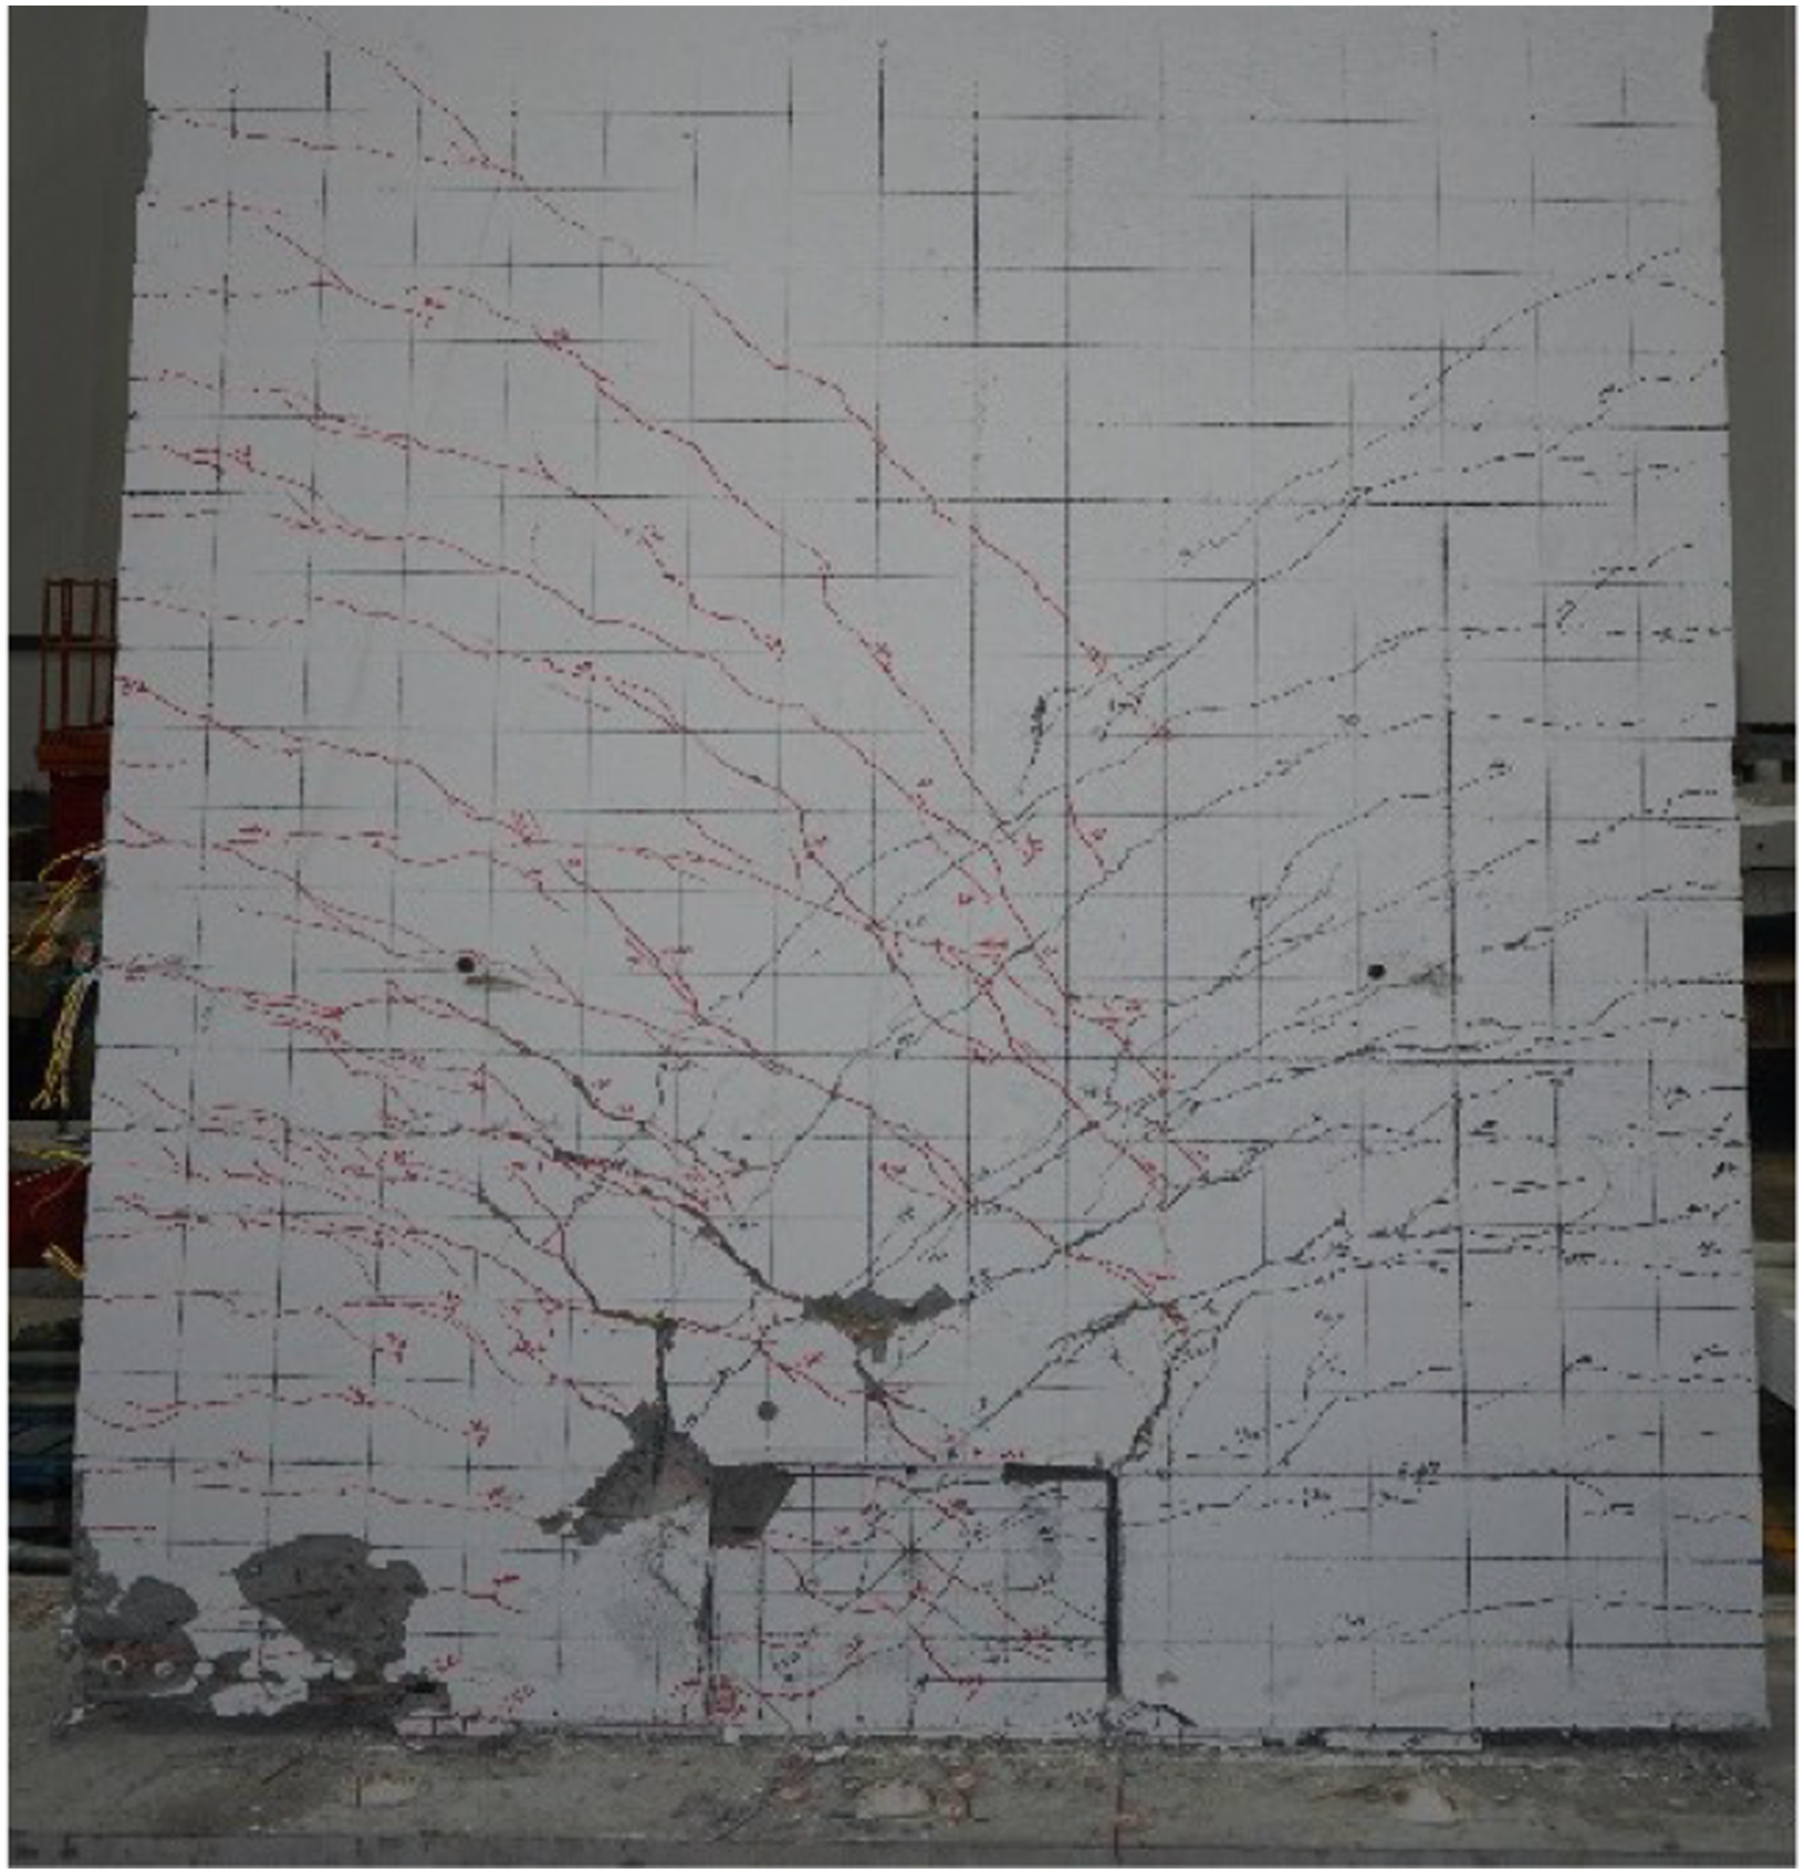
At the initial loading stage, there was no obvious crack. The specimen was in the non-cracking state, and the load–displacement curve tended to be linear. When the load reached ±350 kN, the first batch of horizontal cracks appeared on the shear wall joint interface. When the load reached ±400 kN, a 100 mm long crack extending upward along the 45 degree angle appeared at the corner of the reinforced tenon. When the load reached ±500 kN, the specimen began to yield. At this time, the displacement of the specimen was 11.13 mm and −14.07 mm, and the maximum relative slip of the joint interface was 0.6 mm. The loading mode turned into displacement-controlled stage. In this stage, the horizontal relative slip increased gradually, and the specimen cracked and damaged continuously. When the displacement reached 2
The crack distribution of RTPW2 is shown in Figure 9. Failure form of RTPW2.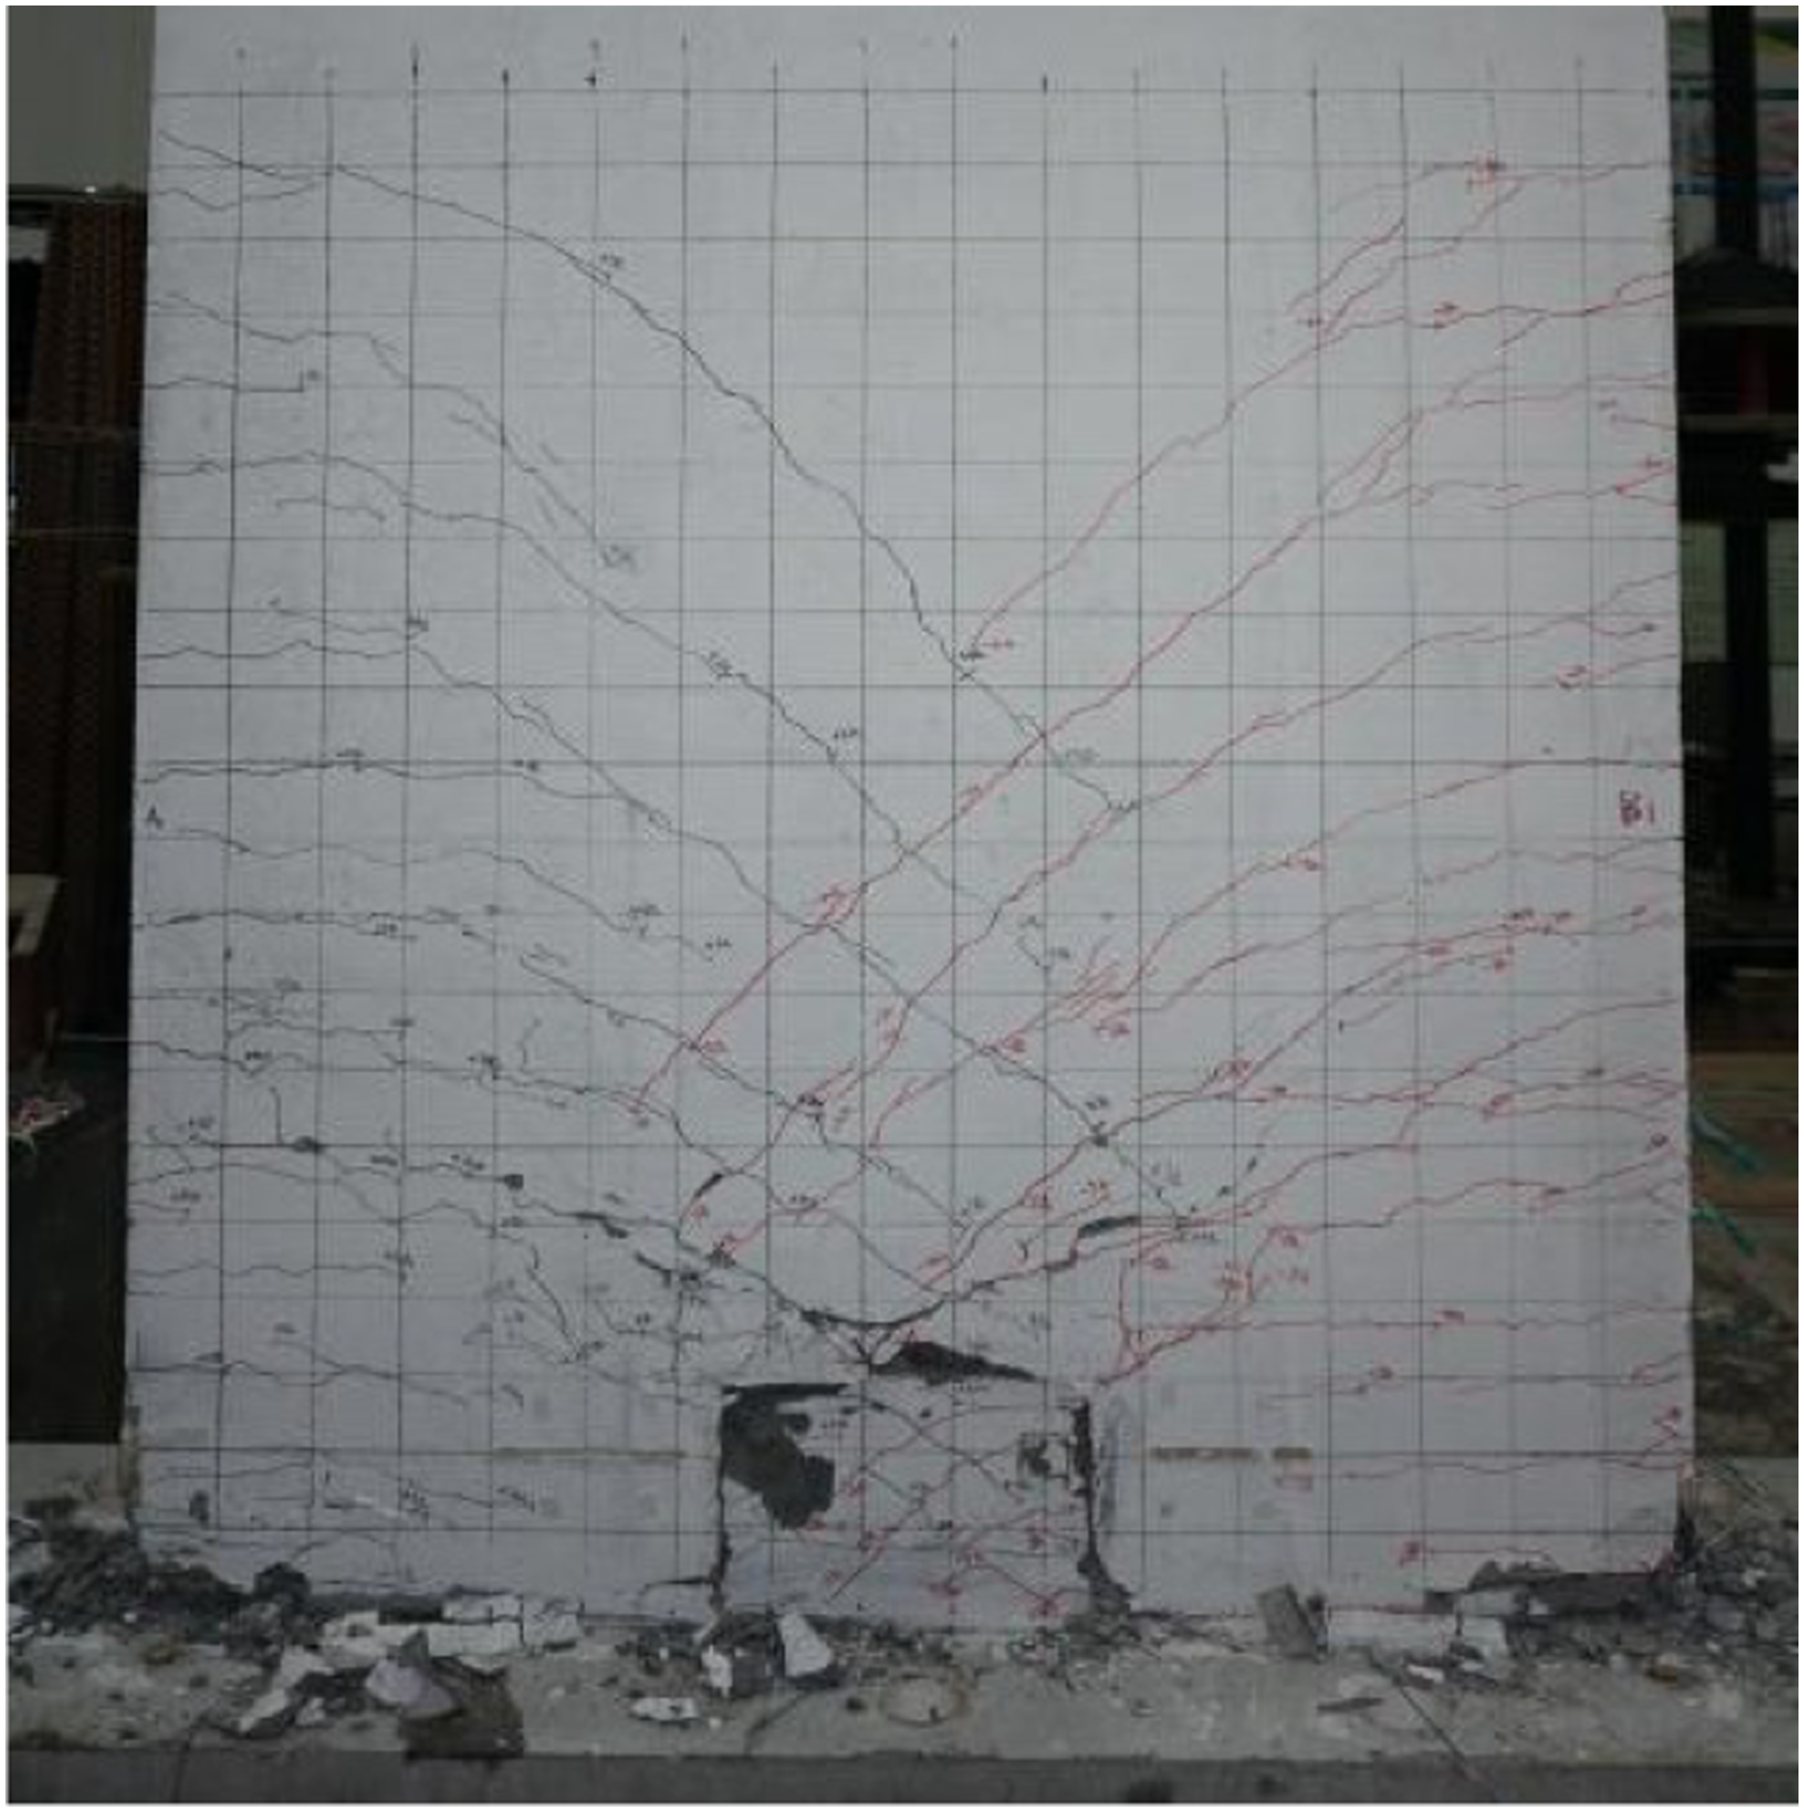
At the initial loading stage, there was no obvious crack. The specimen was in the non-cracking state, and the load–displacement curve tended to be linear. When the load reached ±300 kN, the first batch of horizontal cracks appeared on the shear wall joint interface. When the load reached ±350 kN, the first oblique crack appeared at the bottom of the tenon. When the load reached ±500 kN, the specimen entered the yield stage. At this time, the displacement of the specimen was 5.55 mm and −9.37 mm, and the maximum relative slip of the joint interface was 0.17 mm. The loading mode turned into displacement-controlled stage. In this stage, the horizontal relative slip increased gradually, and the specimen cracked and damaged continuously. When the displacement reached 3
According to the experimental observation results, it can be seen that: 1) Failure modes of three shear walls were all compression-bending failure. The steel bars at the outermost edge of the wall were yielded and fractured, and the concrete in the compression zone was crushed. Bending-shear cracks were mainly distributed in the upper part of the wall. From the bottom of the wall to the grouted anchor overlapping area, the cracks were mainly bending cracks. In the reinforced tenon, the cracks were mainly shear cracks. 2) The cracks first occurred at the upper edge of the grouted anchor overlapping area. As a result of stress concentration, the crack extending upward along the 45 degree angle appeared at the corner of the reinforced tenon. 3) During the test, there was no large slip at the joint interface of RTPW1 and RTPW2. When the wall entered the yield stage and the failure stage, the maximum relative slip of the joint interface of the RTPW2 was lower than that of the PW1. This shows that the reinforced tenon joint can effectively restrain the horizontal slip of the component and reduce the shearing action of steel bars pin keys. 4) In the ultimate stage of test loading, the edge and top of the tenon would be separated from the wall, resulted in a large opening displacement.
Hysteresis Curve and Skeleton Curve
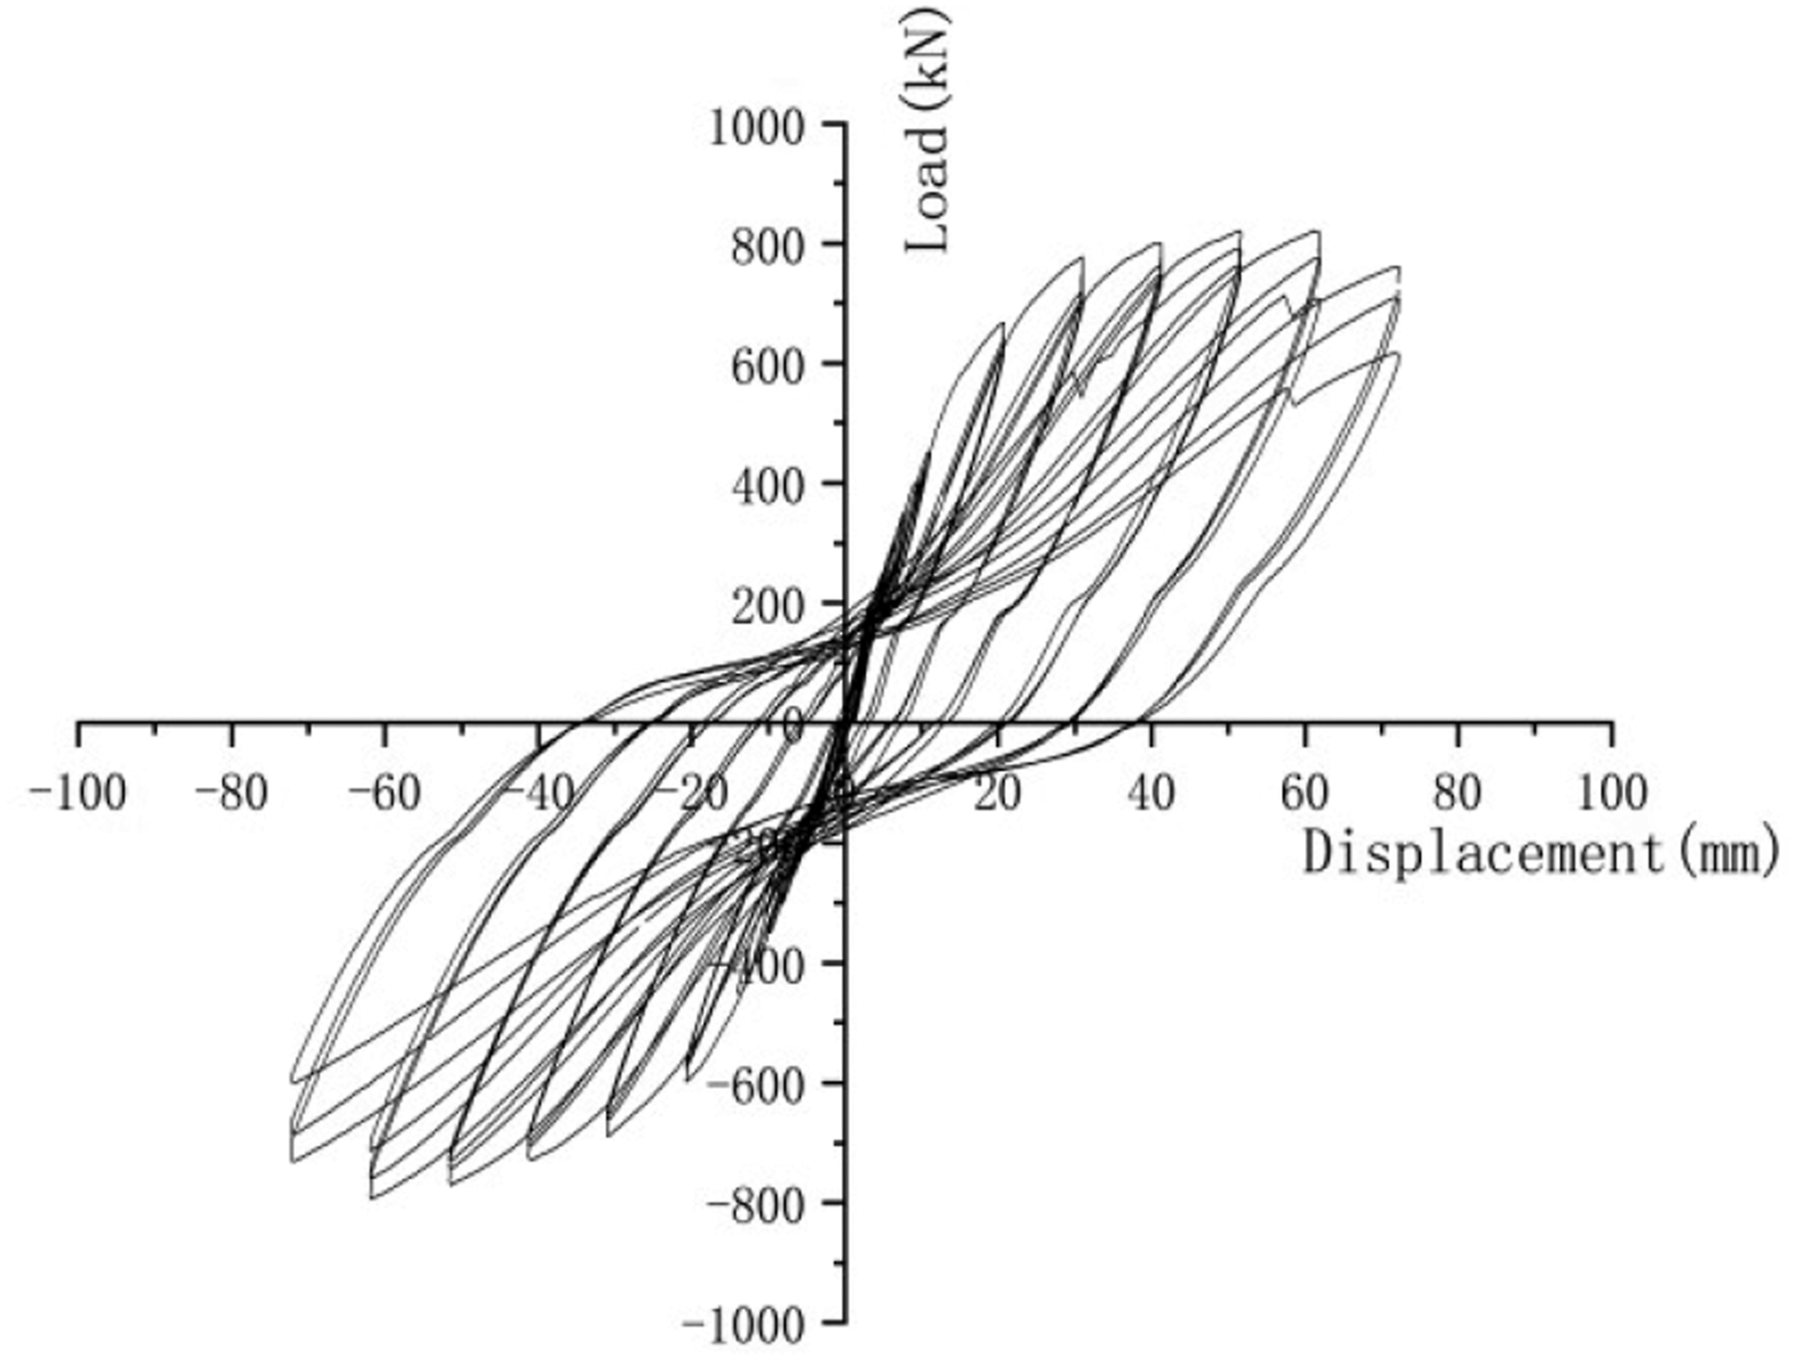
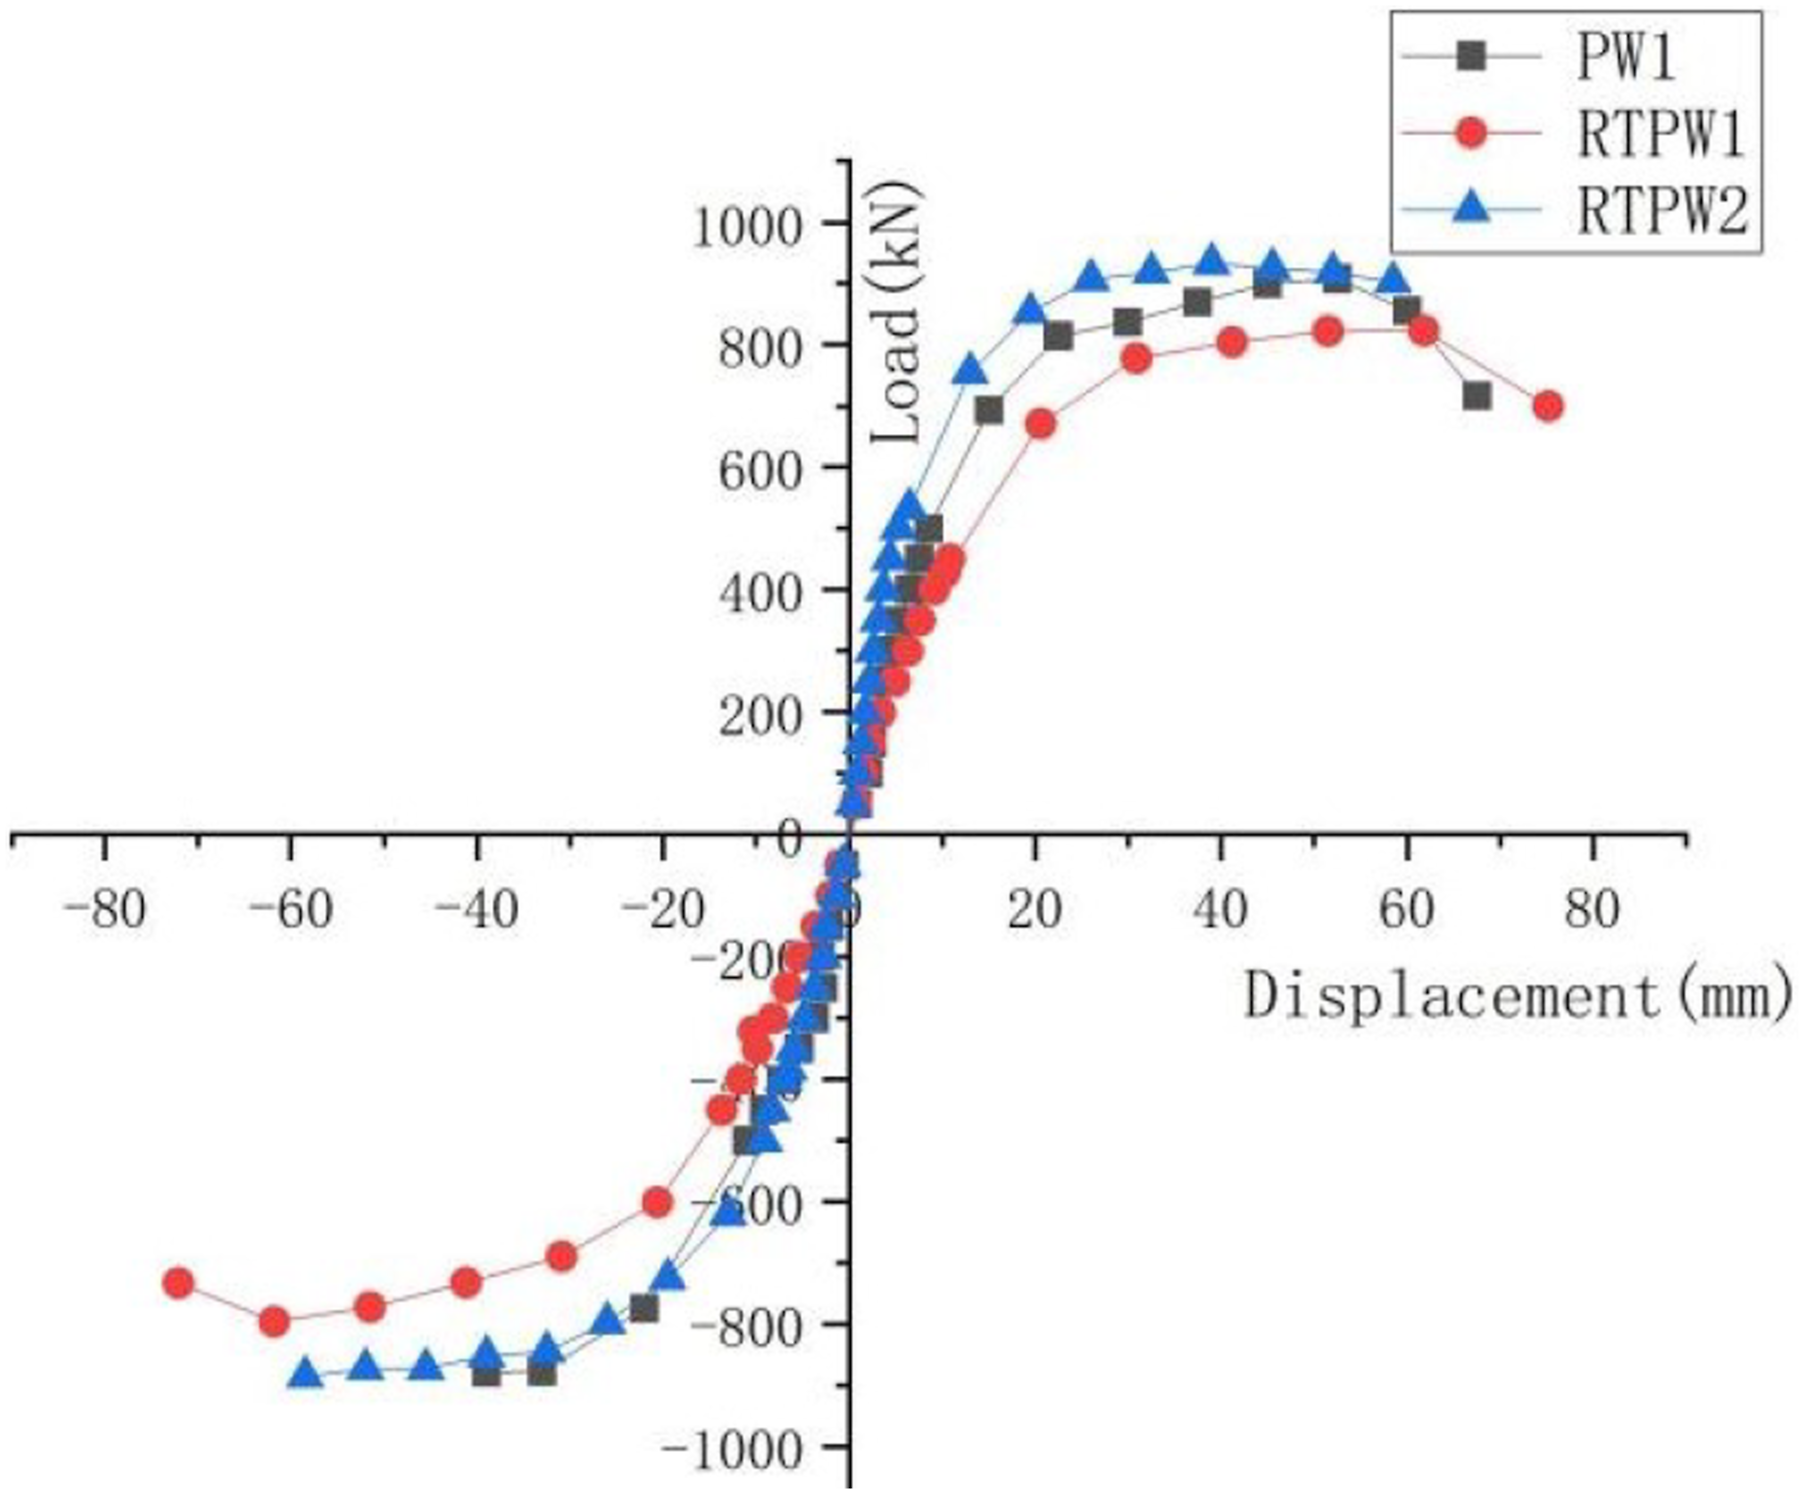
The hysteresis curves and skeleton curves of the three specimens are shown in Figures 10–13. Due to the maximum negative load provided by MTS was insufficient, the deformation of PW1 could not continue to increase. So the ultimate displacement of PW1 under negative load was maintained at −38 mm. It can be seen from the hysteresis curves and skeleton curves that the specimens have obvious elastic–plastic characteristics. When the longitudinal reinforcement yielded, the residual deformation of the hysteresis curve increased. At the same time, the area of the hysteresis loop increased, and the energy dissipation capacity continued to improved. The shape of the hysteresis loop is the bow-shaped. Comparing the hysteresis curves and skeleton curves of the three specimens, it can be seen that the peak load and bearing capacity of RTPW2 are slightly lower than those of PW1, which indicates that the reinforced tenon at the joint interface has little effect on the bearing capacity of the specimen. The bearing capacity of RTPW1 is lower than that of RTPW2, but its ductility is better, which shows that the lower axial compression ratio is, the better the ductility is. Hysteresis curve of PW1. Hysteresis curve of RTPW1. Hysteresis curve of RTPW2. Skeleton curves of three specimens.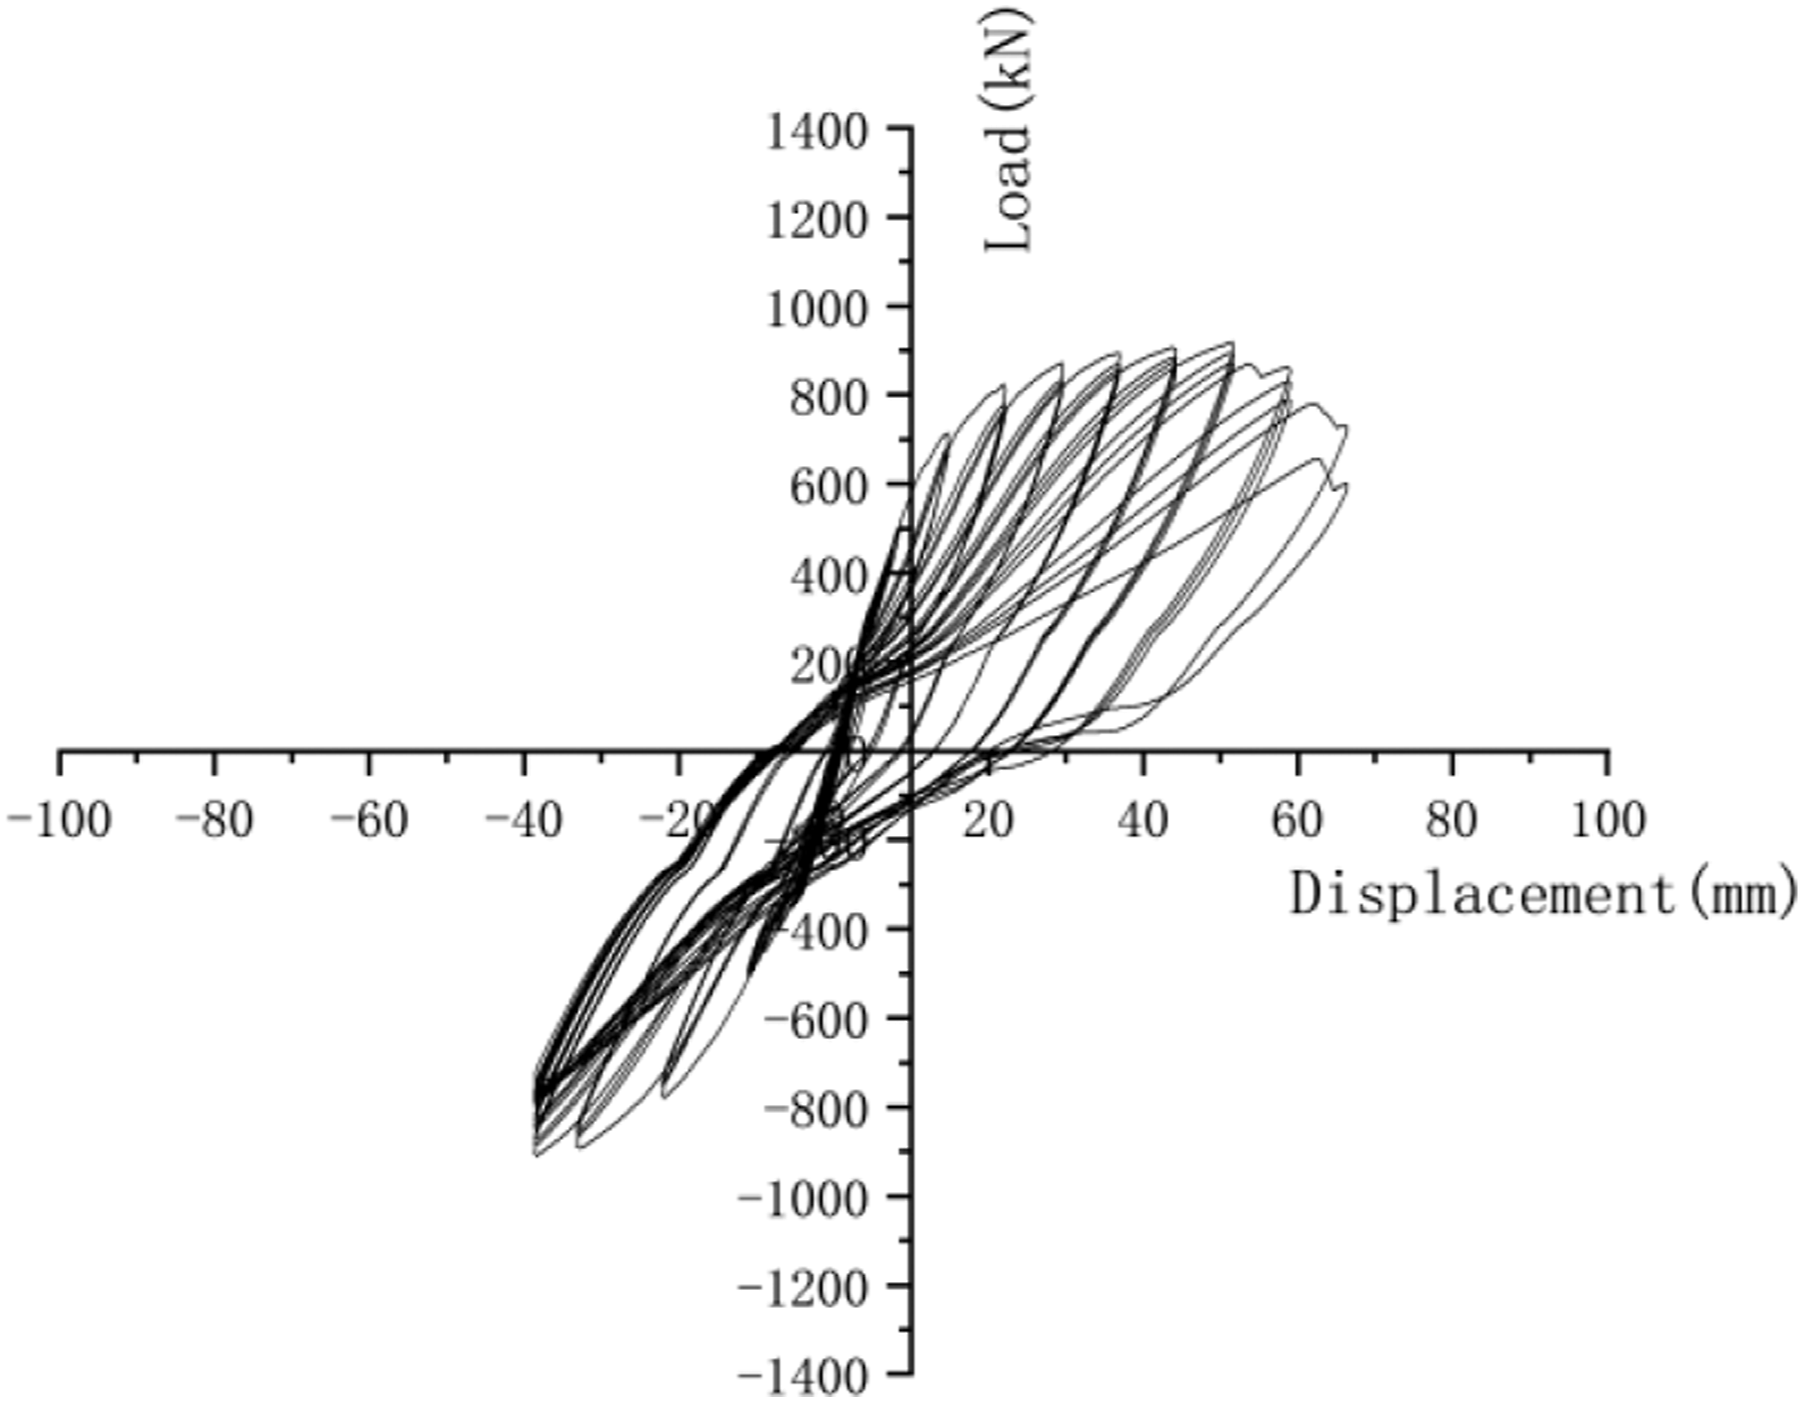

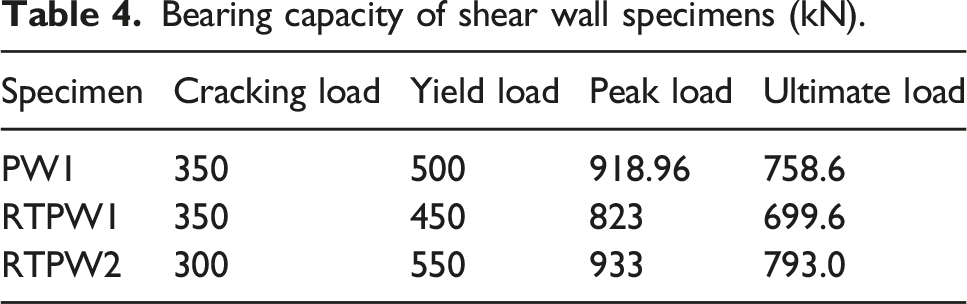
Bearing Capacity
Bearing capacity of shear wall specimens (kN).
Displacement and Ductility
Ductility and interlayer displacement angle of test specimens.

Steel Strain
The load–strain curves of longitudinal connected steel bars in the outermost position of the three specimens' joint interface are shown in Figures 14–16. Load–strain curve of longitudinal connected steel bars in the outermost position of PW1. Load–strain curve of longitudinal connected steel bars in the outermost position of RTPW1. Load–strain curve of longitudinal connected steel bars in the outermost position of RTPW2.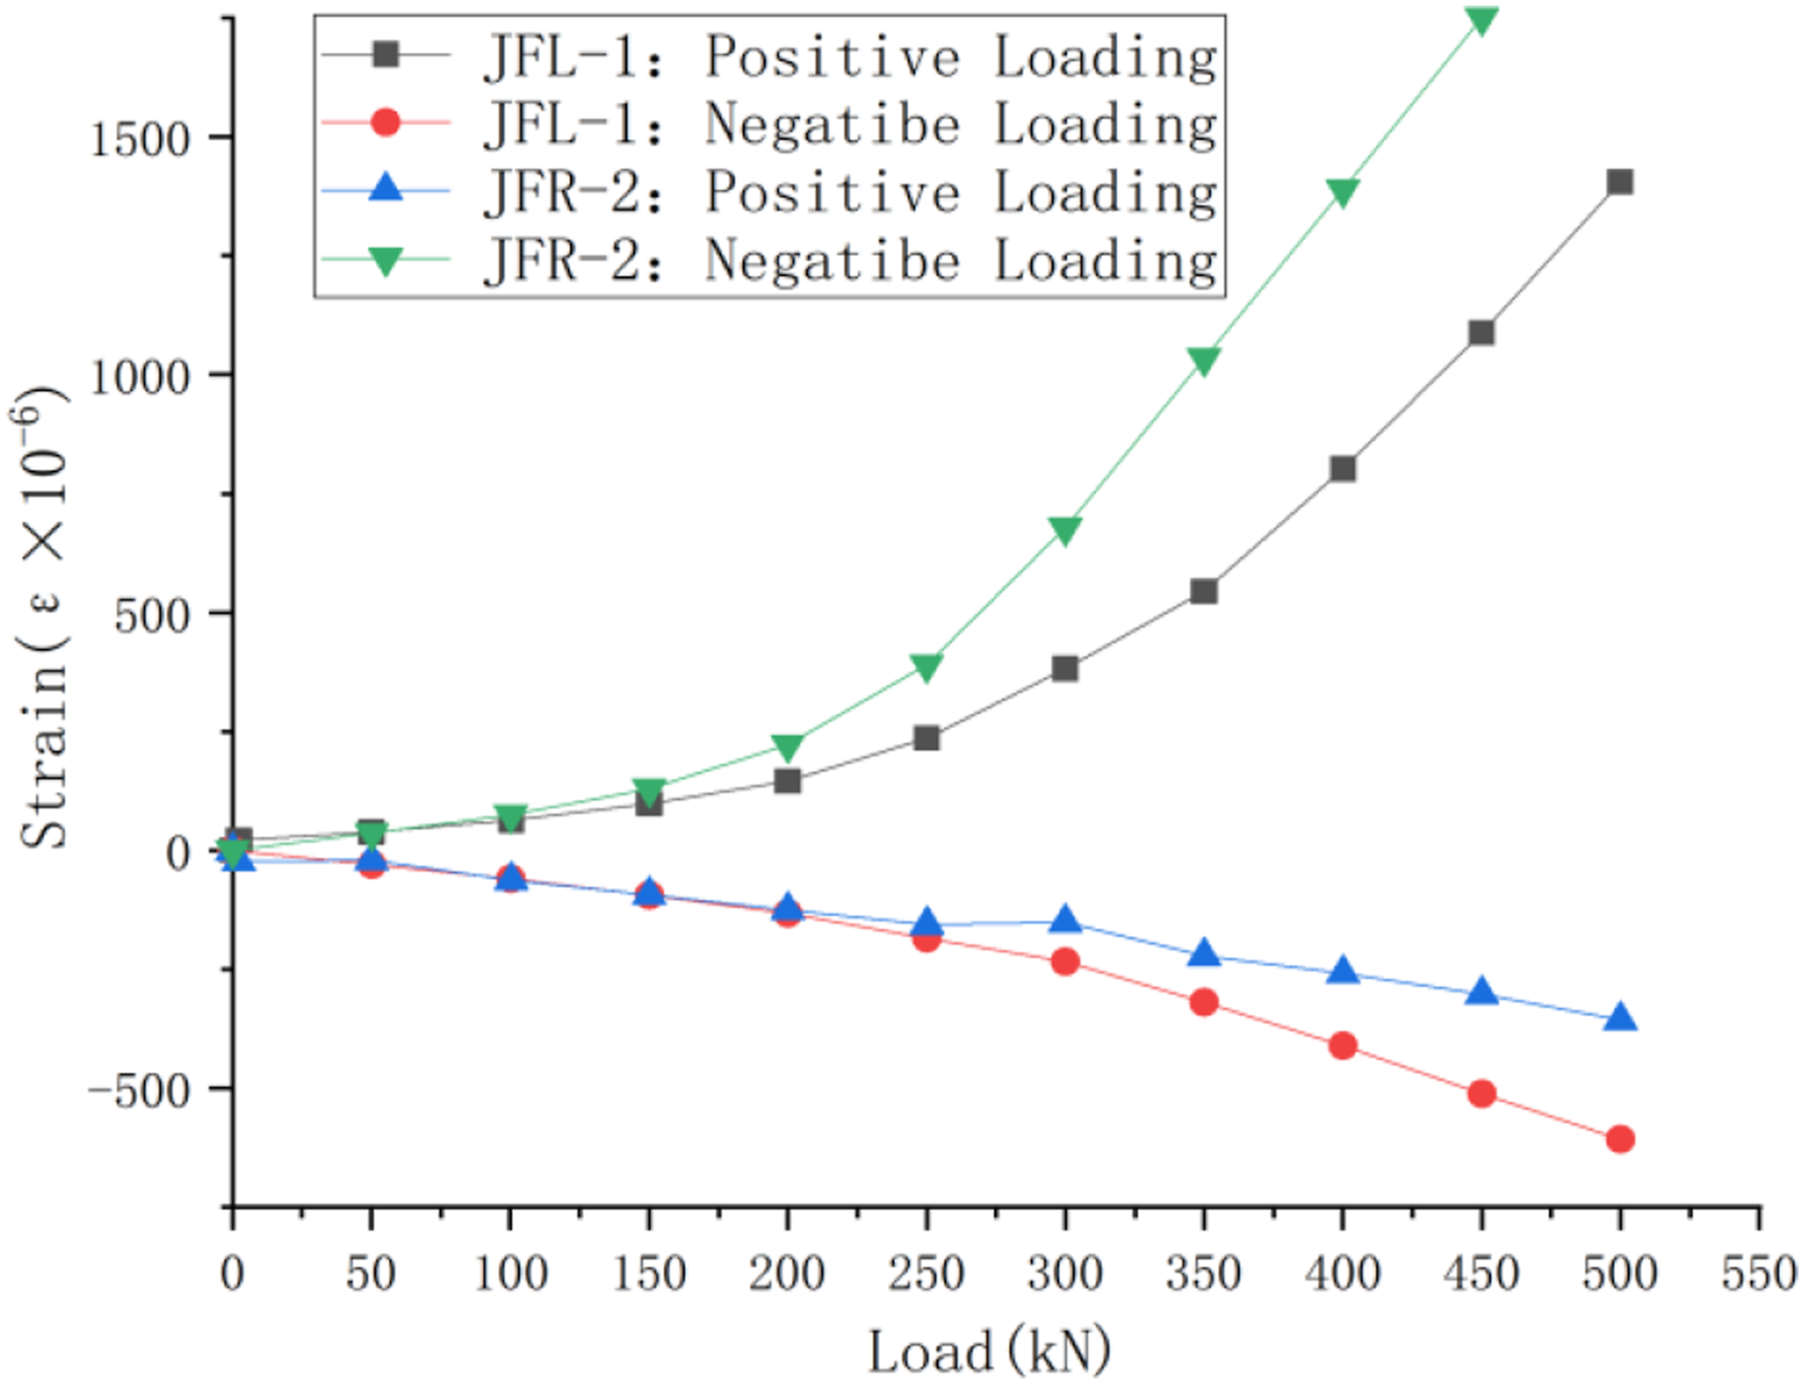

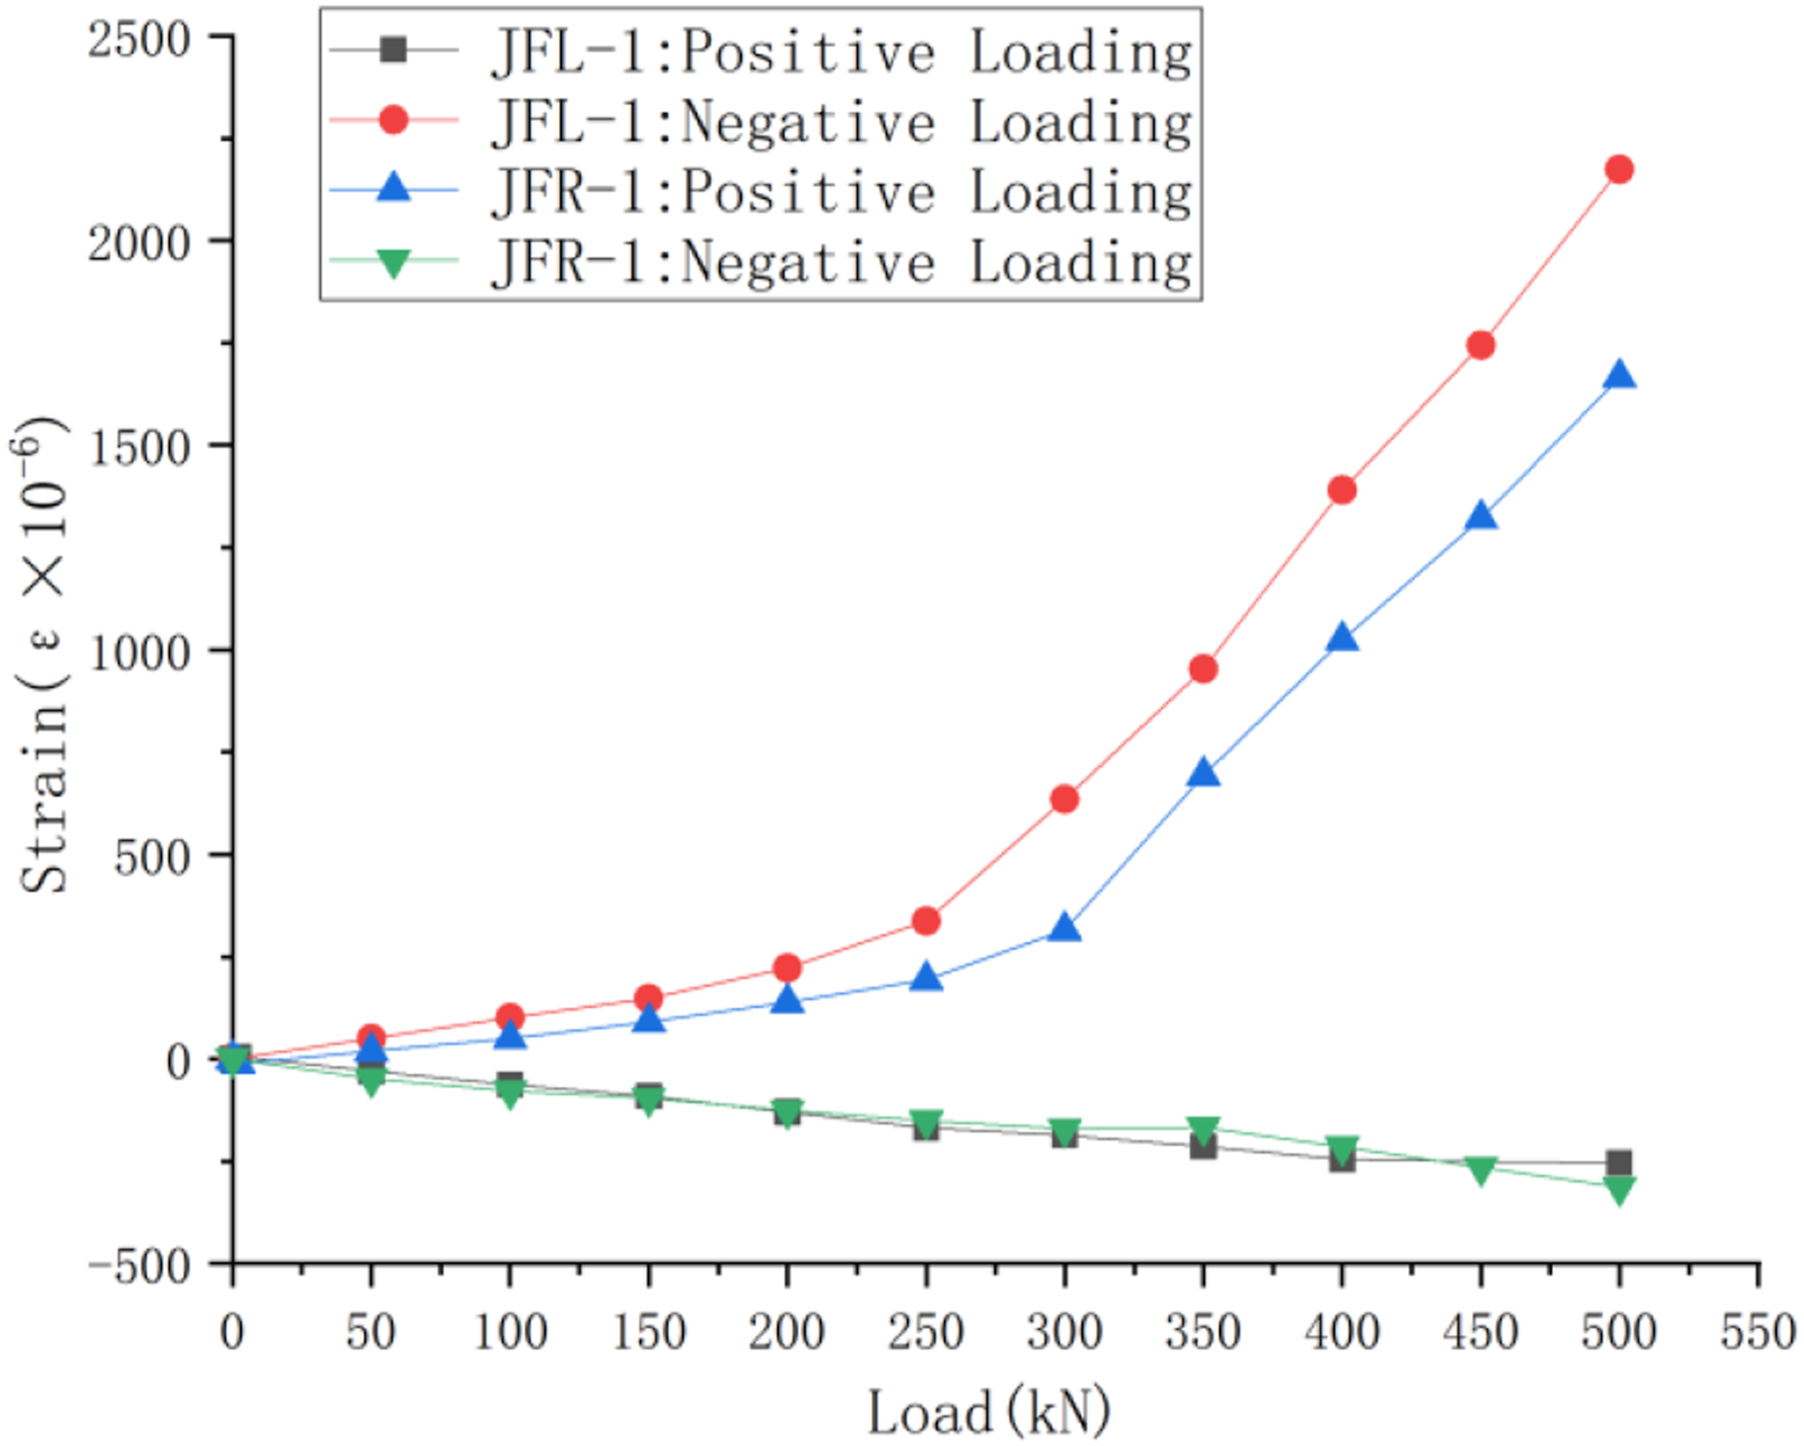
It can be seen from Figures 14–16 that differences exist in the strain variation trend under positive and negative load, that is, under each loading stage, the strain variation under positive load is greater than that under negative load. The reason causing the differences is that the leftmost connected steel bars, where the JFL-1 was set, are in-tension condition under the positive load and the tensile property of concrete is weak leading that the stress is mainly borne by the leftmost steel bars. While when the leftmost connected steel bars are in compression state under the negative load, the concrete can bear part of the stress, so, the stress on leftmost steel bars is low, as the curve of “JFL-1: Negative load” shown in Figure 14. The stress state of the rightmost longitudinal connected steel bars is opposite to that of the leftmost longitudinal connected steel bars, so, the strain–load curves of “JFR-2” are opposite to that of “JFL-1.”
It can also be found that under the same lateral load, the strain of the longitudinal connected steel bars in the outermost position of RTPW2 was generally lower than that of RTPW1. This phenomenon indicates that under the action of larger axial compression ratio, the strain of longitudinal connected steel bars in edge position changes more rapidly.
Energy Dissipation Capacity
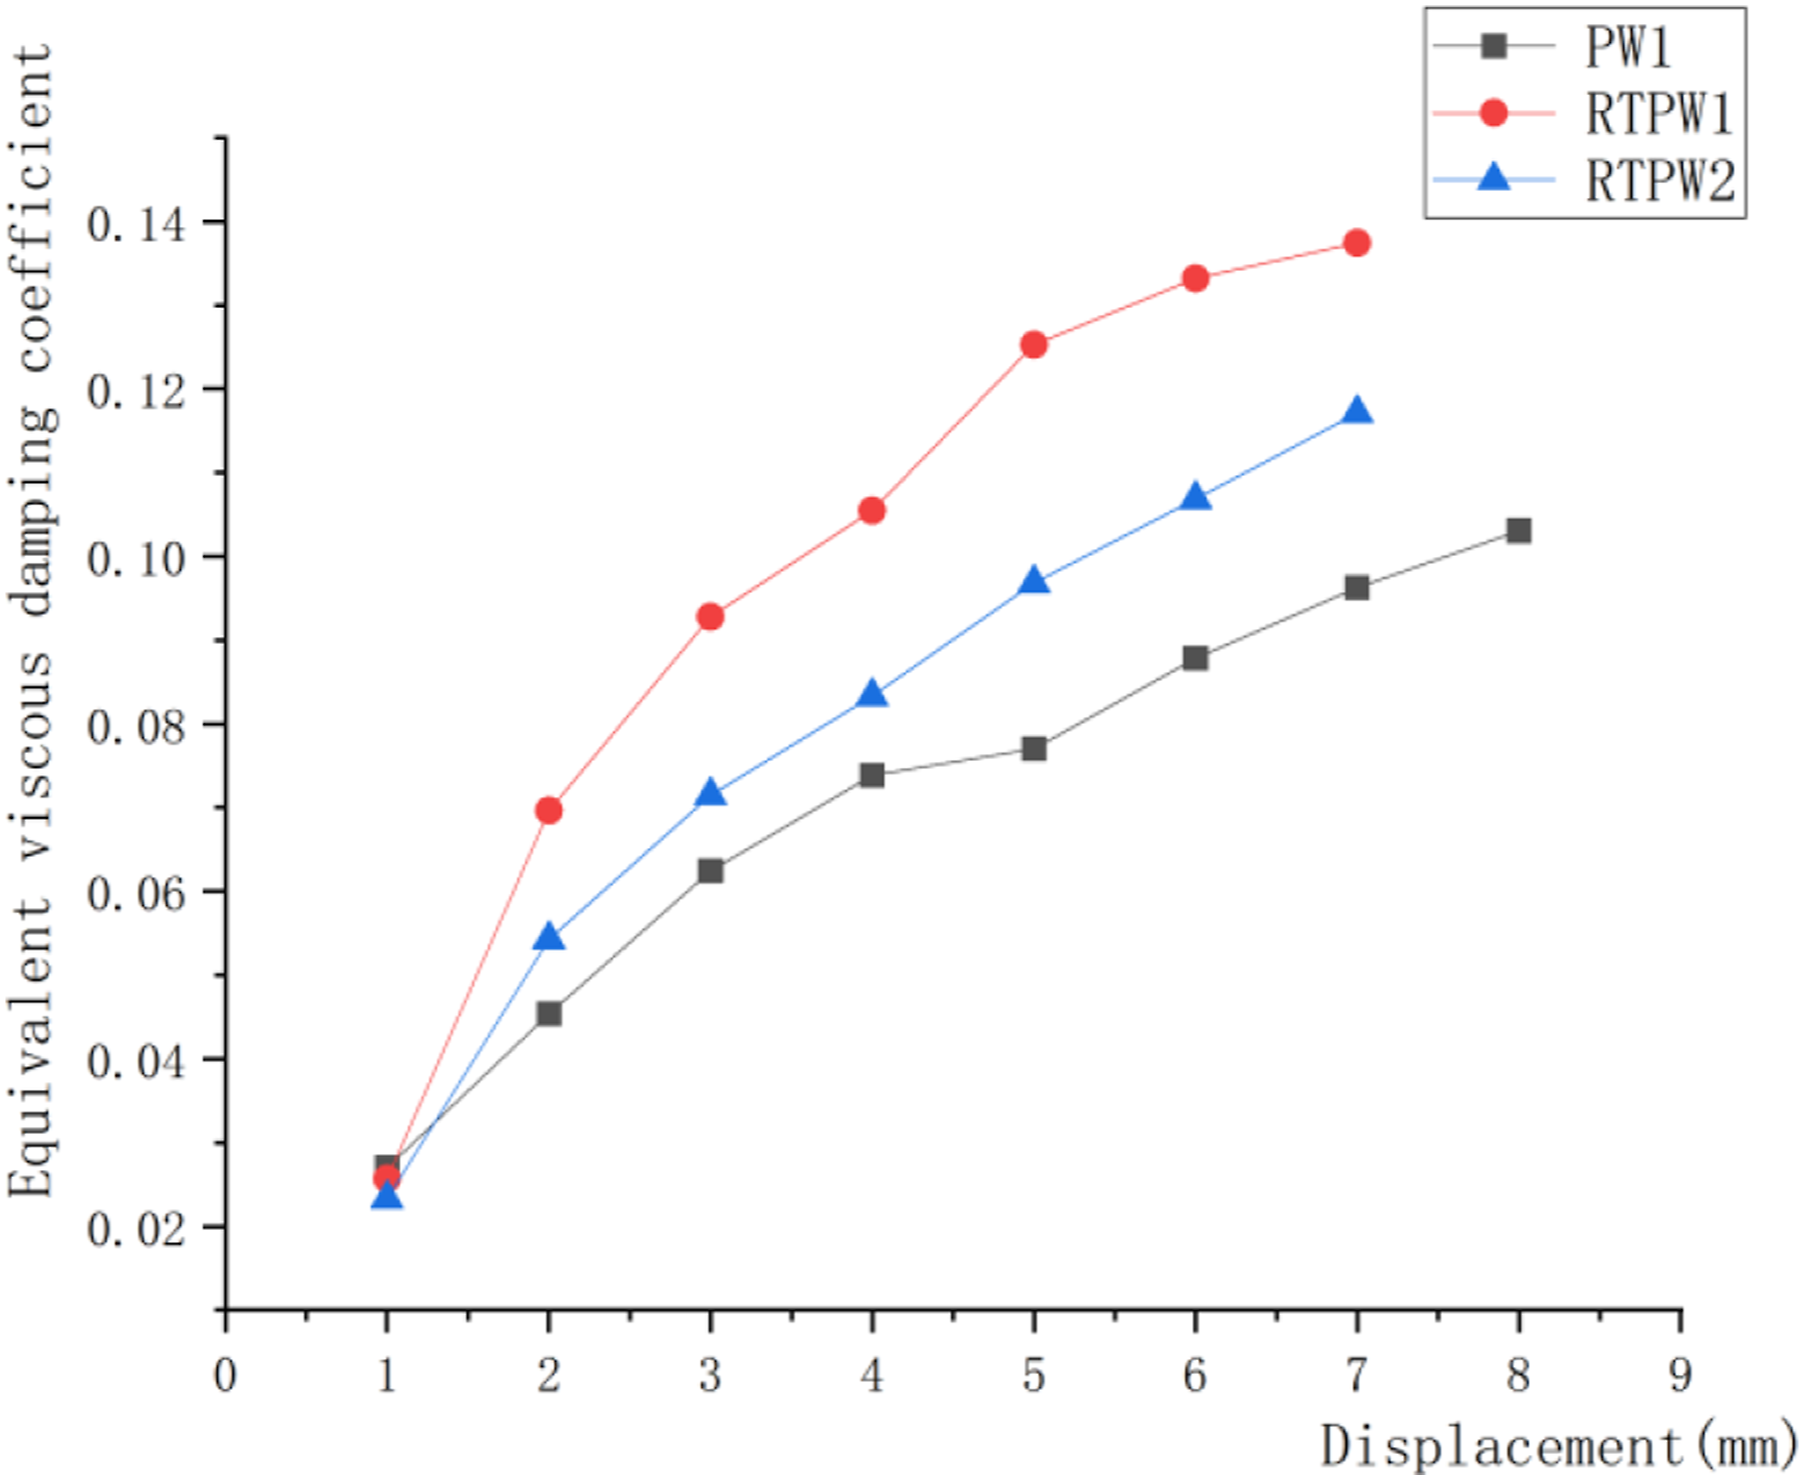
The energy dissipation capacity of the specimen is usually determined by the area of the hysteresis curve in the test loading process. Due to the differences in cubic compressive strength of concrete of the three specimens, it is not comparable to simply compare the hysteresis loop area. Therefore, this paper uses the equivalent viscous damping coefficient (
The equivalent viscous damping coefficients of the three specimens are shown in Figure 17. 1) With the increase of displacement, the energy dissipation capacity of three specimens gradually increased. 2) The energy dissipation capacity of RTPW1 was better than RTPW2. This shows that larger axial compression ratio of the RTPW cause lower the energy dissipation capacity. 3) The energy dissipation capacity of RTPW1 and RTPW2 were all higher than that of PW1, indicating that the reinforced tenon improved the energy dissipation capacity of the shear wall. Comparison of equivalent viscous damping coefficient of each specimen.
Rigidity Degeneration
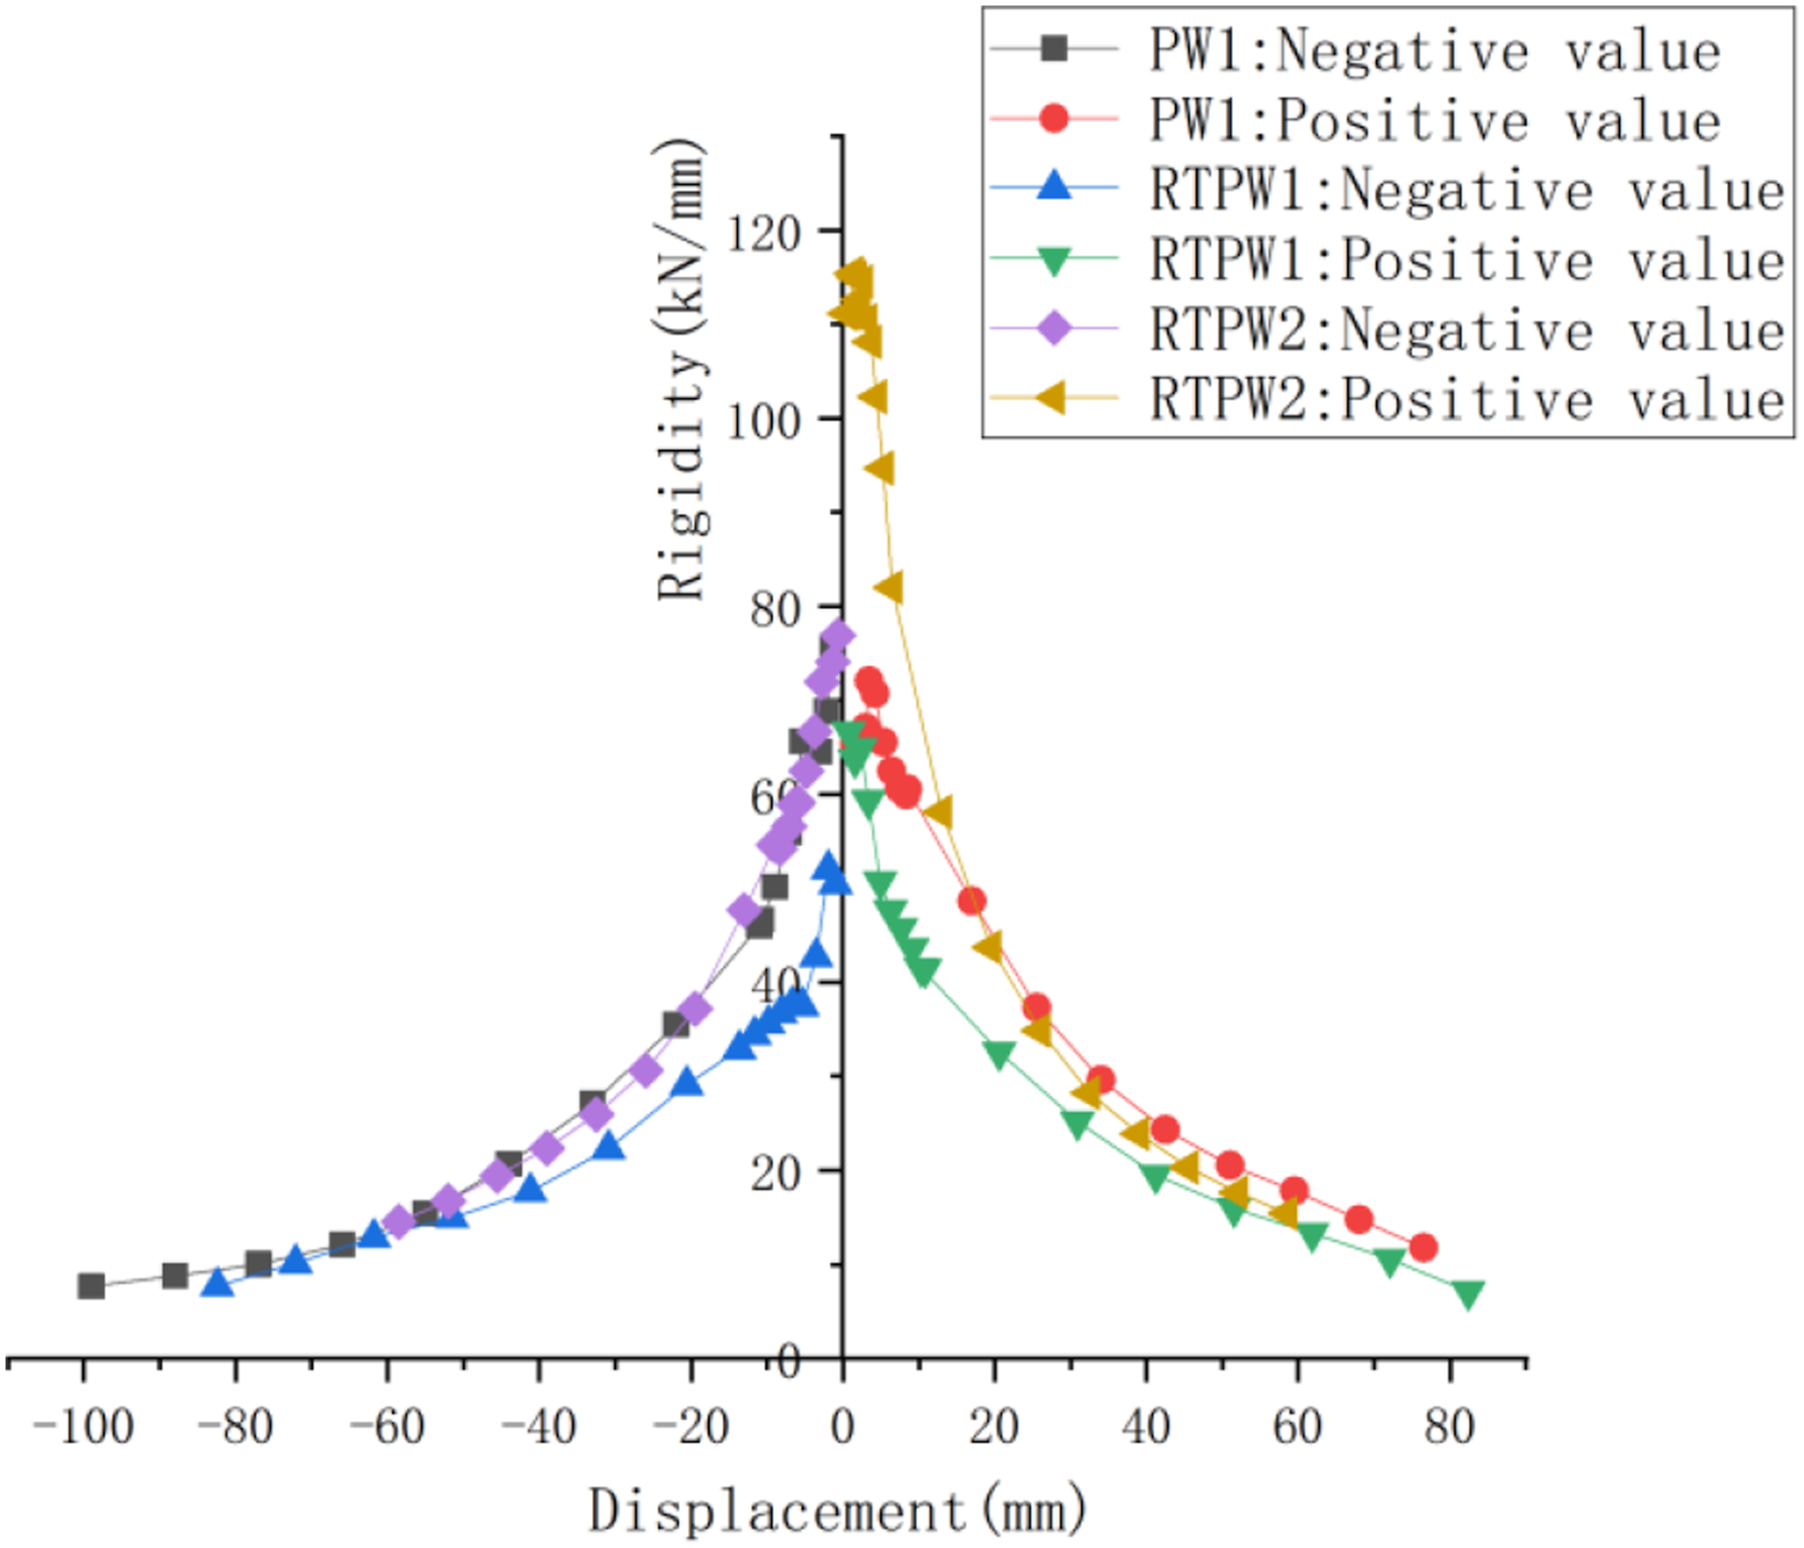
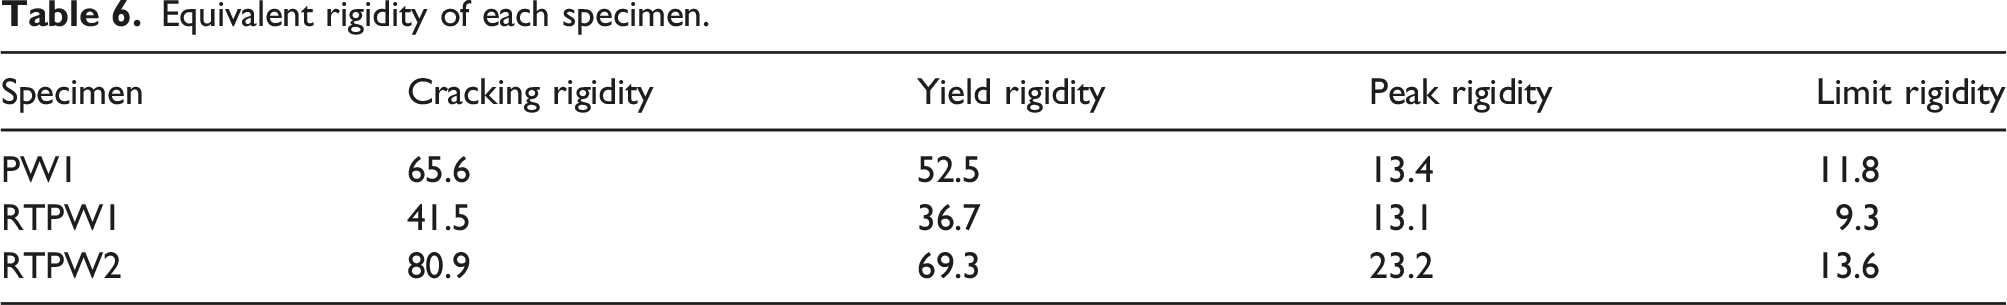
The rigidity degeneration curves of specimens according to the test results are shown in Figure 18. The equivalent rigidity of each feature point is shown in Table 6. 1) At the beginning of the test, the initial equivalent rigidity of RTPW2 were larger than those of RTPW1, indicating that the rigidity of the specimen with high axial compression ratio is significantly higher than that with low axial compression ratio. 2) The rigidity of specimens declined with the increasing of displacement, and the rate of rigidity degradation also declined. After the displacement reached to a certain value large enough, the curves of the three specimens tended to coincide and the difference of rigidity value was low. 3) The rigidity of RTPW2 were higher than those of PW1. It indicates that the reinforced tenon set at the joint interface of the shear wall can effectively improve the rigidity of the component. 4) The positive loading rigidity of three specimens were higher than the negative loading rigidity. The main reason is that the positive load is push, acting directly on the specimen, and the displacement error is small, while the negative load is pull, and the negative tensile load needs to be transmitted to the specimen through steel bolts, of which the deformation increases the horizontal displacement error. Rigidity degeneration curves. Equivalent rigidity of each specimen.
Conclusion
The following conclusions can be obtained according to the low cyclic reversed loading test results of the three specimens: 1) The failure modes of the three specimens were the same, which was compression-bending failure. 2) There was no large horizontal slip in the RTPW1 and RTPW2. This shows that the reinforced tenon joint can effectively restrain the horizontal slip and reduce the dowel shear effect of the steel bars. 3) The hysteresis loop is bow-shaped, and there is “pinching” phenomenon. 4) Three specimens have good ductility, and the ductility factors are greater than 5.0. The RTPW2 with smaller axial compression ratio have better ductility. 5) The energy dissipation capacity of the RTPW is significantly better than that of the common precast shear wall, indicating that the reinforced tenon is beneficial to improve the energy dissipation capacity of the shear wall. 6) Reinforced tenon has little effect on bearing capacity of shear wall. 7) Under the action of larger axial compression, the strain value of the longitudinal connected steel bars in edge position of the RTPW change more rapidly. 8) The rigidity of the component can be effectively improved by the reinforced tenon, and the rigidity of the RTPW with high axial compression ratio is significantly higher than that with low axial compression ratio.
Footnotes
Declaration of conflicting interests
The author(s) declared no potential conflicts of interest with respect to the research, authorship, and/or publication of this article.
Funding
The author(s) disclosed receipt of the following financial support for the research, authorship, and/or publication of this article: This work was supported by the General Project of Natural Science Foundation of Jiangsu Universities (2016TM045J) and National Natural Foundation of China (51708260).