
Abstract
In concrete box girders, the amount and distribution of reinforcements in the webs have to be estimated considering the local effects due to eccentric external loads and cross-sectional distortion and not only the global effect due to the resultant forces of a longitudinal analysis: shear, torsion and bending. This work presents an analytical model that allows designers to take into account the interaction of all these effects, global and local, for the determination of the reinforcements. The model is based on the theory of stress fields and it has been compared to a 3D finite element analysis, in order to validate the interaction domains. The results show how the proposed analytical model allows an easy and reliable reinforcement evaluation, in agreement with a more refined 3D analysis but with a reduced computational burden.
Keywords
Introduction
The cross section of prestressed concrete box bridges presents a complex stress state in which, additional stresses that arise in a thin walled section are combined to the longitudinal stresses of shear, axial force, bending moment and primary torsion. The consequences of secondary torsion (warping due to non-uniform torsion) and of cross section distortion due to the transverse eccentric loads, substantially modify the stress state obtained by the Saint-Venant theory. In addition, the transverse bending due to the frame-effect of box cross section and to the distortion itself, imply the contribution of web and slab stiffness to the global strength and to the overall mechanical behavior. This implies that the designer has to consider all these effects for the evaluation of reinforcement demand in the transverse direction and the immediate consequence is the growing importance of analysis methods, which take into account the restrained warping stresses of torsion and distortion together with the transverse forces due to the in-plane deformation (Murín et al., 2014; Park et al., 2005; Sapountzakis et al., 2015). The presence of such efforts leads to a strong interaction, especially in the box webs, where the reinforcements are to be considered at the same time as “stirrups” of the beam engaged by shear and torsion (tangential stress) and as longitudinal bars of the web, due to transverse bending (axial stresses in the transverse direction). Neglecting this interaction can lead to underestimates the stress state (Soto et al., 2020) and to a bad design of reinforcement with dangers of cracking in webs or in the joints between webs and overhangs, as underlined by some authors (Podolny, 1985).
The box webs are the main site of this strong interaction, and the determination of transverse and longitudinal reinforcements cannot be done without considering this evidence. In the classical interaction problem, internal forces act on the same plane (Granata and Recupero, 2015; Marí et al., 2014), while in the interaction between longitudinal shear and transverse bending moment, the two stress resultants act on different planes. The most known method in the literature for evaluating web reinforcement has been presented by Menn (1990) and earlier by Leonhardt (1964) in a previous form of linear superposition; with this method the designer computed firstly the reinforcement for bending, shear and torsion from the longitudinal analysis (called “global effect”) and afterwards from the transverse model of cross section the reinforcements for the frame effect and distortion were added to the previous ones (“local effect”). The classical way to determine the quantity of reinforcement was then based on a linear superposition of two different effects, without any interaction.
Successively Mancini et al. (1997) presented an analytical model of interaction, which is based on the theory of stress fields (Bach et al., 1978). In this last model, due to the assessment of the stress state, the web has been considered an element such as a plate-slab (sandwich model). Through the application of the static theorem of plasticity, interaction domains can be plotted and the number of transverse and longitudinal reinforcements can be determined at the Ultimate Limit State (ULS). The model introduced by Mancini et al. (1997) does not take into account, explicitly, the presence of prestressing and the limitations on the inclination of the stress fields, introduced by the national and international codes like Eurocode 2 (European Committee for Standardization [CEN], 2004). The authors already modified that analytical model taking into account such limitations (Recupero et al., 2017), specifying the contribution of prestressing and the consequent modification of the interaction domains, as pointed out recently by other authors (Cladera et al., 2016). Prestressing modifies the domains for two reasons:
— the effect of axial force induced by prestressing and the consequent change in the inclination of principal stress in concrete (or inclination of the first crack, that is the same);
— the effect of tendons inclination which introduces a vertical component of prestressing, generally opposed to the shear induced by applied loads, or the equivalent effect of variable height of cross section (Arici and Granata, 2013).
Both effects are taken into account in the proposed model of interaction.
In this study the analytical method developed by the authors and the related interaction domains are compared to a shell-type 3D finite element analyses, in order to supply a numerical validation of the modified interaction model here proposed and the related domains. The numerical validation is important to establish the reliability of the proposed method, which has a minor computational burden with respect to complex 3D finite element models, especially for complex box bridge girders with many spans of different length.
Subsequently, the evaluation of the shear-transverse bending interaction and of the related web reinforcements is made here through two different options to be compared:
(1) a completely analytical method which, after a generalized beam-type analysis with a thin-walled section, uses the proposed simplified slab-plate (sandwich) model and the interaction domains plotted on the base of such a model for determining the web reinforcement;
(2) a numerical method based on a 3D finite element analysis for the determination of internal forces and the resulting stresses, followed by a complete sandwich model for the determination of the web reinforcements as provided for fib Model Code 2010 (International Federation for Structural Concrete (fib), 2012) and already implemented in a subroutine of the FE software.
The two options are compared and the approximation degree obtained by applying the analytical method with respect to the numerical one is determined, showing the good agreement and the advantage of an easier determination of reinforcements through the analytical method and the interaction domains, which avoids the need of complex and onerous numerical analyses from a computational point of view.
The analytical model and the interaction domains
The analytical model of longitudinal shear-transverse bending interaction is based on the theory of stress fields in the slab-plate elements that was originally proposed by Marti (1990), Marti and Meyboom (1992) and successively developed for the webs of concrete box sections by Mancini et al. (1997).
In the formulation presented here, the model is extended to prestressed girders. In the model, a slab-plate is considered as a sandwich panel divided into three layers: two exteriors where the reinforcements are concentrated and the interior one that contains the intermediate layer of concrete, with the role of facing the stresses induced by the transverse shear. This last contribution is neglected by the limited entity of the transverse shear forces that these elements generally request, assuming that the shear-friction mechanism between the layers of the slab is sufficient. The thickness of the two outer layers has to be determined by the theory of plasticity, applying the static theorem. If we consider a box element that has a thickness Δy along the core and an extension Δx in the longitudinal direction of the beam (Figure 1(a)), we can consider the forces per unit width, that is to say: the transverse bending moment m* x = m/Δx and the longitudinal shear v* xy = Vxy/Δy, where Vxy is the total shear force acting to the web element per unit length (Figure 1(b)). Actually the value of longitudinal shear can take into account all the tangential stresses resulting from shear, primary and secondary torsion and distortion of the box through the relation Vxy = τ xy · bw · Δy where τ xy is the resulting tangential stress and bw the web thickness in the segment of length Δy.
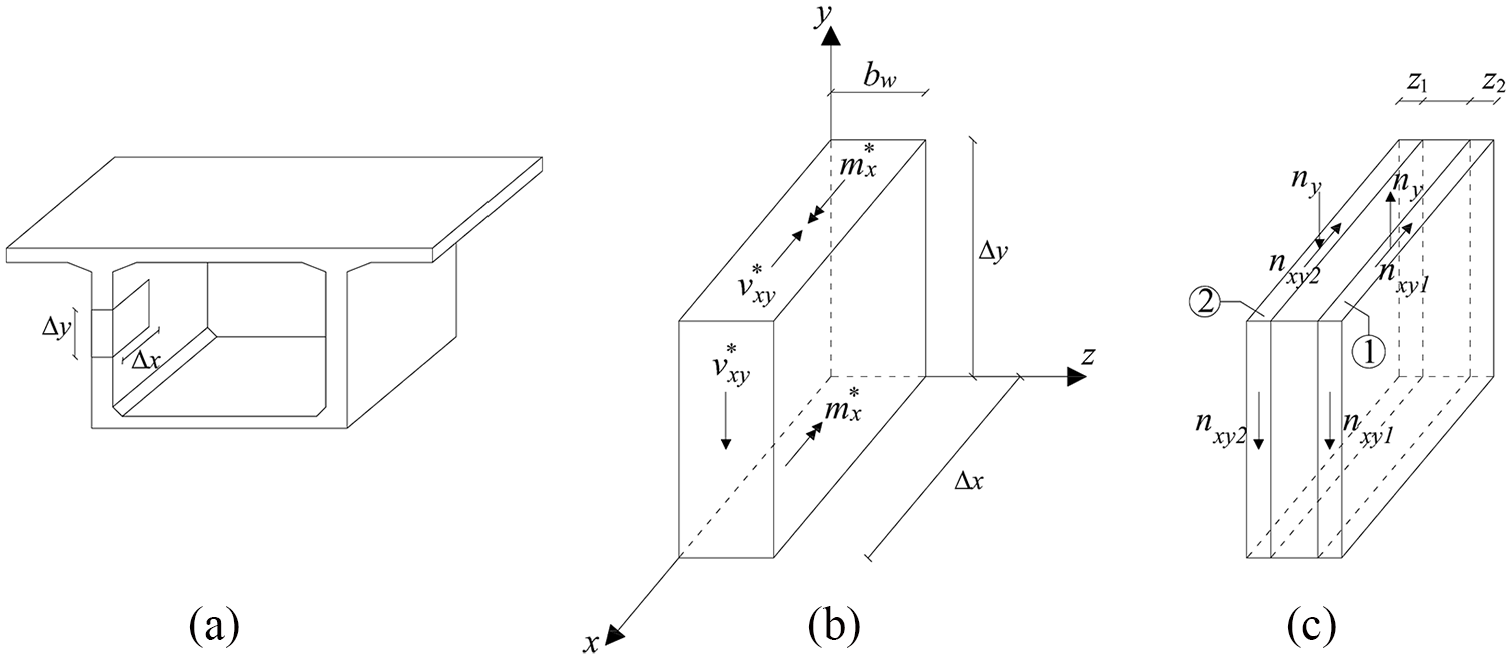
Simplified sandwich model: (a) web element of box section, (b) internal forces in the web element, and (c) sandwich model of the web element.
In Figure 1(c) the distribution of internal force components in the web segment is shown, decomposing them into the in-plane and out-of-plane stress resultants of every layer (nxy1, nxy2, ny), obtained by imposing the equilibrium conditions:
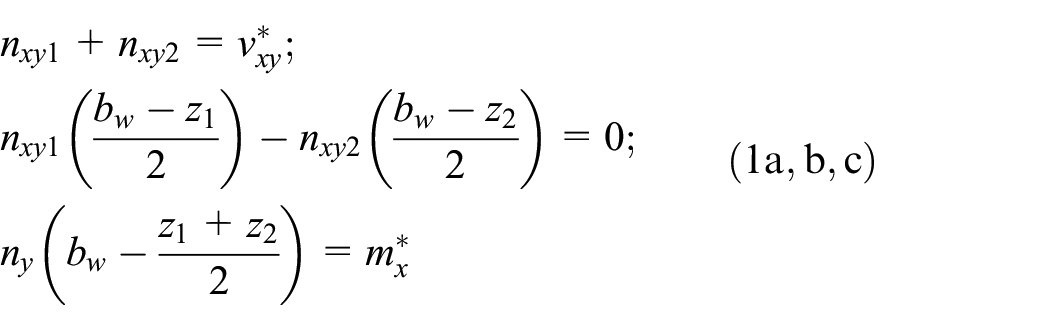
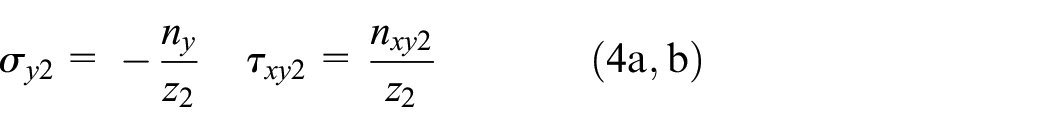
where z1 and z2 are the sandwich layer thicknesses, which are unknowns a-priori; the value of forces is a function of z1 and z2:
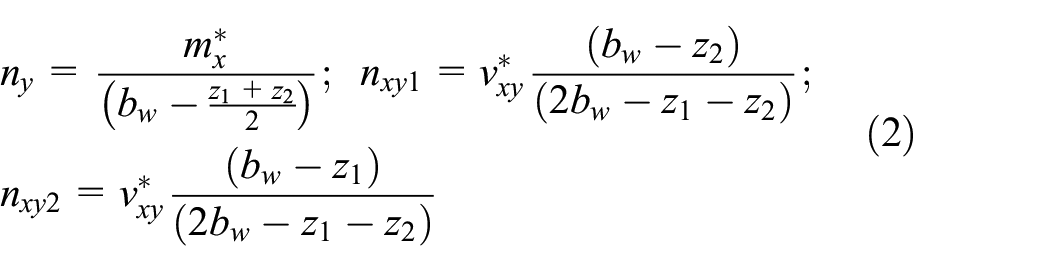
and consequently the value of axial and tangential stresses are known in each layer of the sandwich panel, once z1 and z2 are determined:
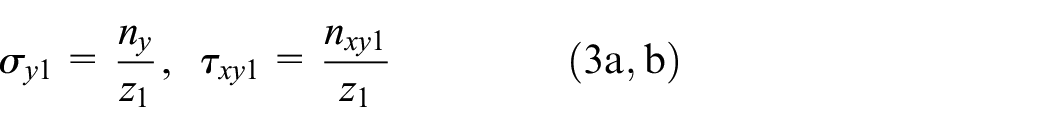
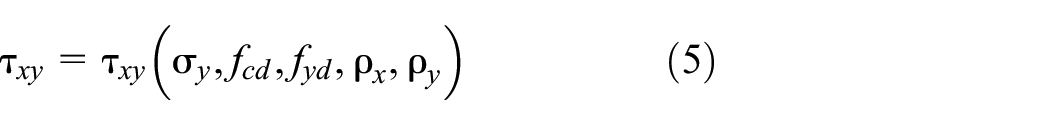
The evaluation of the strength capacity for each layer depends on the knowledge of the functional link between axial and tangential stresses σ and τ, which depends on the design strength of materials fcd of concrete and fyd of mild steel and on the geometric percentage of reinforcements in the two directions x and y (ρ x , ρ y ). The aim of the model is to calculate the interaction function:
This function can be known through the equilibrium conditions of the two layers, making two cuts of unitary length in the directions perpendicular and parallel to the stress field of compressed concrete.
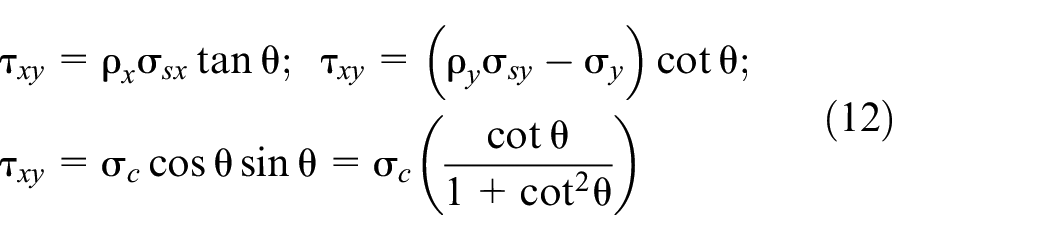
Focusing on one layer and considering the compressive stress field σ c , the two equilibrium equations for the layer cut in the direction of compressed concrete (which is considered inclined of θ angle with respect to the longitudinal axis x) are:


Where σ sx and σ sy are the component of stress in mild steel along x and y. The equilibrium equations for the layer cut in the perpendicular direction to the compressed concrete stress field are instead:


By substituting equation (6) into equation (8), the relation
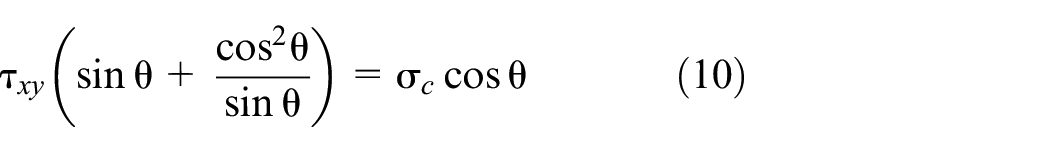
is obtained, which can be expressed in the following form, through simple mathematical passages:
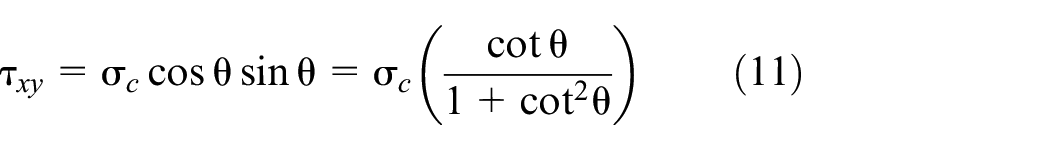
The same equation is obtained if expression (7) is substituted into equation (9). In this way, a set of three equilibrium equations is obtained in which the axial and tangential stress components are in relationship one to each other:
By introducing the strength limit conditions
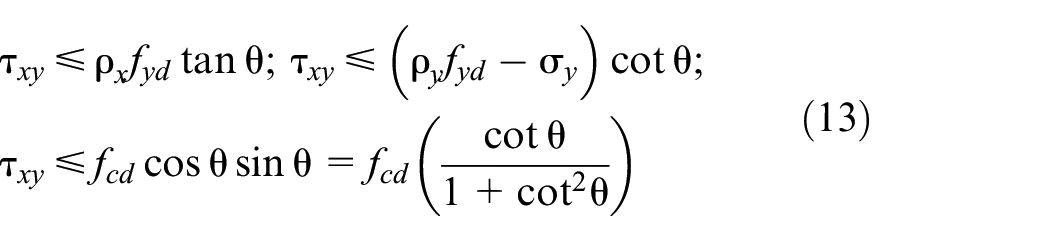
The interaction model is defined by this group of three equilibrium equations for each layer of the sandwich. This means that the tangential stress τ xy is limited by three conditions that depend on the concrete strength and on the elastic limit of the steel reinforcement in both directions. The contemporaneous satisfaction of the three conditions allows to define the interaction problem and to plot the related domains, which for convenience can refer to the dimensionless values of the longitudinal shear and the transverse bending moment:
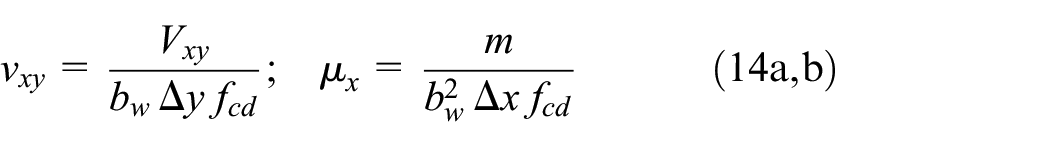
Using the mechanical amounts of transverse reinforcement ω y as variables of the problem together with the relationship between the reinforcements present in the two outer layers, we have:
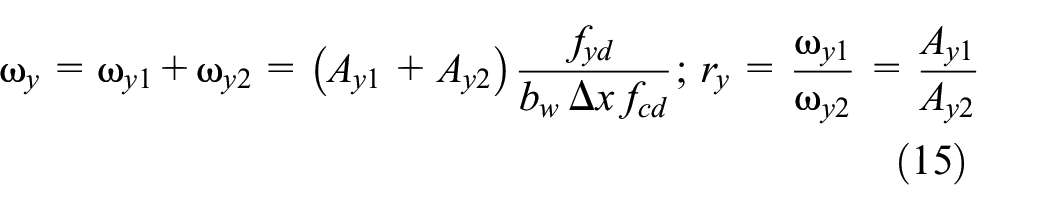
where Ay1 and Ay2 are the transverse reinforcement per unit length in the two layers while ωy1 and ωy2 the mechanical percentages of reinforcement in the two layers and ry the ratio between the reinforcements set in the two layers of web segment.
The minimum value of reinforcement percentage that meets the equilibrium relations must be discovered with a large number of tentative values and, by using a numerical optimization method, it is possible to find the 3D surfaces defined by these points expressing the minimum reinforcement condition. Hence each value ω y of the minimum reinforcement in the transverse direction corresponds to a point on the surface ω y = ω y (µ x , vxy). The sections of this surface with planes at constant reinforcement value (ω y = constant), represent the diagrams of interaction (domains) between transverse bending moment and longitudinal shear. Figure 2(a) shows the function of interaction with ry = 1 (equal amount of reinforcement in the two layers of the web) while Figure 2(b) shows a diagram in which all the resulting curves are plotted along the intersection of the surface with the plans with constant reinforcement value ω y (Recupero et al., 2017).
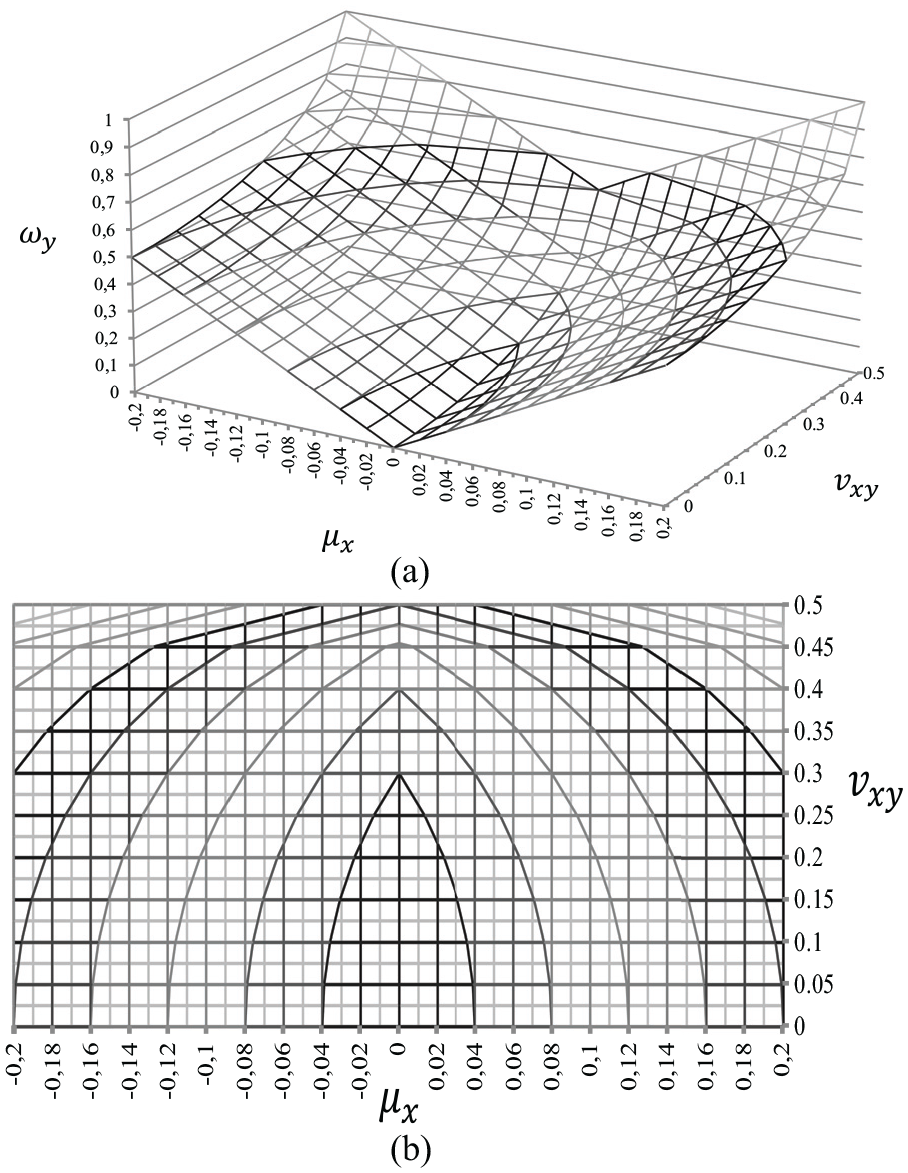
Plot of interaction diagrams: (a) interaction surface, (b) interaction domains (ω y = const; Δω y = 0.1).
After having plotted the interaction diagrams for the transverse reinforcements, by the values of the inclination angle of the stress field in the compressed concrete and by the two outer layers of the sandwich θ1 and θ2, corresponding to the solution of a couple (m,v), it is also possible to determine the longitudinal reinforcement, keeping the relation rx = 1 between the two layers fixed (for simplicity):
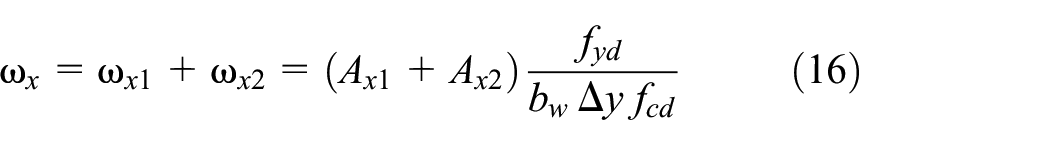
where Ax1 and Ax2 are the longitudinal reinforcements of the two layers while ωx1 and ωx2 the corresponding mechanical ratios. The surface obtained, however, is independent of the transverse moment and varies with ω x . Then, it is possible to plot a diagram of the longitudinal reinforcements by the function vxy = vxy (ω x ), as depicted in Figure 3.
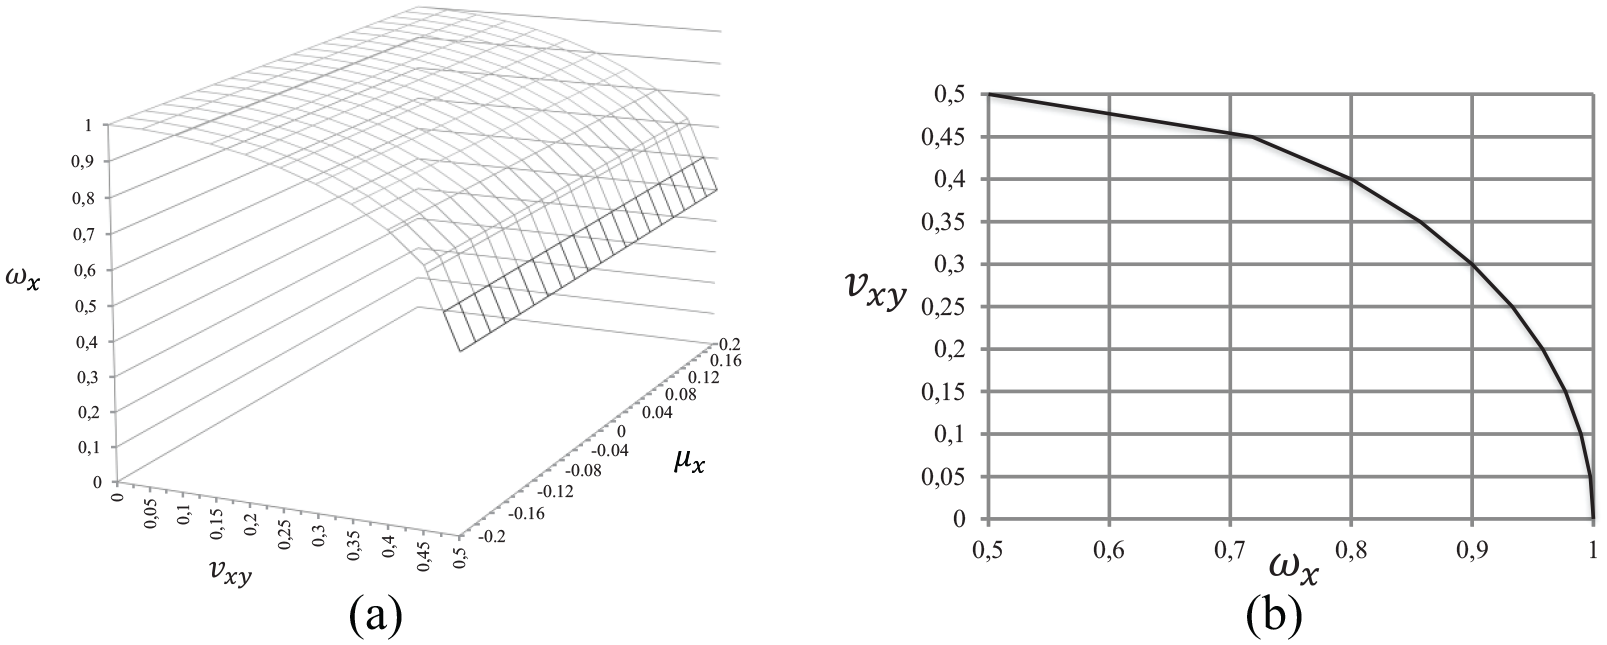
Diagram for the longitudinal reinforcement ω x : (a) 3D surface, and (b) domain (section of 3D surface being µ x = constant).
The value of the angle θ of the stress field inclination of the compressed concrete has a fundamental influence, both for the evaluation of the transverse reinforcements and for the longitudinal ones. The upper limit of cot θ in equation (13) is produced by the angle of the stress field in the concrete related to the first crack, generally considered coincident with the inclination of the stress field in the hypothesis of neglecting the contribute of concrete in tension: θI = 45°.
The inclination value that must be introduced in the model is linked to the last condition, i.e. the one at the Ultimate Limit State, or to that, following the first cracking, next to the failure condition. Therefore, the value of θ to be introduced in the limit domain is different from θI and this is considered in literature, generally, within the range (Walther & Miehlbradt, 1990):

International codes provide absolute limits of the cotθ in place of values related to the first cracking. For example, Eurocode 2 in the 1993 version (CEN, 1993) suggests the range:

whereas the latest version of Eurocode 2 (CEN, 2004, 2005) provides another range:

These values have been found imposing θI = 45° although this circumstance is not always true. In fact, in prestressed concrete structures, where the presence of axial compression stress significantly changes, the inclination of the tension fields is θI < 45°.
For this reason it seems more reasonable to use directly equation (17) rather than equations (18) or (19), replacing θI with the actual inclination value of the principal compression stress in correspondence of the first crack. In such a way the range defining the limits is modified above all with reference to the lower limit of the θ angle (or, that is the same, to the higher limit of cotθ).
In the previous paragraphs the interaction domains have been plotted leaving θ1 and θ2 as free parameters, that is, making them vary without limitations. From a physical point of view this matter implies that approximating the failure condition, the reinforcements have exceeded the elastic limit and that between the two edges of the crack an infinite strength to shear is carried out due to the grain interlocking of the aggregates. Obviously this is an unrealistic limit condition when the opening of the crack is significant while it can be realistic in the presence of low values of the angle θ (strong presence of compression).
The interaction diagrams provide a minimum reinforcement value that does not take into account the limitation of the angle θ exposed by equation (17). Then, it is necessary to modify the diagram as determined by the case of prestressed concrete structures. If equation (17) is used, the upper limit of θ is not influential (the diagram is not altered by values of θ > 45°) contrary to the lower limit that is decisive. Figure 4 shows the new diagrams for varying transverse reinforcement ωy and the corresponding new longitudinal reinforcement diagram.
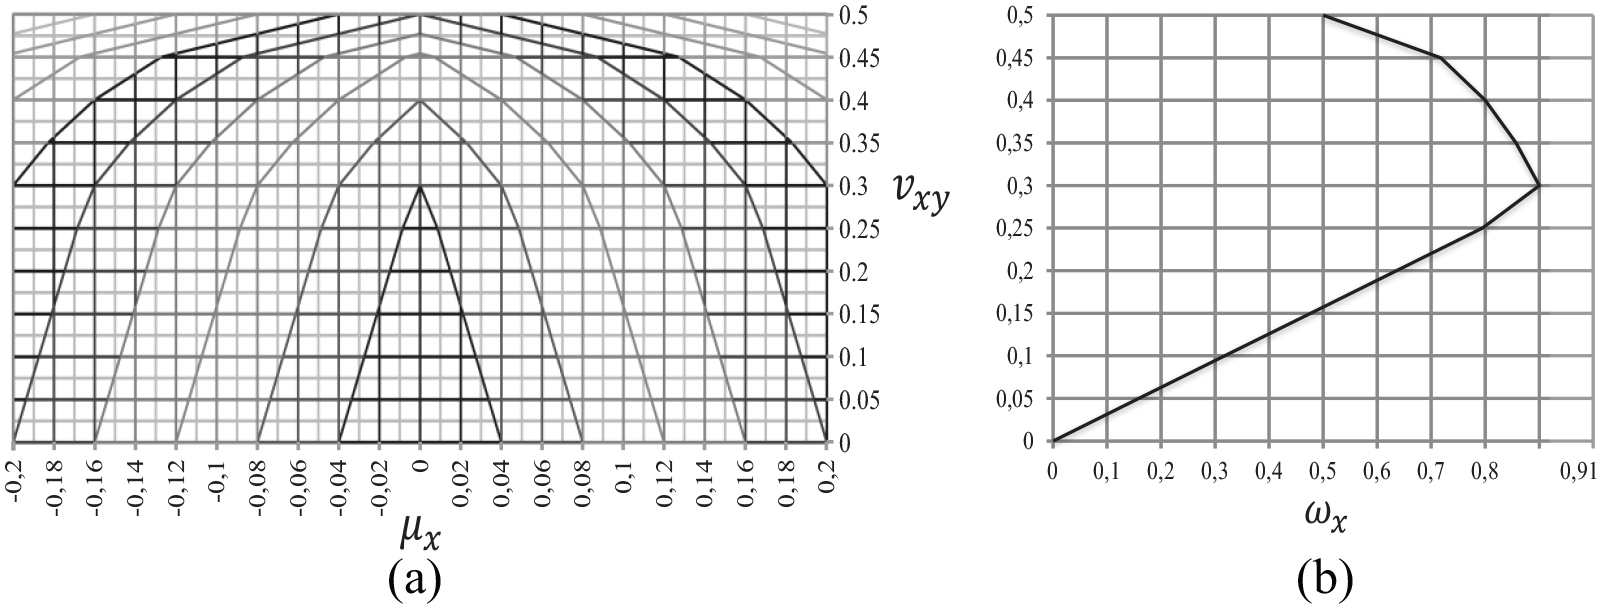
Interaction domains modified with limits of stress field inclination: (a) transverse reinforcement, and (b) longitudinal reinforcement.
Comparing Figure 4 with Figure 2, that is to say, the diagrams with and without limits of the inclination of the stress field, it is immediately noticeable that the lower part of the curves that delimit the diagrams becomes rectilinear till a common value of the dimensionless shear vxy equal to almost 0.3. This value is a function of the imposed limits and in particular of the lower limit of θ, while the upper part of the diagram remains unchanged.
Hence the domain plotted by ignoring the limits of the stress field inclination, in Figure 2(b), is always the envelope diagram of all the other diagrams plotted by imposing a lower limit of the angle θ.
The reinforcement that, in terms of longitudinal shear and transverse bending, is calculated in the presence of the imposed limits, is always greater than the one estimated without them (domain of Figure 2). From the physical point of view this circumstance corresponds to a limit imposed to the contribution of shear strength due to the interlocking effects of the aggregates and to a greater amount of reinforcement necessary to guarantee the equilibrium next to the failure condition.
The modification of the interaction domain has to be carried out for each actual case, since it depends on the angle of first cracking introduced in equation (17), imposing the value θ = θI − 20° as the lower limit of the inclination. Each domain is then specific to each individual case considered in an actual design example, that is, the actual section considered and its stress state, which defines a specific value of vxy and θ.
Figure 5 shows the diagram of the longitudinal reinforcements with different values of cotθ and the corresponding change of the diagram of the transverse reinforcements for an example case equal to vxy = 0.25, (or for cotθ = 4). In order to use the domains in engineering practice, it is enough to enter them with the pair (µ x , vxy) obtained by the design calculations, and to locate the value of ω y that satisfies the conditions of equilibrium so that such couple of stresses is always within the domain corresponding to that transverse reinforcement value. The longitudinal reinforcement of the diagram (vxy, ω x ) is found through the same value of vxy.
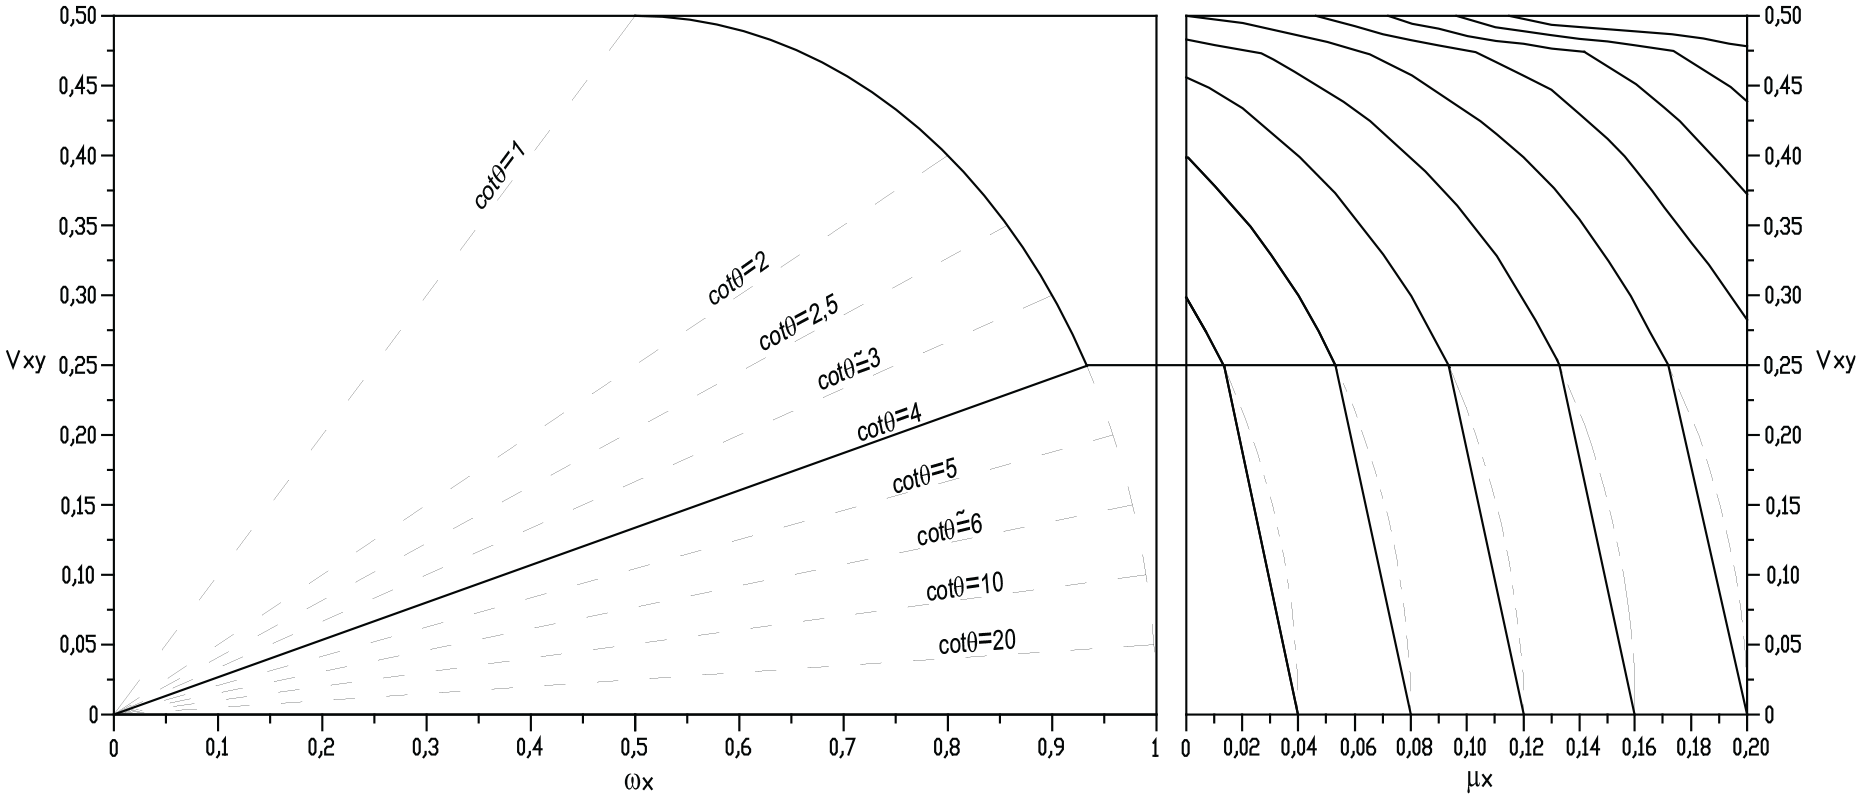
Modification of the domains by varying the inclination θ.
One of the advantages of this model is that it can be used for any type of concrete, ordinary or high strength, modifying the compression stress fcd. For high strength concrete, with a brittle behavior, it is possible to put the limit condition θ = θI, matching the failure condition with the first cracking condition, without the possibility of plastic adaptation. Another advantage of the model is that it can be applied to mono-cell and multi-cell boxes. In fact, knowing the stress state by the analysis of the girder, the tangential stress and the longitudinal stress are found for all box elements, in addition to transverse bending. In such a way the values of vxy and µ x are always defined by the analysis of the global behavior and afterwards obtained as dimensionless values valid for each web element.
Numerical validation of the analytical model through finite elements
In this section a numerical validation of the proposed model is carried out by comparing two alternative methodologies for the determination of the web reinforcements in a bridge with constant or variable box cross section. Three cases are shown: a simply supported girder 40 meters long, a continuous girder on three spans and a framed arch bridge with variable depth.
The first example is the simply supported bridge, shown in Figure 6. The two methods applied are the following:
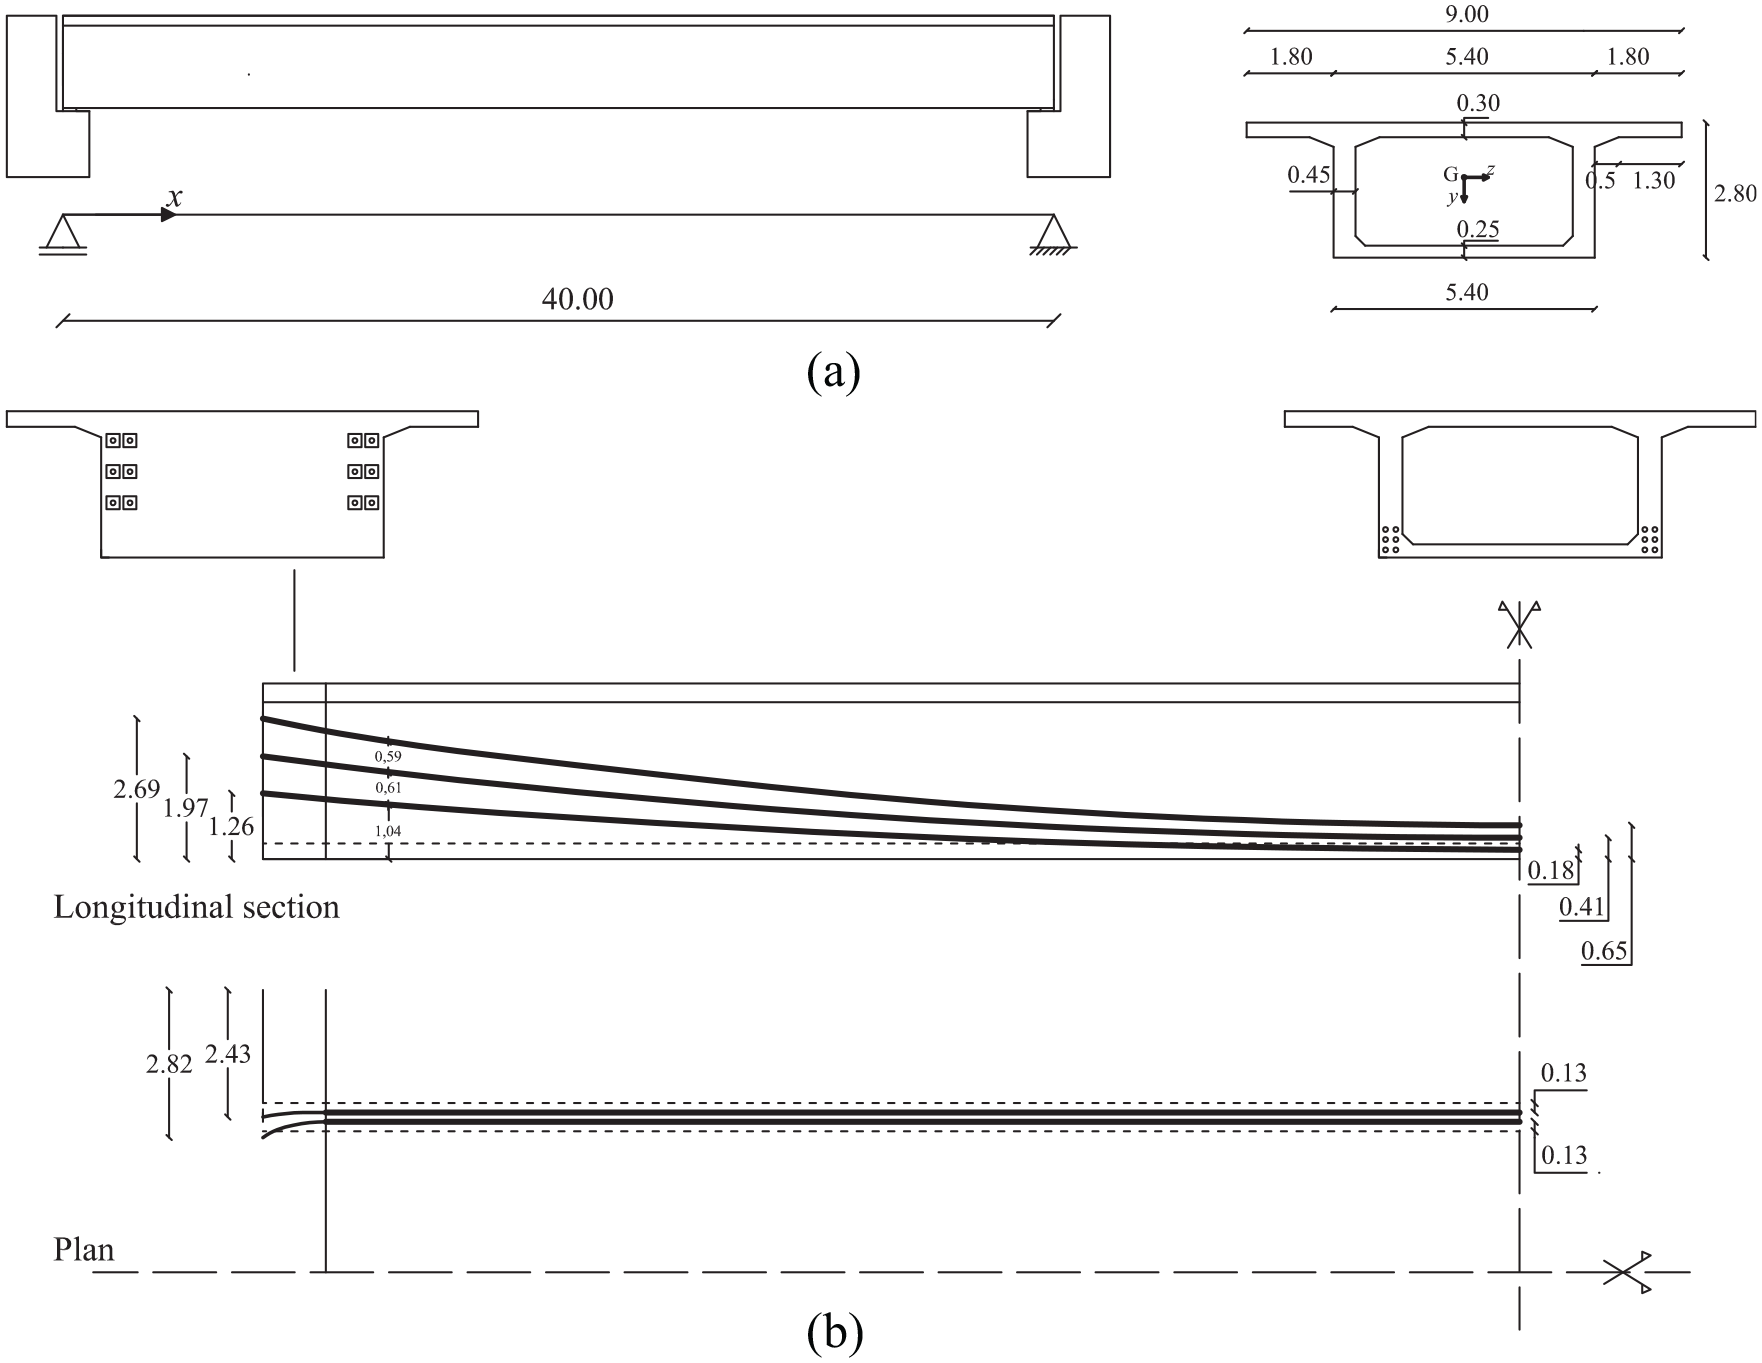
Geometry of the example beam [m]: (a) longitudinal view and cross section dimensions, and (b) plan and sections with tendons arrangement.
Numerical Method. The analysis of the beam is carried out through a finite element model with shell-type elements for the direct determination of the maximum stresses in the webs of the box in the midspan section and in the one next to the end support. This type of elements allows the determination of the axial stresses due to the transverse bending moments and even of the tangential shear and torsional stresses. For this application, the ASCad32 software has been used, which contains a sub-routine for calculating reinforcements, based on the complete sandwich method (Fanti and Mancini, 1995) later absorbed by the specifications of fib Model Code 2010 (International Federation for Structural Concrete (fib), 2012). Hence the FE analysis provides for longitudinal and transverse stress resultants and the evaluation of reinforcement is done through a subroutine which applies the sandwich method of fib Model Code.
Analytical Method. The analysis of the beam is carried out in a classical way with the typical methods of calculation for beams with thin-walled sections that take into account the warping-torsion, the warping-distortion and the frame effect of cross sections, calculating the transverse moments in the webs and deriving the corresponding stresses associated with the tangential shear and torsional stresses. Here the longitudinal and transverse analyses are carried out following the HSA (Hamiltonian Structural Analysis) method (Arici and Granata, 2016) but it is possible to carry out a classical Saint-Venant analysis adding the transverse frame effect and cross section distortion through the well-known BEF (Beam on Elastic Foundation) Analogy. The sandwich method is successively implemented in the simplified form proposed in the previous sections, using the interaction domains with stress field inclination modification (Recupero et al., 2017) and taking out the reinforcements.
The results obtained with the two methods are compared, in terms of transverse reinforcement in the webs, by verifying contextually the analytical method through the numerical method, for the determination of the stress state too.
The box has been modelled with the finite elements (Figure 7), considering the upper and bottom slabs with overhangs and the two vertical webs meshed by shell elements, using 890 triangular and isoparametric shell elements (about 22 elements per meter of girder length). The transverse diaphragms on the supports have also been considered, introducing two more slabs of 30 cm thickness. Although this modelling is more accurate than the classic one-dimensional beam model, this may involve overly costly computational requests since the degree of the mesh detail greatly influences the precision and reliability of the result. The material used in the interaction model was concrete with non-linear behavior (parabolic-rectangular simplified constitutive law).
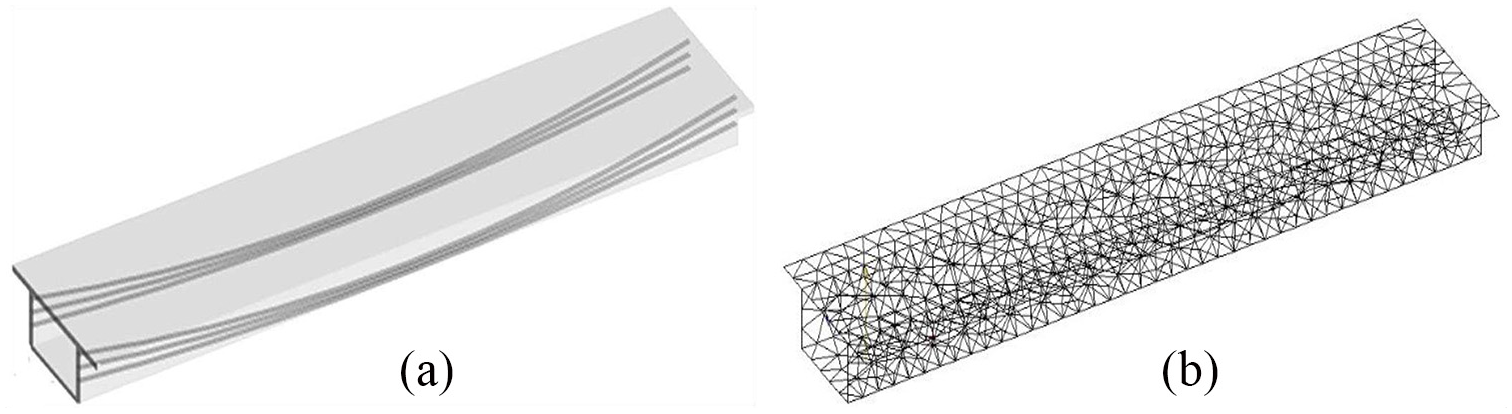
FEM model: (a) geometric shape of the bridge, and (b) FE mesh.
In order to carry out the longitudinal analysis of the structure, all the loads acting on the bridge deck have been defined (Figure 8). In addition to the structural dead load G1, the non-structural permanent dead load G2 (1.8 KN/m2) has been applied. The traffic (moving) loads are those defined by the load schemes of the Eurocode 1 (CEN, 2003).
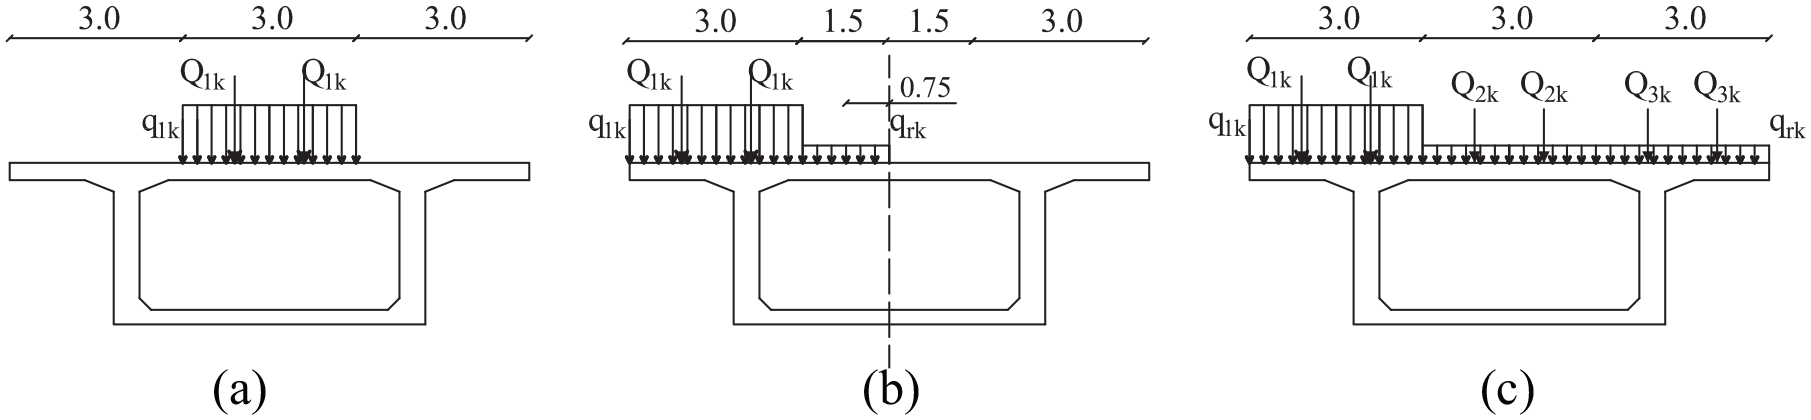
Moving load schemes on the deck for transverse worst effect determination: (a) centered load scheme, (b) eccentric load scheme, and (c) load scheme for max bending and shear.
The arrangement of the loads and the number of occupied lanes are the ones that determine the most unfavorable conditions for the section considered. In particular, the following transverse loading schemes have been considered:
a—Centered load scheme: only the load of lane 1 placed at the center is considered. This loading scheme does not induce distortion effects in the section but produces the maximum transverse bending moment in the webs due to the frame effect and the associated longitudinal shear.
b—Eccentric load scheme: the traffic loads are placed in such a way to maximize the torsional effect. Such loading scheme produces the maximum transverse bending moments in the webs due to distortion, the associated longitudinal shear and the transverse moments due to the frame behavior of cross section.
c—Load scheme for the evaluation of the maximum longitudinal shear. Traffic loads are applied to all lanes. Such loading scheme produces the maximum longitudinal shear, a twisting moment on the box and transverse bending moments caused by the frame behavior of the section. In addition, due to the non-zero twisting moment, there are transverse moments (although not the maxima) induced by cross section distortion. The maximum longitudinal bending moment is also achieved.
Naturally, the cross-sectional arrangements of the load have to be associated with the longitudinal arrangement on the lanes along the beam, considering the theory of moving loads and, therefore, the influence lines for the sections under examination:
— midspan section (x = 20 m);
— section next to the support, identified with the abscissa x = 4 m.
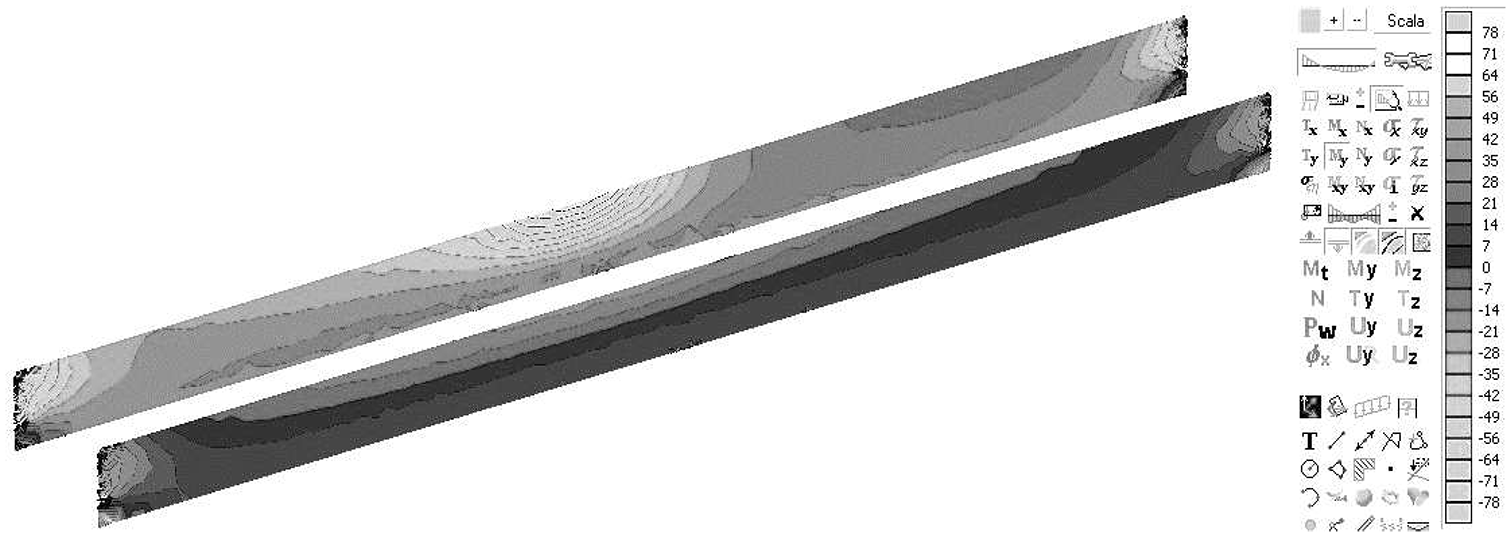
The support section, x = 0 m, has not been considered, since it presents the rigid diaphragm, therefore it has different geometrical characteristics with respect to the current section. In addition, the deck zone next to the support has been disregarded since, due to the presence of the restraint, of the tandem concentrated load system and of the box internal diaphragm, this section is actually within a “D-region,” where the postulate of Saint-Venant is not valid. In the cases analysed, this effect goes off on the abscissa x = 4 meters. D-regions can be seen in Figure 9 near supports, from the results of FE model: there the distribution of stresses changes significantly, far away from the one of Saint-Venant theory.
Numerical method. Transverse bending moments in the webs due to the eccentric loading scheme.
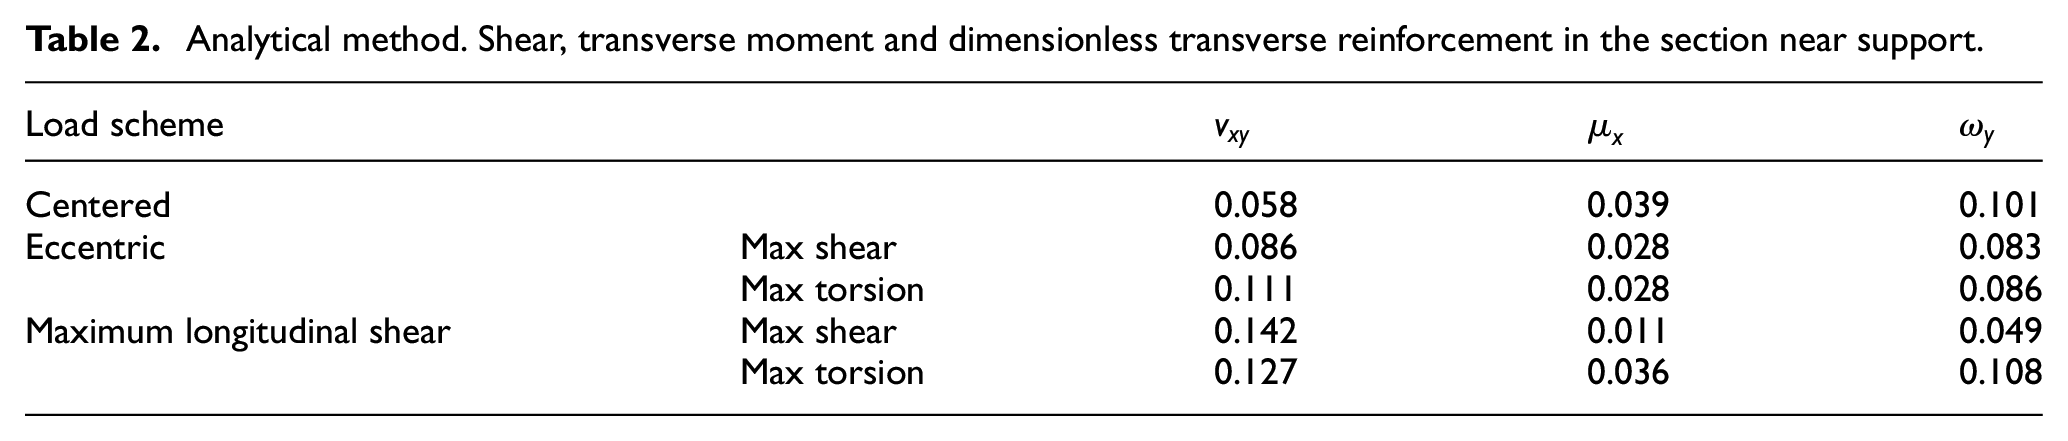
The maximum values of transverse bending moment are achieved in the fiber of the joint between the web and the upper slab. The interaction diagrams used for the calculation of the web reinforcements with the analytical method and the tables with the longitudinal shear and transverse moment values for the different load cases, together with the corresponding transverse reinforcement percentages, are shown in Figure 10 and table 1 for midspan section and in Figure 11 and table 2 for the section near support.
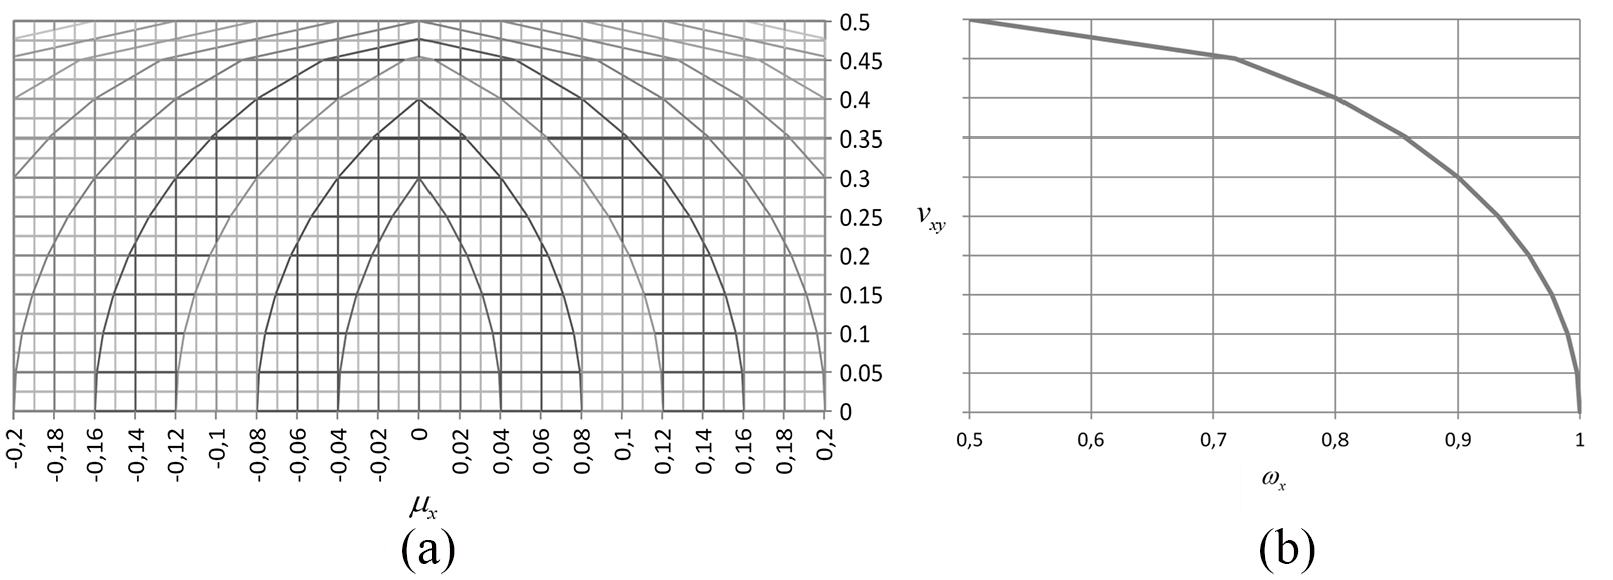
Analytical method. Interaction domains used for the midspan section: (a) transverse reinforcement, and (b) longitudinal reinforcement.
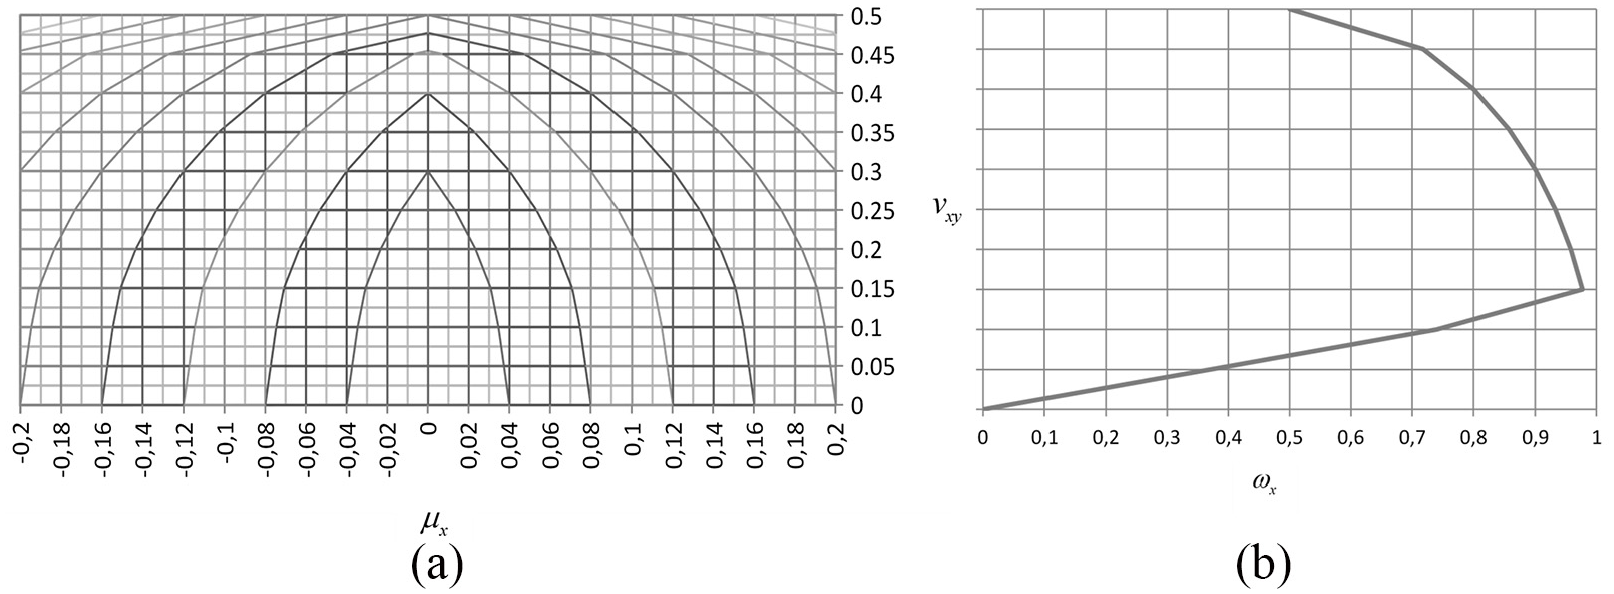
Analytical method. Interaction domains used for the section near support: (a) transverse reinforcement, and (b) longitudinal reinforcement.
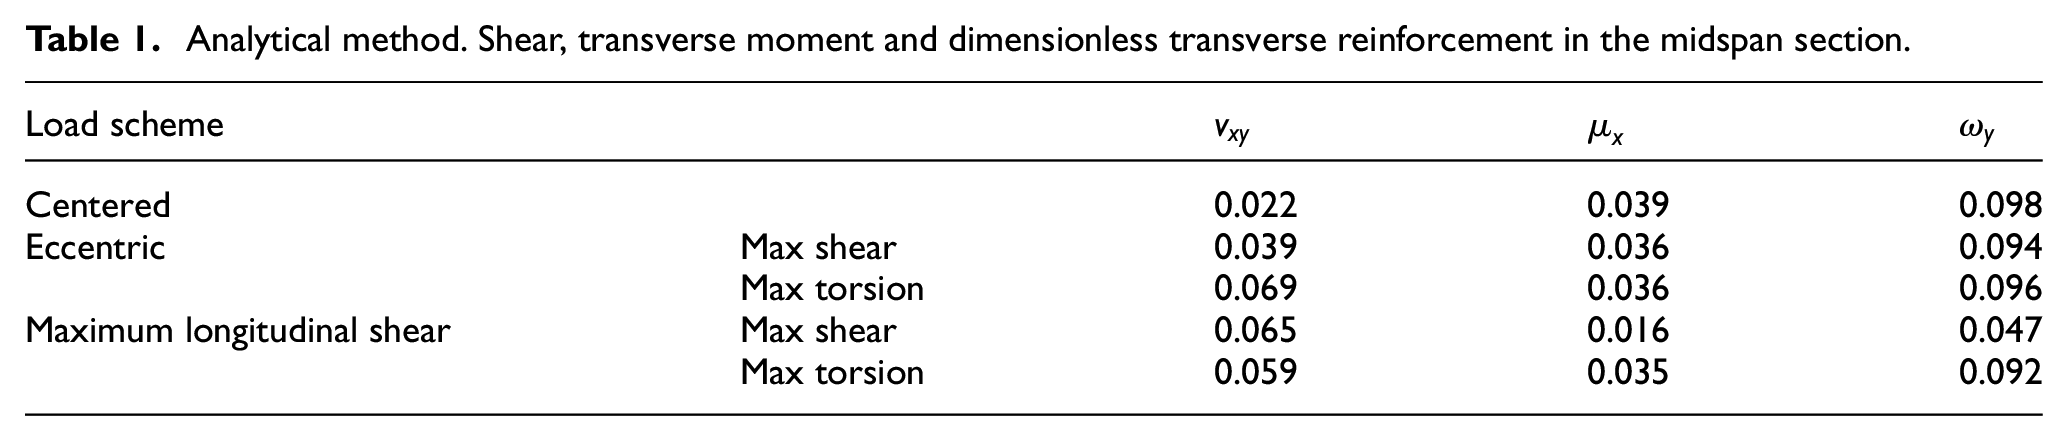
Analytical method. Shear, transverse moment and dimensionless transverse reinforcement in the midspan section.
Analytical method. Shear, transverse moment and dimensionless transverse reinforcement in the section near support.
The results obtained in terms of reinforcement with the analytical method have been compared with those obtained by the automatic application of the generalized sandwich model inserted in a subroutine of the numerical code and applied to the stresses obtained by the finite element analysis. The comparison is reproduced in Figure 12.
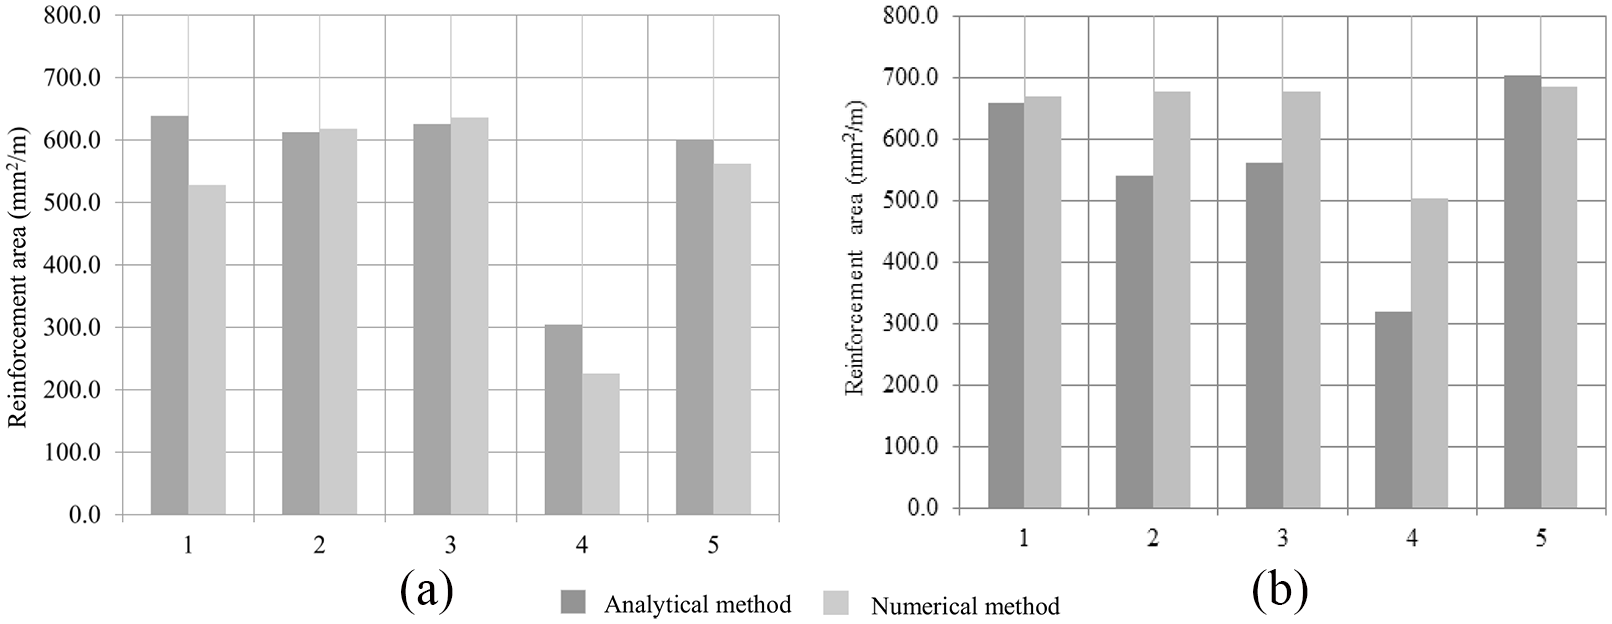
Comparison of the transverse reinforcements evaluated with the two methods by the five loading schemes applied to the example bridge: (a) midspan section, and (b) section near support.
From the comparison a substantial agreement between the two models is deduced, with quantitative reinforcement results very similar between them. The midspan section presents more satisfactory results than the support section which is instead conditioned by the presence of the D-region. Table 3 shows the numerical differences of reinforcement, found with the two methods.
Comparison between the two methods.
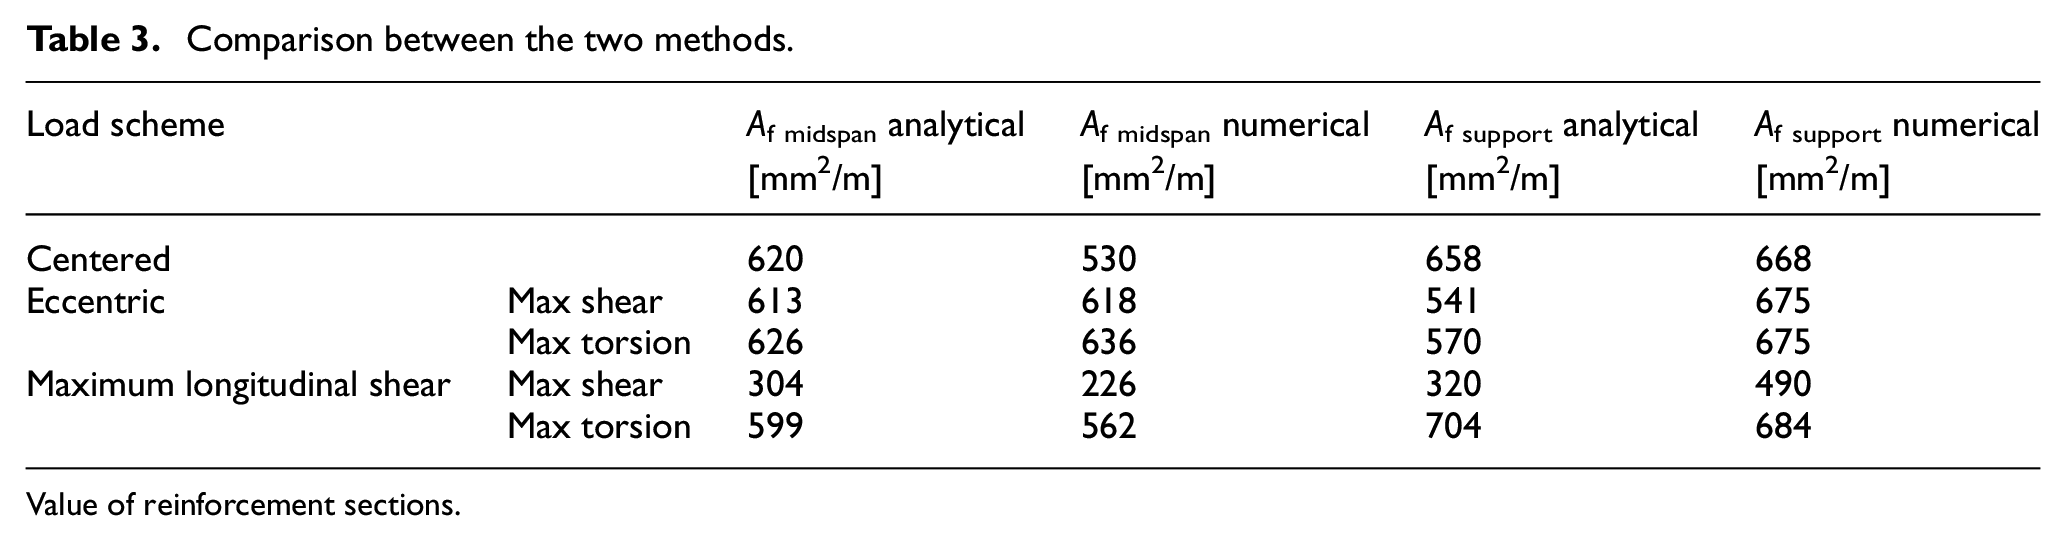
Value of reinforcement sections.
The second example is a bridge with the same box section but with a different longitudinal scheme: three spans of a continuous beam on supports with max span length of 50 m. This case is considered here for confirming the validation of the results obtained in the previous case with the analytical method, through the 3D FEM analysis of a longer bridge. Figure 13 shows the scheme and the FE model with the mesh of this case composed of more than 2250 shell elements.
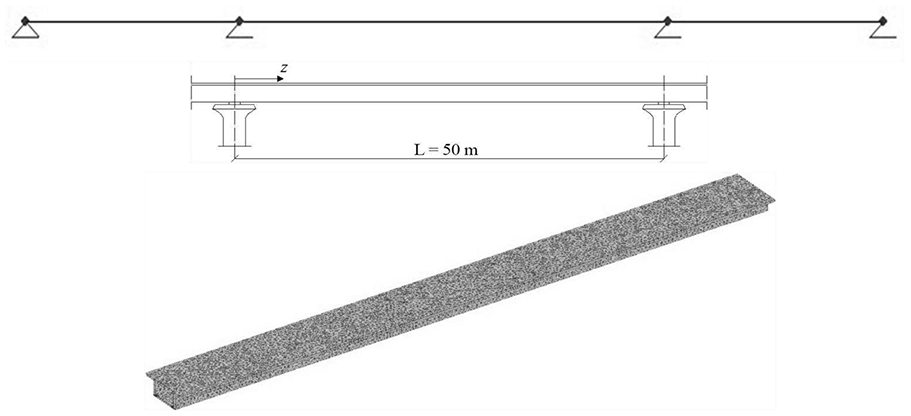
Geometry of the continuous girder and FEM model with the mesh used.
For the sake of simplicity in this case only the traffic load scheme giving the maximum longitudinal shear was considered, maximizing the tangential stress in the two control sections: midspan and internal support sections (Figure 14). Table 4 shows the values found by the analytical method for this case.
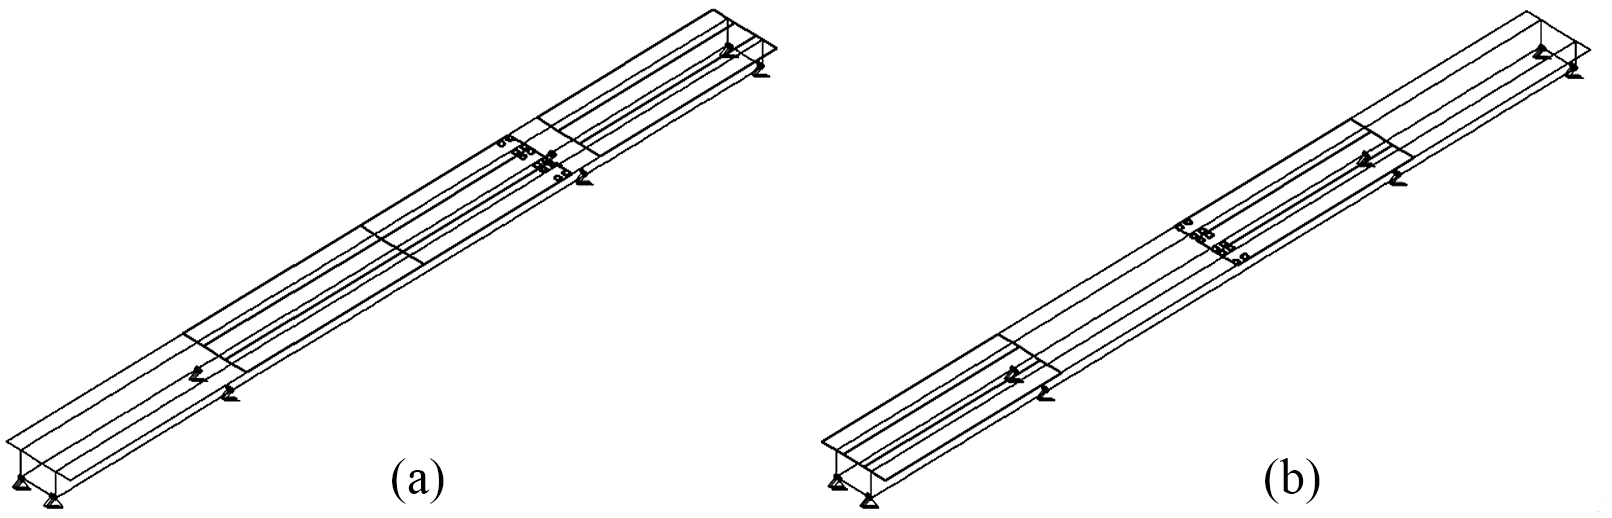
Tracking of traffic loads: (a) max shear in support section, and (b) max shear in midspan section.
Analytical method.
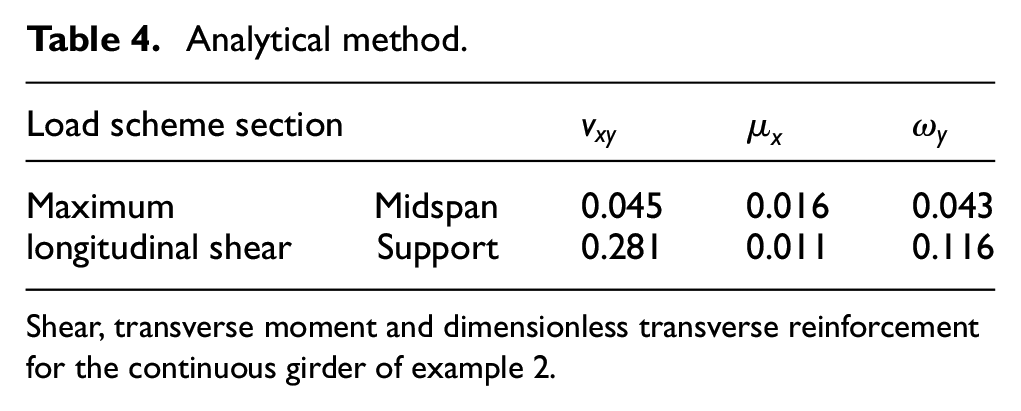
Shear, transverse moment and dimensionless transverse reinforcement for the continuous girder of example 2.
The comparison between analytical and numerical methods for the case of the continuous beam is reported in Figure 15 and Table 5.
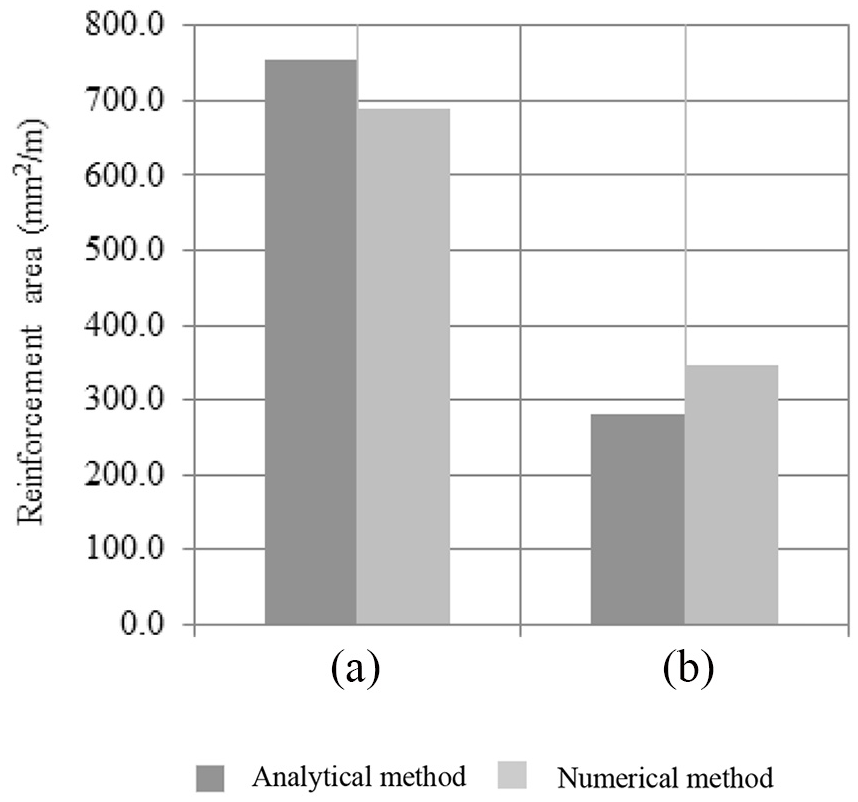
Comparison of the transverse reinforcements evaluated with the two methods for the example bridge with the continuous girder: (a) support section, and (b) midspan section.
Comparison between the two methods.
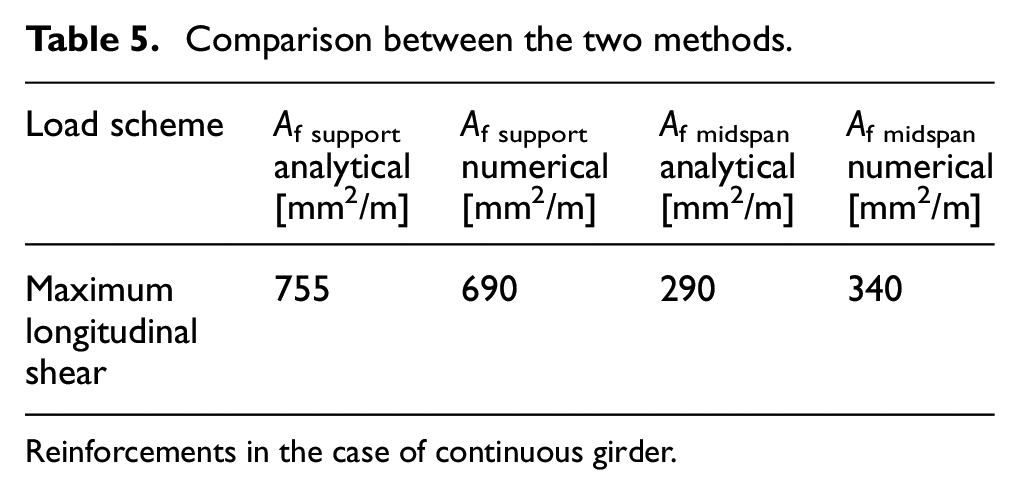
Reinforcements in the case of continuous girder.
From the result it is evident that the scheme giving the maximum longitudinal shear is the one which gives the maximum percentage of differences between reinforcements found through the two methods. This is due to the ratio between tangential and axial stresses and to the influence of stress field inclination. There is not a method which gives conservative results in all cases, but the analytical method supplies reliable results in terms of transverse and longitudinal reinforcements, also in the case of continuous girder on multiple supports.
The third example is a framed arch with inclined piers (Granata and Arici, 2013). The central span is 122 meters long between the arch footings, while it is 98 m long between the connections of deck and piers. Side spans have a limited length of 16 meters each (Figure 16). It is built by cantilevering with counterbalances at the ends for the limited length of side spans respect to the central one.
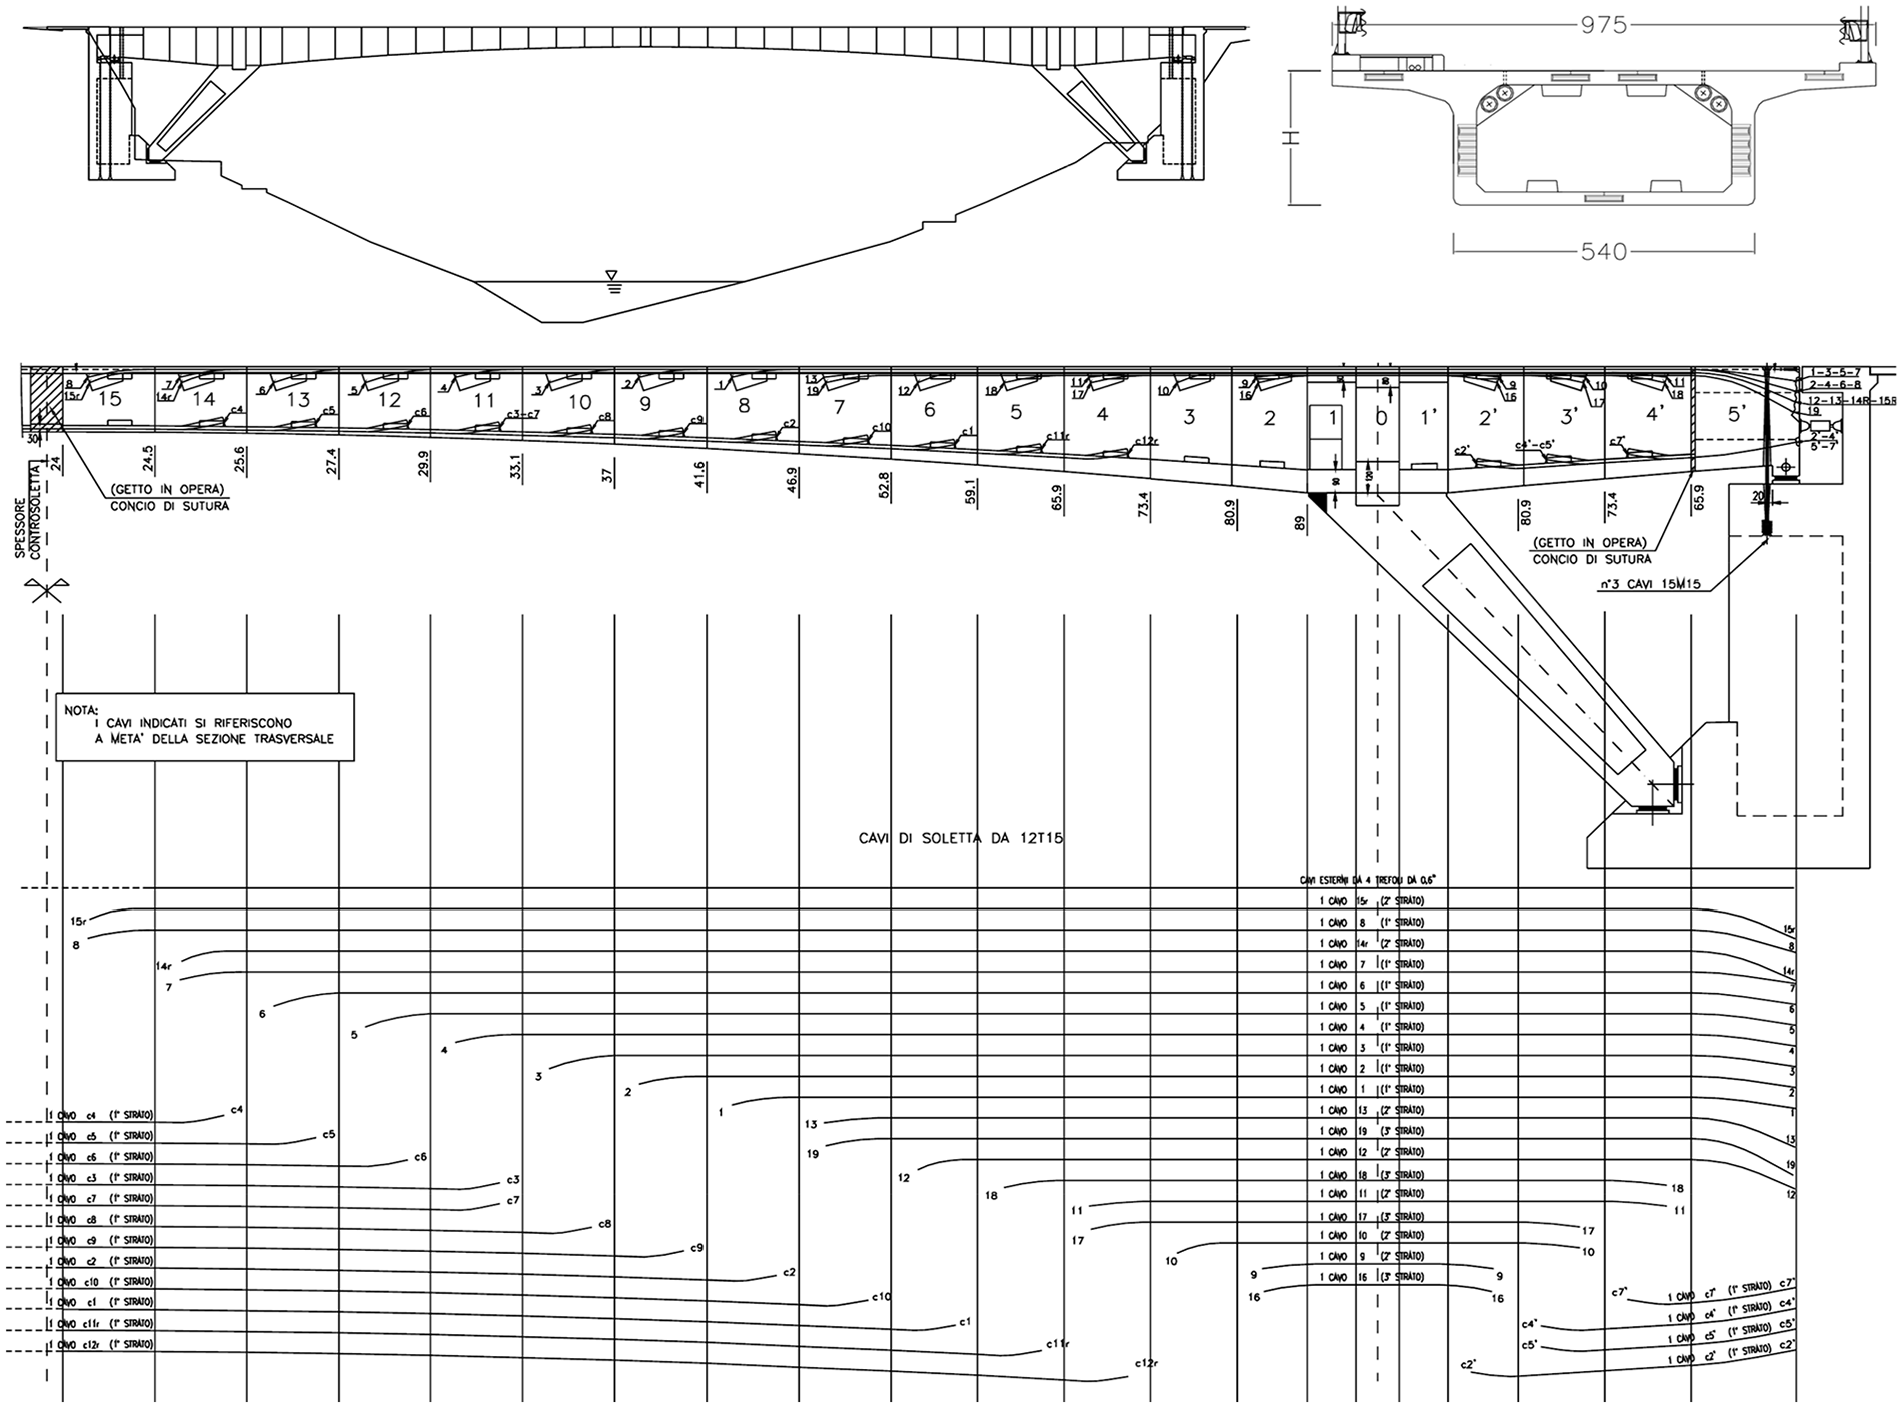
Geometry of the third example bridge with cross section and prestressing tendons.
The deck is composed of a box cross section with variable depth; the intrados curve of the deck is a second order parabola. The total wideness is 9.75 m; the bottom slab has variable thickness from 90 cm over piers to 24 cm at the midspan. The characteristics of this bridge is the high value of axial force due to prestressing associated to the arch effect in the central span and the variable section with the curved intrados. Here upper prestressing is dimensioned for the cantilever phase and bottom prestressing is limited with respect to an equivalent continuous girder without arch effect. More specifications can be found in (Granata and Arici, 2013).
The two sections checked with the two methods considered in the previous cases (analytical and numerical) are here the midspan section and the section between segments 1 and 2 near the inclined pier. The maximum values of reinforcement area in the web were found for the load scheme of maximum shear.
Table 6 gives the values of dimensionless transverse bending moments and longitudinal shear as well as the value of mechanical reinforcement ratio found in the two sections through the interaction domain.
Analytical method applied to the framed arch bridge.
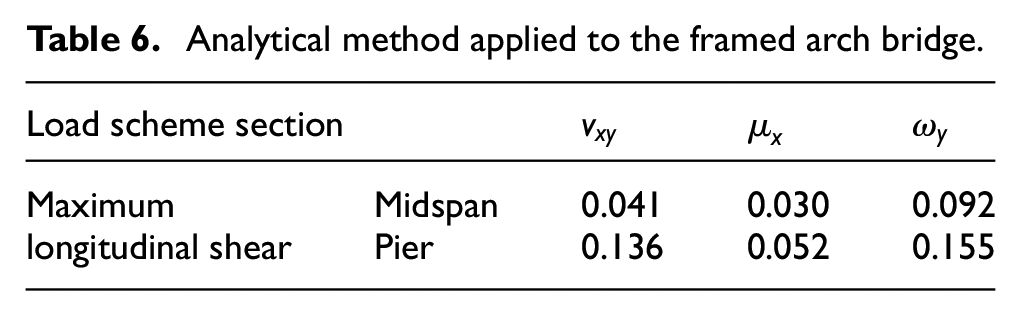
Figure 17 shows the FE model with the mesh used (3810 nodes and 3726 shell elements) and an example of the stress pattern due to the loads applied.
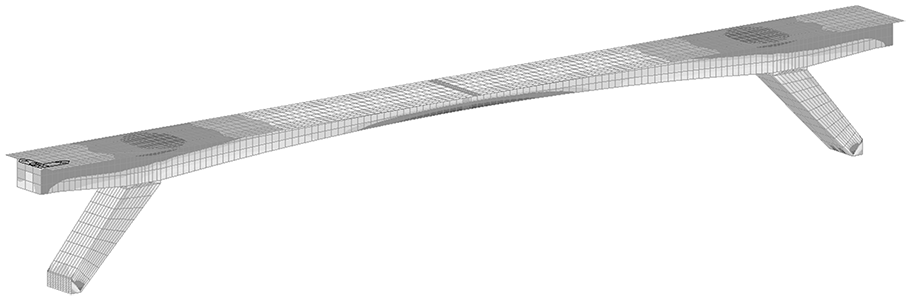
FE model of the third example bridge: mesh and shell stresses for dead loads.
Table 7 shows the comparison between reinforcements found in the web of the two sections of the framed arch bridge.
Comparison between the two methods.
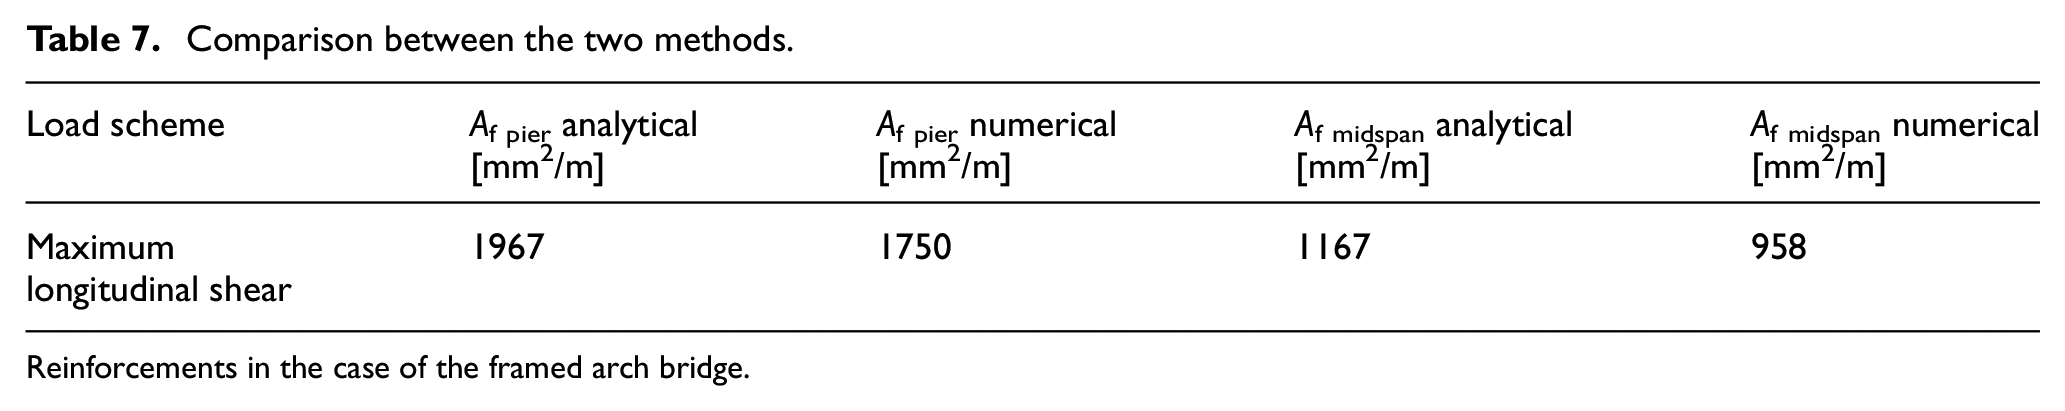
Reinforcements in the case of the framed arch bridge.
In this case the analytical method gives more conservative results (greater areas of reinforcement) in both sections and the agreement between the two methods is very good. In this example the domain of Figure 4 has been used for the analytical determination of reinforcement, because the high value of axial force due to the arch effect reduces the inclination of the compressed stress field θI more than in other girder bridges where the axial force is supplied only by prestressing. Hence equation (17) can be applied and the domain becomes rectilinear in a wide range of shear values modifying a lot with respect to the case of free θ. Moreover the inclined resultant forces due to the curved intrados influences significantly the internal forces and the contribution to shear of prestressing (rectilinear tendons with curved line of cross section centroids) and the value of dimensionless shear vxy to be put in the interaction domain is actually a “reduced shear” due to the contribution of the variation of section height together with the influence of axial force to the principal stresses.
Conclusion
In this paper, a method for determining the reinforcement of webs in prestressed concrete box girders has been presented by applying interaction domains between longitudinal shear and transverse bending. The analytical method is based on a simplified sandwich model at the Ultimate Limit State in which the theory of stress fields and the theory of plasticity are applied.
The analytical method has been compared with the determination of the web reinforcement performed by a 3D shell-type finite element analysis associated with the complete sandwich model of the concrete box web, supplied by the fib Model Code and already implemented in the FE software. The results show that the analytical model allows a simple and reliable determination of the reinforcement avoiding the excessive computational burden, typical of the numerical analysis performed by finite elements, especially in the case of entire bridge models with shell elements which imply an enormous number of elements for achieving the desired precision. By applying a generalized beam theory for the determination of the stress state of thin walled sections of box girders together with interaction domains for reinforcement evaluation, it is possible to supply a useful tool to the designer, in order to evaluate the web reinforcement, avoiding danger of web and overhangs cracking at the Service Limit State or sudden failures at the Ultimate Limit State.
Footnotes
Declaration of conflicting interests
The author(s) declared no potential conflicts of interest with respect to the research, authorship, and/or publication of this article.
Funding
The author(s) received no financial support for the research, authorship, and/or publication of this article.