
Abstract
A comprehensive study of the shear characteristics of steel fiber reinforced recycled concrete-filled steel tube (SRCFST) columns is conducted. 50 CFST stub columns are tested with the variables of steel tube diameter-thickness ratio (D/t), shear span-to-depth ratio (λ), axial compression ratio (n), and concrete mix. Two types of cements, three recycled aggregate percentages, three water-cement ratios, and three steel fiber contents are considered in design of concrete mixes. The experimental results show that SRCFST columns present the coincident shear behavior of the ordinary CFST columns. As λ is increased, shear resistance shows a downtrend, while the flexural strength presents an increasing trend. Imposing axial compression or thickening steel tube contributes to an adequate safety margin in plastic period. Based on the contributions superposition method, a predicted model of the shear capacity of SRCFST columns is proposed in consideration of shear-span ratio, axial compression, and self-stress.
Introduction
Recently recycled aggregate concrete (RAC) is gaining increasing research due to the pressing needs of proper disposal for construction and demolition waste (C&DW) and the growing demand of aggregates. However the imperfect properties of RAC are gradually recognized including inadequate compressive strength (Butler et al., 2011; Etxeberria et al., 2007; Li et al., 2016a; Poon et al., 2004b; Tam et al., 2005), tensile and flexural resistance (Ajdukiewicz and Kliszczewicz, 2002; Rao et al., 2011; Sonawane and Pimplikar, 2013; Tavakoli and Soroushian, 1996; Topcu and Sengel, 2004; Yang et al., 2008), defective durability (Olorunsogo and Padayachee, 2002; Thomas et al., 2013; Zaharieva et al., 2003), and salient shrinkage and creep (Amnon, 2003; Domingo-Cabo et al., 2009; Gomez-Soberon, 2003; Gonzalez-Corominas and Etxeberria, 2016; Seara-Paz et al., 2018). The usage of RAC is limited to the low demand applications such as roadway subbase, therefore other alternatives to reuse RAC is seeking.
It is widely known that the failure of ordinary concrete derives from the initiation, propagation, and joint of micro-cracks, finally developing into penetrating cracks. By reason of the discrepant elastic modulus, micro-cracks frequently emerge around the interfacial transition zones (ITZs) between coarse aggregate and mortar. ITZs are the weak link of concrete and determine the strength of entire concrete (Mitsui et al., 1994). However the ITZs of RAC are inferior to that of natural aggregate concrete (NAC) due to the inherent old mortar attached on recycled coarse aggregate (RCA). Ongoing researches indicate that RAC contains more complex and multiple ITZs than NAC, including one between RCA and old mortar (old ITZ) and the other between RCA and new mortar (new ITZ) (Djerbi, 2018; Poon et al., 2004a; Tam et al., 2005; Wang et al., 2019; Zhang et al., 2019). The adhesion performance of those ITZs is weaker than NAC (Wang et al., 2019). The new ITZs are composed of massive minute pores and cracks (Zhang et al., 2019). Abundant loose and porous hydrates are formed and accumulate around ITZs (Poon et al., 2004a). Those critical facts lead to the performance degradation of RAC.
Accordingly two foremost thoughts are carried out to enhance the mechanical properties of RAC: enhancing the adhesion of ITZs or restricting the crack development. Adding fine mineral particles into RAC, such as micro-fume (Kou et al., 2018; Pedro et al., 2017; Shi et al., 2012) and nano-materials (Akhtar and Sarmah, 2018; Hosseini et al., 2011; Li et al., 2016b), can fill the pores and capillary spaces due to the pozzolanic reaction and filling effect, thereby making the ITZs more uniform and compact. Imposing external strong confinement (Chen et al., 2017; Li et al., 2017a; Nour and Güneyisi, 2019; Tang et al., 2018; Wang et al., 2015; Xu et al., 2019; Yang and Han, 2006) or adding steel fibers (Carneiro et al., 2014; Gao and Zhang, 2018; Kachouh et al., 2019; Mohseni et al., 2017; Ortiz et al., 2017; Sai Nitesh et al., 2019; Xie et al., 2019) can availably restrain the evolution of RAC cracks. Filling into steel tube is the most popular technique to introduce external confinement to RAC. There are some literatures available about the mechanical behavior of recycled aggregate concrete filled steel tube (RCFST). The adverse impact of RCA on the compressive behavior of RCFST columns is proved being alleviated compared with on the materials strength (Chen et al., 2017; Wang et al., 2015; Yang and Han, 2006). Several calculation models for predicting the compressive strength (Nour and Güneyisi, 2019), composite elastic modulus (Xu et al., 2019) of RCFST columns are proposed and agree well with the experimental results. Similar seismic behavior but lower energy dissipation ability is presented in RCFST column compared with the normal CFST columns (Tang et al., 2018). The post-elevated temperature performance of RCFST is found relatively inferior than the normal CFST (Li et al., 2017b). Besides extensive researches are devoted to enhance RAC by adding steel fibers. The mechanical behavior of steel fiber reinforced recycled aggregate concrete (SRAC) subjected to the compression (Carneiro et al., 2014; Ortiz et al., 2017), splitting tensile (Mohseni et al., 2017), flexural moment (Gao and Zhang, 2018), torsional moment (Sai Nitesh et al., 2019) have been investigated and proven the effectiveness of steel fiber. Meanwhile SRAC exhibits preferable chloride permeability (Mohseni et al., 2017), fracture behavior (Xie et al., 2019), and abrasion resistance (Kachouh et al., 2019) compared with RAC.
In spite of those appreciable achievements, there still remains research room for optimizing the application of RAC. In practical engineering, RCFST columns, as an important structural component, are frequently subjected to a horizontal wind load or an earthquake. RAC as filling material is commonly subjected to a combined compression-shear stress. The shear strength and modulus of RAC are confirmed lower than the NAC by many scholars (Xiao et al., 2012; Wang et al., 2021). The reason is that shear stress in the concrete is mainly transferred by the crack friction, aggregate interlock and dowel action, in which aggregate interlock is the most vital factor. Initially, the crack width is small, aggregate interlock effect occurs at the local contact surfaces between the coarse aggregates and nearby mortar (Laible et al., 1977). The density and mechanical properties of the coarse aggregates and mortar affect the aggregate interlock force. After the mortar is crushed, the cracks open gradually, the aggregate interlock effect fades away. As is well known that due to the initial damage initiated in the crushing process, the cracks of RAC develop faster than the NAC. Besides, the loose and porous ITZs of RAC lead to a weaker aggregate interlock effect. Therefore, RAC contributes lower shear strength to the columns. The shear-critical structural elements made of RAC present inadequate bearing capacity compared with the conventional one (Arezoumandi et al., 2014; Etman et al., 2018).
Adding fibers is a wise choice to control cracks’ propagation, and shows promise to improve the shear resistance of RAC. Etman et al. (2018) investigate the shear performance of reinforced concrete (RC) beams made of RAC and short polypropylene fibers. The results show that the decrease of shear strength of RC beams due to RAC could be compensated by adding short fibers. Because the fibers hinder the appearance and development of shear cracks, meanwhile enhance the aggregate interlock. Chaboki et al. (2019) study the shear characteristics of RC beams containing RAC and steel fibers. The test results prove that introducing steel fibers remarkably increases the shear capacity and deformation of RC beams.
Therefore, this paper introduces the internal steel fibers to enhance the shear performance of RCFST columns. An experiment of 50 specimens is conducted to study the shear characteristics of steel fiber reinforced RAC filled steel tube (SRCFST) columns. The variables considered in this study are the diameter-thickness ratio (D/t) of steel tube, shear span-to-depth ratio (λ), axial compression ratio (n), and concrete mix. Failure mode, shear load-mid-span deflection response, and shear load-strain relation are analyzed, meanwhile shear capacity, normalized maximum flexural moment, and ductility index are investigated to reveal the shear mechanism. Besides, the predicted formulas of shear capacity are proposed.
Experimental program
Test specimens design
A total of 50 specimens are designed and conducted under the lateral shear force. The identical external diameter (D) of the specimens is set as 165 mm. According to the research purpose and engineering practice, the following parameters are taken into account:
(1) The thicknesses of steel tubes (t) are designed as 2.00, 3.00, and 4.00 mm, and the corresponding diameter-thickness ratios (D/t) are 82.50, 55.00, and 41.25.
(2) The shear span-to-depth ratio λ is defined as

where a is the clear distance between the stiff clamp and bearing, and D is the external diameter of specimens. In view of engineering practice, λ is selected as 0.2, 0.3, 0.5, and 0.75.
(3) The axial compression ratio n is taken as 0, 0.2, and 0.4, which can be expressed as

where N1 is the applied axial force. N2 is theoretical axial load-bearing capacity of the specimens, it is calculated according to China code CECS 28:2012 (2012):
when

when

in which Ac and As are cross-sectional areas of concrete and steel tube, respectively. fc and fy are axial compressive strength of concrete and yield strength of steel tube, respectively. α is relative to concrete strength grade, its value can be consulted from CECS 28:2012 (2012). ξ is the confinement index, and given as ξ = Asfy/Acfc.
(4) In addition, varies concrete mixes are explored, including the mass replacement rate of recycled aggregate (RAR, chosen as 50%, 75%, and 100%), volume fraction of steel fibers (Vf, set as 0.6%, 1.2%, and 1.8%), cement type (ordinary Portland cement or sulphoaluminate-type cement), water to cement ratio (w/c, designed as 0.23, 0.28, and 0.33).
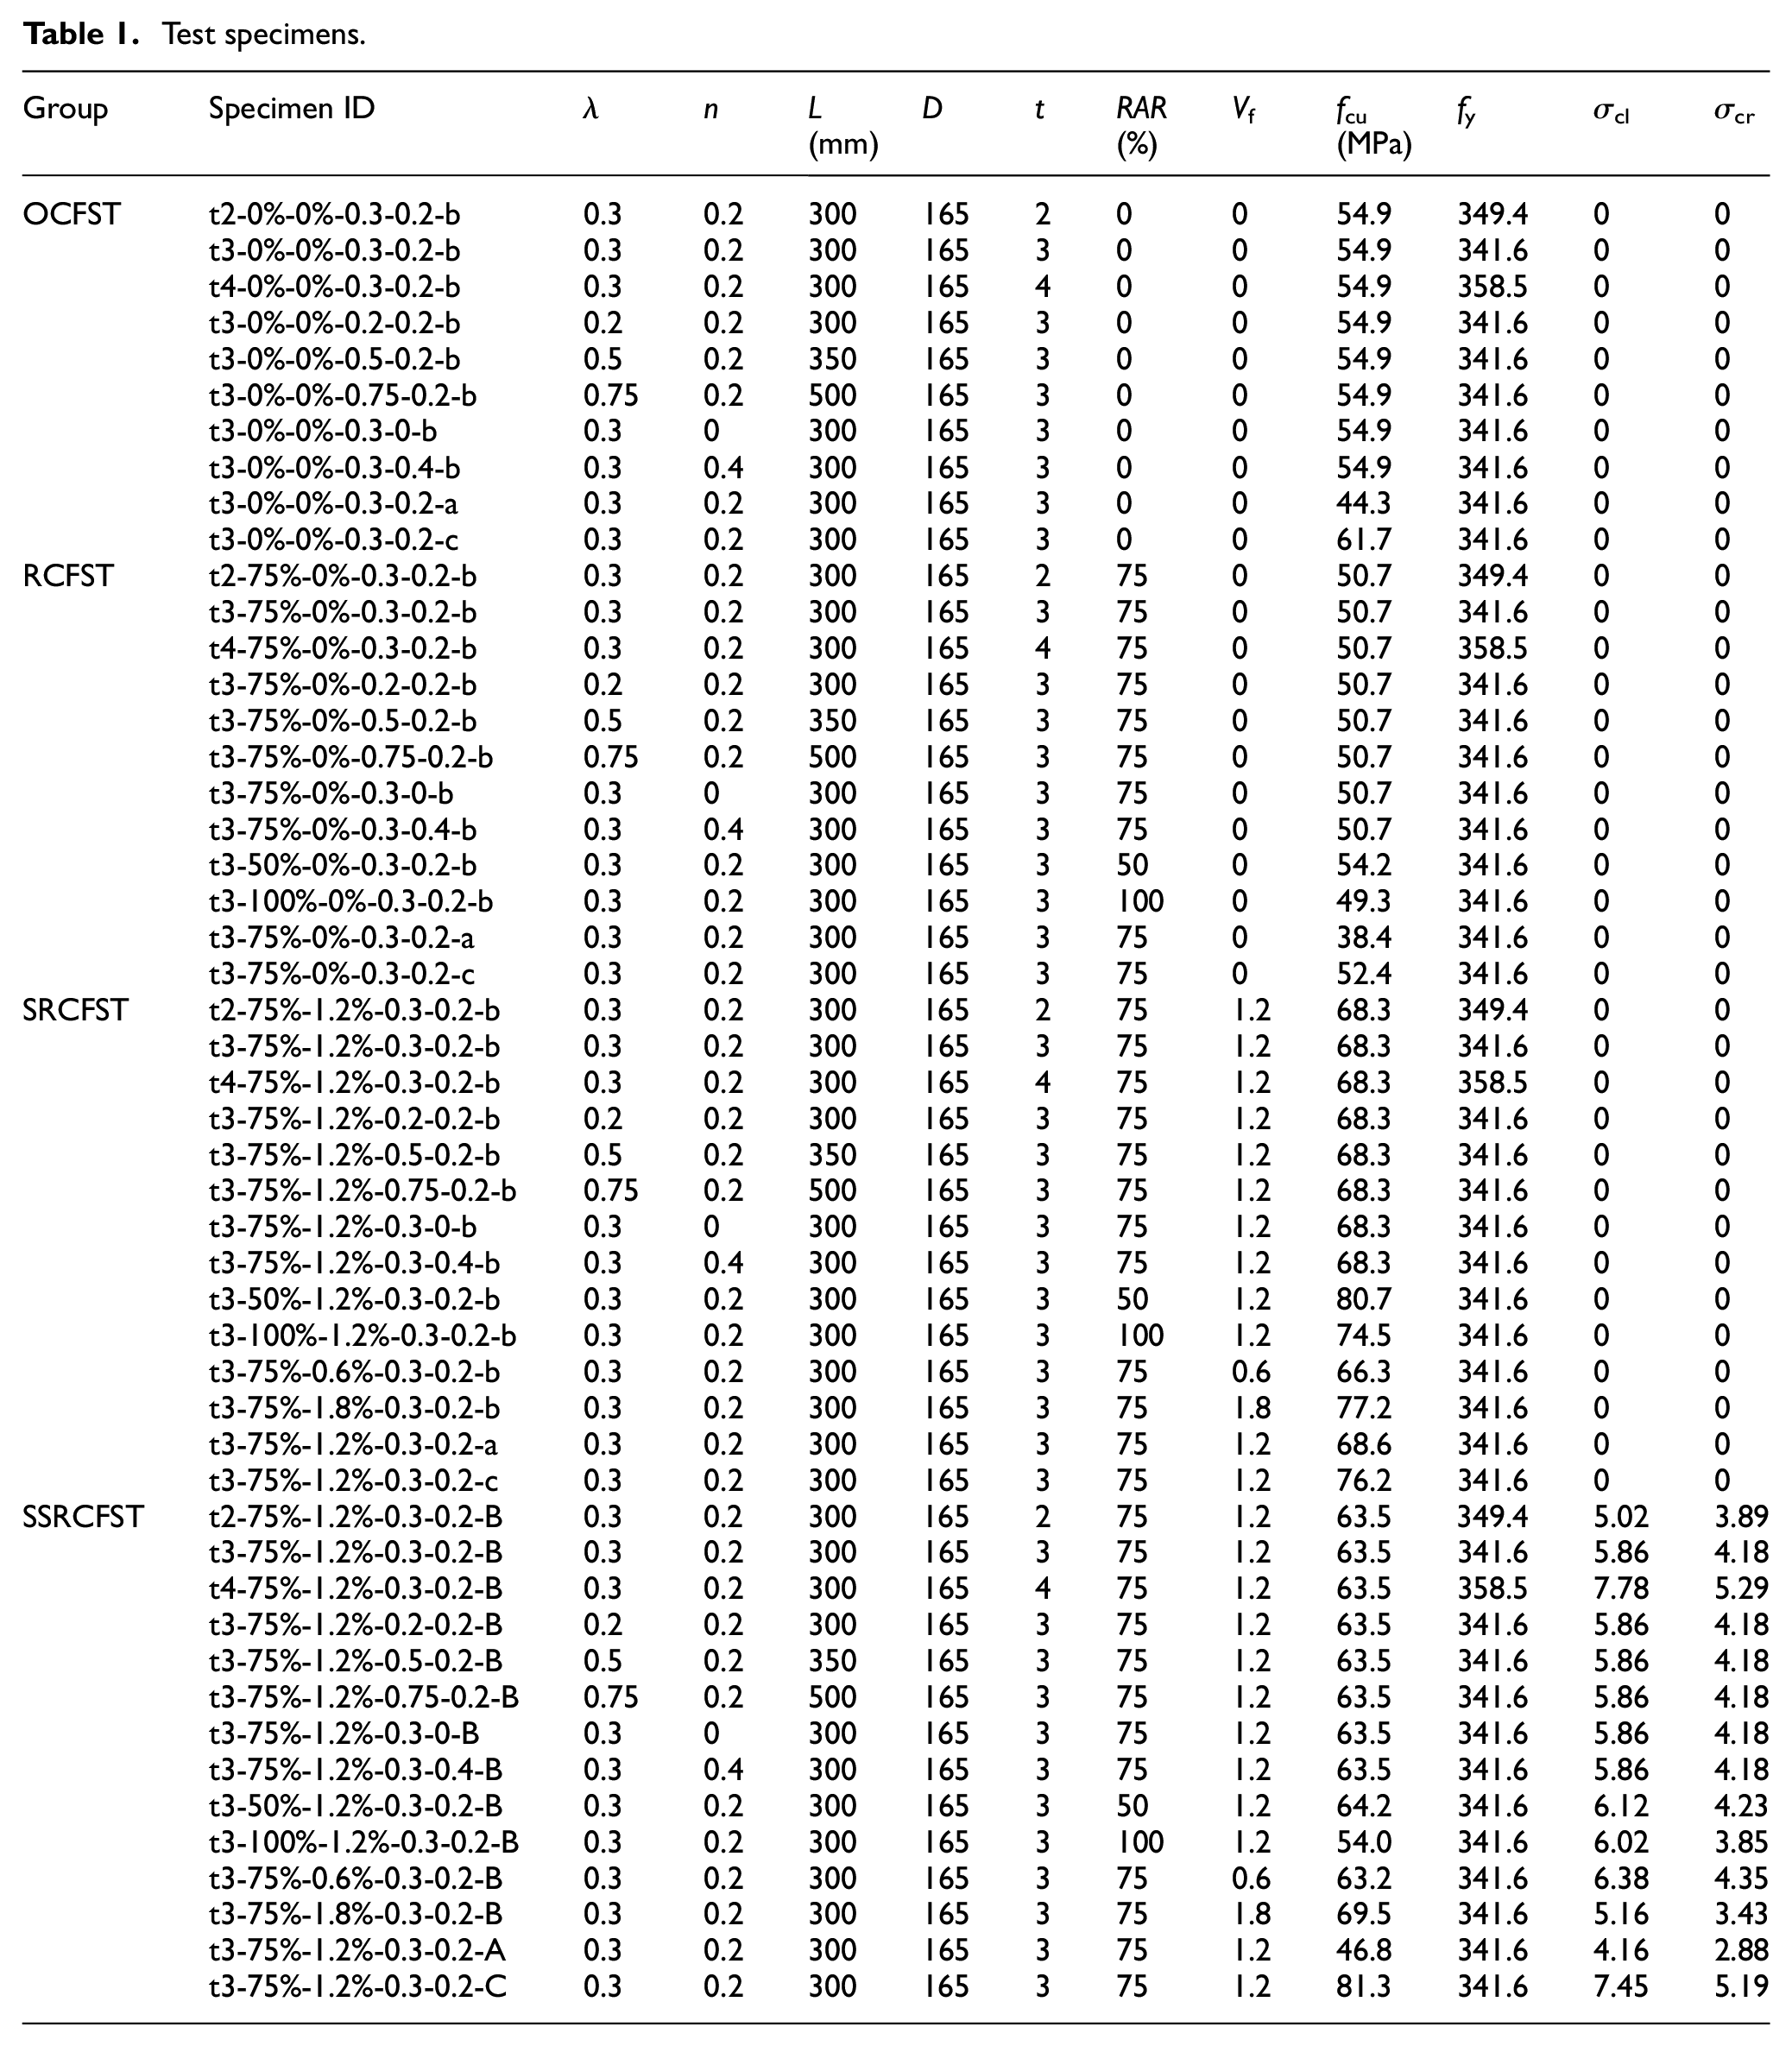
The information of all specimens is summarized in Table 1. The specimen ID consists of six parts, each of which is separated by “-.” The first part represents the wall thickness of steel tube, the second part is the replacement rate of recycled aggregate, and the following parts are the volume fraction of steel fiber, shear-span ratio, axial compression ratio, and concrete mix in order. The concrete mix a, b, and c stand for ordinary concrete of C40, C50, and C60 prepared by ordinary Portland cement, respectively. The concrete mix A, B, and C represent self-stressing concrete of C40, C50, and C60 with sulphoaluminate-type cement, respectively. All the specimens are classified into four groups easy to distinguish: ordinary concrete filled steel tube (OCFST), recycled concrete filled steel tube (RCFST), steel fiber reinforced recycled concrete filled steel tube (SRCFST), and steel-fiber-reinforced self-stressing recycled concrete filled steel tube (SSRCFST).
Test specimens.
Materials
In the experiment, there are two sources of coarse aggregate: natural coarse aggregate (NCA) and recycled coarse aggregate (RCA). NCA is the continuous graded gravel with the particle size grade of 5–25 mm. RCA is derived from waste concrete with the original strength of C40. To ensure removal of aggregate size effect, RCA is repeatedly crushed by manual and mechanical crushing to ensure the same particle size grade with NCA. Then RCA and NCA are compared by the properties. The test results show that RCA has the density of 2485 kg/m3, the water absorption in 30 min is 4.2%, and the crush index measured according to Chinese code GB/T 14685-2011 (2011) is 15.6%. By contrast, the density, water absorption and crush index of NCA are 2743 kg/m3, 1.3%, and 8.2%, respectively. It can be concluded that RCA has a smaller density, higher water absorption and weaker resistance to compressive load compared with NCA. To explore the reason, RCA and NCA are compared under a close magnification as shown in Figure 1. It can be seen that the RCA has an irregular shape, and larger voids and more micro-cracks, higher content of old cement mortar appear on the surface of RCA. While no obvious voids, cracks, and old cement mortar adhesion are observed on the NCA.

Comparison of RCA and NCA under a close magnification.
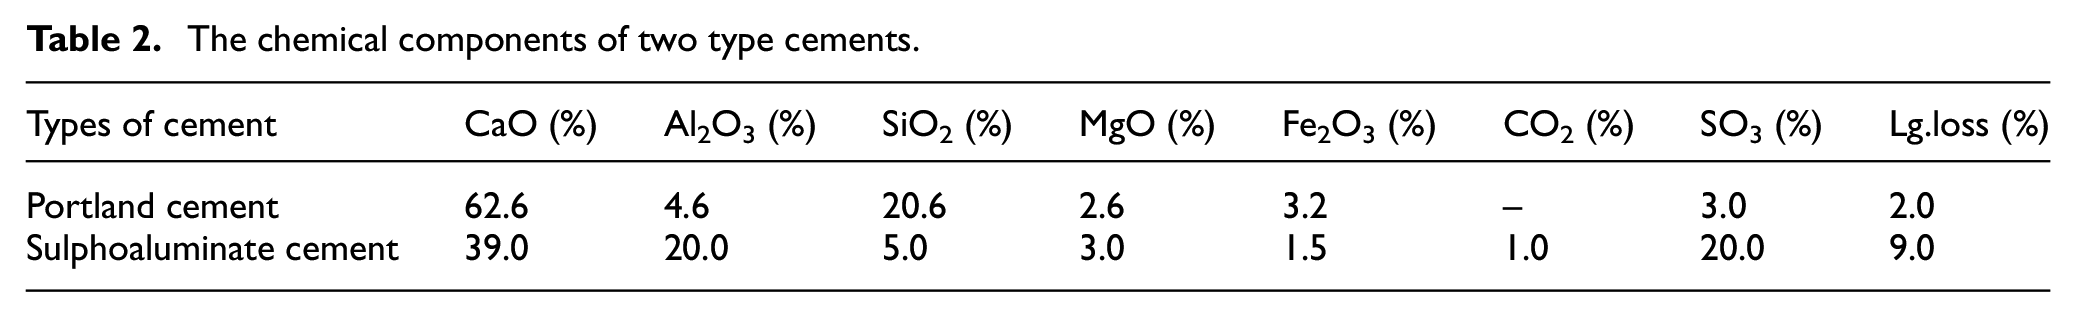
Two types of cements are used as the main binder: ordinary Portland cement 42.5 and sulphoaluminate-type cement. The chemical compositions of the two cements are analyzed and quantified in Table 2. As seen that, abundant Al2O3 and SO3 in sulphoaluminate cement are the resources of the ettringite (C6A
The chemical components of two type cements.
Allow for economy and properties, a type of hook-end shaped steel fiber is used. The length of steel fiber is chosen as 30 mm, the aspect ratio is 57.6 and the tensile strength is 1060 MPa.
All specimens are fabricated by the seamless welded circular steel tubes. Standard tensile coupon tests, according to Chinese code GB/T 2975-2018 (2018), are conducted to measure material properties of steel tubes. Tensile yield strengths (fy) of the steel tube with thickness of 2, 3, and 4 mm are 349.4, 341.6, and 358.5 MPa, respectively. The corresponding elastic modulus (Es) are 203, 207, and 211 GPa.
Mix proportion design
A total of six benchmark concrete mix proportions are designed, including two type concretes and three concrete strength grades. The ordinary concrete is prepared by the ordinary Portland cement 42.5, and the self-stressing concrete is made with the sulphoaluminate-type cement. Three w/c of 0.23, 0.28, and 0.33 are adopted to obtain varies concrete strength grades. All the benchmark concrete mix proportions are summarized in Table 3. On the basic of the benchmark mixes, the recycled aggregate concrete (RAC), steel-fiber-reinforced recycled aggregate concrete (SRAC) and steel-fiber-reinforced self-stressing recycled aggregate concrete (SSRAC) are designed by adjusting the RCA content and steel fiber dosage. However, in view of unusual high water absorption of RCA, extra mixing water is added into the mixture to maintain favorable flowability. This part of extra mixing water is calculated as the product of RCA mass and its water absorption. The sum mixing water is recorded in Table 3. Besides, adding steel fiber certainly leads to the drop of workability, therefore the water reducer dosage is slightly adjusted to adapt to changes. The slump flow D is measured to evaluate the working performance of concrete mixtures, and the results show a good workability. Three concrete cubes with dimension of 150 mm × 150 mm × 150 mm are cast at the same time of each batch concrete pouring. The average compressive cube strengths (fcu) at 28 days age for different concrete mixes are listed in Table 3. The expansion behavior of self-stressing is quantified by the measure method reported in previous study (Li et al., 2017a), and the results are recorded in Table 1. σcl and σcr represent the longitudinal and radial self-stress of the concrete confined by the steel tube.
Concrete mix proportions.

Test setup
The schematic diagram of the test loading device is shown in Figure 2. A reaction frame is independently developed and consists of four pull rods and two thick steel plates. The specimen is horizontally placed on the loading car through two supports, and pushed into the reaction frame to facilitate the alignment. Universal hinges are arranged at both ends of the specimen, one end is connected with the mechanical jack, and the axial force can be applied by the mechanical jack. The other end is connected with the axial force sensor, which can record the axial force value in real time, thereby fixing the whole device axially smoothly through the self-balancing reaction frame. The lateral shear force is applied through the semicircular stiff clamp in the mid-span. A displacement meter is located vertically to measure the mid-span deflection of specimen. A pair of longitudinal and hoop strain gauges is pasted at mid-span bottom of specimen to measure longitudinal and hoop strains. A strain rosette is attached at a quarter of the length of specimen to measure the steel strains in three directions.
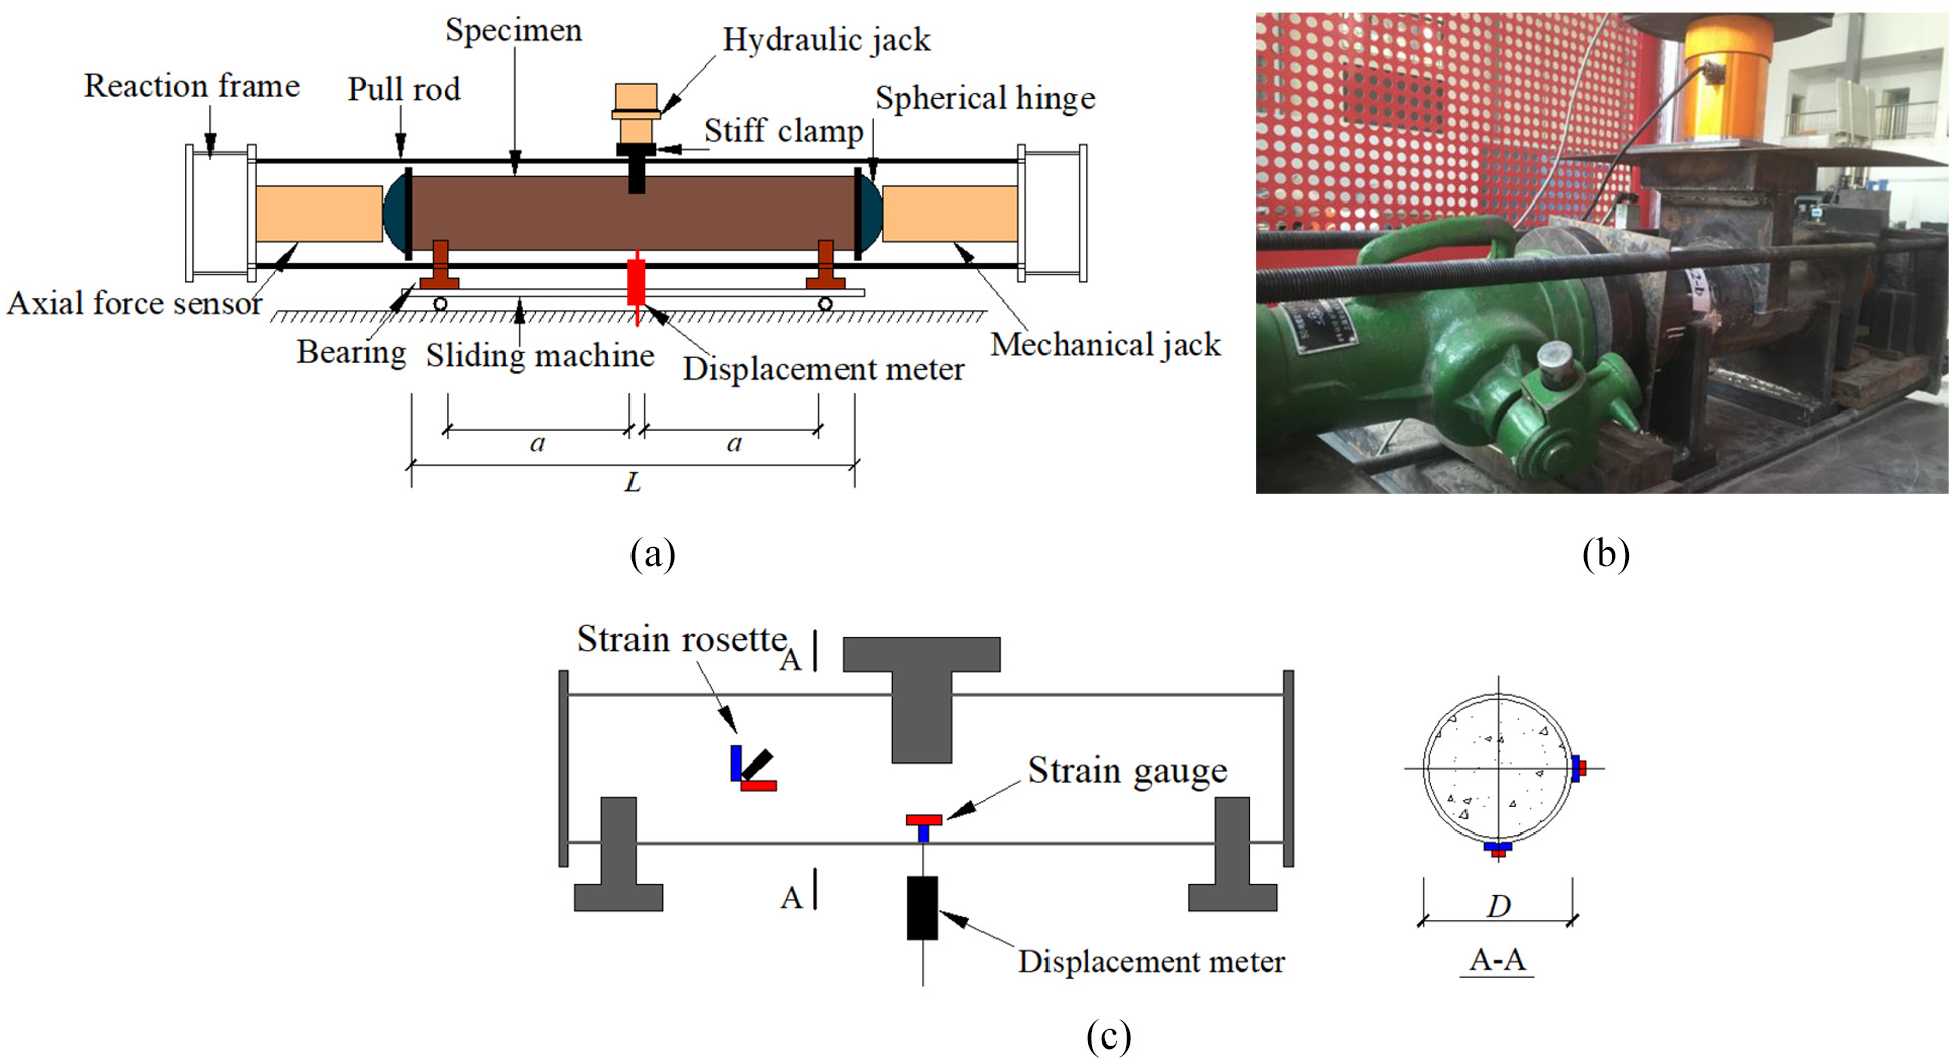
Test setup: (a) schematic diagram of loading device, (b) photograph and (c) instrumentation layout.
The loading process includes three steps. Firstly, the axial force is applied through the mechanical jack until the preset value is read by the axial force sensor. Then the applied axial load keeps constant. Secondly the lateral shear force is preloaded to ensure all instruments work properly. After the preloading is completed, the formal loading is carried out, and the loading time of each load grade is maintained in 2–3 min. In the elastic stage, each stage load is 1/10 of the predicted ultimate load. After entering the elastic-plastic stage, each stage load is 1/20 of the predicted ultimate load. When the load approaches the ultimate value, it loads slowly and continuously. When one of the following events occurs, the test is terminated:
the axial force no longer maintains stability;
the lateral force decreases to 85% of the ultimate load;
the lateral deformation of the specimen exceeds 20 mm.
Test observation and failure mode
The testing phenomenon, including the columns appearance and the reading tendency of the test instrument, are observed during the loading. All the specimens experience the similar failure process. In the initial stage, no obvious appearance variation is founded, and the mid-span deflection is increased linearly with the applied load. The reading tendency of the strain gauges is unimpressive. As the load increases, rust scale and residual cement mortar attached on the steel tube gradually peel off along with the occasional crackle. Approaching to the peak load, the applied load growth decreases, meanwhile the growths of the lateral deflection and strains accelerate. After the peak load, the applied load shows a decrease trend or maintains at a relative stable value, and the lateral deflection and strains aggravate continuously. Meanwhile the columns appearance starts to change. The top of steel tube in contact with stiff clamp gradually concaves inward, while the bottom of steel tube around the two supports forms an outer convex. As the test develops, the shapes of various specimens make a difference. For the specimens with λ of 0.20 and 0.30, the greater areas of rust scale peel off, two shear lines gradually emerge. The mid-part is pushed out along two shear lines, and the specimens are thoroughly separated into three segments. The steel tube is finally torn at the loading and supports positions. For the specimens with λ of 0.50 and 0.75, the mid-part goes down and two ends parts turn up. A distinct relative rotation appears between the two end plates. The global shape of the specimens becomes bent and the mid-span deflection gradually aggravates. The specimens finally fail in the exaggerated lateral deflection.
After the tests, the failure modes of the specimens are investigated. The typical failure modes are shown in Figure 3. The failure modes depend on the shear-span ratio λ, while are not susceptible to other factors (such as D/t ratio or axial compressive ratio). When λ = 0.20 or 0.30, the specimens show a noticeable shear-dominated failure. The failure characteristics include: two symmetrical clear shear slip lines, pushed out mid-span part, and several steel tube tears. When λ = 0.50 or 0.75, the failure modes tend to change from shear failure to flexural failure. The specimens still keep its integrity, but present the curved shape. Obvious lateral deflection in mid-span and relative rotation between the end plates are the typical flexural failure features. Meanwhile, two indistinct shear lines and steel tube tearing can be observed. The specimens show a transitioned shear-flexural failure.

Typical failure mode: (a) λ = 0.20, (b) λ = 0.30, (c) λ = 0.50 and (d) λ = 0.75.
After the test, the outside steel tube is stripped and removed to take a further observation on the failure mode of the inner core concrete, as shown in Figure 4. For the shear failure specimens, the concrete core presents two typical penetrable shear failure surfaces, consistent with the shear slip lines of the steel tube surface. This is due to the diagonal tension strain caused by the shear stress. Under a close magnification, the concrete core without steel fiber is thoroughly divided into three segments by the shear plane. However, the concrete core with steel fiber shows the integrity, and each segment is connected by the steel fibers. For shear-flexural failure specimens, core concrete shows overall bending shape, a mass of tiny cracks emerge on the tension side. This is the typical flexural failure of concrete core, caused by the longitudinal tension stress. The shear failure surfaces are also detected on the concrete core. Therein, the core concrete without steel fibers also appears obvious inclined cracks, and is thoroughly divided into three parts. While the core concrete with adding steel fibers remains the integrity.

Typical failure mode of concrete core.
Test results analysis
Shear load (V) versus lateral deflection (Δ) response
The shear behavior is investigated through the relations between the shear load (V) and lateral deflection (Δ), and the shear load V is equal to one half of the applied lateral load (P), that is V = P/2. The typical V-Δ curves are shown in Figures 5 and 6. The identical trend of curve development is found: a linear ascend stage followed with the approximate horizontal stage or descend stage. Three stages are recognized: linear elastic stage, elastic-plastic stage, and plastic stage. In the linear elastic stage, V initially grows and is linear correlated with Δ until the steel tube starts to yield. After the yield of steel, the curve deviates from the linearity, and the slope gradually declines. Approaching to the first peak load, the ascend trend of V is ended while Δ is accelerated. Then several curves experience approximate horizontal stage with a slight rise of V, thereby obtaining another peak load higher than the first peak point. Two reasons contribute to this phenomenon. After the first peak load, a stronger confinement of steel tube appears due to the development of concrete cracks. The confinement enables the core concrete to develop an even higher strength and ductility. Besides, the strain hardening effect of steel also contributes to the second ascending branch. However, some other curves immediately show a descend trend after the first peak point, consequently no higher record of V is observed. Therefore, the first peak load is defined as shear capacity (Vfs), and the maximum V during loading is called ultimate capacity (Vm).
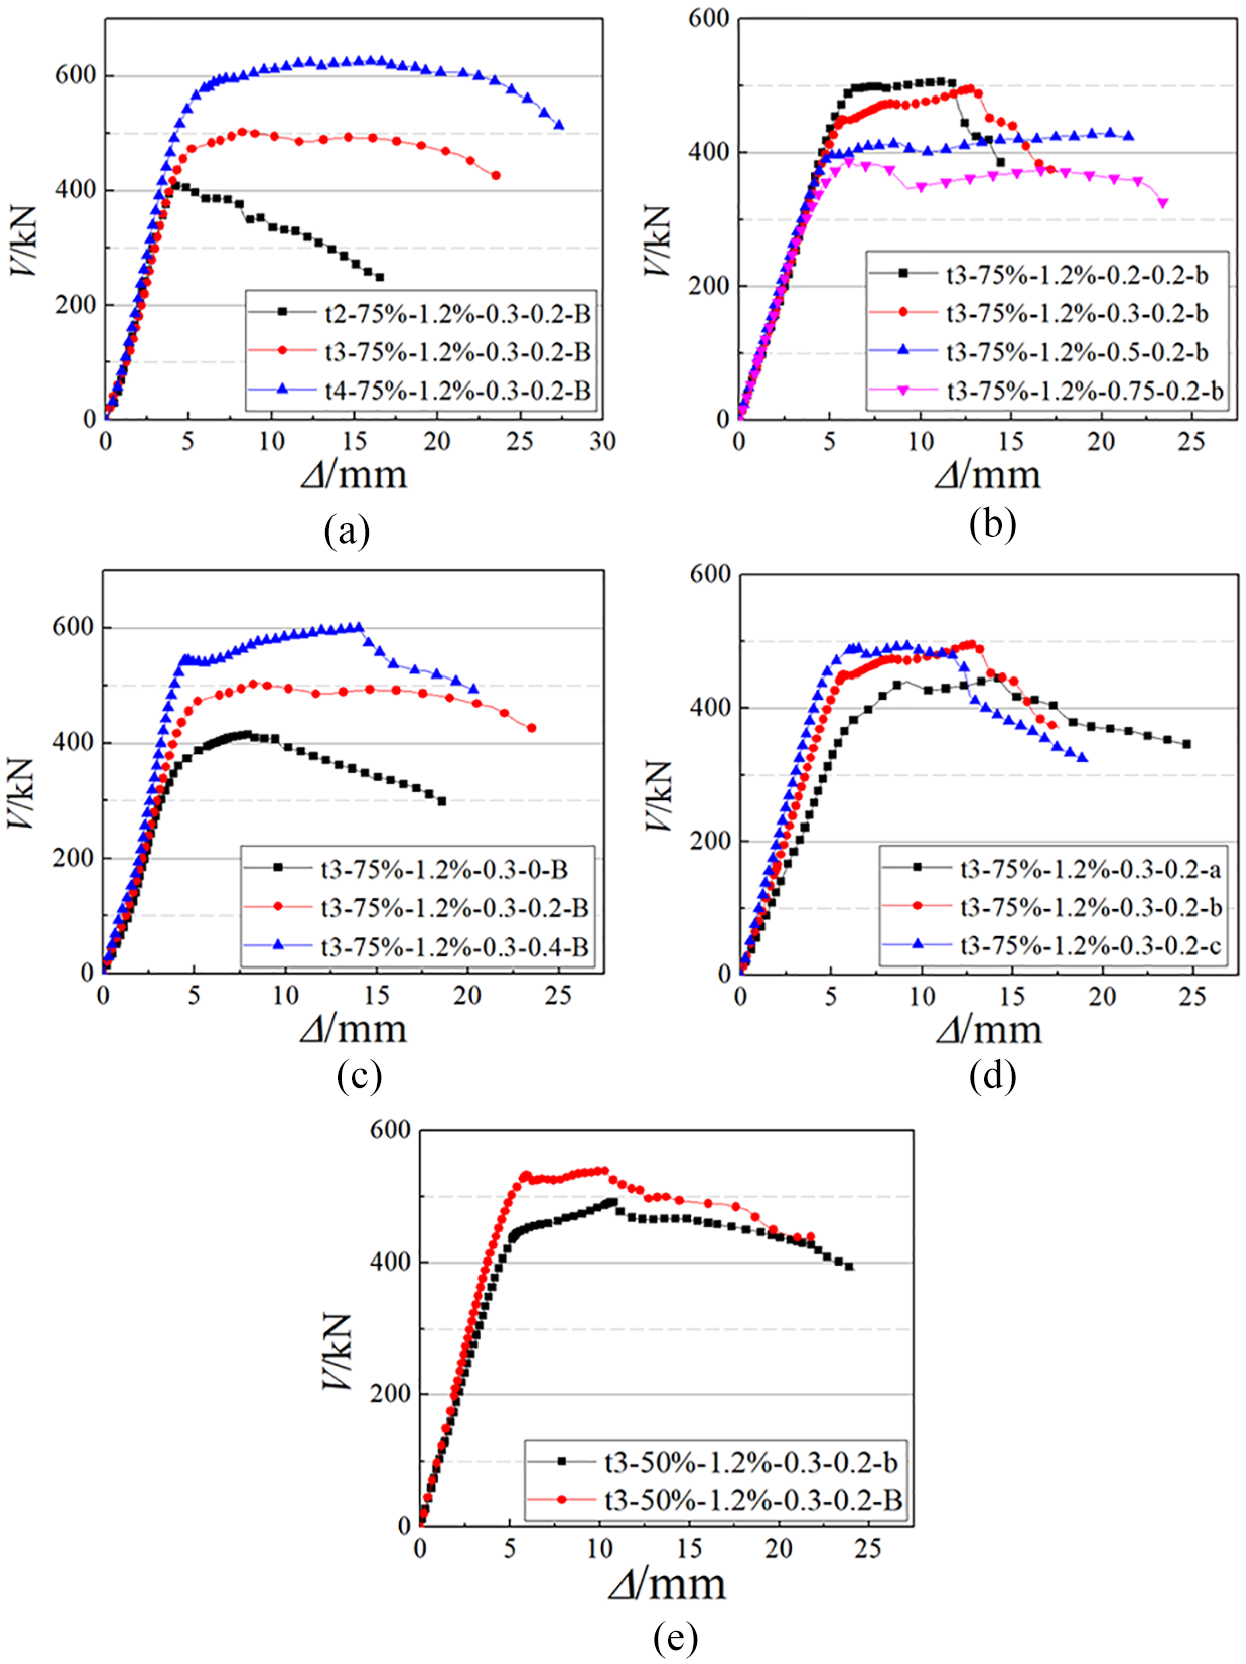
Typical influence of t, λ, n, w/c and self-stress on the V-Δ curve: (a) influence of t, (b) influence of λ, (c) influence of n, (d) influence of w/c, and (e) influence of self-stress.
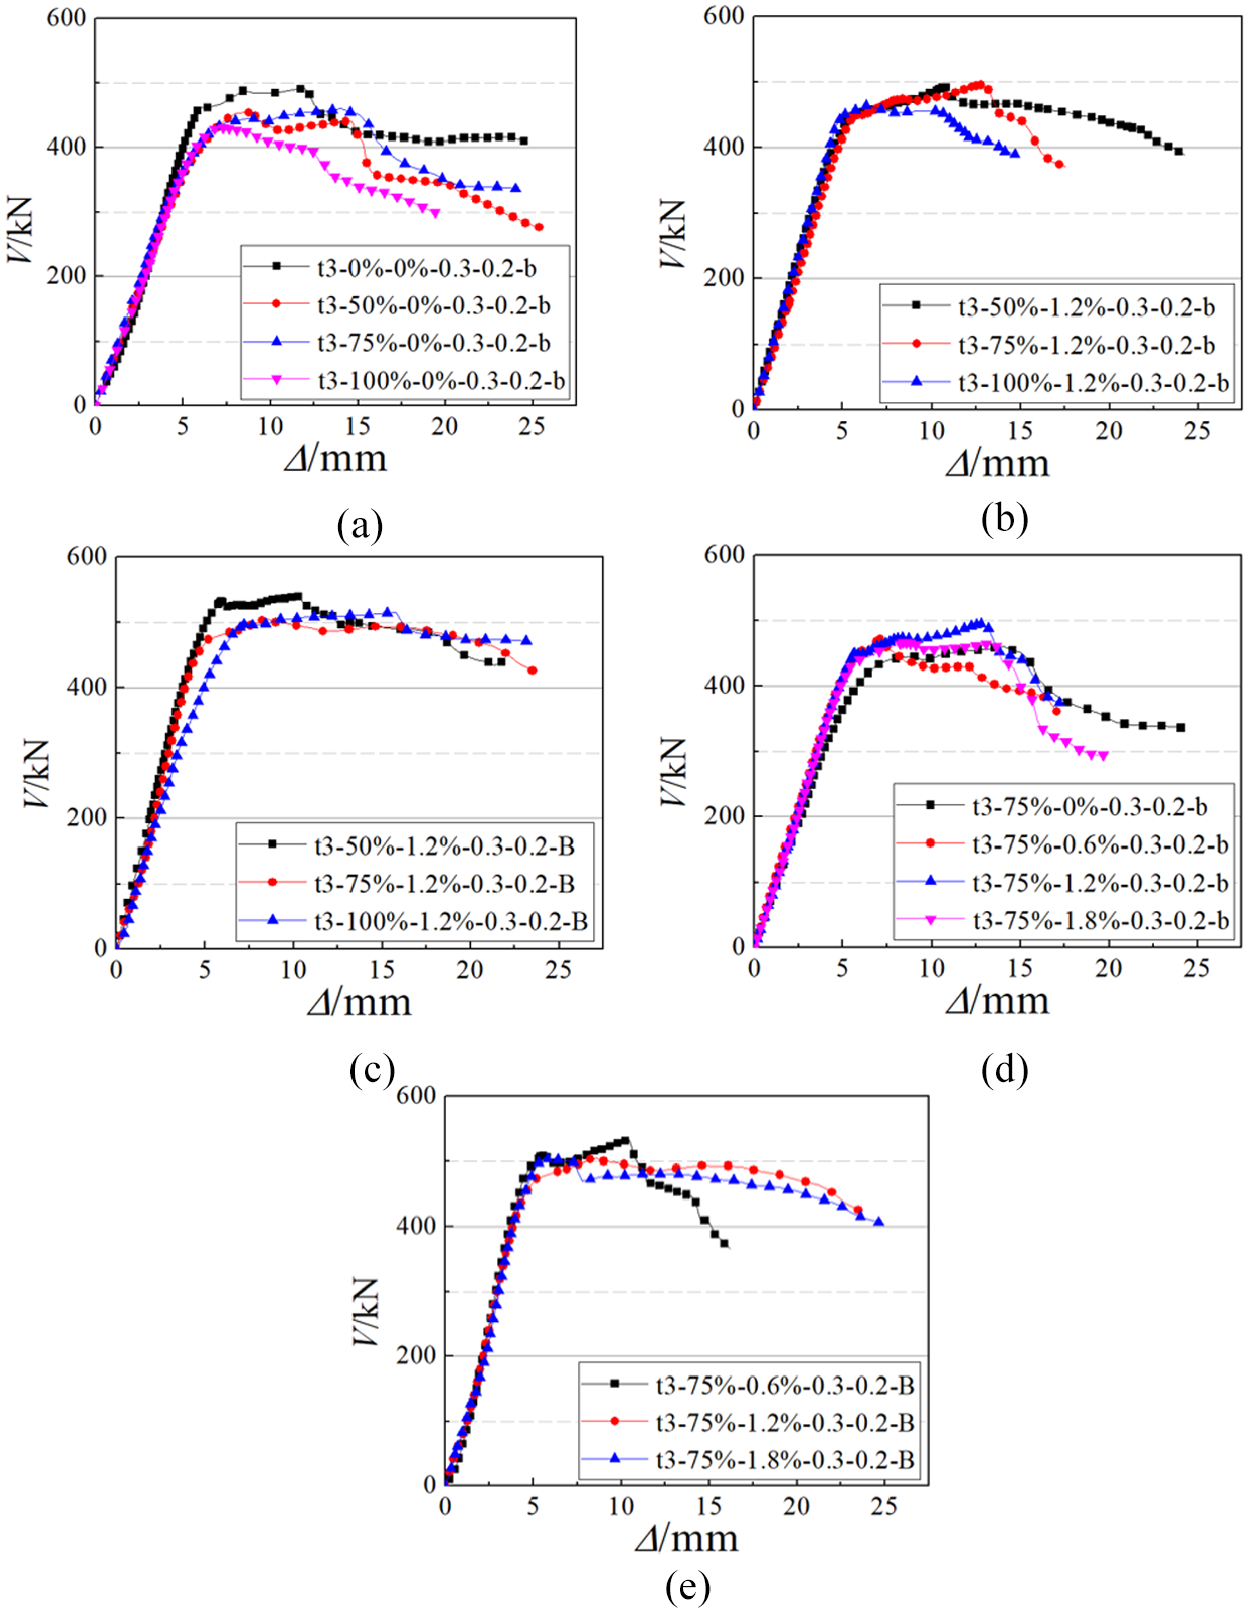
Typical influence of RAR and Vf on the V-Δ curve: (a) influence of RAR on RCFST, (b) influence of RAR on SRCFST, (c) influence of RAR on SSRCFST, (d) influence of Vf on SSRCFST.
The effect of steel tube thickness t on the V-Δ curve is shown in Figure 5(a). The increase of t brings the significant and consistent influence on the V-Δ curves. The linear elastic stage prolongs and the slope of the elastic curve is elevated. Subsequently a higher Vfs is obtained. For the specimens with t = 2 mm, the load immediately drops after exceeding the first peak load. While for the specimens with t = 3 or 4 mm, the plastic curve remains horizontal in a wide range, indicating a favorable deformation ability. This is because thicker steel tube contributes to dual beneficial effect, greater cross-sectional area and stronger confinement to the concrete core, on the shear behavior. Hence the shear capacity, stiffness and the deformation capacity are remarkably improved with the increase in t.
Figure 5(b) shows comparison of V-Δ curves of components with different λs. As λ is increased, the elastic stage of V-Δ curves is shortened, thus the shear capacity shows a decreasing trend. Entering the plastic stage, the curve tendency is affected by the λ-value. When λ = 0.2 or 0.3, the plastic stage is characterized as a platform period followed with a sharp drop. The sharp drop of shear load V can be ascribed that the mid-span part is pushed out. When λ = 0.5 or 0.75, the plastic stage remains relative horizontal until the mid-span deformation reaches 20 mm. No dramatic fall in the shear load V is observed. Because the flexural failure specimens can remain the integrity until achieving excessive deformation in the mid-span.
The influence of axial compression ratio (n) on the V-Δ curve can be inferred from Figure 5(c). As n increases, the elastic stage gradually becomes steeper and longer, the shear capacity is improved, meanwhile the plastic stage is extended. This is due to the compaction effect caused by the compressive load (Wang et al., 2021). The initial cracks are narrowed after applying the axial compressive load. The aggregate interlock is consequently enhanced, the shear strength of concrete core is improved. It is worth noting that after applying the axial compression, the V-Δ curves present a significant plateau rather than a descend branch. The phenomenon is in line with previous researches (Li et al., 2017a; Ye et al., 2016). The reason is that high axial pressure improves the friction between the mid-span and side-spans, thereby makes the mid-span part hard to dislocate (Wu and Peng, 2020).
Figure 5(d) compares the V-Δ curves with different concrete strength grades. With the increase of concrete strength grade, the shear stiffness and shear capacity are gradually promoted, and the load drop in plastic stage accelerates.
The revolution of V-Δ curves in terms of initial self-stress is shown in Figure 5(e). The slope of elastic stage is apparently increased, and the shear capacity is improved by introducing initial self-stress, the deflection corresponding to Vfs is therefore diminished. While SSRCFST specimens have a relatively smooth descending branch compared with the corresponding SRCFST specimens. This is possibly due to that initial self-stress brings a superb cooperation between steel tube and concrete core to resist lateral shear loads.
The V-Δ curves with varies RARs are compared in Figure 6(a) to (c). From Figure 6(a), the curves overlap in the linear elastic period, while diverge from each other after entering the elastic-plastic stage. Apparently, Specimen t3-0%-0%-0.3-0.2-b presents a longer elastic stage and greater shear capacity compared with other specimens. In the plastic stage, Specimen t3-0%-0%-0.3-0.2-b has an evident platform period than other specimens prepared with recycled aggregate. This indicates that the failure of RCFST is earlier than OCFST. It is attributed to the lower strength and significant shrinkage of RAC and the rapid development of initial cracks in RAC. In Figure 6(b) and (c), RAR has little-to-no influence on the V-Δ curves of the SRCFST and SSRCFST specimens. The adverse impact of RCA on the shear performance of RCFST is diminished by adding steel fibers and introducing initial self-stress.
The effect of Vf on V-Δ curve is shown in Figure 6. From Figure 6(d), compared with the RCFST (Specimen t3-75%-0%-0.3-0.2-b), other SRCFST specimens exhibit an extended elastic stage and slightly increased shear capacity Vfs, but has no changes on the slope in elastic stage. From Figure 6(e), in the series specimens of SSRCFST, the increase of Vf has no appreciable influence on the elastic stage but remarkably improves the deformation ability in plastic stage. This is because steel fibers affect the post-cracking period rather than the elastic behavior (Liu et al., 2019; Pajak and Ponikiewski, 2017). Meanwhile, compared with NCA, RCA with an irregular shape makes steel fibers difficult to pull out from the crack interfaces, thereby improving the deformability of RAC.
Shear capacity
Shear capacity Vfs and ultimate capacity Vm collected from the V-Δ curves are listed in Table 4, and analyzed in this section. The values of Vfs/Vm are calculated to evaluate the safety margin of the specimens exceeding the shear capacity.
Test results.

Shear capacity Vfs is increased with the rise of t. For OCFST specimens, when t increases from 2 to 3 and 4 mm, Vfs is increased by 20.63% and 44.08% respectively. For RCFST specimens, Vfs is improved by 22.94% and 51.71%, respectively. For SRCFST specimens, the increase of Vfs is 23.63% and 46.86%, respectively. For SSRCFST specimens, Vfs is promoted by the amount of 22.89% and 43.44%, respectively. It is clear that t plays an important role on the Vfs. Besides, all specimens have the Vfs/Vm values smaller than 1.00 except the specimens with t = 2 mm. In other words, thinner steel tubes cannot exhibit the potential bearing capacity in the plastic stage. This is possibly because that, exceeding the point B of V-Δ curve, concrete core and steel tube all enter the plastic phase. Thinner steel tubes not only are unable to provide strong confinement to concrete core to improve the concrete strength, but also have no obvious strain-hardening effect. Hence no higher record than Vfs appears.
The increase of RAR leads to a slight drop of shear capacity Vfs. For RCFST specimens, when RAR increases from 0% to 50%, 75%, and 100%, the corresponding Vfs decreases by 1.93%, 3.69%, and 6.75% respectively. For SRCFST specimens, as RAR increases from 50% to 75% and 100%, respectively. Vfs is reduced by 4.01% and 6.08%. For SSRCFST specimens, the drops of Vfs are 5.28% and 6.66%, respectively. It can be concluded that the alternative of NCA by RCA causes the decrease of Vfs less than 7%, which can be neglected.
Adding steel fibers can slightly improve Vfs. In series specimen of SRCFST, the increase of Vf leads to the average increase of 6.0% in Vfs. In series specimen of SSRCFST, the increase in Vfs caused by the rise of Vf is less than 2.0%. When Vf attains 1.8%, Vfs even shows a decline trend. This is because excessive content may cause the accumulation of steel fibers and casting defects.
The variation of λ brings significant revolution of Vfs. No matter any series of specimens, the rise of λ leads to the decrease of Vfs. When λ increases from 0.2 to 0.3, 0.5, and 0.75, Vfs of the OCFST specimens decrease 10.23%, 26.75%, and 43.36%, respectively. Vfs of the RCFST specimens reduce 10.37%, 25.06%, and 42.57%, respectively. Vfs of the SRCFST specimens drop 5.42%, 25.21%, and 30.41%, respectively. Vfs of the SSRCFST specimens decrease 5.15%, 23.51%, and 27.48%, respectively. This tendency agrees well with the previous research (Lehman et al., 2018; Shi et al., 2019; Wu and Peng, 2020; Ye et al., 2016). The reason is that, as λ increases, the bending moment and rotation of the cross section both aggravate under the same lateral shear load.
As n increases from 0 to 0.2 and 0.4, Vfs increases gradually. The increase of Vfs in OCFST specimens is 10.62% and 21.81%, respectively. Vfs in RCFST specimens is improved by 3.17% and 7.59%, respectively. For SRCFST specimens, Vfs is enhanced by the amount of 22.05% and 34.12%, respectively. For SSRCFST specimens, Vfs obtain the increase of 20.86% and 31.33%, respectively. Two reasons contribute to this fact. The axial compression brings higher aggregate interlock to shear plane of concrete, thereby obtaining a higher concrete strength to resist lateral load. Simultaneously, strengthened concrete core supports the outside steel tube and makes it insensitive to local buckling. It is particularly highlighted that the Vfs/Vm values are entirely equal to 1.00 when n = 0. This indicates that the non-compressive specimens are incapable of adequate safety shear margin after the shear capacity.
Apparently, Vfs shows an uptrend with the rise of concrete strength grade. For ordinary concrete promoted from C40 to C50 and C60, Vfs increases by 14.26% and 29.00%, respectively. For RAC improved from C40 to C50 and C60, Vfs shows the increase of 3.17% and 7.59%, respectively. For SRAC, the rise of Vfs is 7.75% and 11.48%, respectively. For SSRAC, Vfs is enlarged by 6.06% and 10.61%, respectively. It is concluded that OCFST specimen is more sensitive to the variation of concrete strength grade than other types of specimen. Moreover, the Vfs/Vm values show an ascent trend along with the increase of concrete strength grade. When concrete strength grade reaches C60, almost all Vfs/Vm = 1.00. This demonstrates that high concrete strength can improve the shear capacity but seems unable to provide sustained bearing capacity in plastic period.
Initial self-stress causes the improvement of Vfs, and the maximum amount is 8.36%. For the specimens with shear span ratio of 0.2, 0.3, 0.5, and 0.75, the increase of Vfs due to self-stress is 5.92%, 6.23%, 7.38%, and 8.36%, respectively. For specimens with axial compression ratio of 0, 0.2 and 0.4, the rise of Vfs caused by self-stress is 7.27%, 6.23%, and 5.03%, respectively. It can be inferred that self-stress plays a more obvious role on the specimens with higher shear span ratio and lower axial compression.
Normalized maximum flexural moment
The normalized maximum flexural moment is defined as

All Mexp are recorded in Table 4 to investigate the moment resistance of the specimens. The influence of shear span ratio λ on Mexp is shown in Figure 7. As λ is increased, Mexp shows an uptrend. When λ is lower than 0.50, the specimens fail in the shear tress of the cross section. As λ increases, though Vfs is decreased, the shear span is prominently improved, Mexp is consequently increased. For the specimens with λ higher than 0.50, the failure is gradually controlled by the cross-section bending moment. The shear capacity no longer controls the response, meanwhile the flexural potential is gradually realized. Hence Mexp is increased with the improvement of λ.
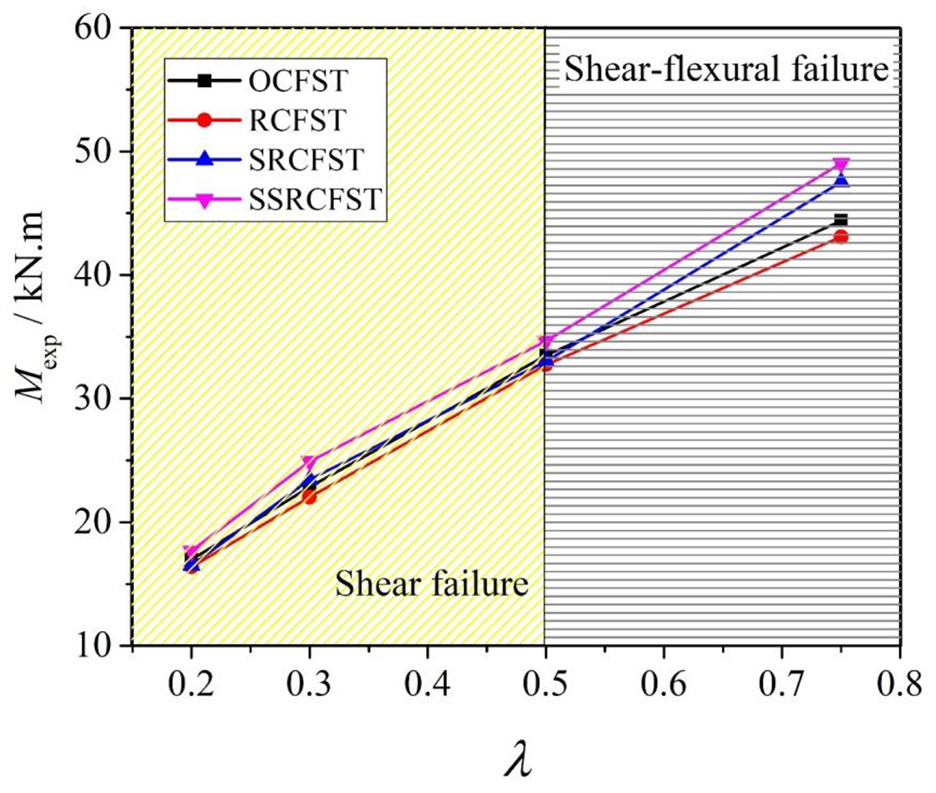
The variation of Mexp with λ.
The normalized maximum flexural moment Mexp is compared with the predicted moment (Mpre) from Chinese code GB 50936-2014. Mpre can be determined as:
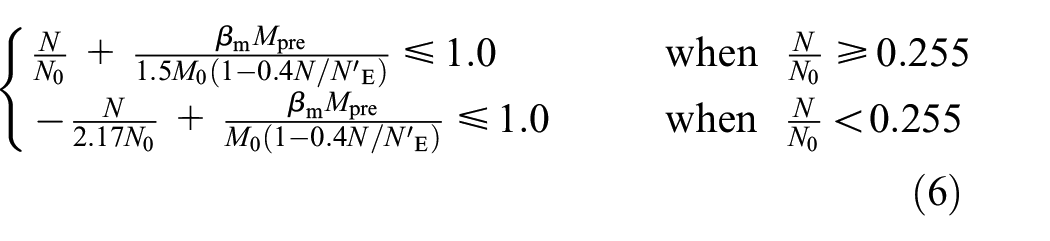
in which N is the applied axial compression. βm is equivalent moment coefficient, and NE is the Euler’s critical load, and given as NE = 11.6kEfscAsc/λ2. N0 and M0 are the bearing capacity of the specimen subjected to axial load or pure bending, respectively. They can be calculated by:


where γm is the coefficient of plastic development and taken as 1.20 for the solid circular cross-section. Wsc is the section modulus and calculated by Wsc = πD3/32. The calculated values of Mexp/Mpre are listed in Table 4. It is seen that Mexp/Mpre shows an increasing trend with the increase of λ. When λ = 0.20 or 0.30, Mexp/Mpre is less than 0.6, indicating sufficient flexural potential. The response of the specimen is limited by the shear strength. While λ = 0.50, the Mexp/Mpre ratio is about 0.80. As λ exceeds 0.5, Mexp/Mpre is approximated to 1.05, demonstrating the well-used moment capacity. The failure is determined by the flexural resistance. It is concluded that the shear failure occurs only when the measured moment is less than 0.80 Mpre. The specimens that achieved a bending moment greater than approximately 1.05 Mpre can sustain a flexural failure.
Deformation capacity
The deformation capacity of the specimens is evaluated by the ductility index (DI). Referring to previous studies (Shi et al., 2019), DI is defined as

in which Δfs is the deflection in mid-span corresponding to shear capacity Vfs, and Δm85 is the corresponding mid-span deflection when the load drops to 85% of ultimate capacity Vm. The measured Δfs and Δm85 are listed in Table 4, meanwhile the calculated DI are summarized in Table 4. It is noted that several specimen do not experience a descent period, indicating a favorable ductile behavior, whose DI-values are labeled as “N.” Generally, DI shows a conspicuous rising trend along with the increase in steel tube thickness t, shear span ratio λ and axial compression ratio n. This is due to the admirable plastic deformation capacity of steel tube and the improved confinement provided by thicker steel tube. The rise of λ improves the flexural resistance and makes the specimens failing in a ductility behavior. The axial compression improves the aggregate interlock effect and delays the failure of the specimens. The increase of Vf plays a more active role in SSRCFST than SRCFST. DI shows a downtrend when the concrete strength grade is enhanced. This fact corresponds to the traditional CFST. The DI of SSRCFST specimens is mostly higher than that of the corresponding SRCFST specimens.
Load-strains relation
The typical relative shear load (V/Vfs) vs. strain curves of the specimens are shown in Figure 8. The longitudinal strain εL and transverse strain εT are the measured values from the strain gauges, and measured point 1# is at mid-span, measured point 2# locates at the quarter span. The shear strain γ is calculated by γ = 2ε45° − (ε0° + ε90°). ε0°, ε45°, and ε90° are the measured values from the strain gauge rosette at 0°, 45°, and 90° direction, respectively. All strains develop in an identical manner: an inconspicuous linear growth period followed by a nonlinear sharp development, however the growth rate varies. For specimens with λ less than 0.5, all strains grow slower and mostly reach to yield at 0.8 Vfs − 0.95 Vfs. However for specimens with λ greater than 0.5, all strains get to yield at 0.6 Vfs − 0.8 Vfs. Meanwhile, the longitudinal strain εL1 in mid-span and the shear strain γ in quarter span always develop faster than other strains, indicating the failure is induced by a combination of shear stress and bending moment. The transverse strain εT1 in mid-span is positive for the specimens with λ less than 0.5 and becomes negative for the specimens with λ greater than 0.5. However the transverse strain εT2 in quarter span is always positive. This demonstrates that the confinement of steel tube in mid-span is affected by λ. When λ is higher than 0.5, steel tube in mid-span cannot provide effective confinement to concrete core.
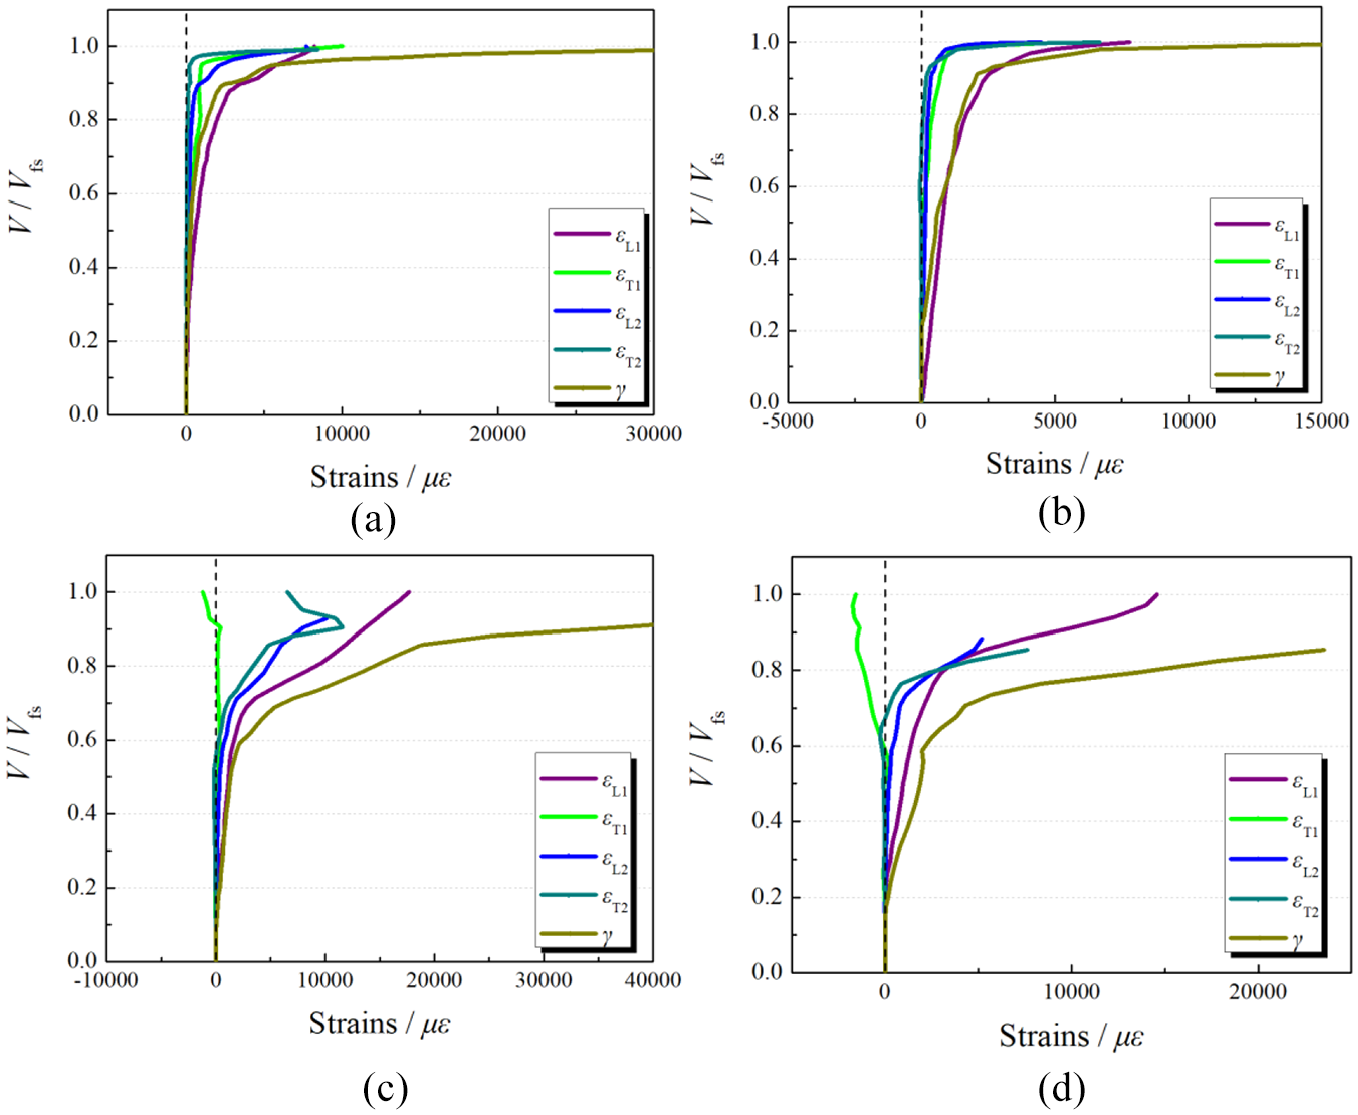
Typical relative load-strains curves: (a) λ = 0.20, (b) λ = 0.30, (c) λ = 0.50 and (d) λ = 0.75.
The influence of λ on the longitudinal strain εL1 in mid-span is shown in Figure 9. The tensile yield strain (εy) of steel pipe is labeled to analyze the stress state, which is calculated by εy = fy/Es. It is clear that as λ is increased, εL1 shows a rapid growth, consequently reaches to yield earlier. This fact demonstrates the bending moment in mid-span is improved with the rise of λ, gradually becoming the determinant of specimen failure.
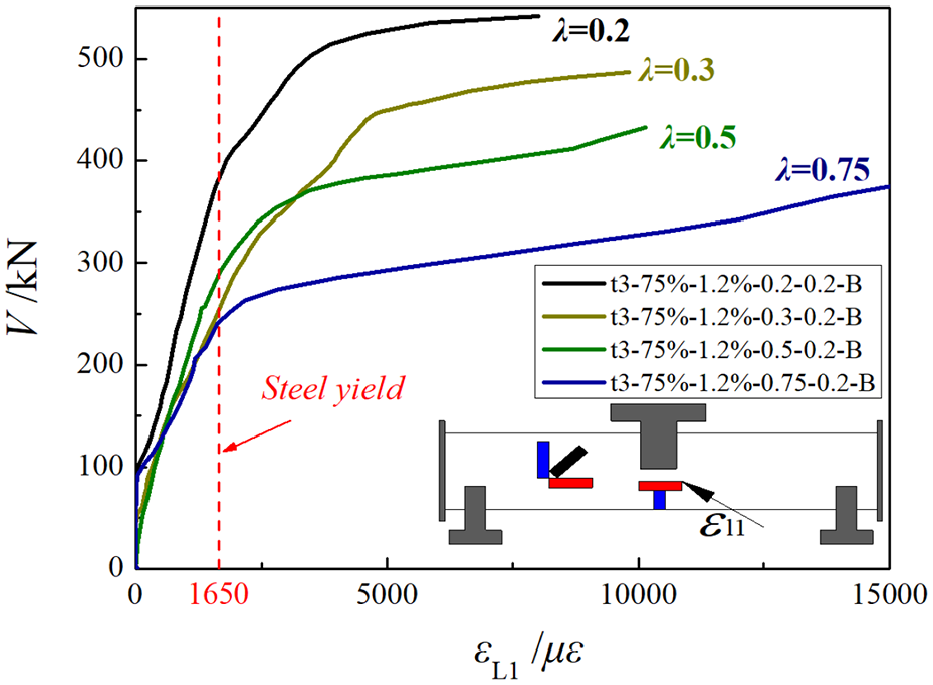
The effect of λ on the longitudinal strain εL1 in mid-span.
The effect of self-stress on the transverse strain εT1 in mid-span is presented in Figure 10. Before the steel yield, the εT1 in self-stress specimens develop faster than that in non-self-stress specimens. However the tendency is not uniform after the steel yield. It can be confirmed that due to the self-stress, steel tube provides higher confine stress to concrete core, which is in favor of the mechanical performance of the specimens. But this favorable effect is merely working in elastic stage, and fades away after the elastic-plastic stage.
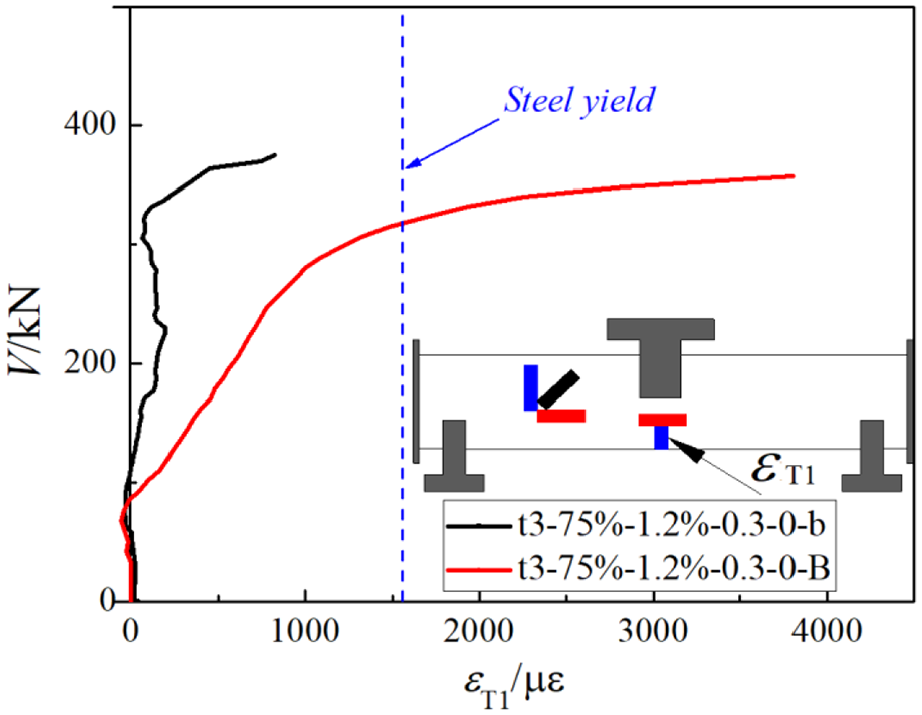
The effect of self-stress on the transverse strain εT1 in mid-span.
Prediction of shear capacity
Numerous methods have been proposed to predict the shear capacity of CFST stub columns, including contributions superposition method (Li et al., 2017a; Qian et al., 2007), plastic limit method (Wu and Peng, 2020), unified theory method (Ye et al., 2016), and so on. In the contributions superposition method, shear capacity is regarded as a sum of the contributions from steel tube, concrete core, and applied axial force. Individual contribution is predicted based on the material properties or regression analysis. The plastic limit method is developed on the ground of principle of virtual work. Unified theory prediction formulas are proposed based on a large number of experimental data and present high accuracy. In this study, the shear capacity is considered as a superposition of the steel tube and concrete core contributions, while the contribution of axial force is expressed as the improvement of concrete strength:

in which V0 is the pure shear capacity of CFST column. Vcc and Vst are the shear contributions of concrete core and steel tube, respectively. Ac and As are the section areas of concrete core and steel tube, respectively. fcv and fsv are the shear strength of concrete and steel, respectively.
When steel tube is only subjected to shear loading, the shear strength is approximated as (Cai, 2003; Chang et al., 2009)

in which fsy is the tensile strength of steel tube.
For the concrete core merely under lateral shear loads, the shear strength can be expressed as (GB 50936-2014, 2014)

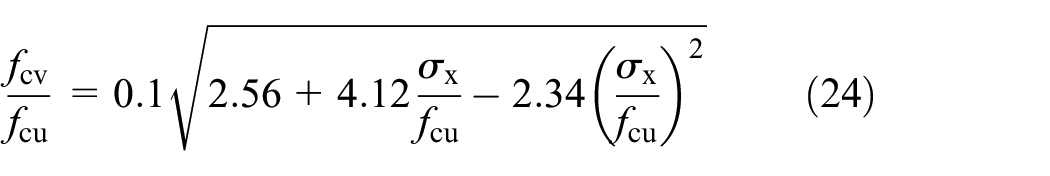
in which fc is the characteristic concrete strength and can be calculated as fc = 0.67fcu. For the steel fiber reinforced concrete, fcv is given as (CECS 38-2018, 2018)


where βv is the impact factor of shear capacity of steel fiber and chosen to 0.60 (CECS 38-2018, 2018). lf/df is the aspect ratio of steel fibers.
Given the favor benefit of self-stress, the widely accepted formulas of Mander et al. (1988) are used to modify fc:

where f′cc is the modified concrete strength, and σcr is the measured radial self-stress. According to Richart et al. (1928), the coefficients k1 is set as 4.1.
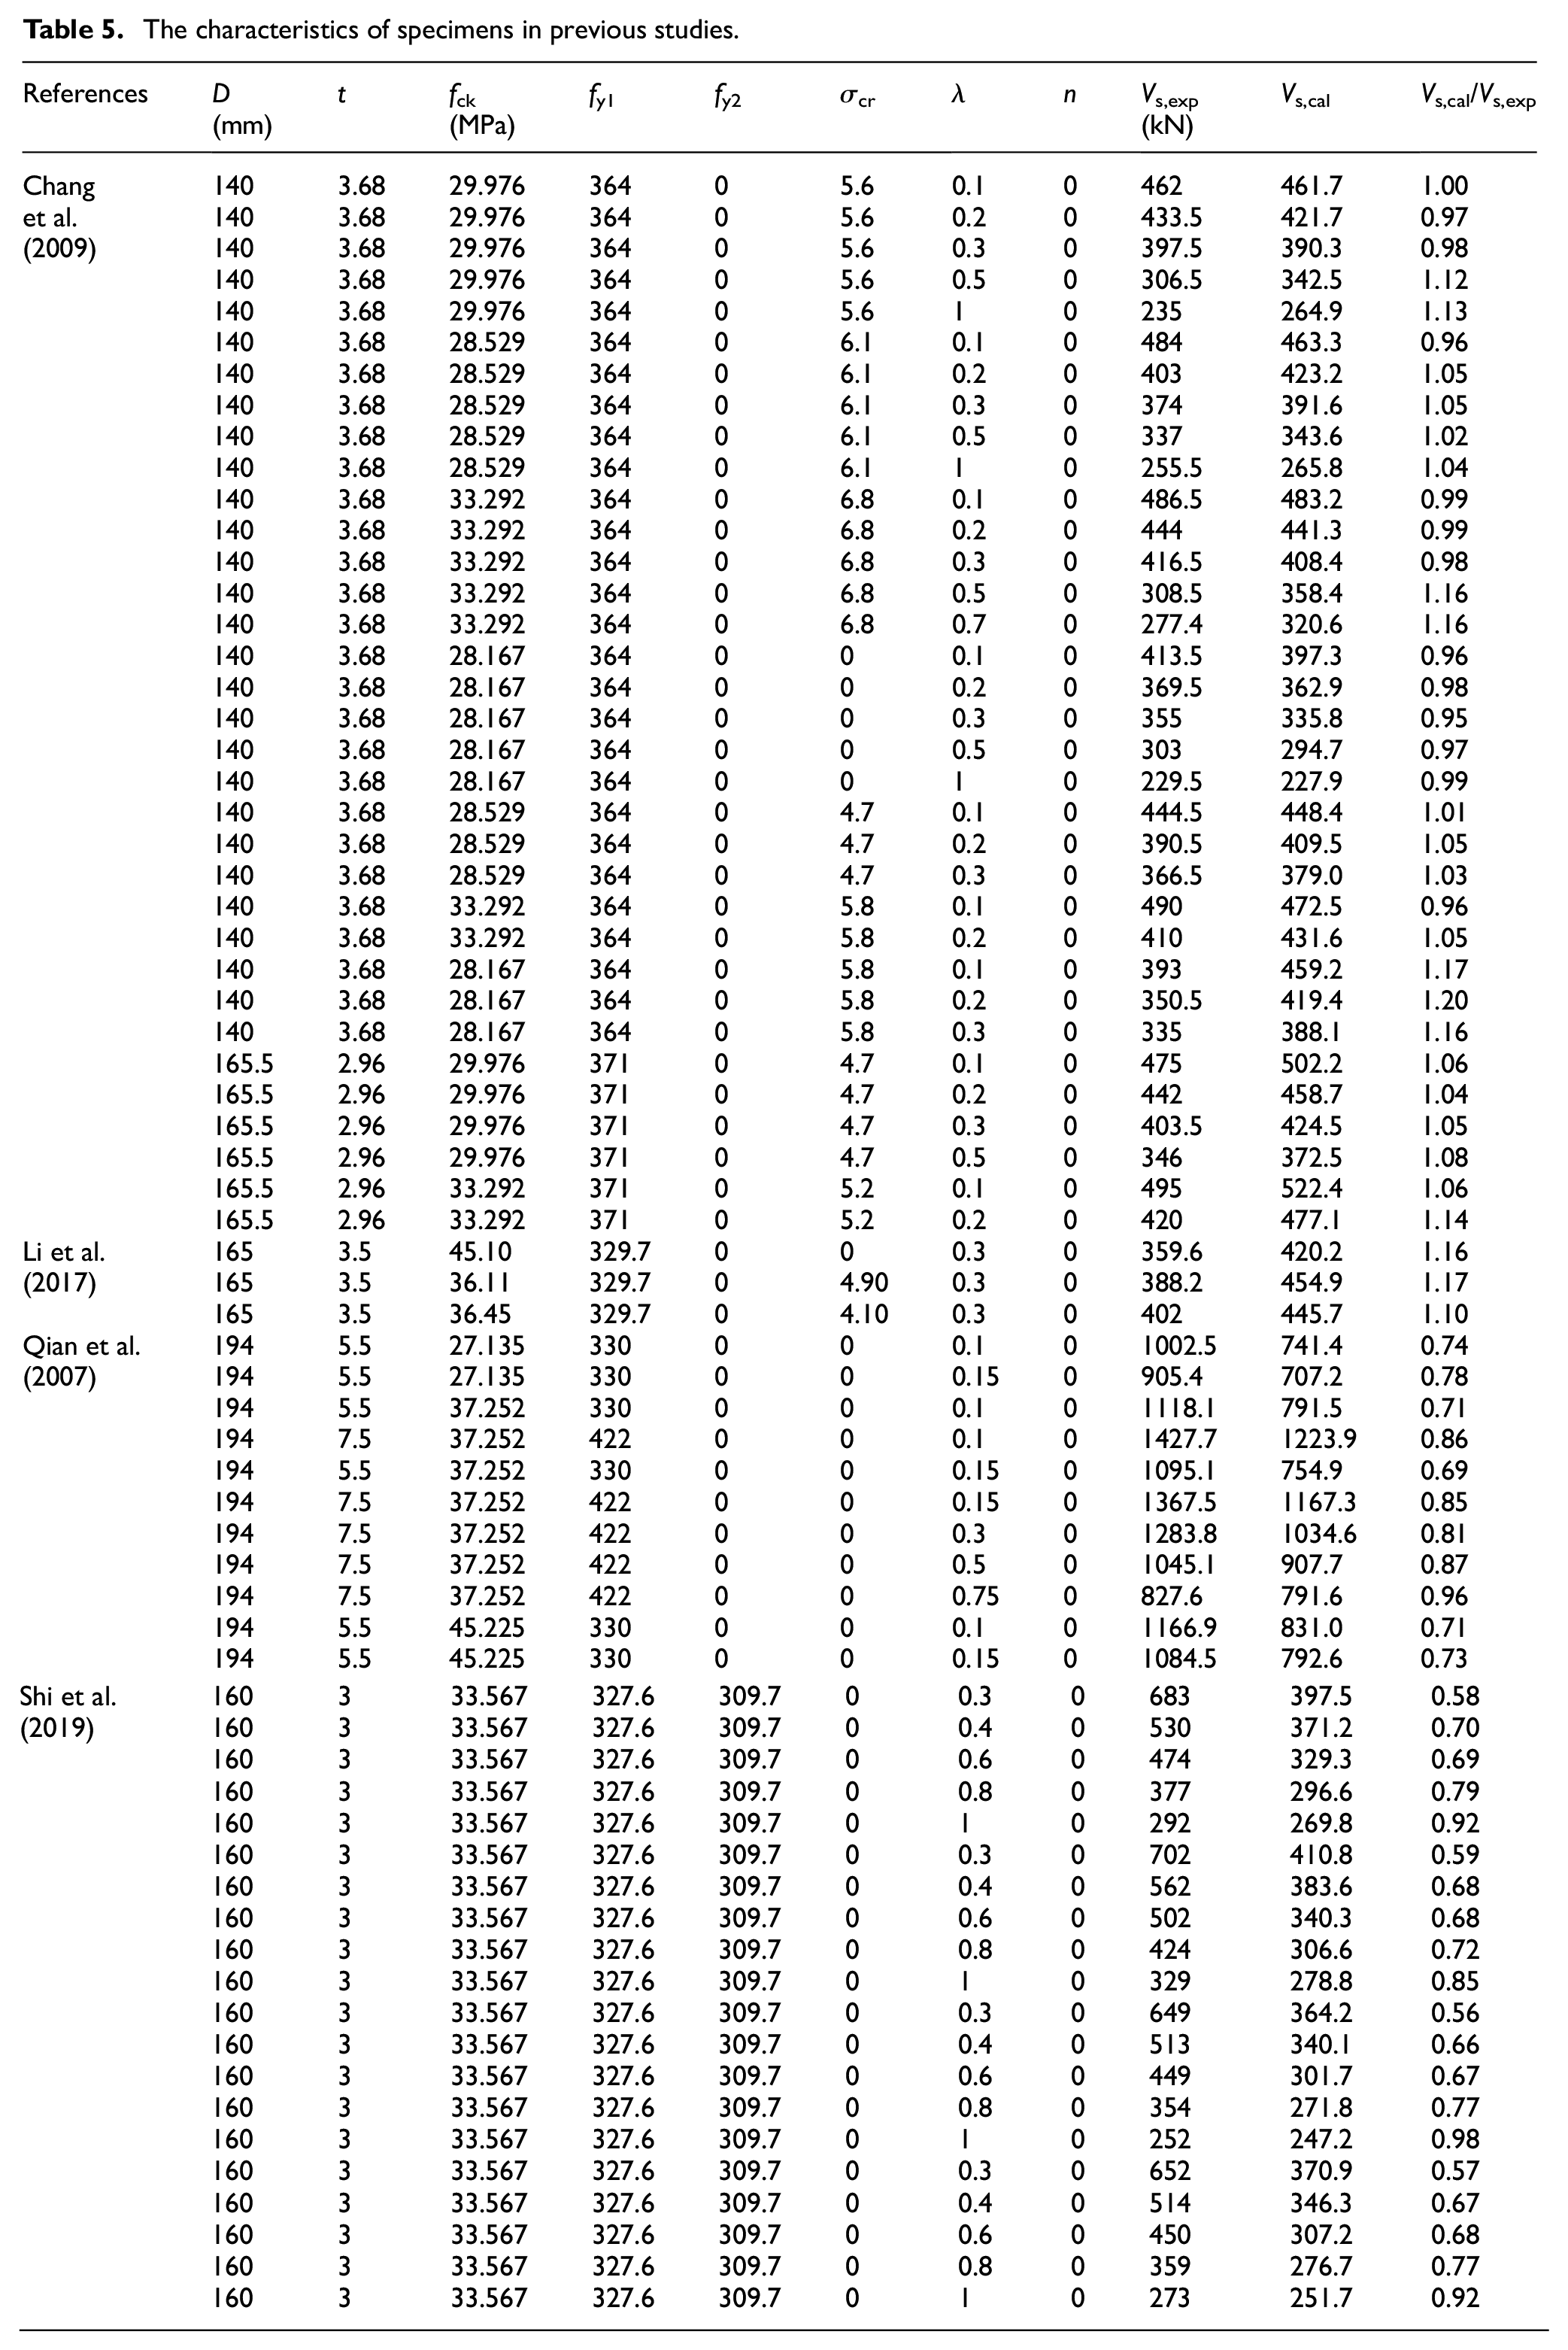
It is well-known that shear-span ratio λ plays a rather important role in the shear capacity, a total of 76 tested specimen data from this study and previous researches (Chang et al., 2009; Li et al., 2017a; Qian et al., 2007; Shi et al., 2019) are analyzed in Table 5. Figure 11(a) presents the relationship between λ and Vs,exp/V0, apparently nonlinear negative correlation is observed. By the regression analysis, the correlation can be expressed as:

The characteristics of specimens in previous studies.
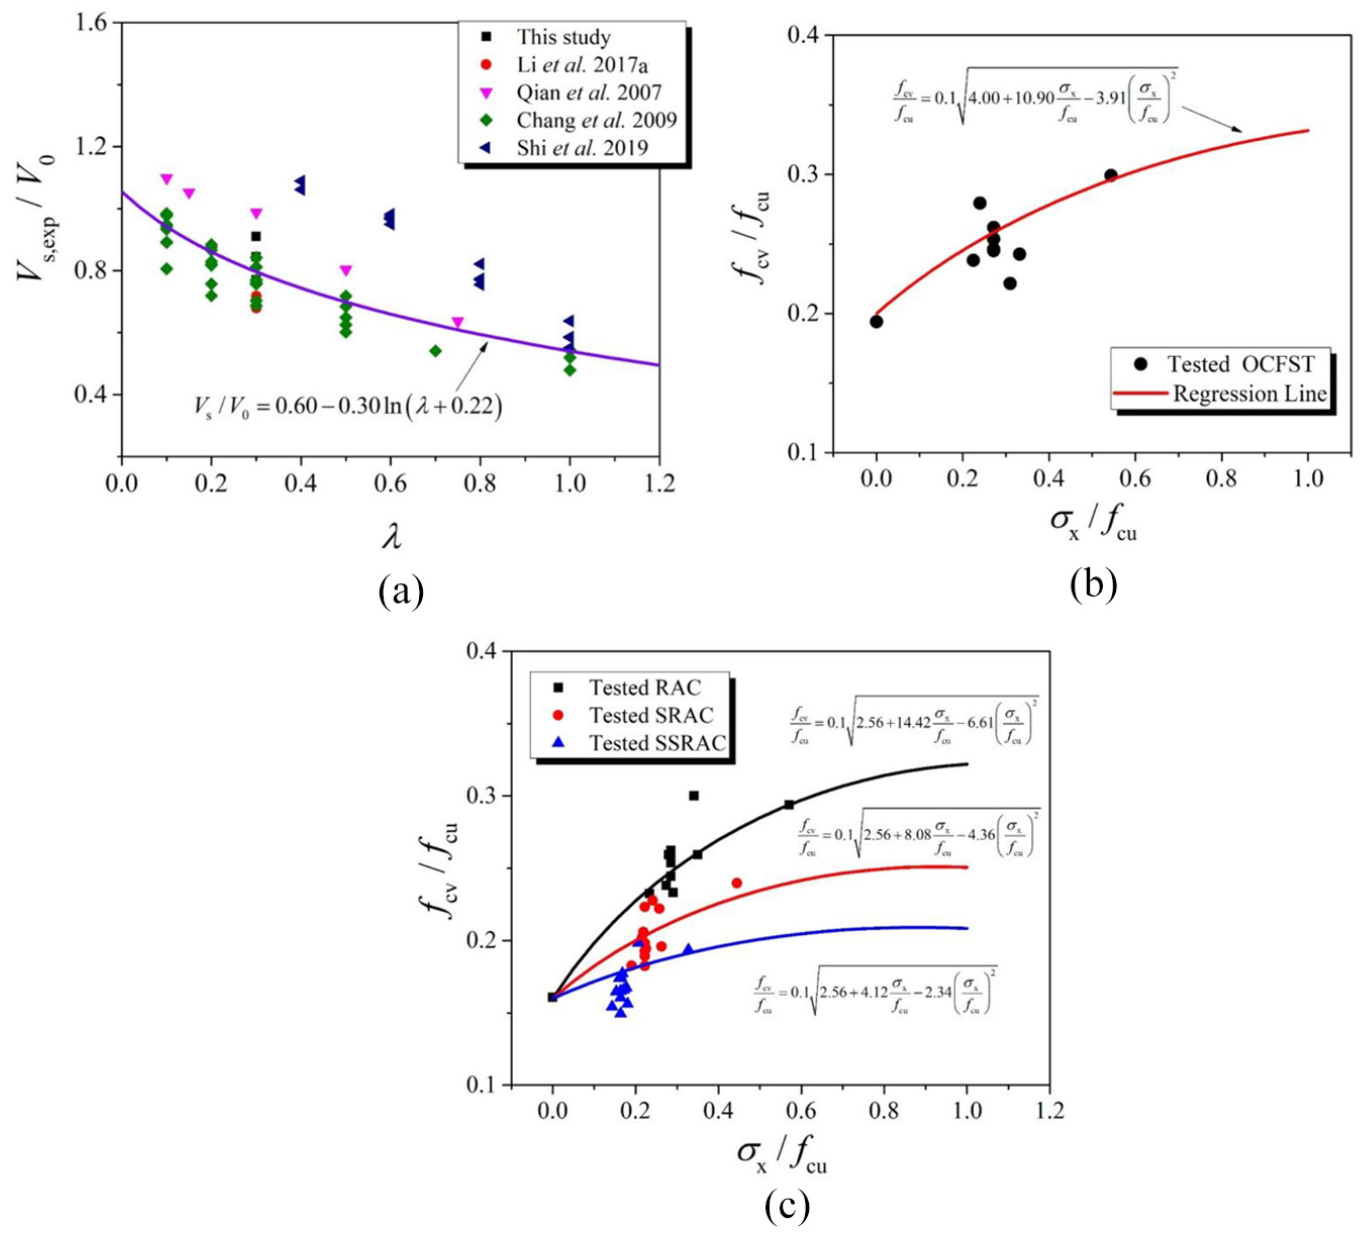
Regression analysis: (a) relationship between Vs/V0 and λ, (b) relationship between fcv/fcu and σx/fcu for OC and (c) relationship between fcv/fcu and σx/fcu for RAC.
As the axial load is applied, the shear strength of concrete core is improved due to the enhanced aggregate interlock effect. The strength criterion proposed by Bresler-Pister (Bresler and Pister, 1958) is used to predict the shear strength of concrete core under compressive-shear stress:
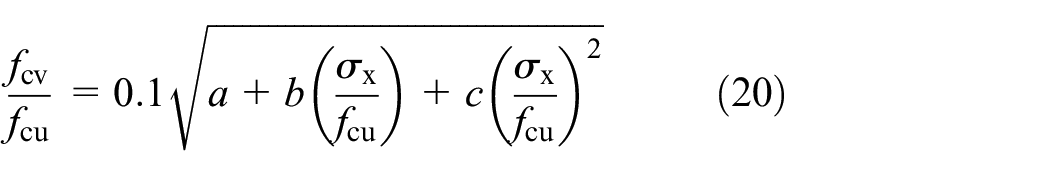
in which σx/fcu is the ratio of normal force to compressive strength. a, b, and c are the correlation coefficients. The relation between fcv/fcu and σx/fcu can be obtained by using regression method as shown in Figure 11(b) and (c):
For OC
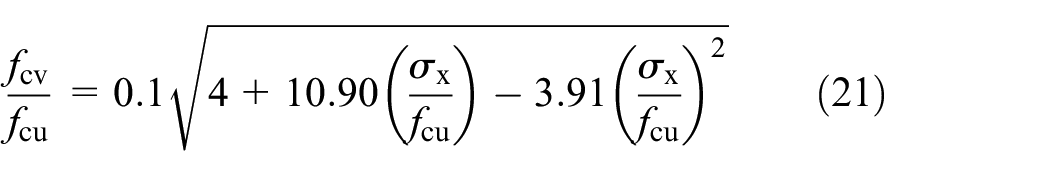
For RAC
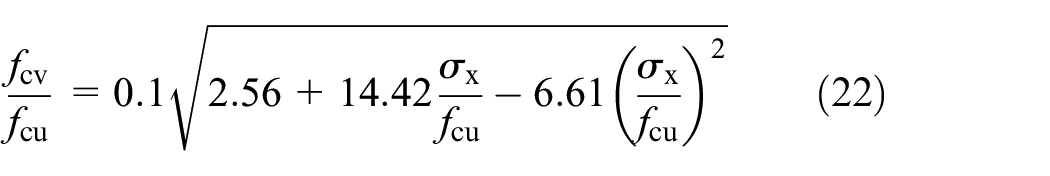
For SRAC
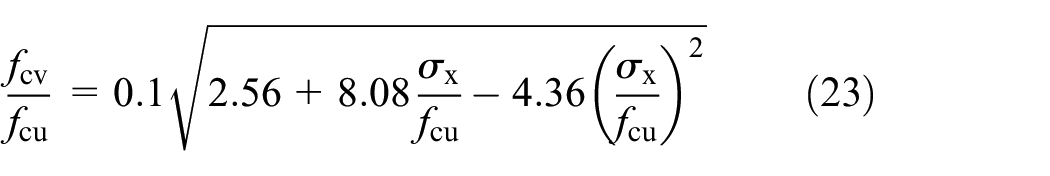
For SSRAC
The comparison between the predictions and tested results is shown in Figure 12. Through the concrete strength correction and the consideration of shear-span ratio, the predicted ones are in good agreement with the experimental ones. The mean value of Vs,cal/Vs,exp is 0.959 with the corresponding standard deviation of 0.153.
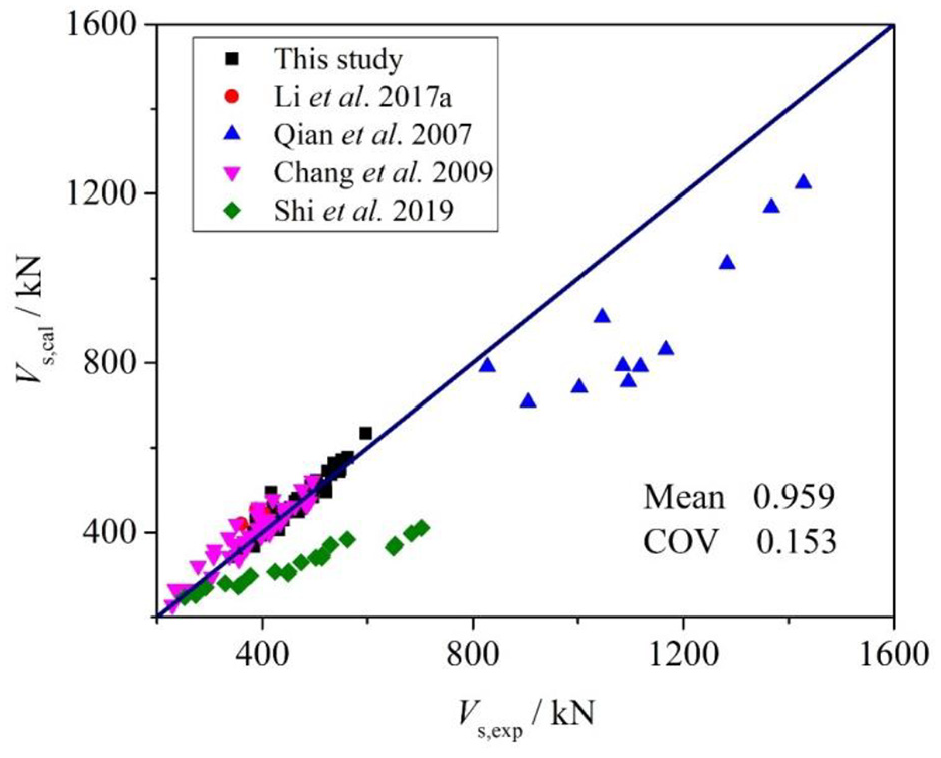
Comparison between the tested and predicted results.
Conclusions
This study conducts an innovative approach to realize the high added value utilization of recycled aggregate. A total of 50 specimens are tested to investigate the shear performance of steel-fiber-reinforced recycled concrete filled steel tube (SRCFST) columns. Based on the test results and comprehensive analyses, the following conclusion can be drawn:
The failure of SRCFST columns under lateral shear loads is coincident with the ordinary CFST columns, which is lied on the shear span ratio λ. As λ is increased, the failure is changed from shear-governed to flexure-governed. This is due to the aggravating bending moment of the cross section. With the development of λ, the shear resistance of SRCFST columns shows a downtrend, while the resistance to bending is increased.
The alternative of NCA by RCA causes the little-to-no influence on the shear capacity Vfs, which is economical and high-efficiency method to reuse RCA. Because the adverse impact of RCA is diminished by the constraint of steel fiber and steel tube. Self-stress can introduce higher confine stress to concrete core, which is in favor of the mechanical performance of the specimens. But this favorable effect is merely working in elastic stage, and fades away after the elastic-plastic stage.
Imposing axial compression or thickening steel tube can stimulate potential bearing capacity after the shear capacity, thereby providing adequate safety shear margin in plastic period.
Based on the contributions superposition method, a predicted model of the shear capacity of SRCFST columns is proposed in consideration of shear-span ratio, axial compression, and self-stress. The predictions are correlated well with the tested results.
Footnotes
Declaration of conflicting interests
The author(s) declared no potential conflicts of interest with respect to the research, authorship, and/or publication of this article.
Funding
The author(s) disclosed receipt of the following financial support for the research, authorship, and/or publication of this article: This study was funded by the Special Project on Technical Innovation of Hubei (grant number 2019ACA142) and Special Project on Application Fundamental Frontier Research of Wuhan (grant number 2019020701011465).