



Abstract
This paper investigated the cyclic performance of arched steel haunches as a new strategy in the seismic retrofitting of reinforced concrete frames and focused on the slenderness ratio effect. A series of cyclic loading were conducted on six test specimens in two groups with the same nominal length and different axial eccentricities of 0.1 and 0.2 nominal length and with out-of-plane slenderness ratios of 138, 69, and 16. Experimental results indicated that the slenderness ratio played a very important role on cyclic performance in compression and even tension, so that a more desirable hysteretic behavior was achieved when the overall buckling potential was restricted. Therefore, by reducing this ratio, the maximum compressive and tensile strengths increased up to 1.78 and 1.28 times, respectively, and also the dissipated energy and maximum viscous damping upgraded up to 3.32 and 1.43 times, respectively. More difference in tensile and compressive behavior for ultimate strength and plastic stiffness was observed, when the initial eccentricity decreased. Also, with twice increase in the initial eccentricity, the cross-sectional area effect on the maximum strength and plastic stiffness decreased, especially in tension, so that despite the same slenderness ratio and 70% increase in cross-sectional area, these values in tension descended up to 1.31 and 3.5 times, respectively. In addition, the compressive plastic stiffness degraded about 77% due to more degradation in plastic strength.
Introduction
Haunch Retrofit Solution (HRS) was suggested by Yu et al. (2000) after the destructive Northridge earthquake in 1994, following the brittle failure of welded connections of steel moment frames. In the past years, straight haunches have been introduced for the seismic retrofitting of reinforced concrete (RC) frames as the single and double procedures. Chen (2006) and Pampanin et al. (2006) employed this technique for the first time in seismic retrofitting of RC beam-column joints experimentally. The main idea in these researches was to relocate the plastic hinge from the RC joint to the beam member, which rendered satisfactory results. Then, many researchers utilized this technique as double or single by various schemes and materials for upgradation/retrofitting in RC beam-column sub-assembly and structural frames levels; as the steel prop and curb (Emami et al., 2015a, 2015b; Khalili et al., 2015; Kheyroddin et al., 2016; Sharbatdar et al., 2012), fully fastened HRS (Marchisella et al., 2021; Sharma et al., 2014), single bracing system of shape memory alloy (Sasmal and Nath, 2017), strut-relieved single steel haunch bracing (Sasmal and Voggu, 2018), buckling-restrained and energy dissipating haunches (Akbar et al., 2018; Kim et al., 2014; Wang et al., 2017), with RC haunch (Akbar et al., 2019) and haunch viscoelastic damping braces (Dong et al., 2019; Zhou et al., 2011). Furthermore, several studies were developed by Tasligedik et al. (2016), Sasmal and Nath (2017), Zabihi et al. (2018), Sasmal and Voggu (2018), Kheyroddin et al. (2019), and Emami et al. (2020) for design and optimization of the steel haunches using the compatibility relationships between steel haunch and RC members, and based on strength hierarchy principles.
Hsu and Halim (2017) evaluated the cyclic performance of steel frames, including steel curved dampers (SCDs) with different lengths and angles between the two ends of the arc. These researchers also carried out experimental and numerical studies on new A-braced frames equipped with SCDs (Hsu and Halim, 2018; Halim and Hsu, 2020). The applicability of arc elements as curved steel knee braces (CSKBs) under cyclic loading were investigated by many researchers (Li et al., 2021a, 2021b; Zhou et al., 2019). Zhou et al. (2019) proposed a simplified behavioral model and evaluated the cyclic behavior of three test specimens of CSKBs. Li et al. (2021a, 2021b) proposed this technique for upgrading the seismic resilience of beam-through steel frame systems (BTF). They carried out a series of cyclic tests to evaluate the seismic behavior of semi-rigid beam-to-column joints equipped by curved knee braces with rectangular and T-shaped cross-sections. They expressed that by concentrating damages at the CSKBs, the expected damage sequences achieved as well as desirable ductility and stable hysteretic response up to 7% drift ratio which failure occurred. Tsang (2019) proposed a special configuration of architectural bracket, including an arch knee brace plus a supporting circular ring as a novel idea of upscaling architectural elements for structural upgrading. In this research, using analytical study the design formulations for various structural forms and boundary conditions as well as required dimensions of architectural brackets for seismic retrofitting of concrete beam-column joints were developed for various seismic hazard levels.
Recently, Emami et al. (2021a, 2021b) proposed a less-invasive element, as arched steel haunches (ASHs) for seismic retrofitting of RC frames. They suggested two simplified behavioral models for the ASHs with and without overall buckling potential, and evaluated the cyclic behavior of eight test specimens of ASHs. They resulted that ASHs can be utilized in two various scenarios for upgrading/retrofitting of RC frames; as a fuse or hysteretic device for improvement of the strength and energy dissipation, and as a stiff element for relocating of plastic hinges from joint region to beam members.
The present study extends a new technique for retrofitting of RC frames previously introduced by the authors (Emami et al., 2021a, 2021b) which is more compatible with building architectural space. To evaluate the seismic behavior of RC frames retrofitted by ASHs, it is first necessary to investigate the ASHs cyclic performance independently. Therefore, an experimental study is conducted on six ASH specimens at two groups, the results of which are discussed with emphasis on their eccentricity and slenderness ratios. In addition, before experimental work, parameters effect such as the initial axial eccentricity and slenderness ratio on their elastic stiffness, yield and plastic limit strength and buckling behavior are investigated by analytical formulations.
Mechanical properties of ASHs
In Figure 1, 3D view of a RC moment frame retrofitted by the single ASHs technique is shown. As can be seen from the figure, the proposed technique is less-invasive and more architecturally compatible than straight haunches in terms of building interior space. ASHs can be connected to the steel plates mounted on the RC frame as a prefabricated member by bolt or pin-connections, as shown in Figure 1. In addition, the connection steel plates can be also attached to RC members by anchor bolts or other various methods. Retrofitting scenario of RC frame with single ASHs.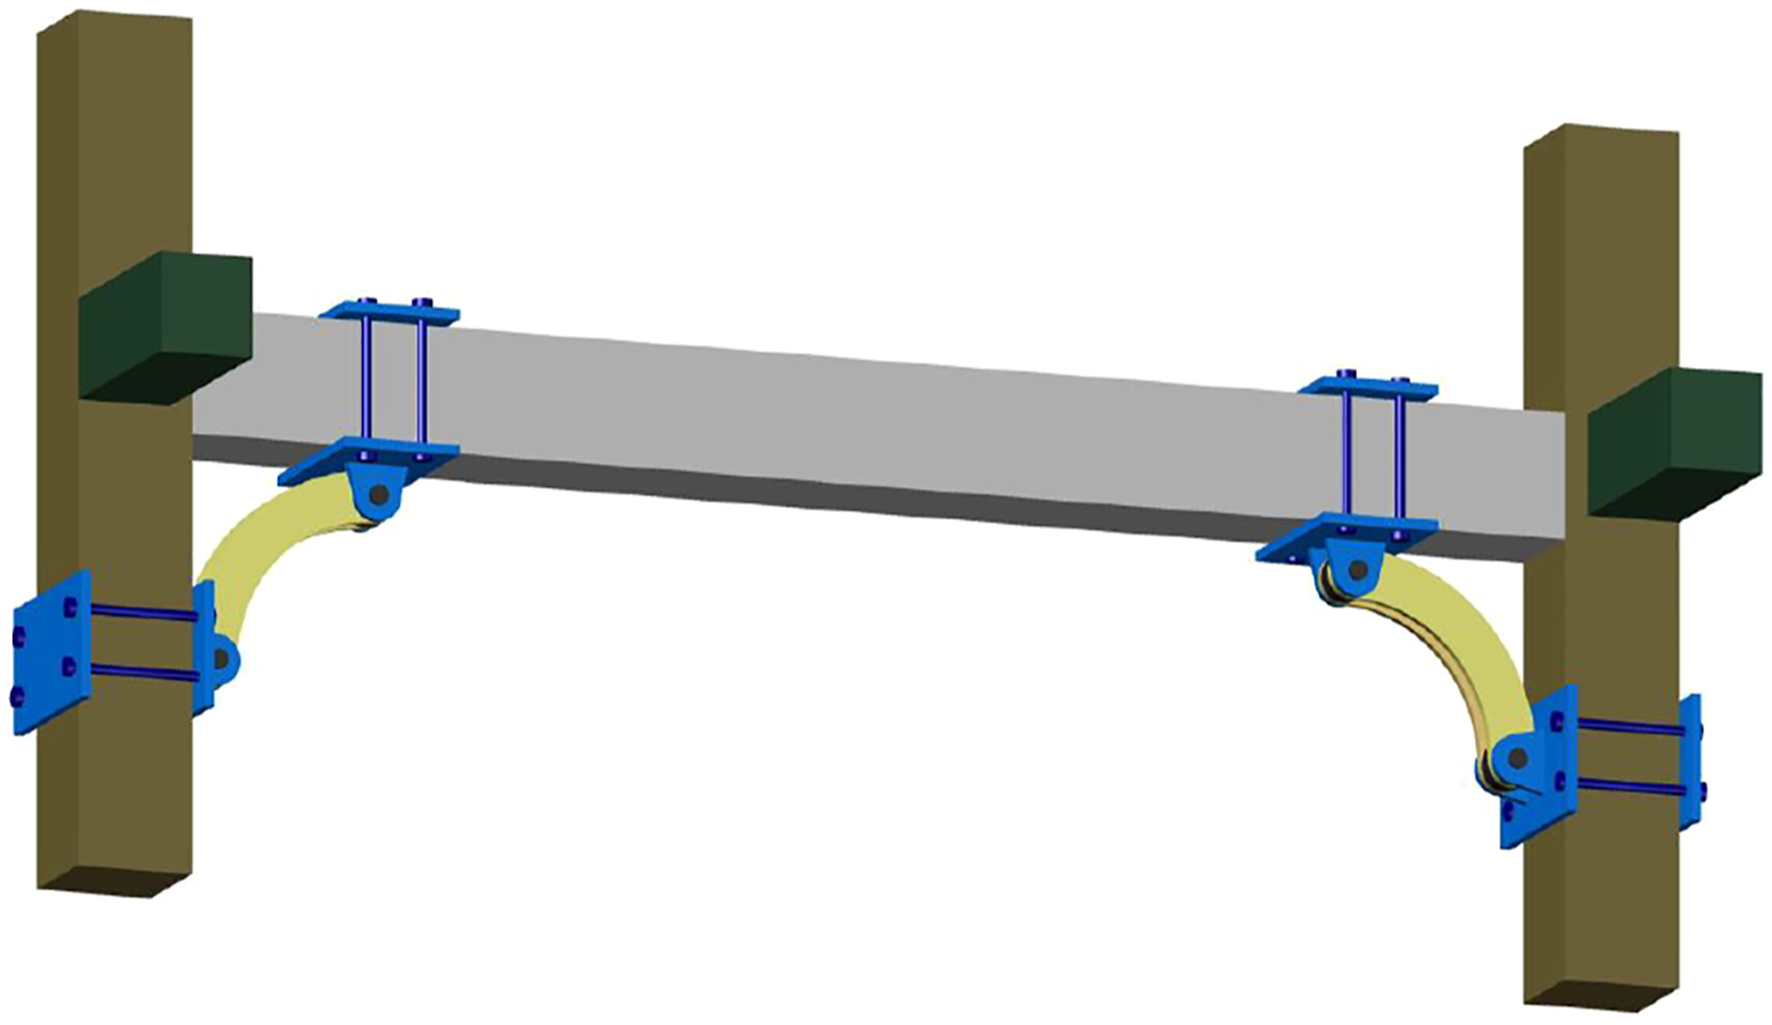
Based on static equations, the originated internal reactions due to lateral load on retrofitted RC frame can be assumed as shear forces at its deformation inflection points (i.e., length middle of the beam and column members). These reactions incur the shear interaction forces, β
b
V
b
at the ASHs-beam connection regions (as shown in Figure 16(b) at Appendix). Furthermore, the beam shear interaction coefficient β
b
can be achieved using deformation compatibility relationships between RC members and ASHs (Appendix). That can be rewritten as follow

Note that by determining of K
h
and β
b
values, the appropriate ASH can be design based on the target performance objectives as well as the strength hierarchy principles (Emami et al., 2021a, 2021b; Kheyroddin et al., 2019; Pampanin et al., 2006; Sasmal and Nath, 2017; Zabihi et al., 2018; Sasmal and Voggu, 2018). Note that the resultant force, F
h
exerted on two ends of the arc in the chord direction is equal to

Geometrical structure
In this study, ASHs are configured from a curved part with two connection holes (with 22 mm diameter) at both ends, as shown at Figure 2(a). The axis of the curved part (i.e. red dot-dashed line) is a circle arch with the radius R and center angle 2α, which at its middle has an axial eccentricity equal to e (a) Geometric properties of ASHs and (b) Types of studies ASHs cross-sections.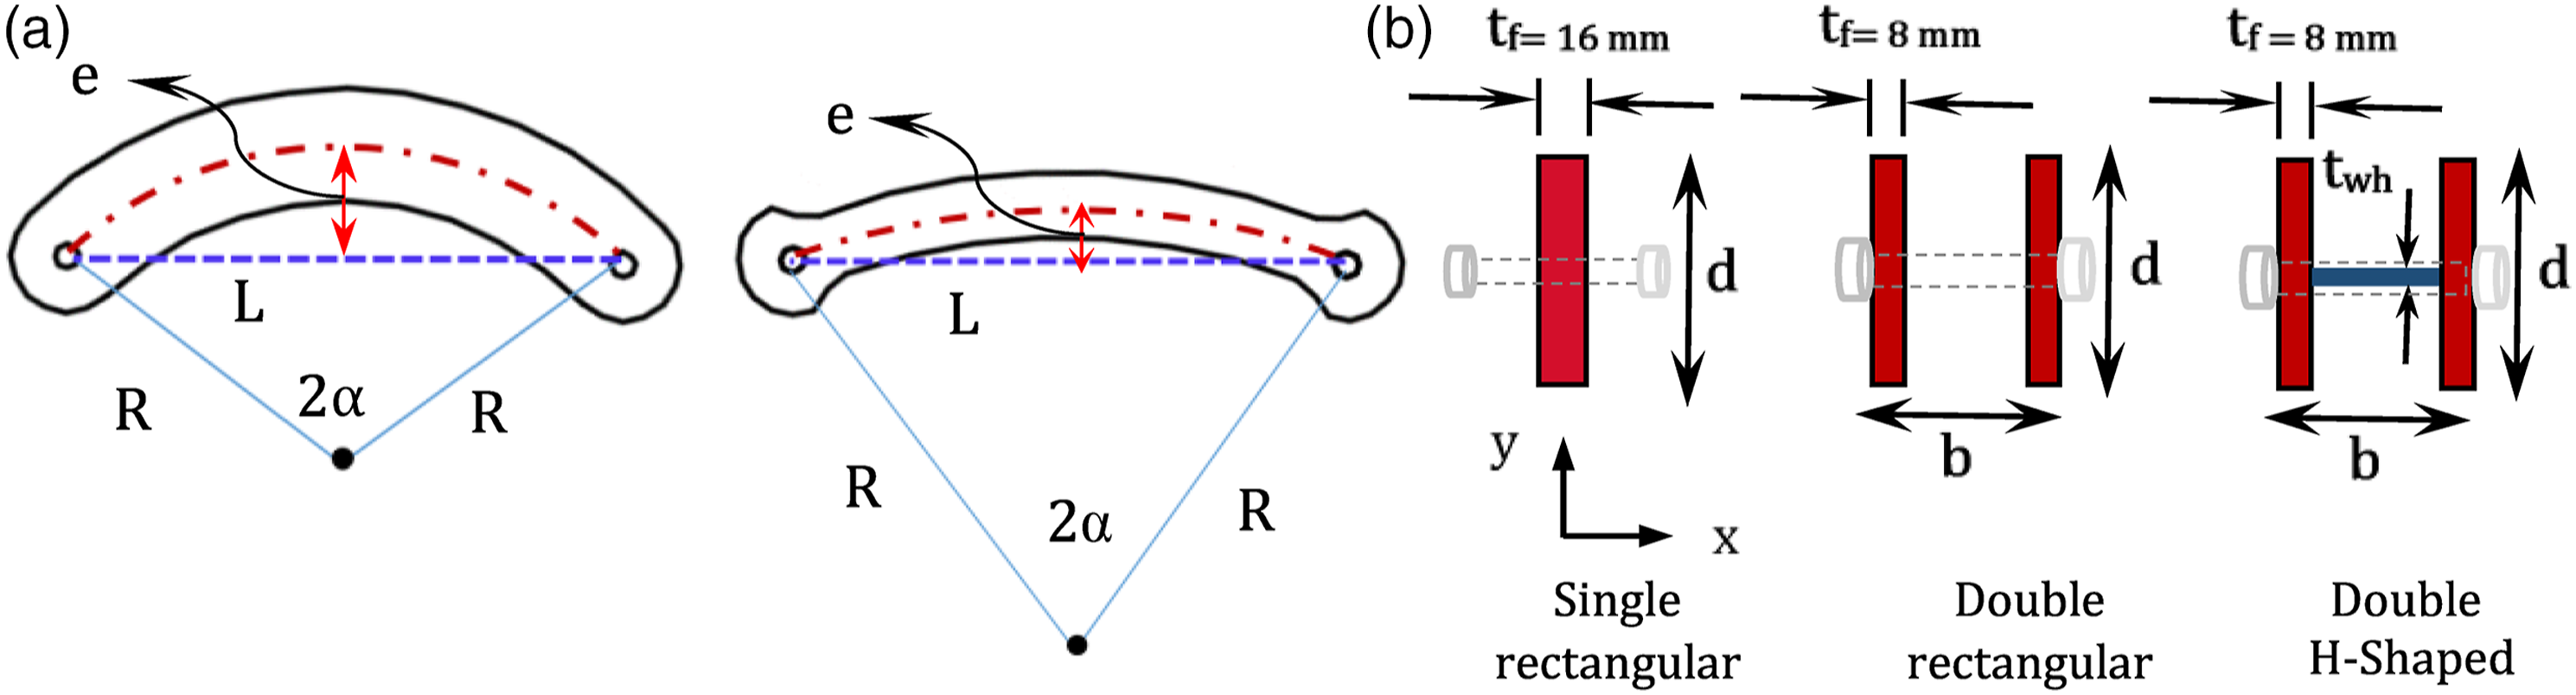


As can be seen from equations (3) and (4), the both values of L and e are defined as a function of the radius and central angle of the arch. Note that ASHs act as beam-column members due to their axial eccentricity under two-end forces reactions and are subjected to critical stress at their concave middle edge.
Elastic stiffness
To evaluate the ASHs cyclic performance separately based on the interaction force nature described in the Mechanical Properties of ASHs section, a horizontal loading system is schematically assumed, as shown in Figure 3(a). Note that the additional explanations about loading system are described in the Test Set-Up section. According to Figure 16 (as shown in Appendix), when a RC beam-column joint sub-assemblage equipped by an ASH is subjected to lateral seismic loading (i.e., V
b
or β
b
V
b
), the main displacement of the beam-haunch connection region is in the vertical direction. Therefore, the ASH deformation under vertical seismic loading by 90° rotation can be simulated by horizontally loading system, as displayed in Figure 3. Moreover, it can be said that the vertical seismic demand of β
b
V
b
in Figure 19 is corresponded to the horizontal cyclic loading (i.e., F= β
b
V
b
), as shown in Figure 3. (a) Stimulated loading system of ASH, (b) Deformation in tension, and (c) Deformation in compression.
Figure 3 shows the ASH deformation in tension and compression subjected to cyclic loading of the F. It can be concluded that the force F and its corresponding displacement Δ are equivalent to F
h
.cosθ and δ.cosθ, respectively, in which δ is defined as ASH deformation in chord direction. Accordingly, the horizontal elastic stiffness, K
e
, of the system can be calculated under the F and Δ in terms of axial, flexural and shear deformations using Castigliano’s second theorem. In other words, by calculating the horizontal component of chord stiffness (K
h
) and after simplifying, K
e
can be expressed using the following equation

A and λ
x
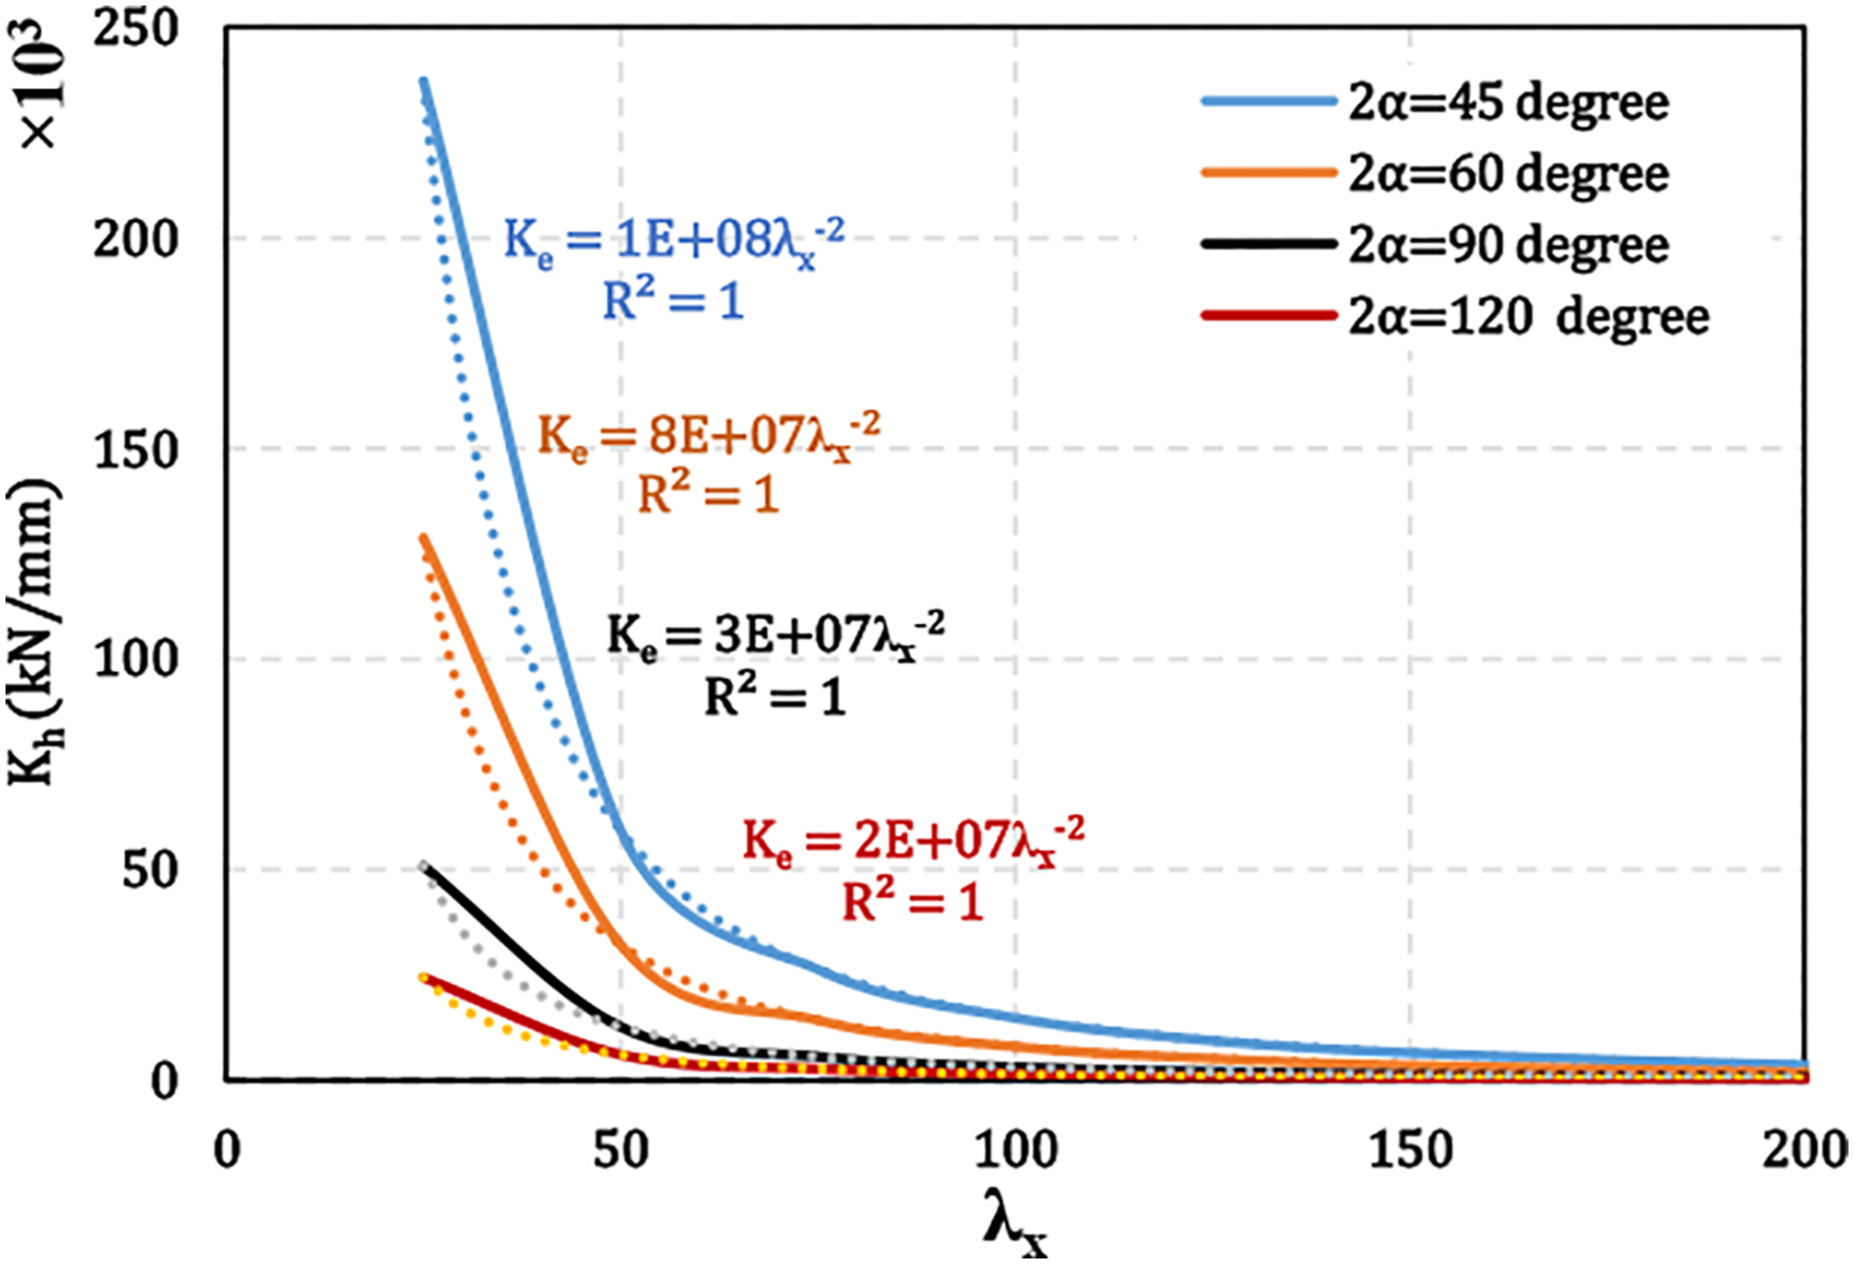
are the ASH cross-sectional area and the slenderness ratio about major bending axis, respectively. E is the ASH material elasticity modulus. Based on this equation, the λx value with second-order power has a significant effect on the K
e
value and can be computed using the following expression The in-plane slenderness ratio (λx) effect on the chord stiffness (K
h
).

Yield, plastic and buckling strength
As mentioned above, the ASH horizontal load F is equivalent to the horizontal component of its two-end reactions resultant, F
h
(i.e., in the arch chord direction). Moreover, based on the ASH geometry, that is subjected to a combination of axial force P, and bending moment M, against compressive and tensile loads (i.e., F
–
and F
+
). Based on the analytical relationships, the maximum axial stress in both tensile and compressive states occurs at the critical section namely, the concave edge of ASH middle region. Therefore, assuming that the yielding set in this region, the ASH yield strength F
y
can be extracted according to linear interaction


In addition, the horizontal plastic strength

The horizontal plastic strength can also be estimated according to the second-order interaction as


The ASH strength after the plastic hinge formation at the critical section can be captured by its geometric deformation, that is, updated value of e. Thus, it can be predicted that the strength after the plastic stage increases by decreasing the amount of e
t
in tension, and conversely that by increasing the amount of e
c
in compression decreases even without buckling potential (Emami et al., 2021a). If an ASH before reaching the fully plastic strength be subjected to overall buckling phenomenon due to its high out-of-plane slenderness, then their limit strength corresponding to buckling force F
cr
can be estimated based on the second-order interaction as

Moreover, if there is no overall buckling potential in the ASHs (λy ≤ λx), then the yield and plastic strength in tension and compression can be captured by in-plane geometric properties of their cross-section, that is, λx value. Alternatively, if λy > λx and overall buckling be occurred, then the compressive capacity is directly captured by their slenderness ratio of λy. It seems that overall buckling potential at the ASHs, unlike the straight haunches, can also be affected by their e value and in-plane performance. In other words, as ever the e value be larger, the value of λ y somewhat must be more than λ x until overall buckling occurred.
Experimental program
Test specimens
Figure 5 exhibits the 3D schematic view and geometric configuration of the test specimens. The geometric characteristics of the test specimens in details are also listed in Table 1. Generally, the nominal length (L) of all test specimens is 500 mm and those are classified into two groups by central angles (2α) of 45 and 90° or axial eccentricity (e) of 0.1 and 0.2 L, respectively, as shown in Figure 2(a). The ASHs design parameters such as λ
y
, γ and width-to-thickness ratio (d/t
f
) are also presented in Table 1. It should be noted that the λ
x
value for the first and second group specimens are about 30 and 17, respectively. The specimen’s dimensions were designed to have an elastic stiffness close to each other and to be suitable for future studies on seismic retrofitting of half scale RC beam-column joint. In addition, their cross-sections at each group were adopted as double and single from 8 mm and 16 mm steel plates, respectively (see Figure 2(b)). According to Figures 2 and 5, the back-to-back spacing of four specimens with double cross-section are b = 50 mm, which two of those (HAF) were stiffened by vertical and axial web plates along with a middle gap. Therefore, it can be observed from Figures 2 and 5 that the general configuration in two specimens (HA) is as rectangular and in two other (HAF) are H-shaped. Naturally, despite the middle gap in the axial web, it can be stated that middle cross-section of all specimens at each group are as rectangular and with the same area. However, each group’s specimens with almost similar chord stiffness have different cross-sectional areas. Note that the thickness of vertical and axial web plates (i.e., t
wv
, and t
wa
, respectively) in HAF specimens is equal to 5 mm. In addition, the circular solid fillers were used to fill the gaps at two end pin-connections. It should be noted that in estimation of λ
x
and λ
y
, based on AISC code provision (2016), the k values for hinged and fixed end-supports are assumed to be 1.0 and 0.65, respectively. 3D schematic view of the ASH specimens: (a) HA 0.1, (b) HAS 0.1, (c) HAF 0.1, (d) HA 0.2, (e) HAS 0.2, and (f) HAF 0.2. Geometric characteristics of ASHs.

Mechanical specifications of used steel plates.

Test set-up
To evaluate the cyclic behavior of ASH specimens, a set-up system was prepared, as displayed in Figure 6. For horizontal cyclic loading, a hydraulic jack was applied with 250 and 500 kN capacities in tension and compression, respectively, with 170 mm stroke. The cyclic load was controlled by a load cell with 500 kN capacity and transferred by a rigid vertical column from the hydraulic jack to ASH specimens using a hinged connection. The rigid column consisted of IPB160 with bottom-hinged connection, which was installed on a fixed rigid base on the strong floor. Note that the rigid column web was bilaterally stiffened by 12 steel plates with 10 mm thickness at incurred cyclic loading position, as shown in Figure 6(a). Each test specimen was also pin-connected by a high-strength grade 12.9 bolt with 20 mm diameter to the rigid column on one side and a short column fixed on the strong floor on the other side. As can be seen in Figure 6, each pin-connection consisted of a steel plate with 20 mm thickness and a pair welded gusset plates with a net distance of 50 mm. The middle axis of the gusset plates had a 22 mm diameter hole for passing of the connection bolt. Test set-up system: (a) Real view and (b) 2D and 3D schematic views.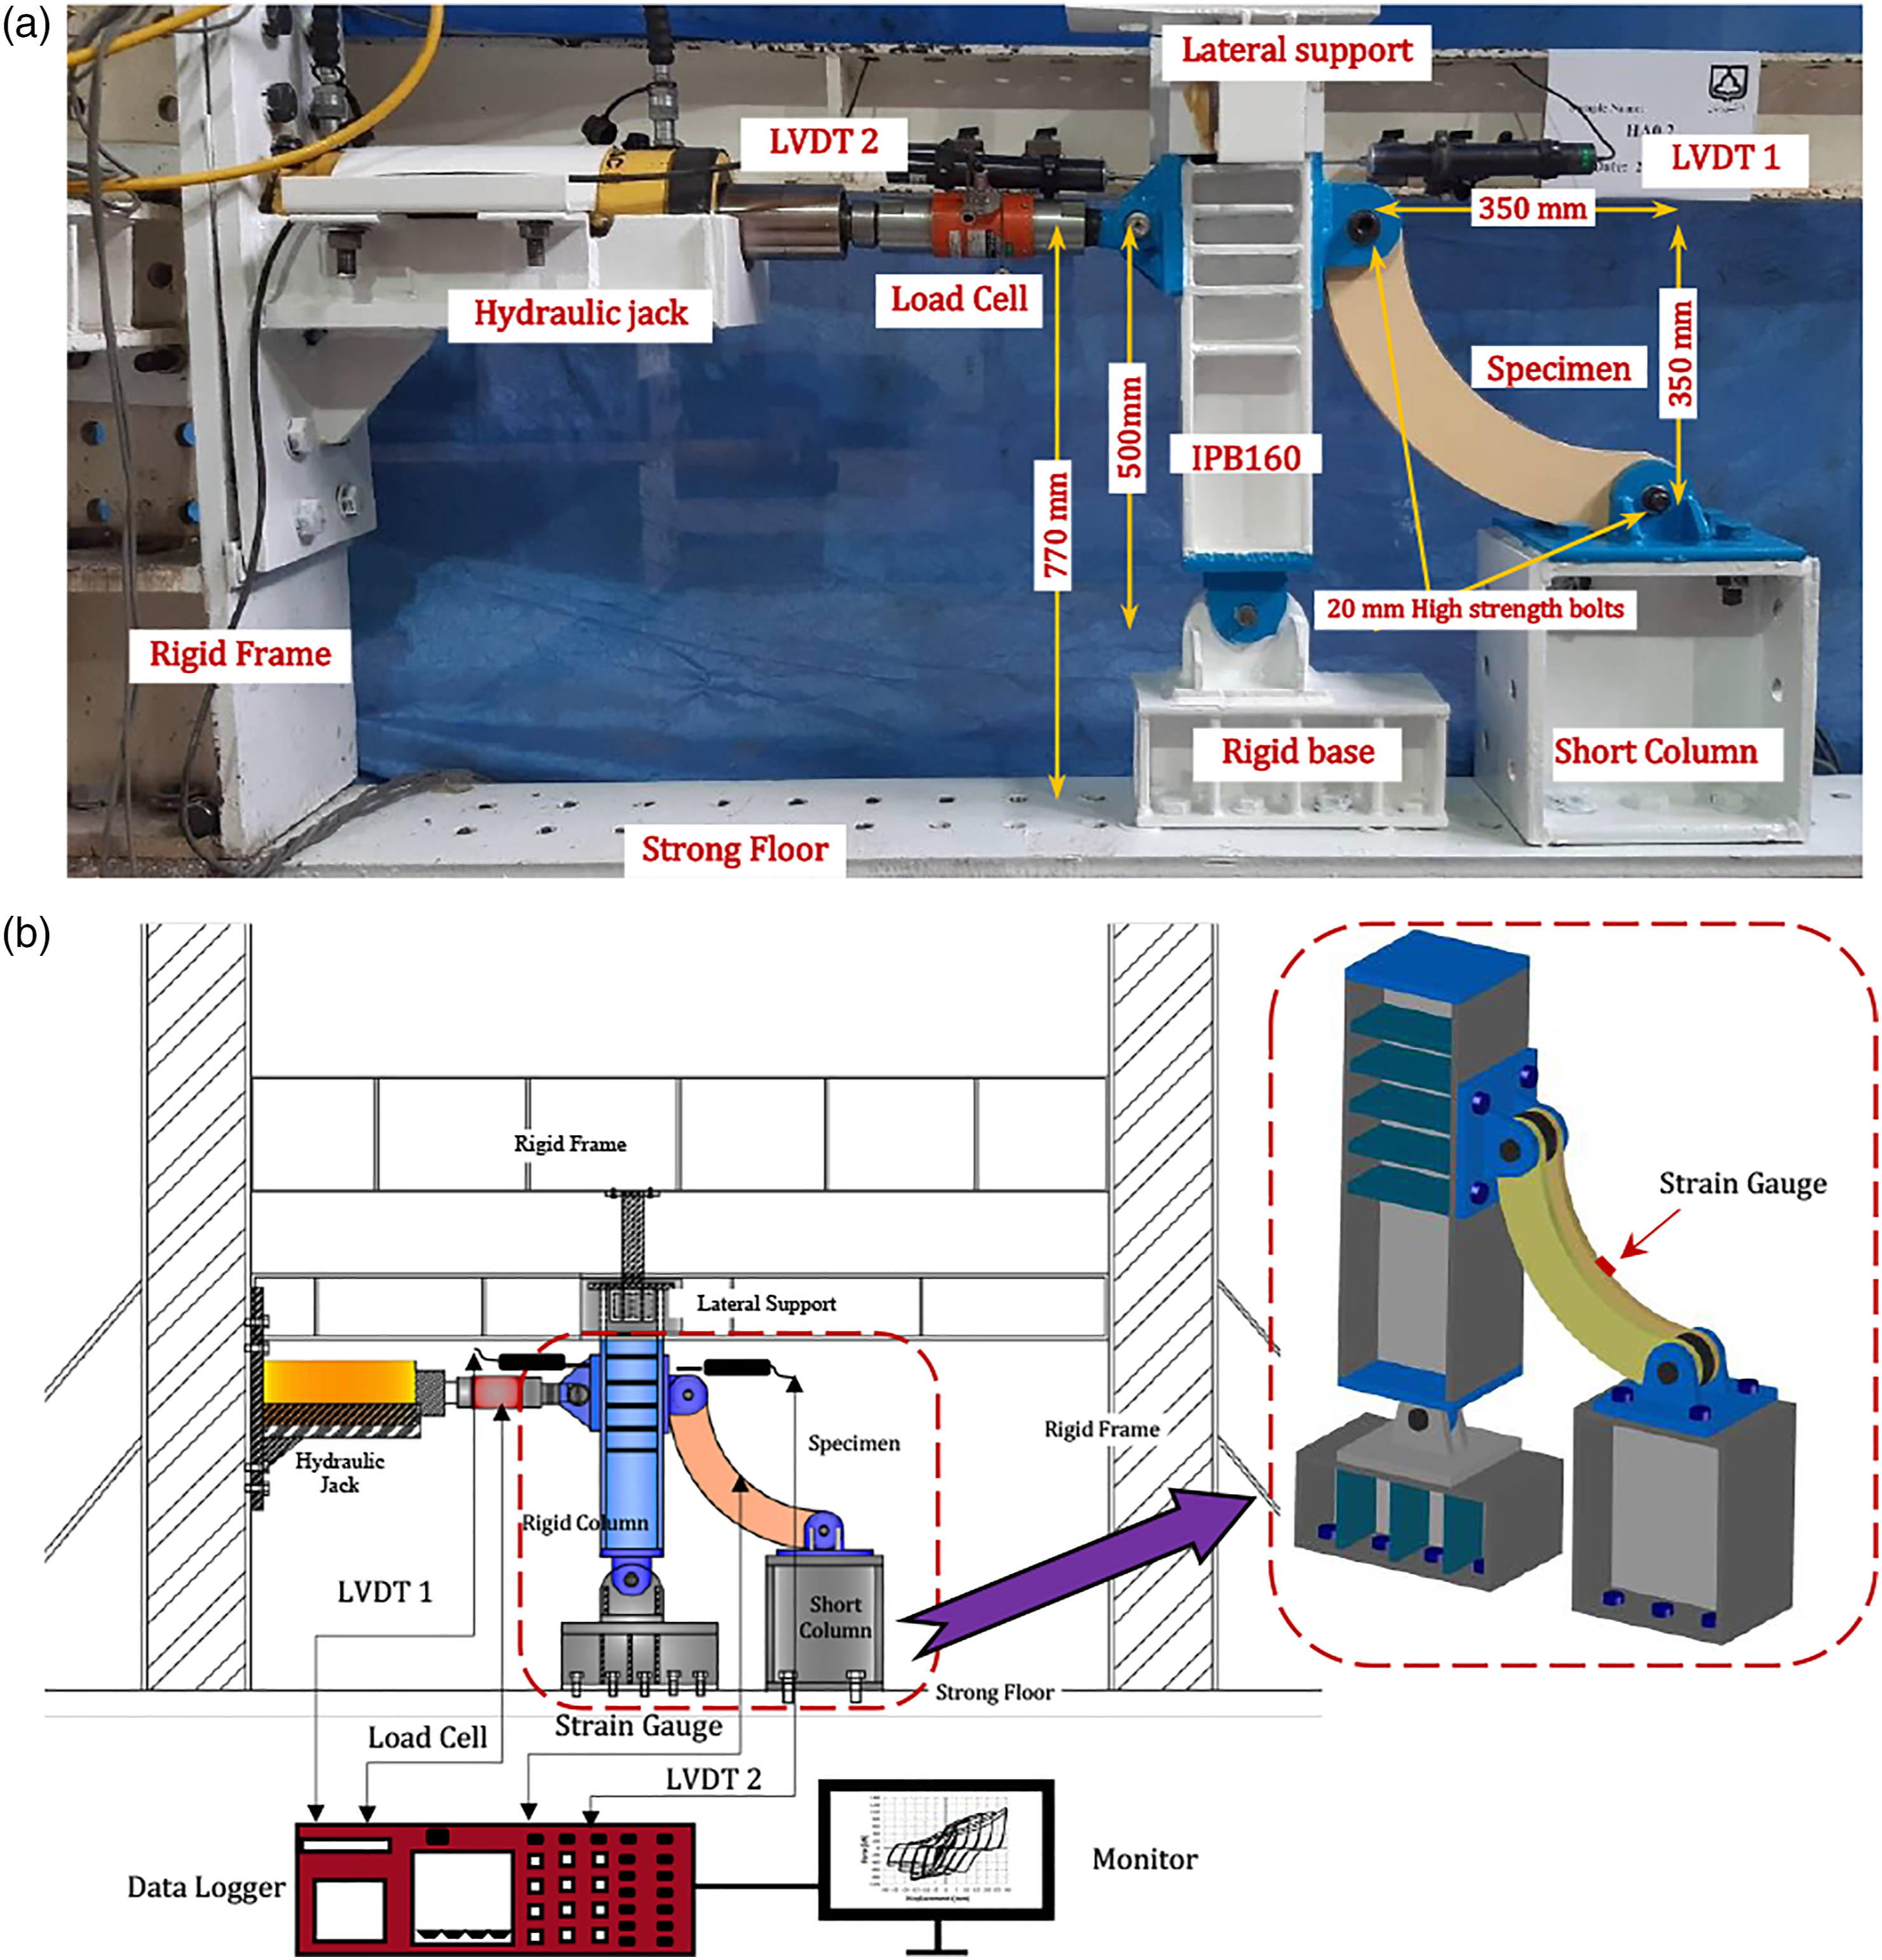
To ensure the lateral stability of the system during the tests, the rigid column tip was controlled by two rolled lateral supports connected to the rigid frame. Moreover, to record the horizontal relative deformations of two ends of the test specimens and subsequent analyses, two linear variable differential transducers (LVDTs) were bilaterally installed, as shown in Figure 6. Note that the measured displacements were calibrated based on the vertical distance between two-end pin-connections with respect to the length of the rigid column from the hinged center to LVDTs position. In addition, to record the specimens’ responses in yielding limit and for comparison with analytical data, a strain gauge was mounted at their middle concave edge.
Loading history
For cyclic loading test, a loading protocol proposed by ATC-24 (1992) was applied, as shown in Figure 7. The loading protocol consisted of two parts, including of the force control and the displacement control, respectively. The force control part was first captured by the obtained value of Cyclic loading history.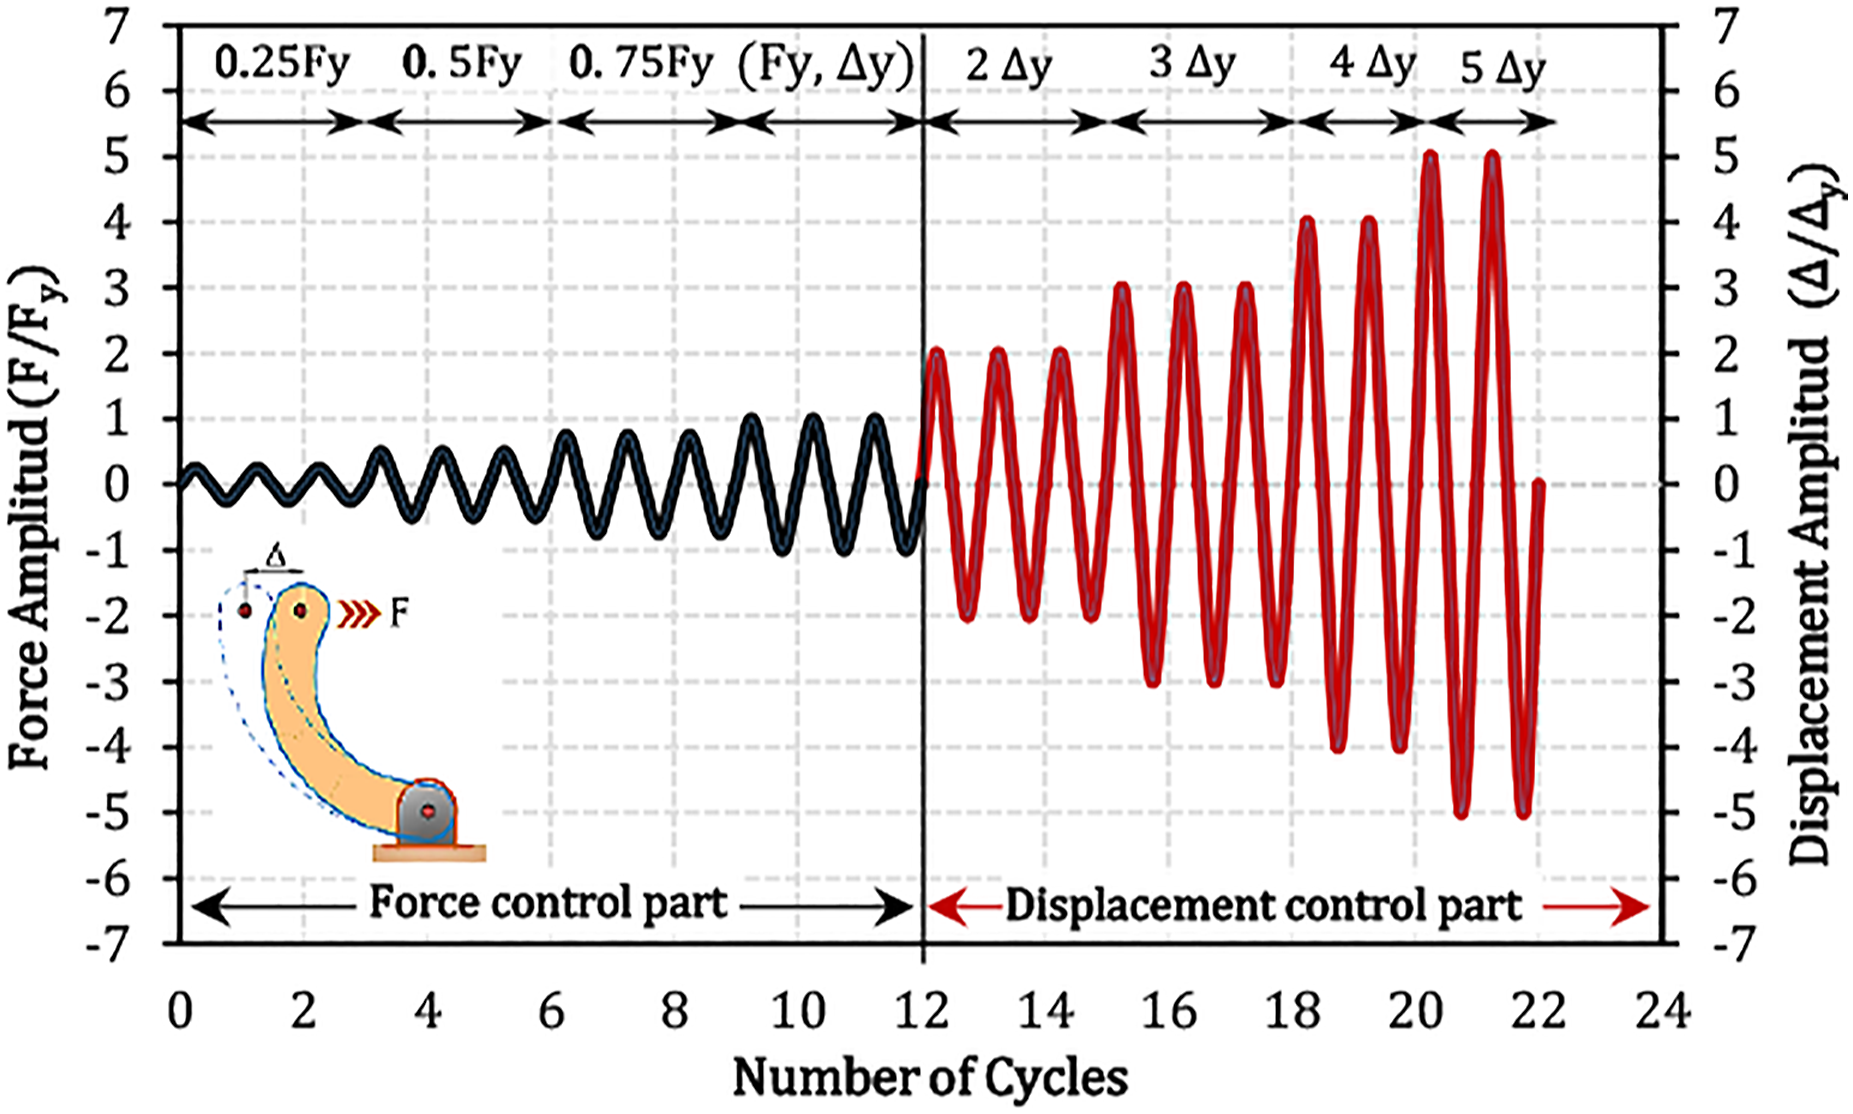
Based on the obtained
Experimental results and discussion
Hysteric responses
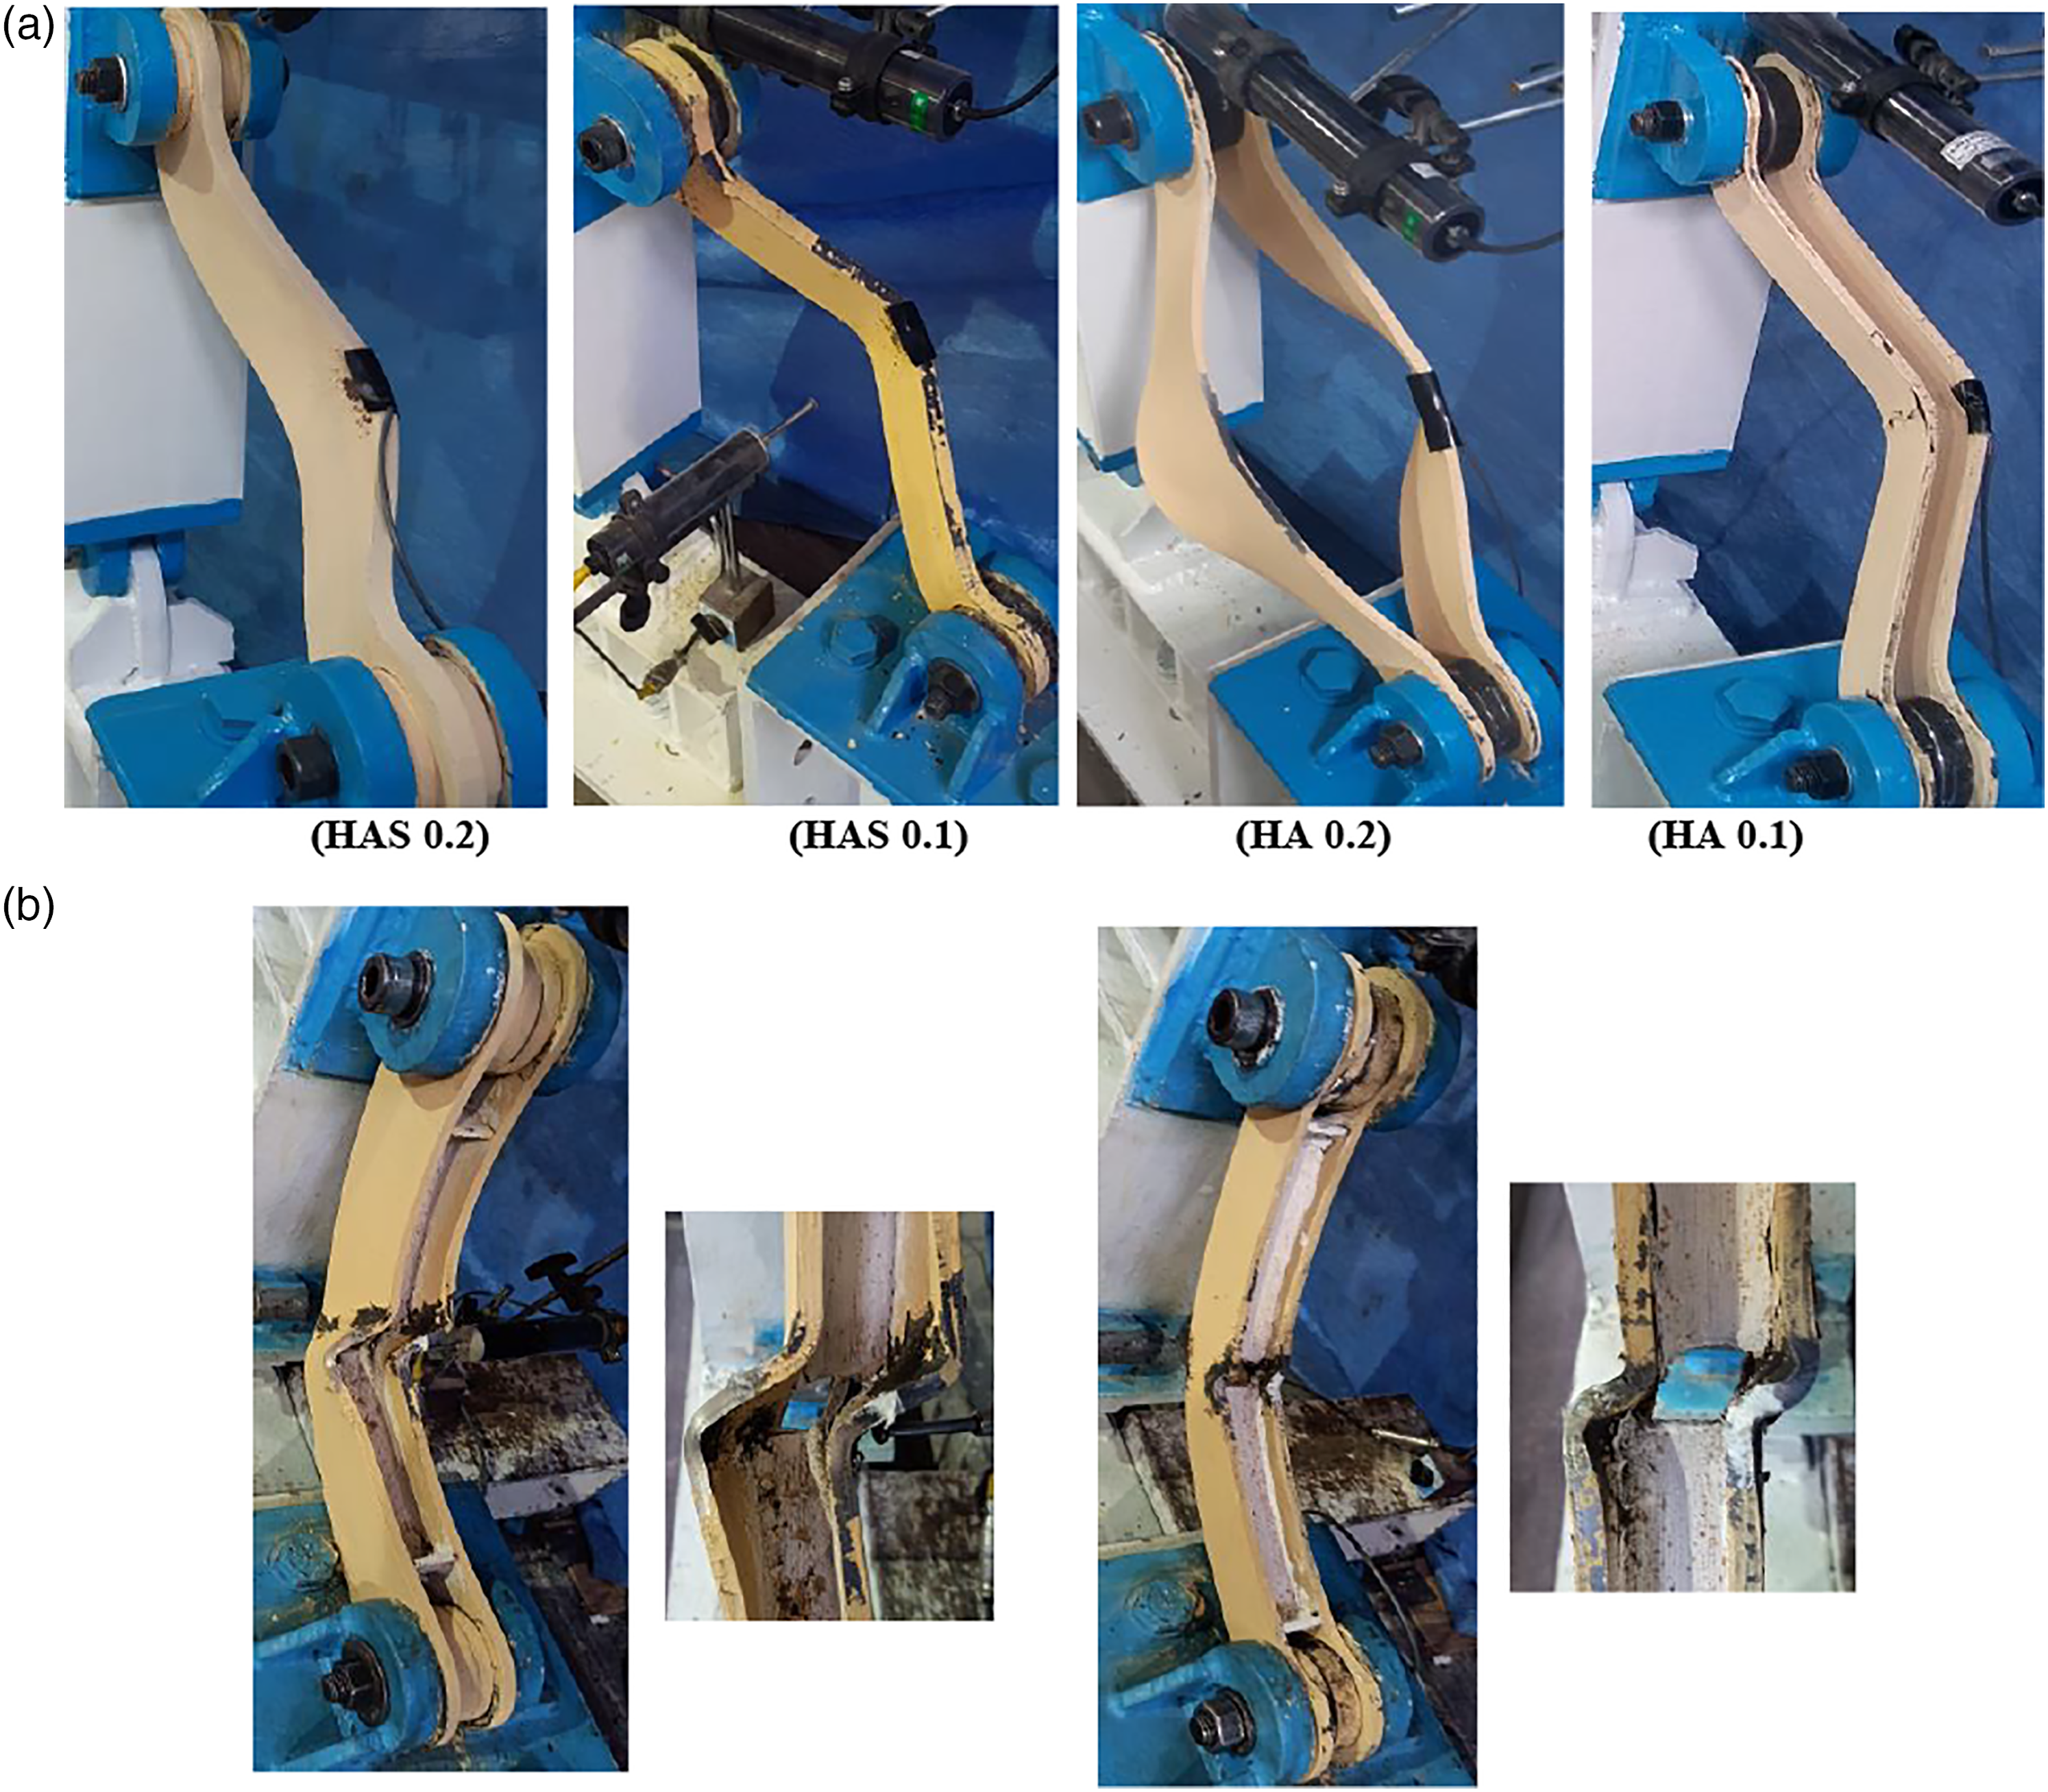
The initial and ultimate status of the test specimens in tension and compression are shown in Figure 8. The failure patterns indicate that all specimens as expected were more damaged at their middle concave edge. All specimens with double and single cross-section with high slenderness (λy ≥ 69) were subjected to overall buckling in compression and the specimens (with double cross-section) with low slenderness (λy = 16) also experienced local buckling. Figure 9 represents the specimen’s overall and local buckling modes in the ultimate status, respectively. During the test, tensile fracture was observed at specimens with local buckling, so that the HAF 0.1 suffered a sectional rupture, as shown in Figure 8. In tension, the HA 0.2 with highest d/t
f
ratio (i.e., lesser γ coefficient) among the specimens was subjected to lateral-torsional buckling at its middle convex edge under compressive stresses caused by combinations of P and M. In tension, all specimens were approached to their straighter state by reduction in axial eccentricity; however, in compression, the slender specimens by entering the overall buckling phase and out-off-plane performance, by increasing the horizontal displacement were subjected to lateral eccentricity, as shown in Figure 9(a). The difference at the overall buckling of the HA 0.2 compared to other specimens may be due to the high d/t
f
ratio and the lateral-torsional buckling potential. According to Figures 8 and 9(b), the HAF specimens with low slenderness ratio (about both axis) and without overall buckling potential, exhibited incremental in-plane performance and eccentricity under compression, when the horizontal displacement amplified. It can be also observed from the figures that the local buckling at the specimen with higher d/t
f
ratio is more severe, despite possessing the same λ
y
value. It should be noted that for all specimens, the buckling critical stress based on the torsional buckling was much more than the bending buckling. However, the HAS 0.2 in compression suffered a general buckling as a combination of bending and lateral-torsional buckling due to its single cross-section and probably a slight loading deflection. (a) The ultimate state under compression, (b) The initial state, and (c) The ultimate state under tension. (a) The overall buckling modes and (b) Local buckling of the test specimens.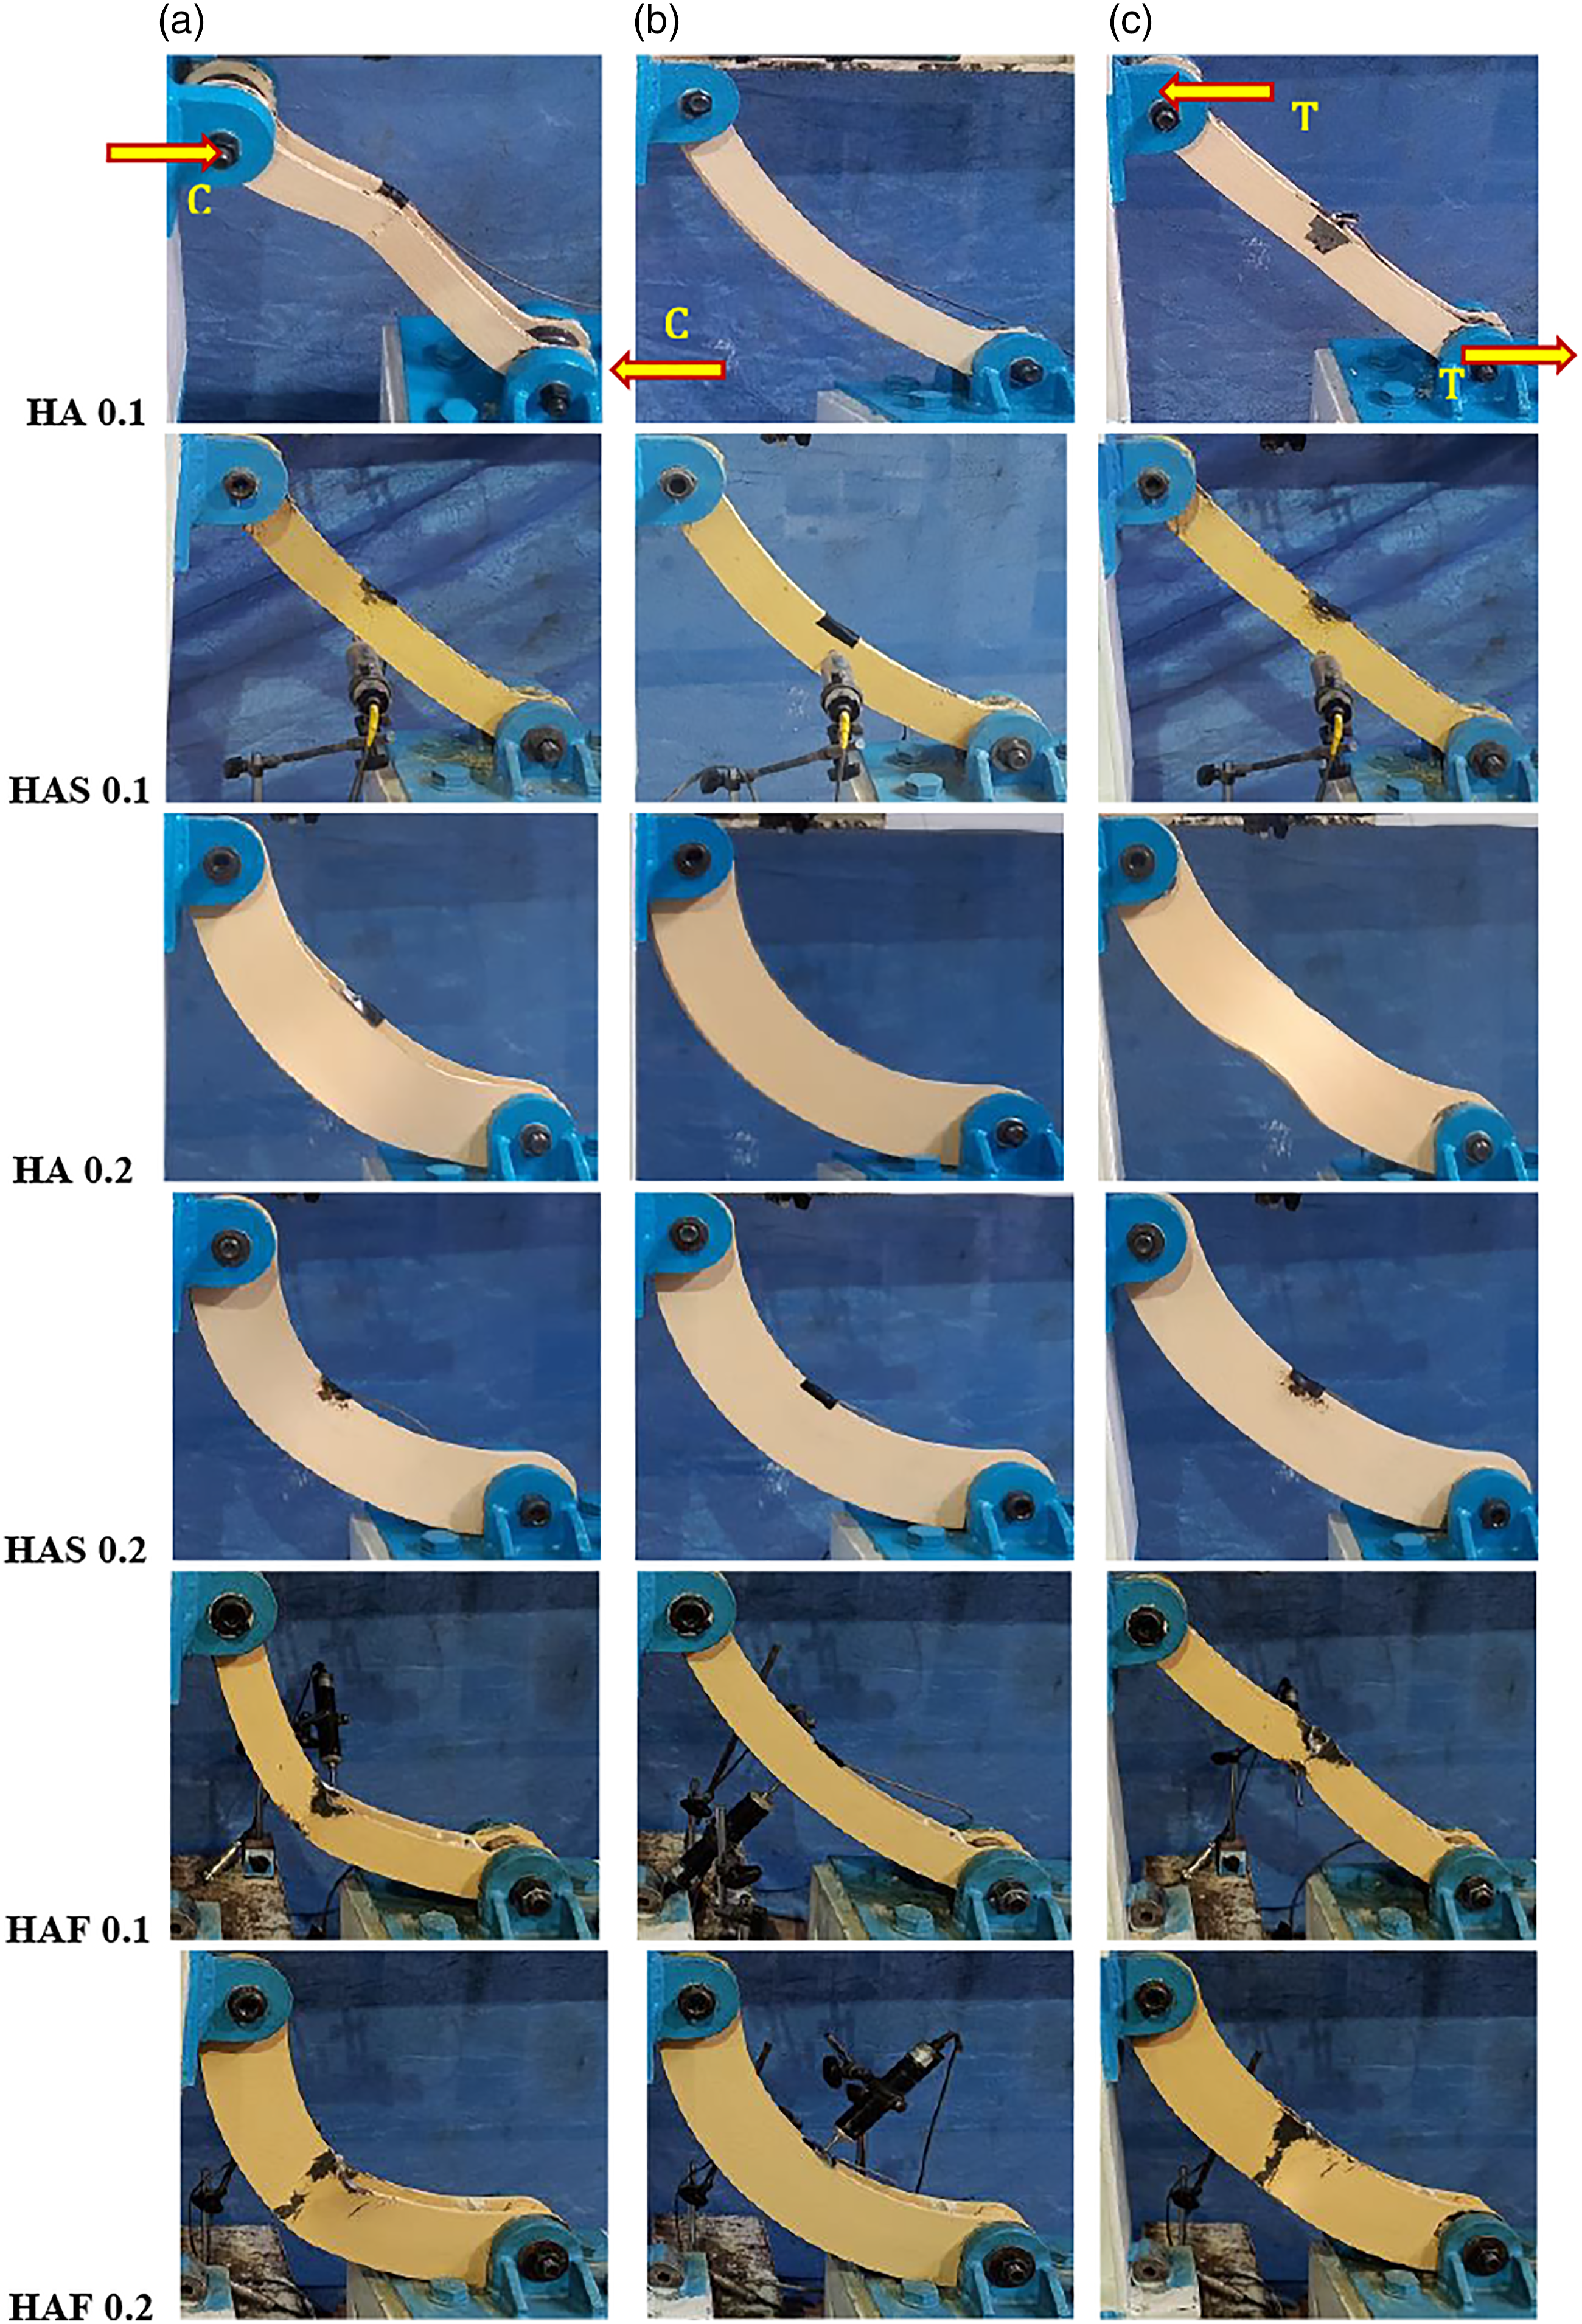
The hysteretic response of the test specimens are shown in Figure 10. In these curves, the overall and local buckling and cross-sectional rupture positions were marked with the cross ( Hysteretic loops of specimens.
As can be seen, the specimens with high and mediate buckling potential (i.e., HA and HAS specimens, respectively) at drift ratios of 1.5–2% and 2–2.5% were subjected to overall buckling, respectively. In addition, HAF specimens with higher and lower d/t f ratio were subjected to local buckling at drift ratios of 4.5% and 0.6%, respectively. Therefore, it can be found that with increasing the λ y and d/t f ratios, the buckling potential increased and its corresponding displacement decreased. It should be noted that the loading process in HA and HAS specimens up to approximately 0.3 F cr , and in HAF up to tensile rupture was resumed.
According to Figure 10, it can be found that the hysteretic behavior was mainly affected by the λ y and d/t f ratios, so that by elimination of buckling potential and reduction in loops pinching, a more desirable hysteretic behavior and significant dissipated energy was achieved. It can be expressed that by decrease of λ y value a more symmetric and stable hysteretic response was obtained. Note that as can be seen in HAF specimens and as reported in previous researches (Hsu and Halim, 2018; Zhou et al., 2019), the arc elements without any buckling potential, also exhibit significantly asymmetric hysteretic behavior, particularly when their central angle or initial eccentricity is decreased.
The comparisons from Figure 10 indicates that with increasing λ y ratio in the each group specimens, the energy dissipation potential decreased sharply, particularly in compressive reverse cycles due to buckling effects. Therefore, the main reason of the hysteresis pinching can be attributed to the high λ y ratio and overall buckling potential, which it seems to be more prominent at the specimens with less value of e. However, slippage caused by two-ends bearing pin-connections of the ASHs and bearing failure of their connection holes also had a considerable effect on this phenomenon. Furthermore, the hysteretic response of HAF specimens (with adequate values of λ y ) shows a significant increase at plastic stiffness, especially in tensile reverse cycles. It can be due to the ASHs cross-section reaching the fully plastic stage and material strain hardening, which in HAF0.1 is more obvious.
Generally, the specimens with less e value (about 50%) exhibited up to 25% lower plastic deformation capacity (i.e., ductility). It can be attributed to reduction at their e/e t,c variations rate and reaching to its straighter states.
Although the ultimate tensile strength of the specimens did not increase when their λ y ratio decreased; however, its effects on improvement of the buckling limit capacity (F cr ) and post-buckling behavior is evident. Note that HA 0.2 with the same λ y as compared to the HA 0.1, exhibited undesirable performance in terms of tensile post-yielding strength and stiffness due to lateral-torsional buckling (d/t f = 12.5) and delay at reaching the fully plastic state.
Strength
The force-displacement envelope curve of each specimen is plotted, as shown in Figure 11. In this figure, the limit analytical values of yield strength F
y
, plastic strength Force-displacement envelope curves of test specimens.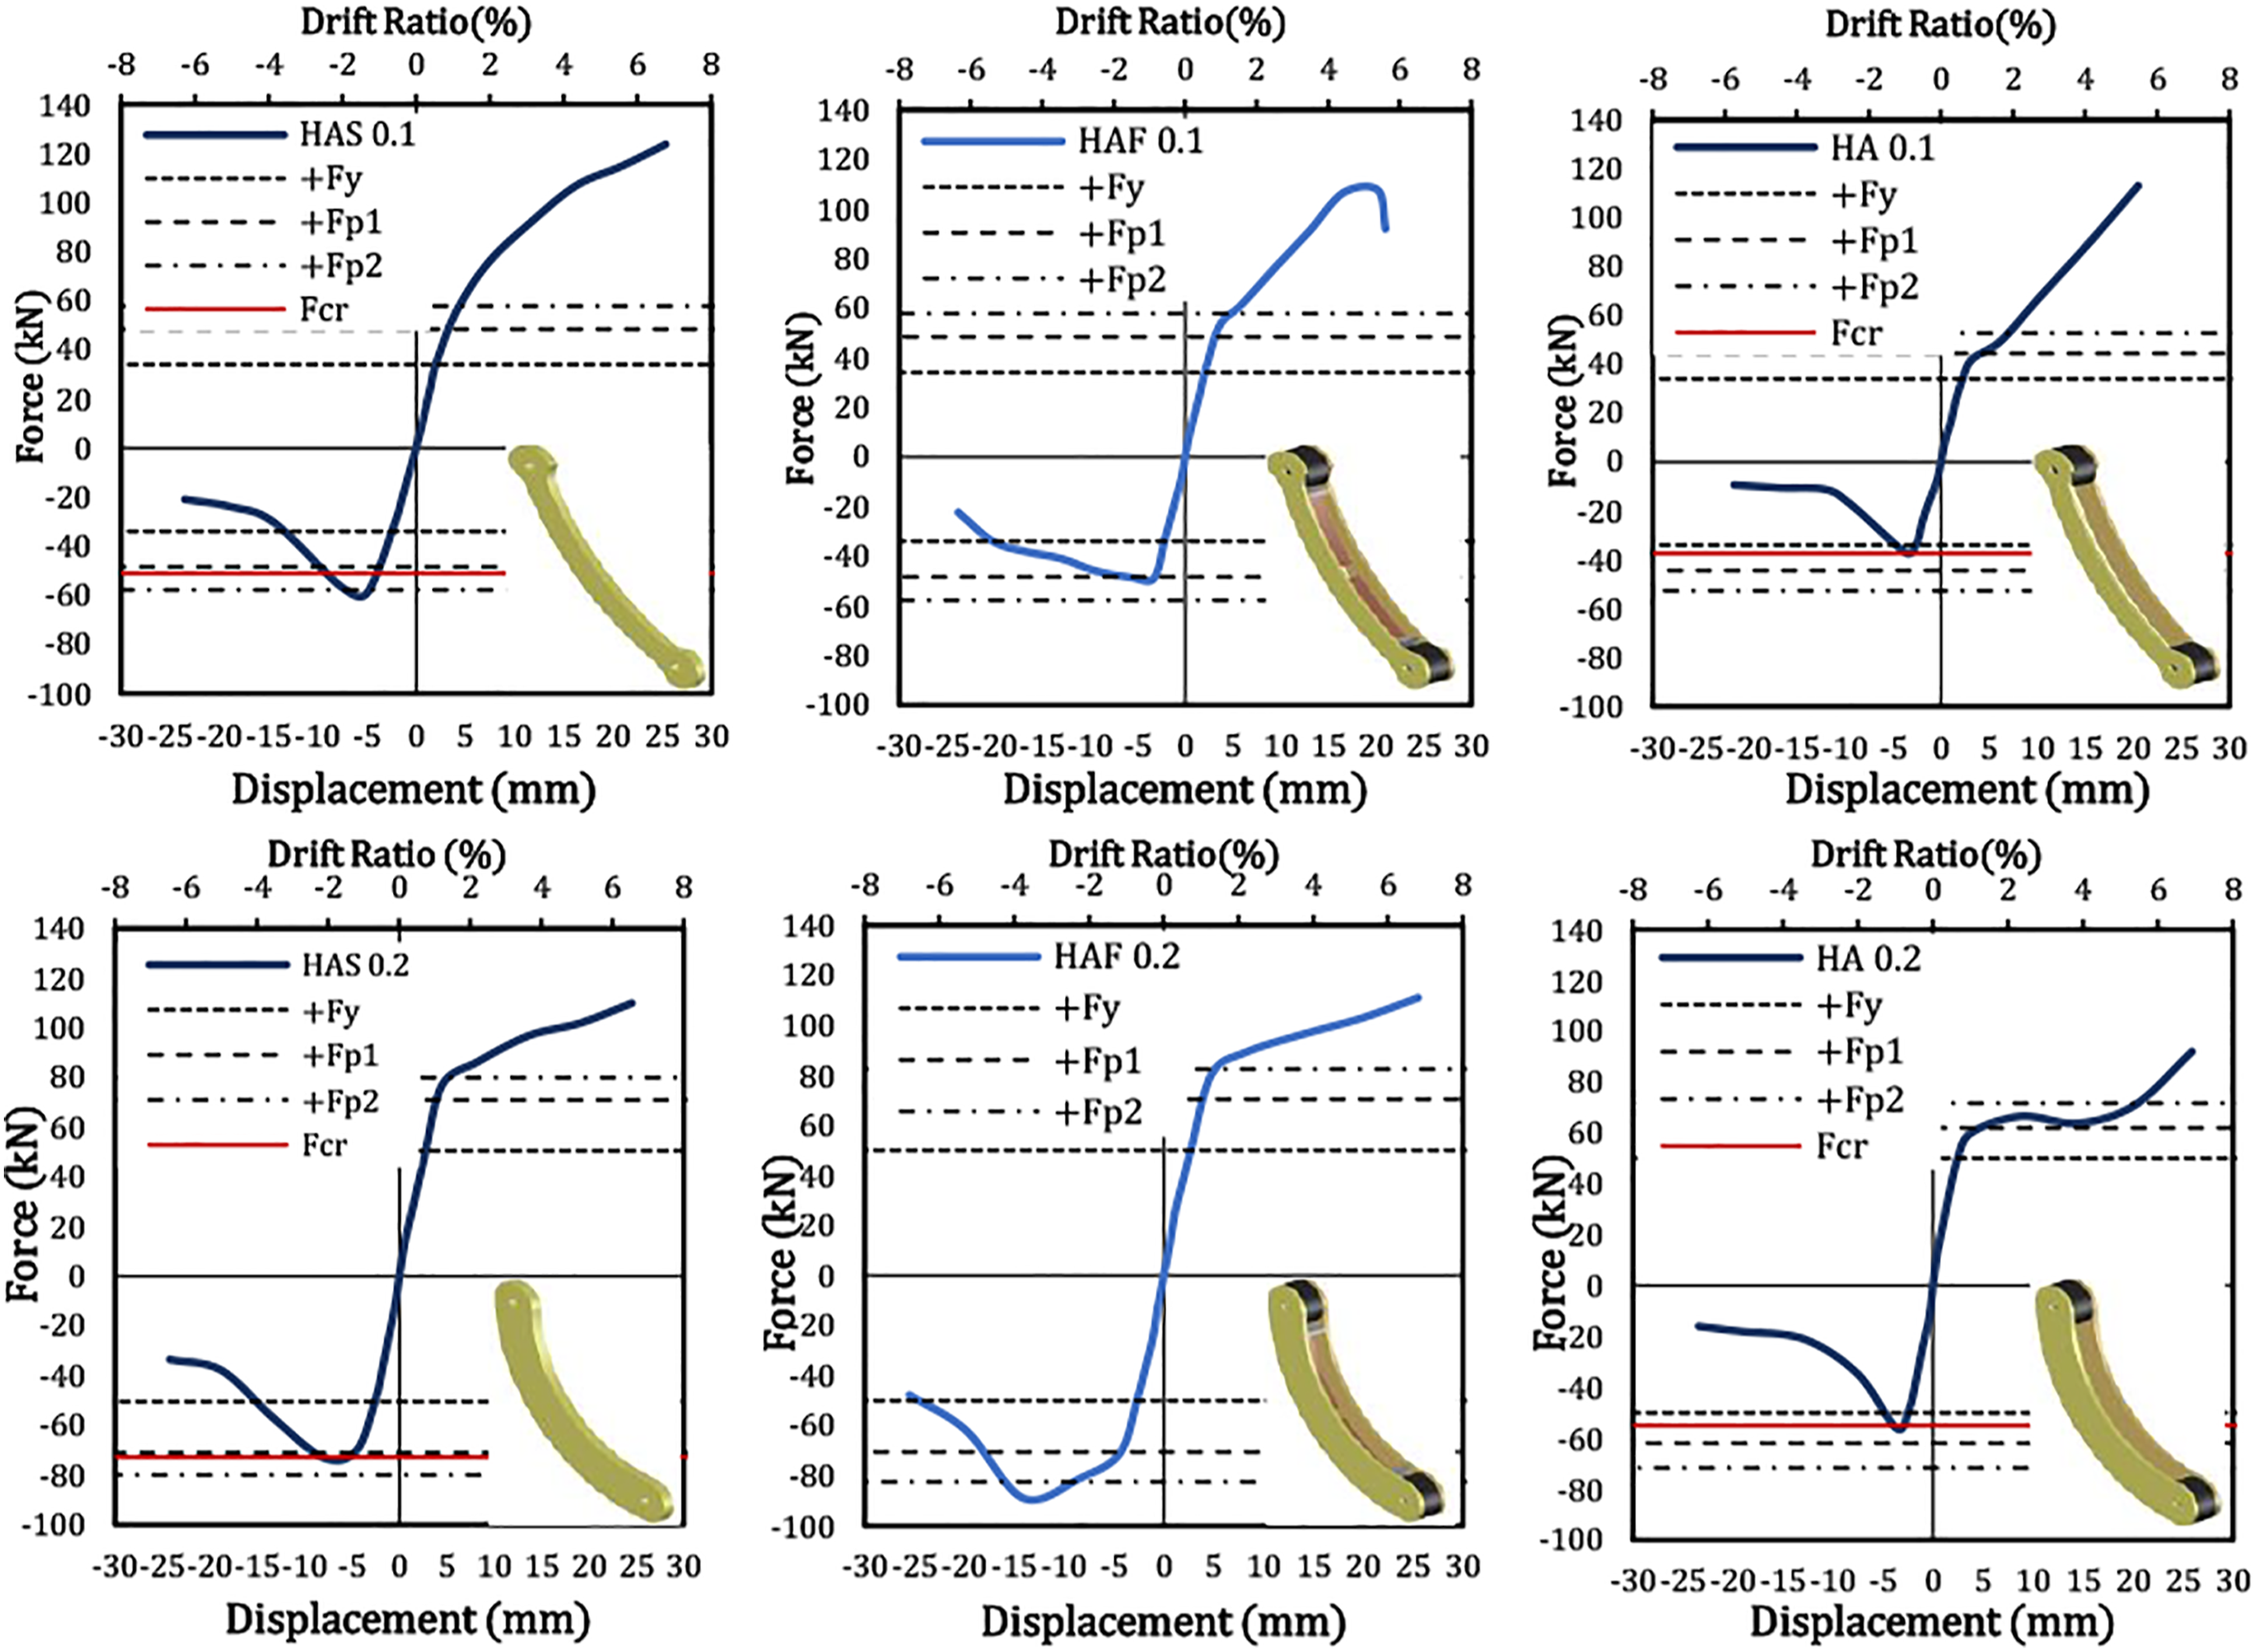
Experimental and analytical comparisons of limit strengths and displacements.
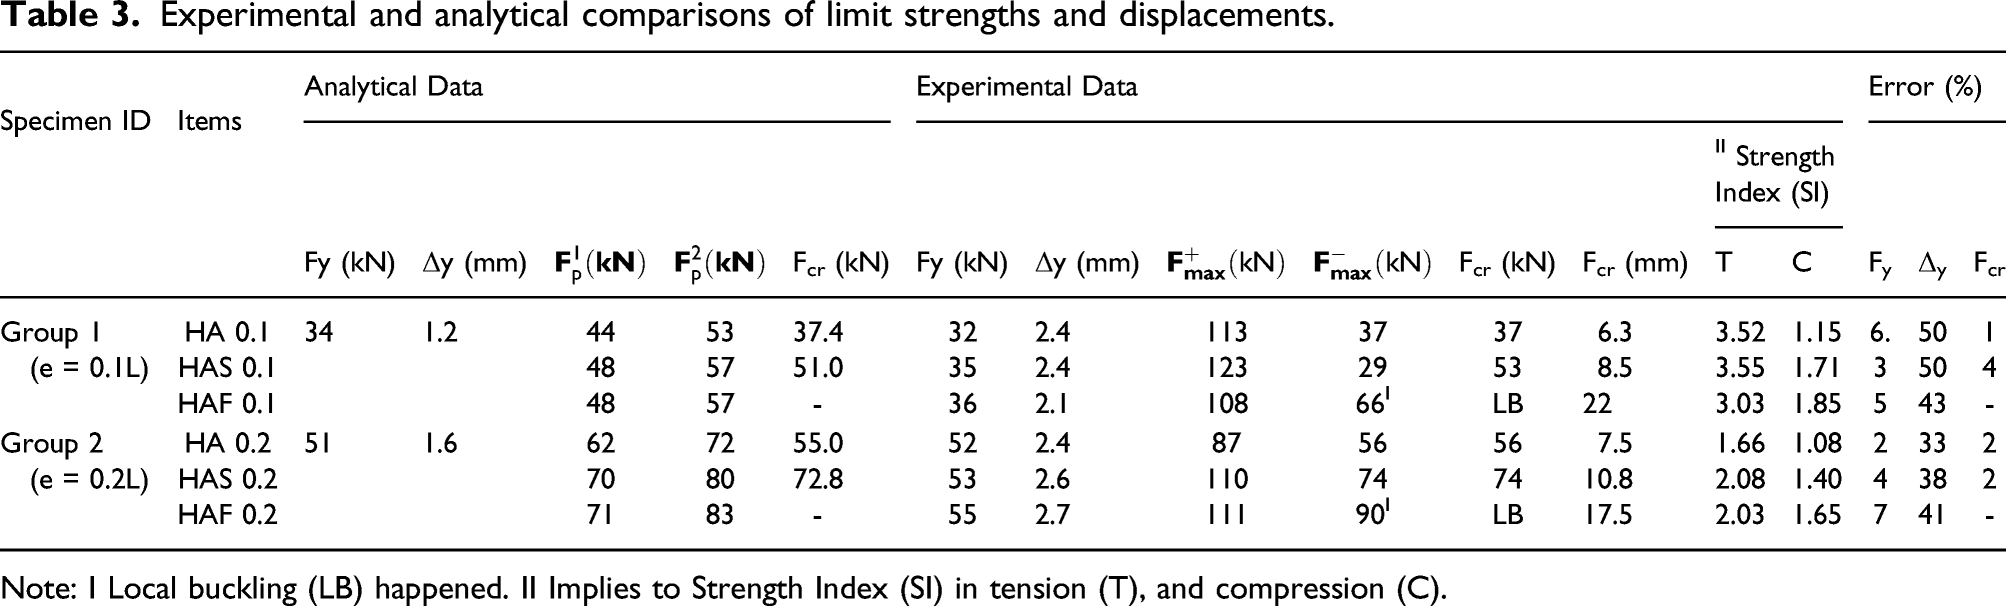
Note: I Local buckling (LB) happened. II Implies to Strength Index (SI) in tension (T), and compression (C).
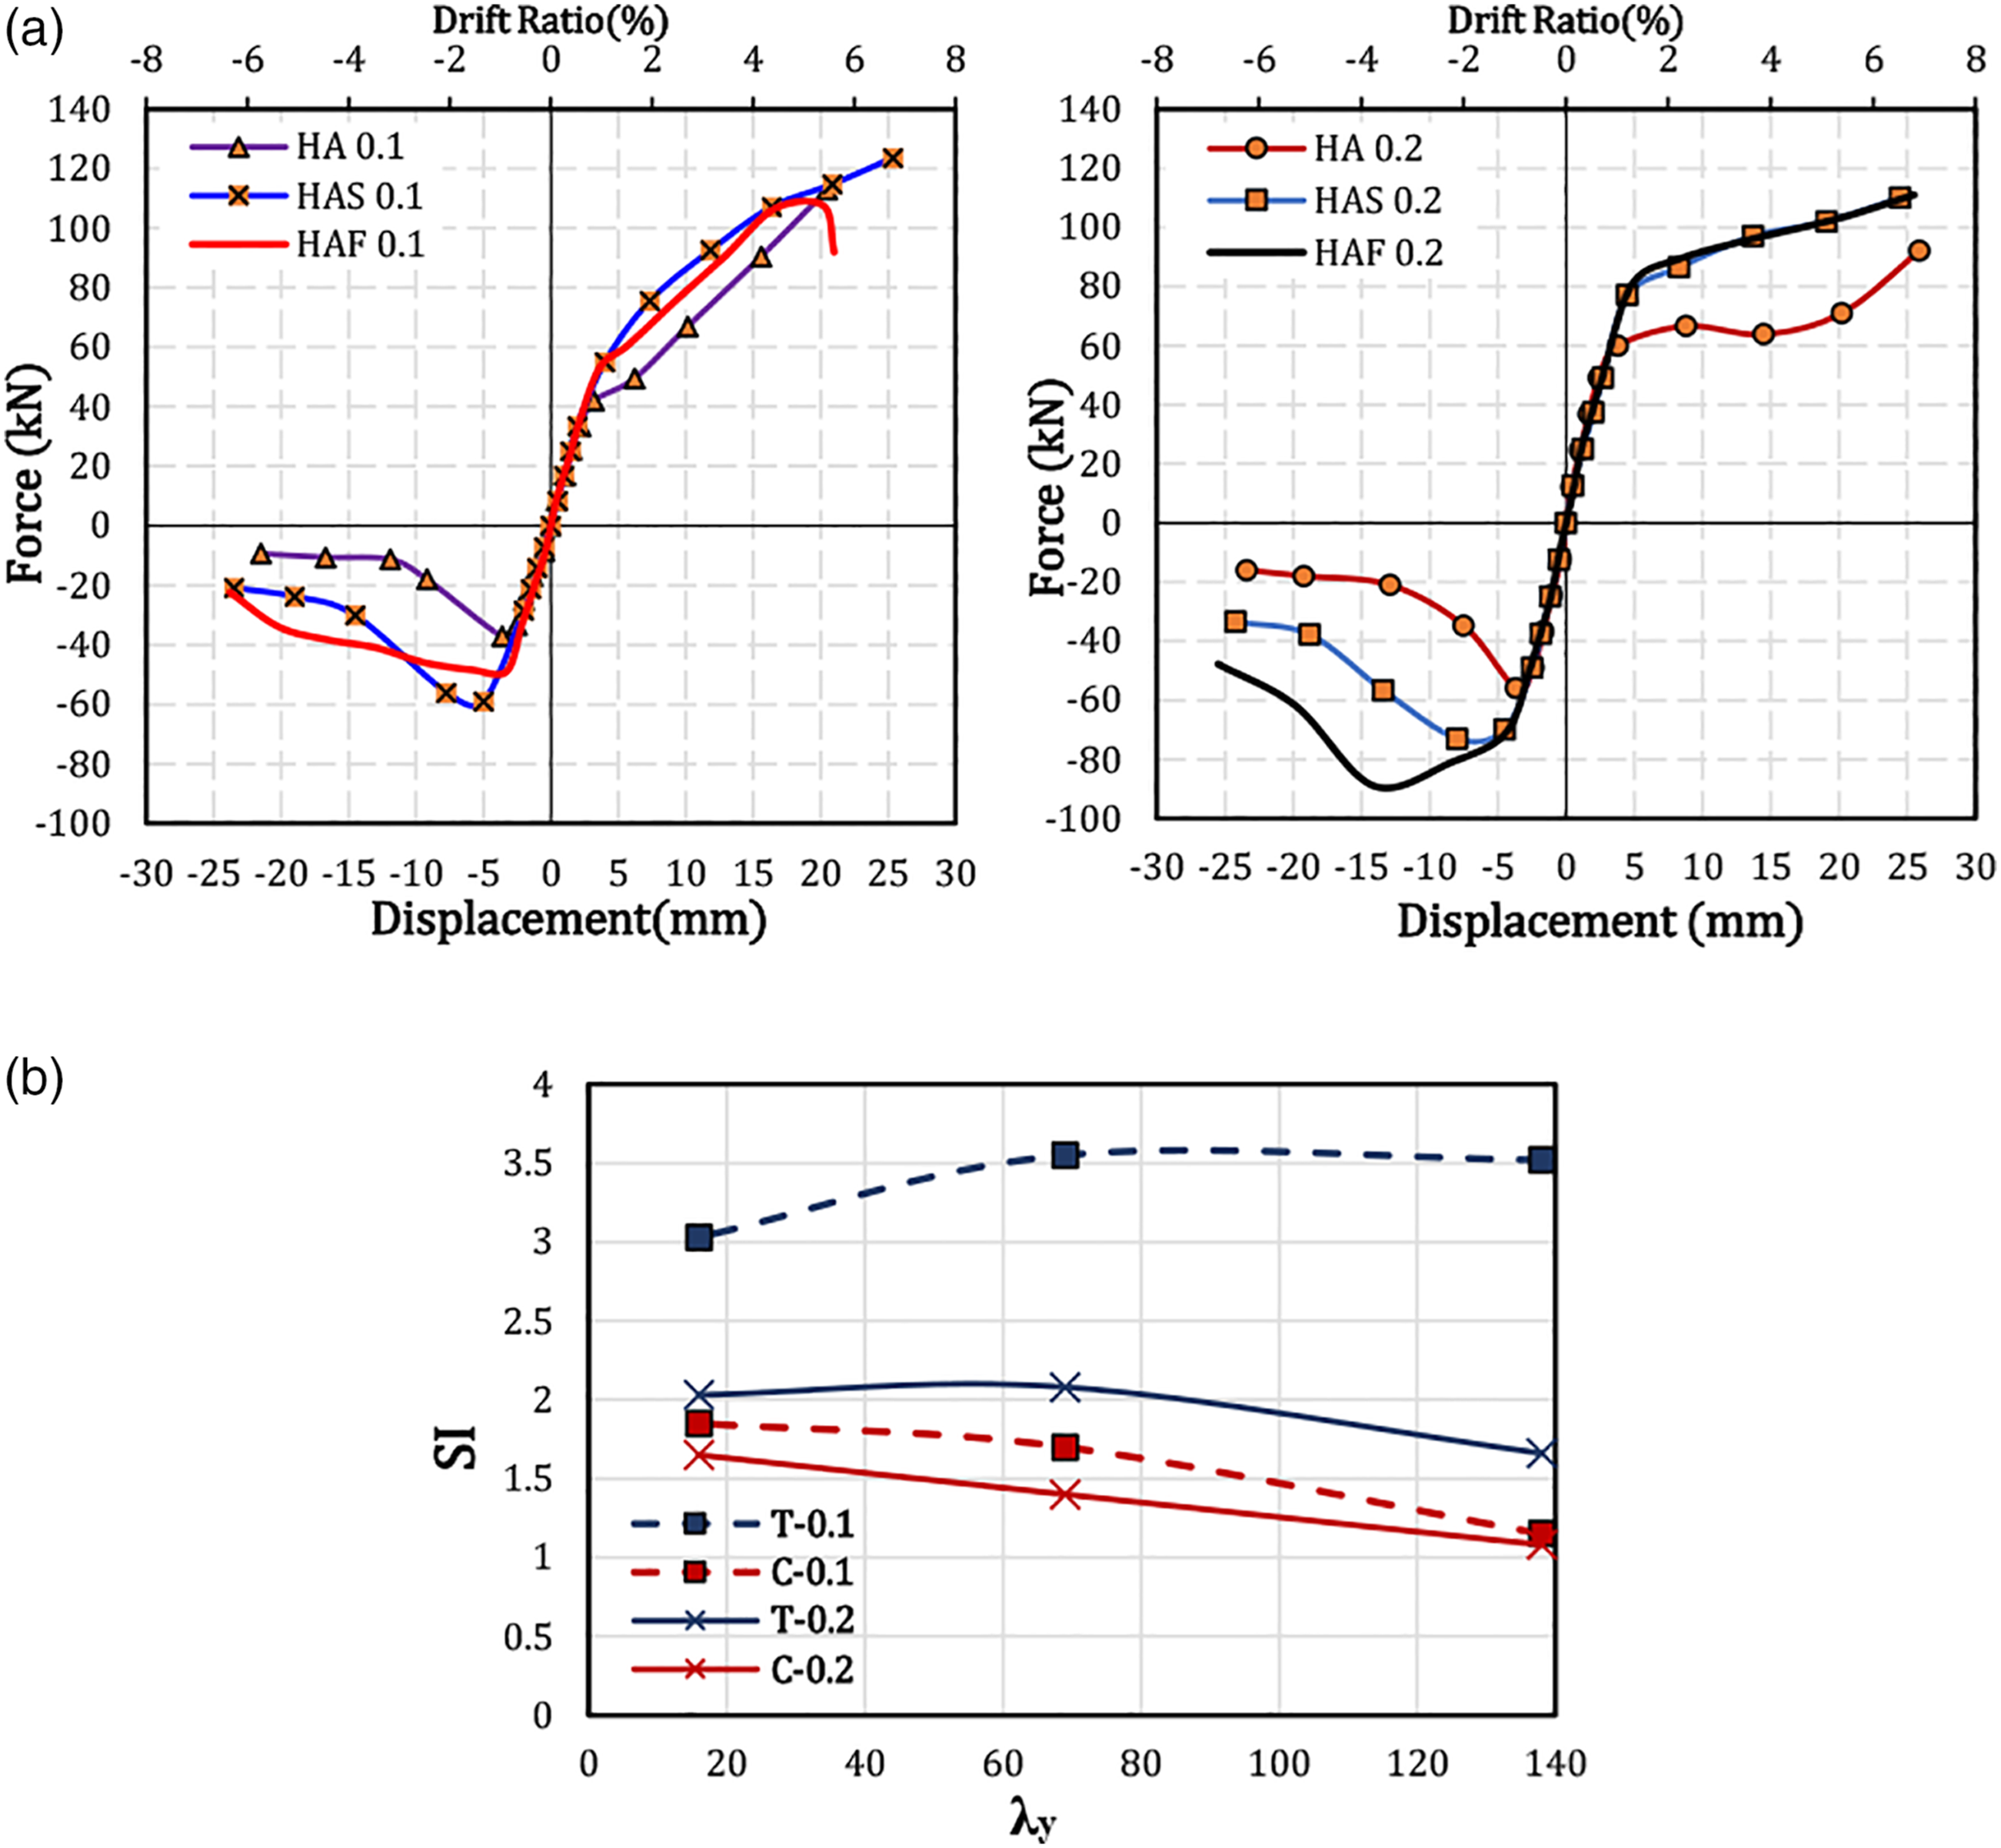
(a) Comparison of force-displacement curves of test specimens and (b) The SI variations in λy under tension and compression.
Generally, it can be found from Figures 11 and 12(a), and Table 3 that by the decrease of λ y value at each group specimens, the tensile and compressive behavior improved. Moreover, the values of F – max or F cr and their corresponding displacement (Δ cr ) increased and strength deterioration in post-buckling state decreased.
Figure 12(a) and Table 3 indicate that HA slender specimens after slightly post-yielding deformation and even before reaching to its plastic strength
Based on equations (7) and (8), the F y and Δ y values of the first and second group specimens are predicted about 34 and 50.5 kN and 1.22, 1.62 mm, respectively. According to Table 3, there is a relatively good correlation between experimental and analytical values (except in estimation of Δ y ). The yielding and buckling limit strength predicted based on equations (7) and (12) exhibit a maximum error up to 7% and 4%, respectively, as compared to experimental data, which indicates that the limit relation recommended by the AISC Code can be suitable for ASH devices. The difference up to 50% between the experimental and the predicted yield displacement can be due to looseness in the ASH bearing pin-connections as well as their holes bearing failure under cyclic loading, meanwhile it should be noted that the analytical value of Δ y is very small.
Generally, it can be expressed that the ASHs behavior in tension was effected by their in-plane geometric specifications. However, the behavior in compression for the specimens with and without overall buckling potential was captured by their cross-section out-of-plane and in-plane geometric specifications, respectively. Comparisons from Figure 12(a) and Table 3 show that with reduction in λ y value, the F – max or F cr value and post-buckling behavior upgraded, although tensile behavior more affected by d/t f and γ values. Therefore, the very slender specimens (λ y = 138) due to premature overall buckling and possessing a high d/t f ratio and lower γ, by formation of incomplete plastic hinge sustained lesser strength among of tested specimens. HA 0.2 (d/t f = 12.5 and γ = 1.28) under tension, with reduction at its e t value exhibited a weak post-yielding behavior due to the lateral-torsional buckling at its convex middle edge and exhibited 27% reduction in F+max as compared to HAS 0.2 and HAF 0.2. Alternatively, HA 0.1 (d/t f = 7.25 and γ = 1.37) with the same λ y exhibited approximately similar ultimate tensile strength as compared to HAS 0.1 and HAF 0.1. It means that d/t f ratio and γ can be more effective than λ y on ASH tensile strength, and for prevention from the lateral-torsional buckling, it is recommended that the d/t f ratio be less than 7.
Further comparisons from Figure 12(a) and Table 3 indicate that the maximum and ultimate compressive strengths in HAS specimens possessing half values of λ y and d/t f compared to the corresponding HA specimens were about 1.32–1.59 times and twice, respectively, and their corresponding Δ cr enhanced about 1.38–1.44 times. Moreover, in HAF specimens with adequate value of λ y and d/t f , by developing a fully plastic hinge at their cross-sections and the strain hardening behavior, the maximum and ultimate compressive strengths enhanced approximately between 1.61 and 1.78 times and 2–3 times, respectively.
It can be found that the increase of about 1.25–1.5 times the F–max in the second group compared to the corresponding first group specimens—despite the close elastic chord stiffness (about 10% difference)—is pertained to enhancement 1.7 times of its cross-sectional area, which indicates that the effect descends by increasing the initial value of e. In addition, it can be seen that under tension, the cross-sectional area effect is greatly reduced, so that by increase 1.7 times of that, the F+max values reach to about 0.76-1.03 times, the F + max values were about 0.76–1.03 times.
Here, strength index (SI) is defined as the maximum to yield strength ratio. According to Figure 12(b) and Table 3, it can be found that the index for the first and second group’s specimens in tension were much more than compression and vary about 1.64–3.06 and 1.23–1.54 times, respectively. In addition, that decreased, when the e value was increased. Thus, the SI value of the first group specimens compared to the second group in tension and compression were about 1.5–2.12 times and 1.06 to 1.21 times, respectively. Furthermore, the SI value in compression increased significantly, when the λ y descended. The obtained results indicated that the ASHs compressive behavior is more affected by λ y ratio than tensile behavior; however, the d/t f ratio can be effective on both tensile and compressive behavior directly.
Stiffness
Comparison of various stiffness.
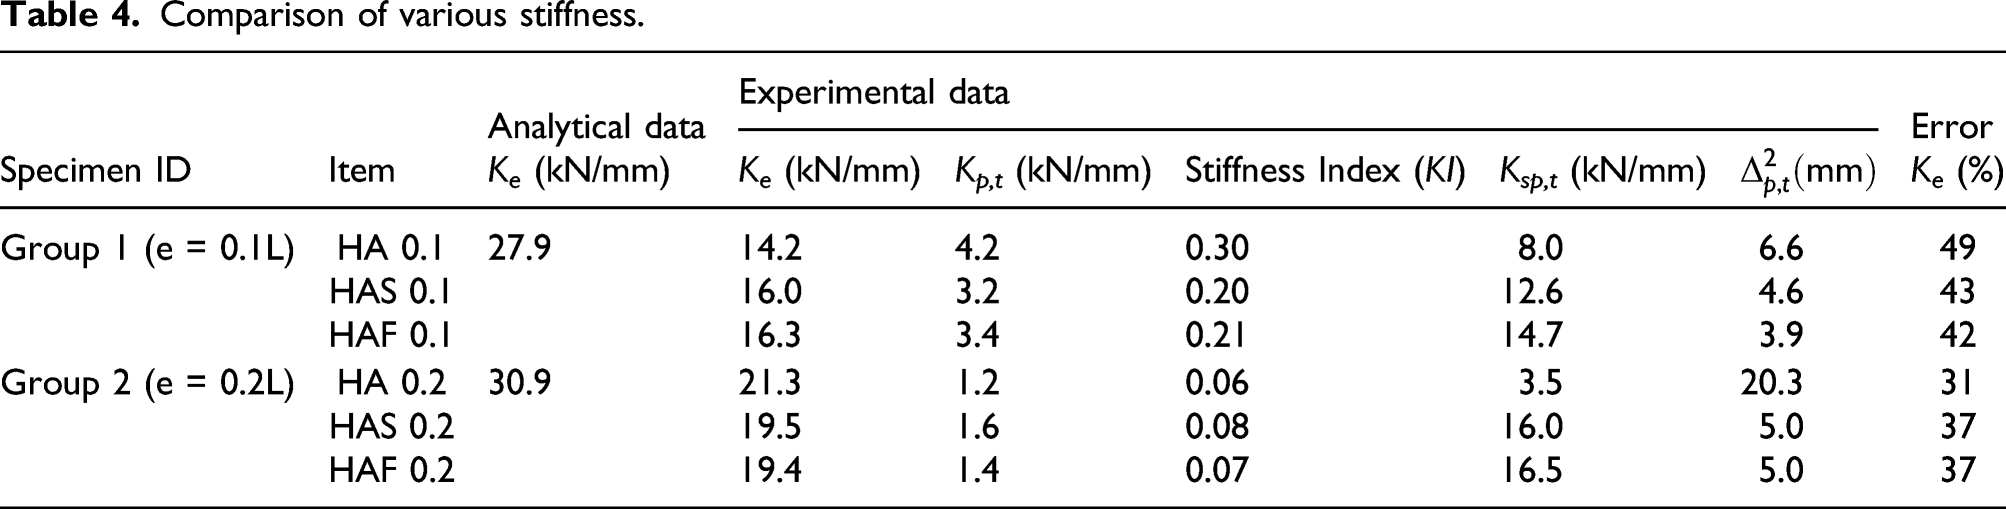
The experimental values of the
The results indicate that the
The secant stiffness
Figure 13(a) and (b) shows the post-yielding Stiffness degradation of specimens in tension and compression: (a) First group, (b) Second group, and (c) Normalized compressive stiffness with respect to HA specimens.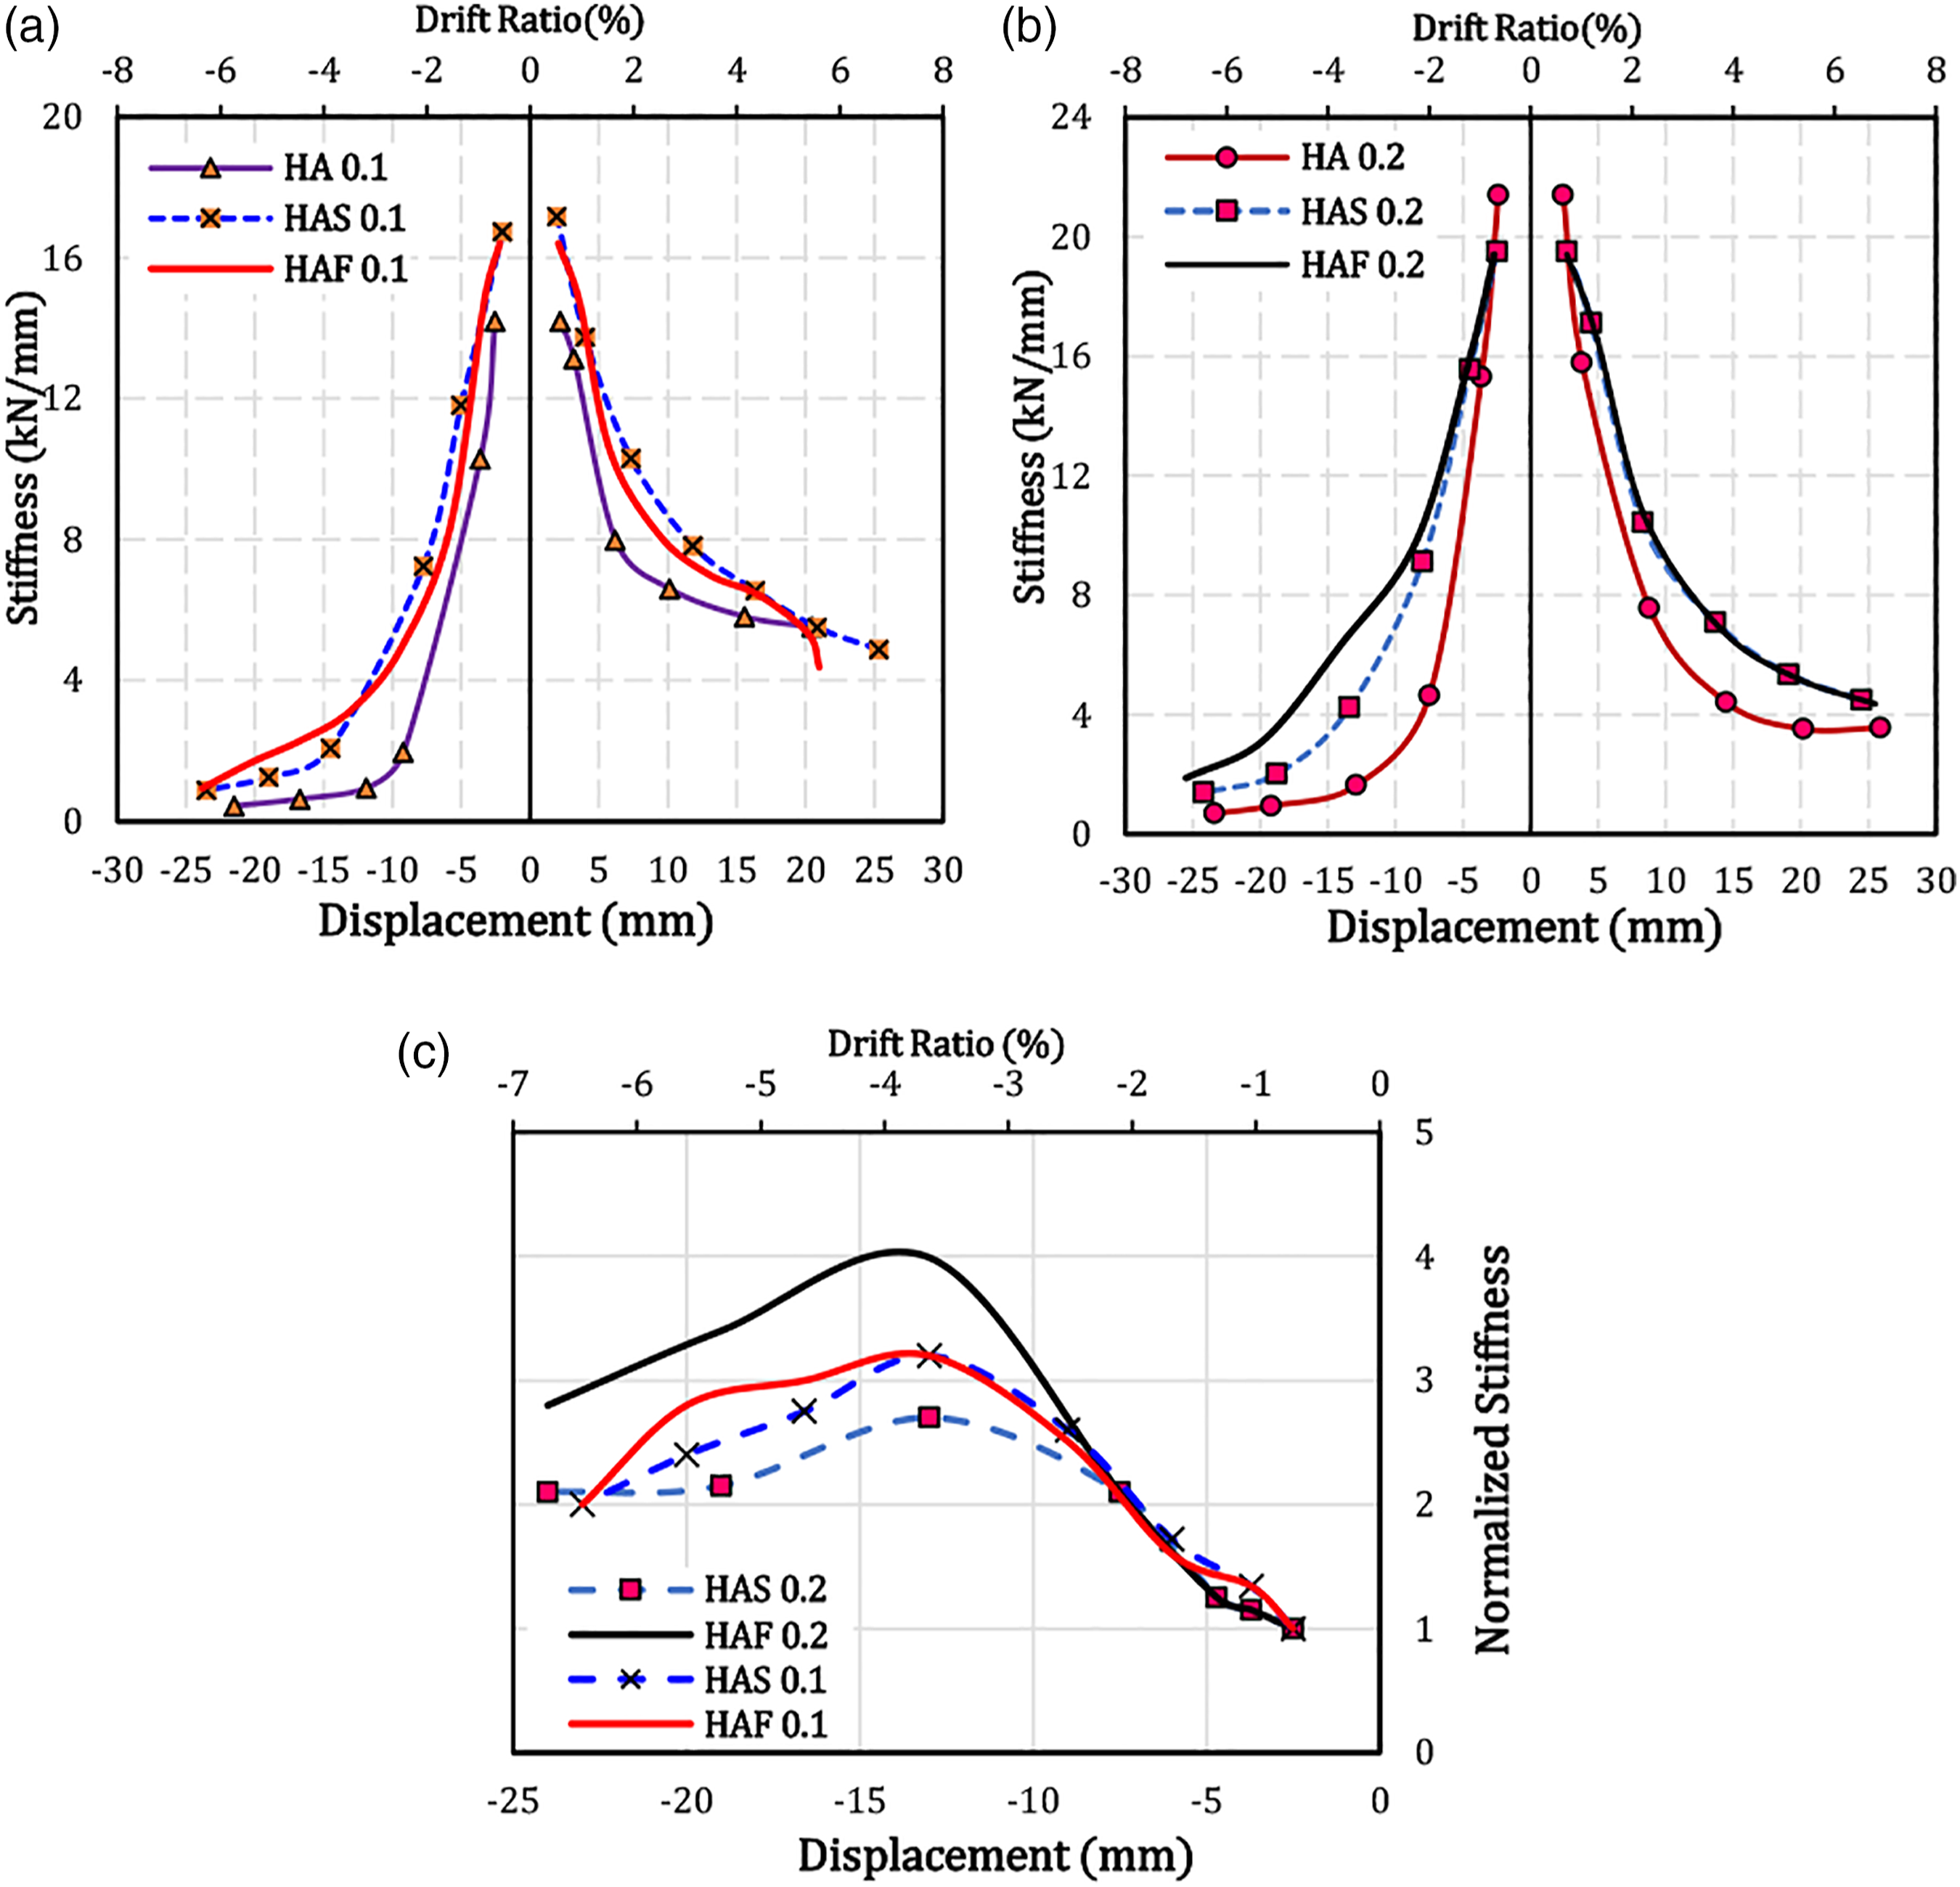
It can be observed from Figure 13 that by reduction of the λ y ratio, the stiffness was degraded at a lower rate in tension and especially in compression, which that is more obvious in the second group specimens.
Furthermore, the stiffness degradation of all specimens in compression was very significant than tension due to buckling phenomenon, so that the ultimate stiffness in tension were about 5.5–12.5 and 2.3–5 times more than in compression for the first and second group specimens, respectively. Moreover, it can also be resulted that the difference behavior of the ASHs (i.e., their strength and stiffness) in tension and compression is diminished, when their e value increased.
As can be seen in Figure 13(c), the normalized values of K s increase sharply after overall buckling and severe strength deterioration of HA specimens at the post-yielding stage, and due to the post-yielding strength increase of HAF and HAS specimens, which with an incremental trend reach their maximum value at displacement 13 mm (drift 3.7%). These normalized values then gradually decrease with increasing deformation and eccentricity because of local buckling and a gradual decrease in their strength. Thus, it can be said that with decreasing the amount of λ y ratio, the stiffness degradation in compression is prominently reduced, so that the normalized values at drift 3.7% for HAF and HAS specimens in the first group are about 3.2 and 3.2 times and in the second group 4 and 2.7 times, respectively. Alternatively, the ultimate normalized values of these specimens are about 2.0 and 2.0 times in the first group and about 2.8 and 2.1 times in the second group, respectively.
Energy dissipation and equivalent viscous damping
Assessing the effect of λ
y
ratio on ASHs energy dissipation is especially important. The cumulative energy dissipated by test specimens in loading cycles is shown in Figure 14(a). Note that in the figure the post-yielding data has been only considered (i.e., from cycle 12). (a) Cumulative energy dissipation of test specimens and (b) Comparison of ζeq responses.
Dissipated energy and equivalent viscous damping ratio, and dissipated energy per unit cross-section area.

The results demonstrate that the energy dissipation potential descends severely, when the λ y ratio increases, which it seems to be more pronounced by reduction of the e value. It should be noted that the second group specimens with twice value of e, 1.7 times of the cross-sectional area, and almost similar elastic stiffness (approximately 10% more) than the first group specimens, possessed higher energy dissipation, which this ratio for HA, HAS, and HAF specimens, were about 1.46, 1.18, and 1.31, respectively. However, it is clear that this increase somewhat can be attributed to higher value of their cross-sectional area.
Table 5 shows also the energy dissipation index per unit area (EI) of the tested specimens. The comparisons show that the corresponding first group specimens exhibited better performance than the second group. It can be seen that the EI ratio at each group upgrades by decrease of the λ y and e. As seen, by 50% reduction of e value, the EI ratio for HA, HAS, and HAF specimens about 1.18, 1.47, and 1.32 times increased, respectively. This result shows that regardless of the architecture space restrictions and aesthetic issues, for seismic retrofitting of a RC structure with ASHs by almost the same elastic stiffness, ASHs with less e value can be more economical in terms of energy dissipation.
The equivalent viscous damping ratio ζ
eq
, can be calculated by equation (13) (Chopra, 2001)
The results show that at each group, HAF and HA with ζ eq,Max equal to 0.31 and 0.21 exhibited the highest and lowest damping response among of the tested specimens, respectively. Similarly, these specimens possessed ζ eq,ave about 0.24 and 0.15–0.18, respectively. Further comparisons from Table 5 show that the ζ eq,Max and ζ eq,ave responses increased up to 1.43 and 1.60 times, respectively, when the λ y ratio and overall buckling potential were minimized. Therefore, as results demonstrate more desirable damping response can be obtained during cyclic loading by adopting adequate value of λ y ratio for ASH cross-section. Note that above results have been obtained per ζ eq,Max and ζ eq,ave and may be subjected to change if comparisons to be made based on cycle number. For example, per a given cycle number, namely cycle 21, the normalized ζ eq ratio for HAF 0.2 and HAS 0.2 are about 1.6 and 1.2 times, and for HAF 0.1 and HAS 0.1 are about 2.0 and 1.7 times, respectively. Similarly, these ratios per ultimate deformation of each specimen are about 1.5 and 1.2 times, and about 2.3 and 1.5 times, respectively. Anyway, the ζ eq ratio for the second group specimens are more than their corresponding at first group almost per each cycle and ultimate deformation, as shown in Figure 14(b) and Table 5. It can be due to their larger e/e t,c variations rate as well as deformation capacity per a given strength.
Conclusion
In this experimental study, six specimens in two groups with initial axial eccentricity e, equal to 0.1 and 0.2 of their nominal length were designed and fabricated, and then subjected to horizontal cyclic loading. The specimens out-of-plane slenderness ratio (about minor axis) λy at each group with the same cross-sectional area and elastic stiffness, varied about 16, 69, and 138. The obtained observations and results from the analytical and experimental investigations showed that • For each central angle 2α value (or e) of the ASHs, by increasing in-plane slenderness ratio λ
x
, their chord stiffness and consequently, horizontal stiffness K
e
decreases in second-order function. • The ASHs compressive behavior is more affected by λ
y
ratio than tensile behavior; however, the d/t
f
ratio can be effective on both tensile and compressive behavior directly. • The ASHs with adequate values of λ
y
and d/t
f
ratios at each group could exhibit more stable and symmetric hysteretic response. It can be said that by decrease of λ
y
and d/t
f
ratios, and delay in overall and local buckling, the maximum compressive strength and post-buckling behavior improved remarkably. Resultantly, the maximum compressive strength at first and second group specimens about 1.59–1.78 and 1.32–1.61 times, and their ultimate value approximately two and three times upgraded, respectively. Moreover, their dissipated energy up to 3.32 and 2.98 times, and their equivalent viscous damping ζ
eq,Max
up to 1.41 and 1.43 times developed. It is recommended to be adjusted the ASH λ
y
ratio with its in-plane plastic strength for prevention of the premature overall buckling. • Different behavior in tensile and compressive maximum strength of the ASHs was more prominent, when the e value decreased and the λ
y
ratio increased. The strength index (SI), which is defined as the maximum to yield strength ratio, in tension was more significant than compression and for the first and second group specimens in tension varied between 1.64–3.06 and 1.23–1.54 times and in compression were about 1.15–1.85 and 1.08–1.65, respectively. This behavior can be considered as a challenge in retrofitting design process. • The effect of ASHs cross-section area on ultimate tensile strength was more pronounced by reduction in value of e. It is due to decrease in e/e
t
variations rate and approaching their straighter state. Both d/t
f
ratio and γ can be more effective than λ
y
on ASH tensile post-yielding strength. It is recommended that the d/t
f
ratio to be less than 7.0 for prevention of the lateral-torsional buckling. • The tensile plastic stiffness • The ASHs with less e value (about 50%), exhibited up to 25% lower plastic deformation capacity (i.e., ductility) because of reduction at their e/e
t,c
variations rate and reaching to its straighter states. It can be critical at the structure with large deformation demand. • Regardless of the architecture space restrictions and aesthetic issues, for seismic retrofitting of a RC structure with ASHs by almost the same elastic stiffness, ASHs with less e value can be more economical in term of energy dissipation. • The ASHs can be designed and utilized in two various scenarios for upgrading/retrofitting of RC frames; as a fuse or hysteretic device for improvement of the strength and energy dissipation, and as a stiff element to prevent the joints premature shear failure by relocating of plastic hinges to beam members.
Supplemental Material
sj-pdf-1-ase-10.1177_13694332211063677 – Supplemental Material for Eccentricity and slenderness ratio effects of arched steel haunches subjected to cyclic loading; experimental study
Supplemental Material, sj-pdf-1-ase-10.1177_13694332211063677 for Eccentricity and slenderness ratio effects of arched steel haunches subjected to cyclic loading; experimental study by Ebrahim Emami, Ali Kheyroddin, and Omid Rezaifar in Advances in Structural Engineering
Footnotes
Declaration of conflicting interests
The author(s) declared no potential conflicts of interest with respect to the research, authorship, and/or publication of this article.
Funding
The author(s) received no financial support for the research, authorship, and/or publication of this article.

Supplemental Material
Supplemental material for this article is available online.
References
Supplementary Material
Please find the following supplemental material available below.
For Open Access articles published under a Creative Commons License, all supplemental material carries the same license as the article it is associated with.
For non-Open Access articles published, all supplemental material carries a non-exclusive license, and permission requests for re-use of supplemental material or any part of supplemental material shall be sent directly to the copyright owner as specified in the copyright notice associated with the article.
