



Abstract
The subway station structures have a contradiction in its design of the cross section of the central columns: larger aspect ratio increases the longitudinal traffic capacity, yet decreases the lateral seismic capacity. However, both capacities are important. Thus, finding a reasonable aspect ratio has become a significant problem to be studied in depth. In this article, a series of time history analyses are carried out on a typical two-story three-span subway station structure, and ultimate bearing capacity analysis of isolated columns of various sizes is performed. The static axial compression ratio (ranging from 0.13 to 0.68) and the aspect ratio (ranging from 0.04 to 26.67) are taken as parameters, and their influence on internal force and damage to the structure are explored. It is found that the increase in axial compression ratio of the columns increases both the compression and tension damage and reduces the seismic performance of the station structure. However, the influence of increasing the aspect ratio of columns on the seismic performance of structures is more complicated. The compression and tension damage rises first (ranging from 0.04 to 1.67) and then decreases (greater than 6.67), while the tension damage of the structure increases monotonously. Finally, (0.15, 0.6) is given as the recommended aspect ratio range.
Keywords
Introduction
As a convenient and efficient transportation, underground subway is principally used all over the world (Chen et al., 2016), and the construction of subway has gained a rapid development in China (Ying, 2011). Because of the serious damage to the Daikai station caused by the 1995 Hanshin earthquake in Japan (Nakamura et al., 1996), there is increasing research into the seismic performance of subway stations (Chen et al., 2014b, 2016; Khani and Homami 2014; Yamato et al., 1996). Iida et al. (1996), An et al. (1997), and Huo et al. (2005) studied the damage to the Daikai station caused by the earthquake and concluded that it was caused by the failure of central columns that led to the collapse of the top plate. Other studies have also concluded that the central columns were the weakest components of the subway station structure (Chen et al., 2013; Zhao et al., 2009).
The cross-sectional design of the central columns in subway station structures generally includes the following steps. First, the cross-sectional area (AC) is determined according to the axial compression ratio parameters, which is defined as follows

where
At present, the cross-sectional design of the central columns of station structures is mainly based on the Code for Seismic Design of Buildings (GB50011, 2010) and the Code for Design of Metro (GB50157, 2013). The Code for Seismic Design of Buildings (GB50011, 2010) regulates the requirements of axial compression ratio and H/B for ground reinforced concrete (RC) frame structures. In the design of central columns of subway station structures, H/B should be more than 1/3 but less than 3. The Code for Design of Metro (GB50157, 2013) considers the higher safety requirements of the central columns of subway station structures but only provides a rough recommendation for the central columns to be replaced by central walls. For the surface RC structure, it has become the consensus that the H/B of the column needs to be close to 1 in order to meet the stiffness requirements in each direction. Compared with typical surface RC frame structures, subway station structures are very different in form. Subway stations are far longer than the width of the cross section (Hashash et al., 2001). Therefore, most subway station structures only have beams along the longitudinal direction; there are no beams along the lateral direction. Given the notable differences between RC frame structures on the ground and subway station structures, it is doubtful that the design of the central columns of subway station structures has the same requirements as surface RC frames.
Research into the parameters of RC columns is abundant (Atalay and Penzien, 1975; Iwasaki et al., 1985; Lam et al., 2003; Sheikh and Khoury, 1993; Wong et al., 1993; Zhang et al., 2005). Studies are mainly aimed at columns in surface RC structures and there is limited research into aspect ratio. The H/B parameters have a significant influence on the bearing and deformation capacity of the column, especially for subway station structures, because their design should consider both the seismic capacity of the station and also the longitudinal traffic capacity.
In this article, a series of time history analyses are performed of a typical two-story three-span subway station structure, using the general purposed finite element code ABAQUS/CAE (2009). Ultimate bearing capacity analysis of isolated columns which have various sizes is also performed. The static axial compression ratio (which means that the static axial force is used to calculate the axial compression ratio in equation (1)) and H/B are taken as parameters.
Project background
The two-story three-span subway station structure chosen for our model is located in Shanghai, China. The ground elevation is 3.70–4.70 m. Landforms are coastal plain type and strata are quaternary sedimentary. The underground water depth of the site is 0.50–2.60 m. According to the Code for Seismic Design of Buildings (GB50011, 2010), the site soil belongs to a weak soil type and a building site of Grade IV. The designed peak ground acceleration (PGA) is 0.1 g. The station is an island-style station, which has a total of three entrances and three shafts. The upper layer is the station hall, while the lower layer is the island platform. The station is constructed by the cut and cover method, and a diaphragm wall is used for retaining structure. The maximum length of the station is 470 m. Figure 1(a) shows the standard cross section of the station structure. The excavation depth of the center position of the standard cross section is 15.27 m, and the width and height are 20.9 and 12.37 m, respectively. The roof depth of the structure is 2.9 m. The station structure is provided with a lining wall within the diaphragm wall, and the lining wall and diaphragm wall are connected by embedded parts which ensure that the diaphragm wall bears the load in conjunction with the lining wall. Central columns of both floors are of the same size: 1.0-m long and 0.6-m wide. The spacing between central columns along the longitudinal direction of the station structure is 8 m, while the spacing between central columns along the cross-sectional direction of the station structure is 5.3 m.
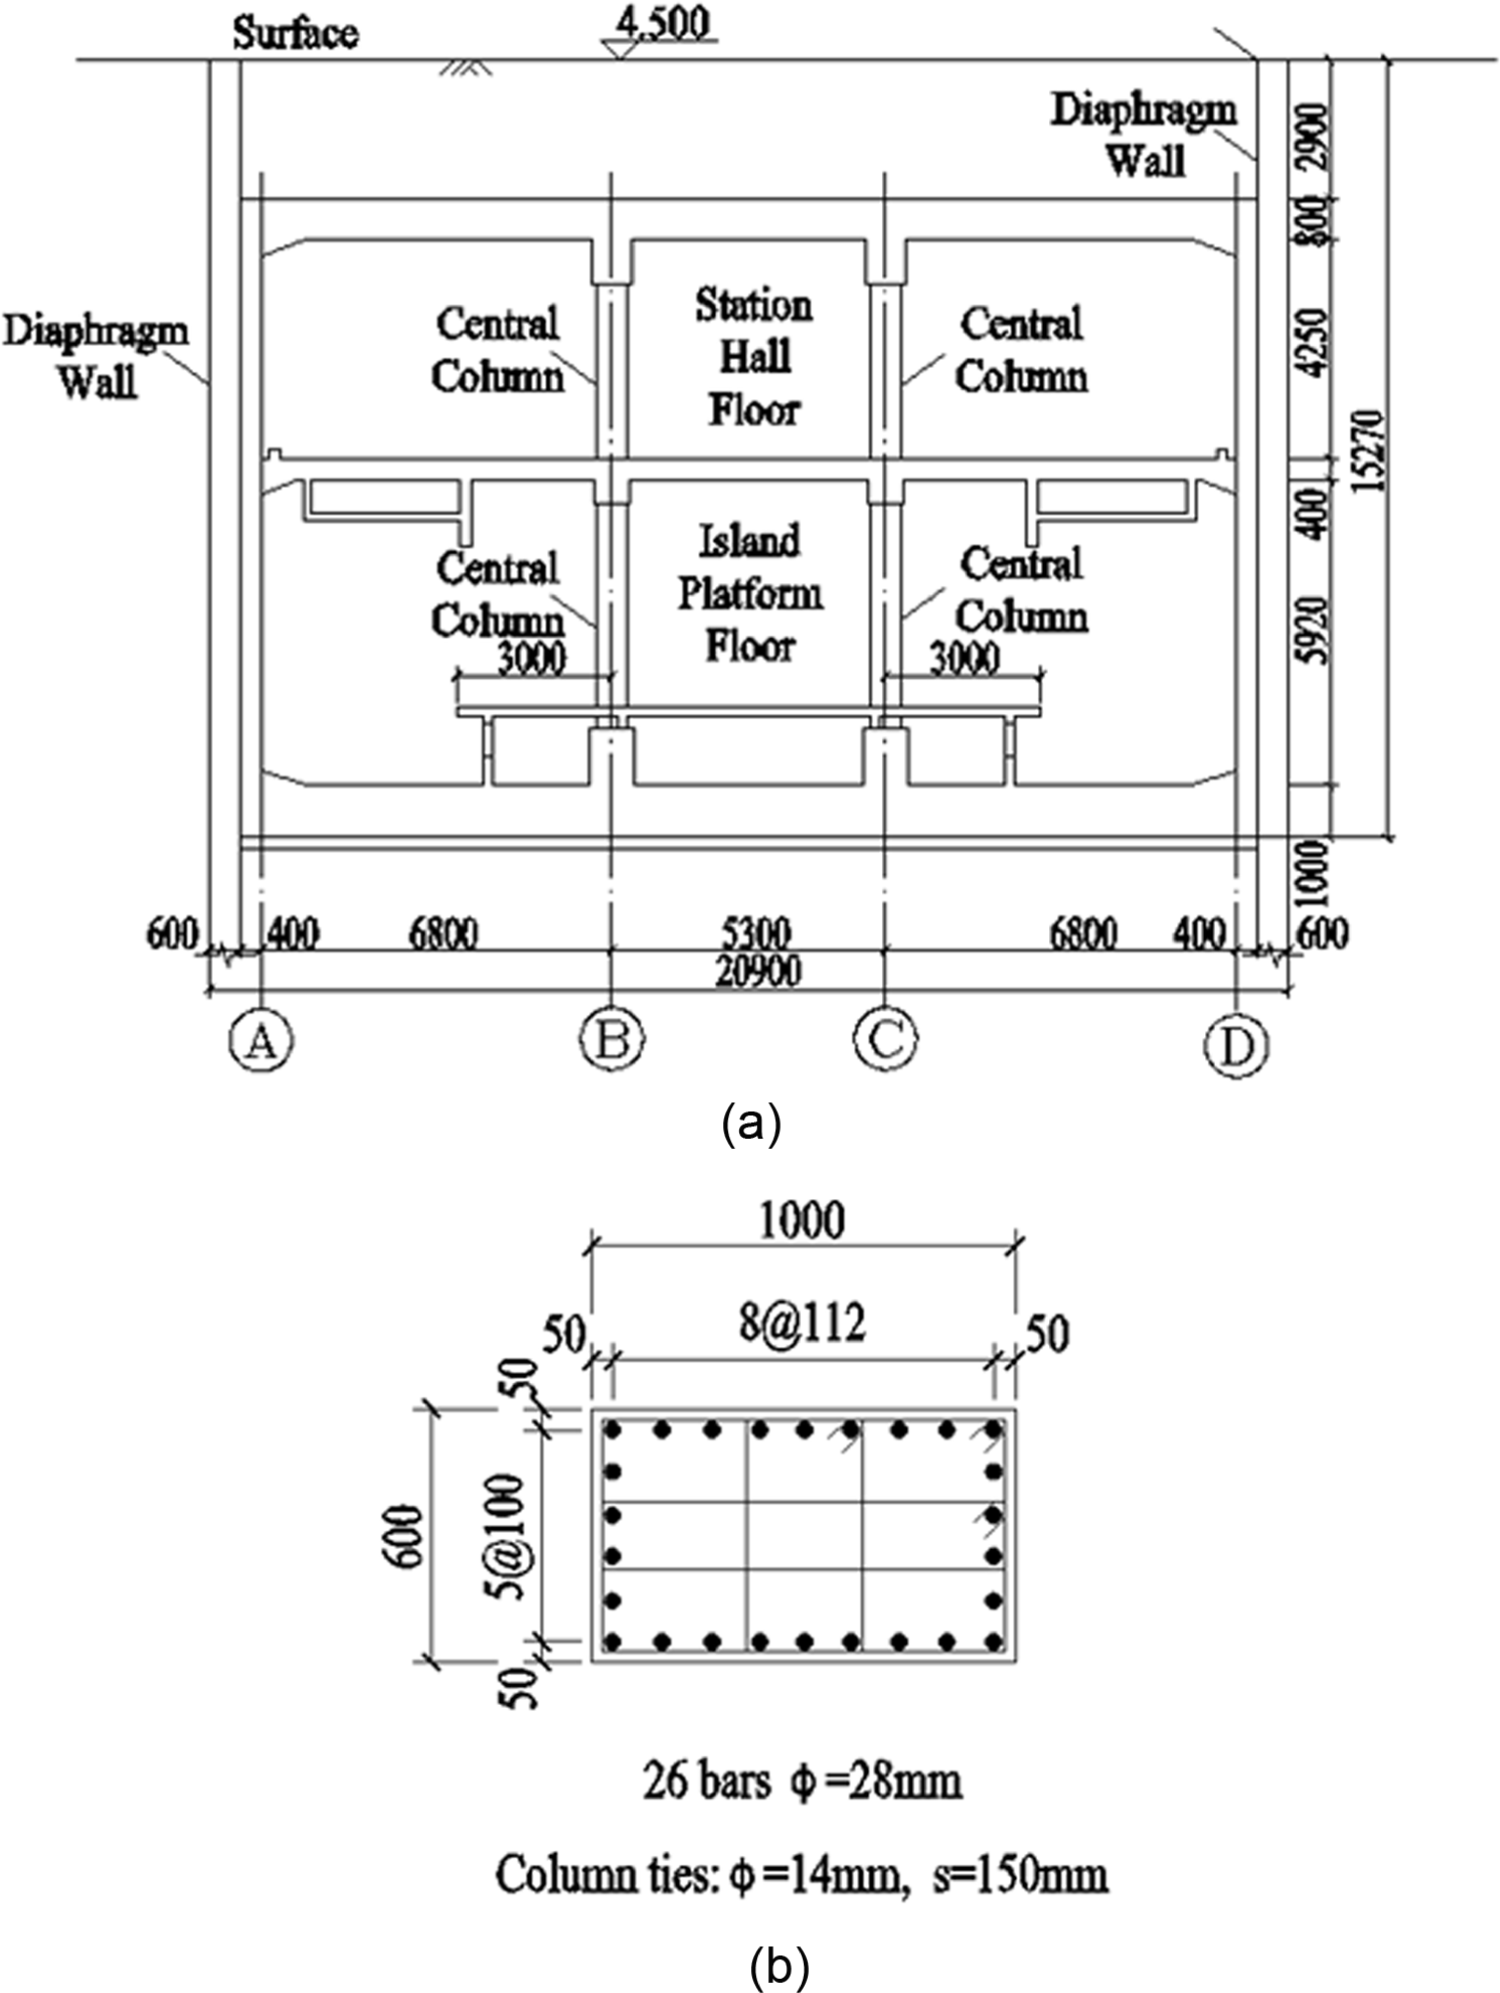
Standard cross section of subway station structure and reinforcement details of central column cross section (unit: mm): (a) cross section of the station and (b) reinforcement details of central column cross section.
Setup of the numerical model of the station
Numerical model
A soil–structural dynamic interaction analysis model was established in the finite element code ABAQUS. The size of the structure is shown by the standard cross section in Figure 1(a). According to the Code for Seismic Design of Buildings (GB50011, 2010), the width of each side of soil around the structure should be at least three times larger than the width of the structure. In the model, the width of each side of soil was 250 m.
An infinite element boundary was used for the soil lateral boundary. The infinite elements provided by ABAQUS are based on the static analysis of Zienkiewicz et al. (1991) and the dynamic response analysis of Lysmer and Kuhlemeyer (1969). On the traditional artificial truncation boundary, the wave will be reflected on the boundary surface, which will return the energy to the analysis grid. In fact, the waves travel to infinity, and we do not care too much about the propagation of waves in the far field, but it is necessary to ensure that it has little impact on the analysis area. The infinite element in ABAQUS does this well by setting damping on the boundary, which means that it can simulate no reflection. Thus, it can be used as the lateral boundary of the model.
Because of the lack of experimental data concerning deep drilling soil samples, the soil was modeled down to a 60.55 m depth from ground surface. The depth of soil from the bottom plate was 45.28 m, which was more than three times the height of the station. The X and Y direction degrees of freedom of the soil element nodes at the bottom boundary were imposed before the ground motion was input. The established analytical model is shown in Figure 2.

Numerical analysis model.
Constitutive models and properties of materials
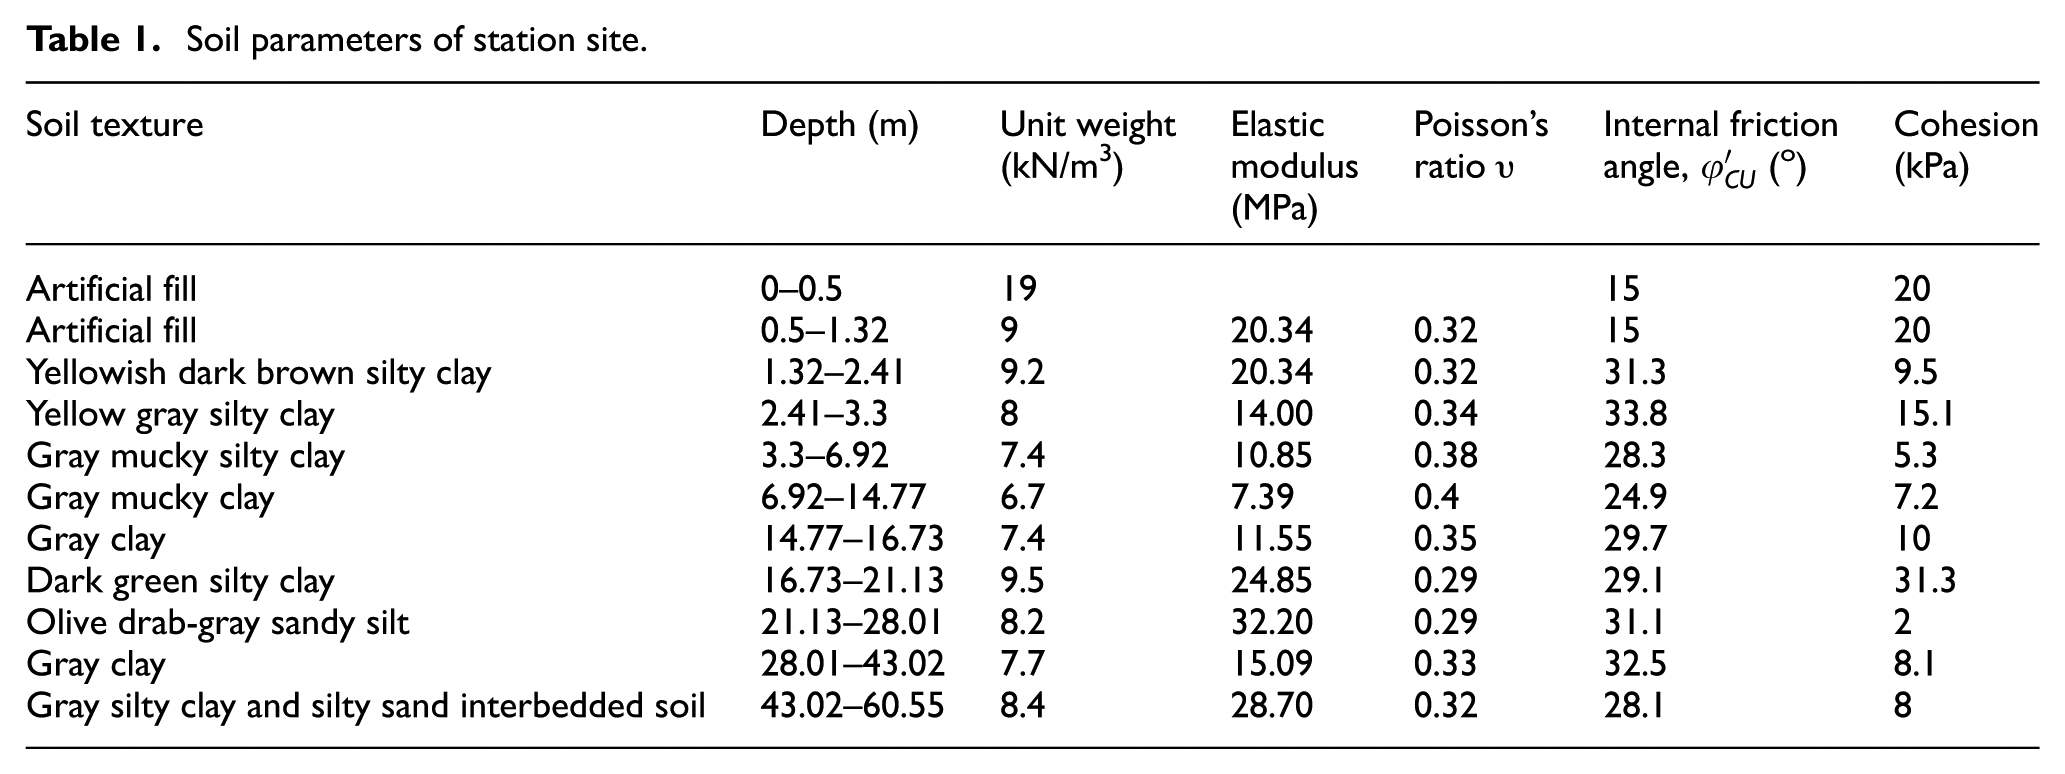
Mohr–Coulomb elastic–plastic constitutive model which adopts kinematic hardening rule was applied for soil mass, and the specific properties are shown in Table 1. According to the engineering geological exploration, the soil mass in the depth range was roughly divided into 10 layers. The effective shear strength indexes (effective internal friction angle,
Soil parameters of station site.
A beam element (B21) was used to simulate the station structure. As the central columns are the main structural components that are studied in this article, the computational elements of the central columns were relatively dense to other components; each central column was divided into 90 elements.
To better simulate the dynamic response of the structure in the elastic–plastic stage, the concrete damaged plasticity model was adopted. According to the model (established on the basis of the theories of Lubliner et al. (1989) and Lee and Fenves (1998)), a damage factor D is used to describe the degree of damage and stiffness degradation of the concrete

where
D is divided into two types, Dt and Dc, which are used to describe the tension and compression damage of concrete materials, respectively

Their value range lies between 0 and 1. The larger the value of the structure, the more serious the damage is; when the value is 0, the structure is in the elastic stage.
Based on this theory, the degradation of the elastic stiffness is characterized by two damage variables, dt and dc (ABAQUS/CAE, 2009). dt and dc are both a function of plastic strain, temperature, and field variables.
To better represent the two different behaviors in the tensile region and compressive region, a yield function (Lubliner et al., 1989) is given as equations (4) to (7)




where
The central columns of the structure were concrete of grade C45 (GB50010, 2010). Its elastic modulus, Poisson’s ratio, tensile, and compression strength were 33.5 GPa, 0.2, 2.51 MPa, and 29.6 MPa, respectively. Other parts of the structure were concrete of C35 grade, whose parameters were 31.5 GPa, 0.2, 2.20 MPa, and 23.4 MPa, respectively.
Idealized elastic–plastic model (bilinear isotropic model) which adopts kinematic hardening rule was selected for rebar. Reinforcement ratios of central column, sidewall, top plate, middle plate, and bottom plate were 2.7%, 1.9%, 1.1%, 1.2%, and 1.4%, respectively. Particularly, the reinforcement details of the central column in the station are illustrated in Figure 1(b). The column was reinforced with 26 longitudinal bars of 28 mm diameter. Stirrups with 90° hooks of transverse reinforcement were used in the central columns of the standard cross section, and transverse reinforcement consisted of 14-mm bars spaced at 150 mm. Rebar used in structures was HRB400, of which the elastic modulus and yield strength were 200 GPa and 400 MPa, respectively.
The soil–structure interaction was defined by the Coulomb friction law. The coefficient of friction was assumed to be 0.4, which is equivalent to a friction angle of 22° (Chen et al., 2014a; Huo et al., 2005).
Input ground motion
The input ground motion at the bottom of the numerical analysis model was based upon the El Centro earthquake. The time history data of the wave was from the Pacific Earthquake Engineering Research Center (2000) in the United States. The N-S and vertical acceleration time histories are shown in Figure 3.
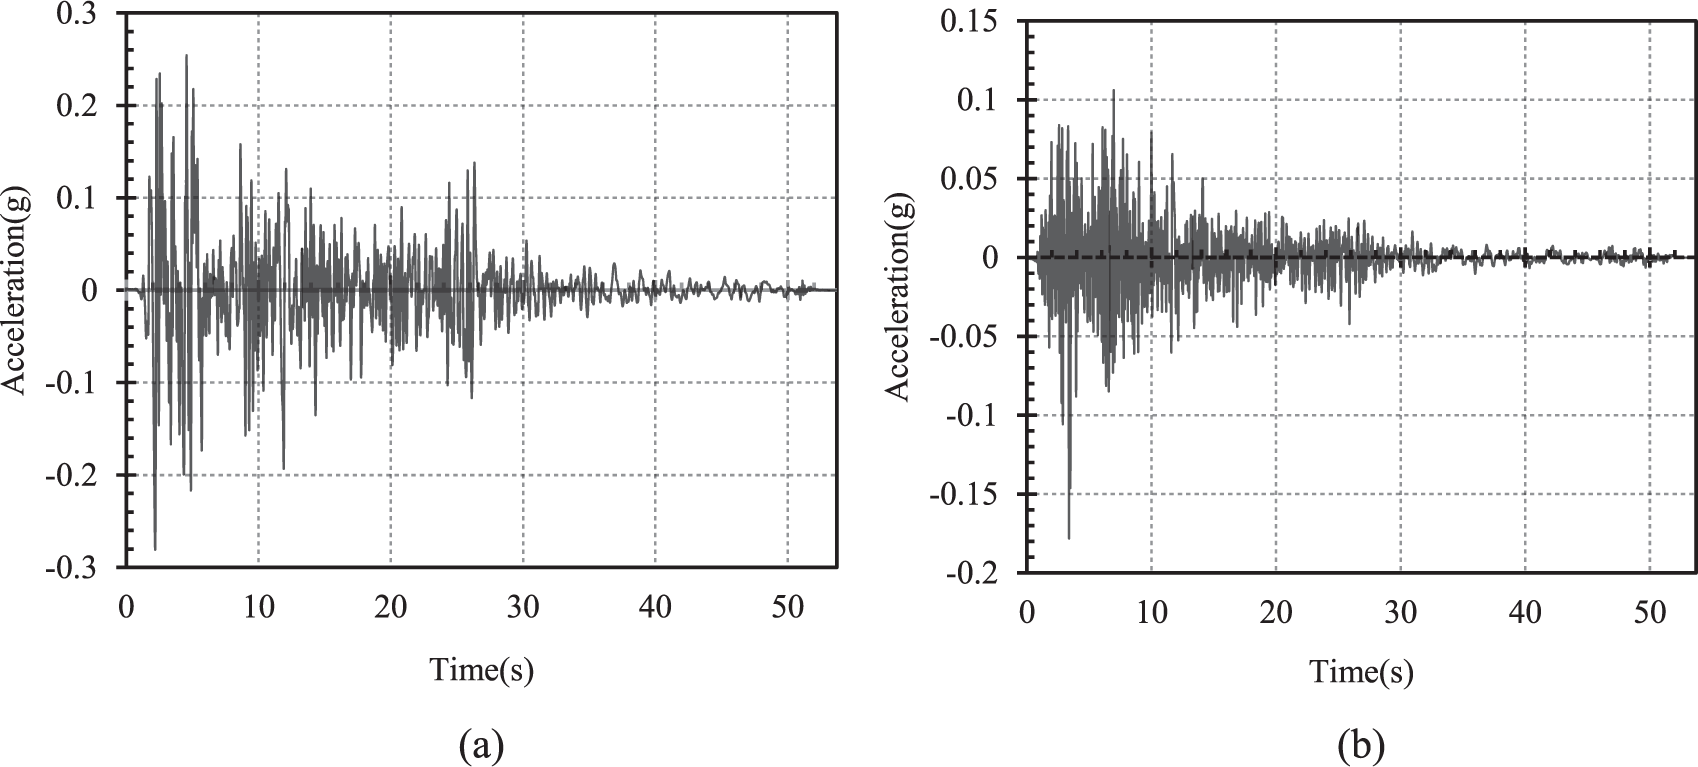
Acceleration time histories of El Centro: (a) south–north component and (b) vertical component.
It should be noted that the peak values of the input ground motion in the horizontal direction at the bottom of the numerical analysis model were adjusted to two levels of 0.033 and 0.073 g. Then, the PGA responses in the horizontal direction were about 0.1 and 0.22 g, respectively, which were in accordance with the intensity of a moderate earthquake (seismic intensity with a 10% exceedance probability in 50 years) and rare earthquake (seismic intensity with a 2% exceedance probability in 50 years). Peak accelerations of input ground motion in the vertical direction were set as 65% of the horizontal ones.
Design of the calculation conditions and choice of components and analysis of cross sections
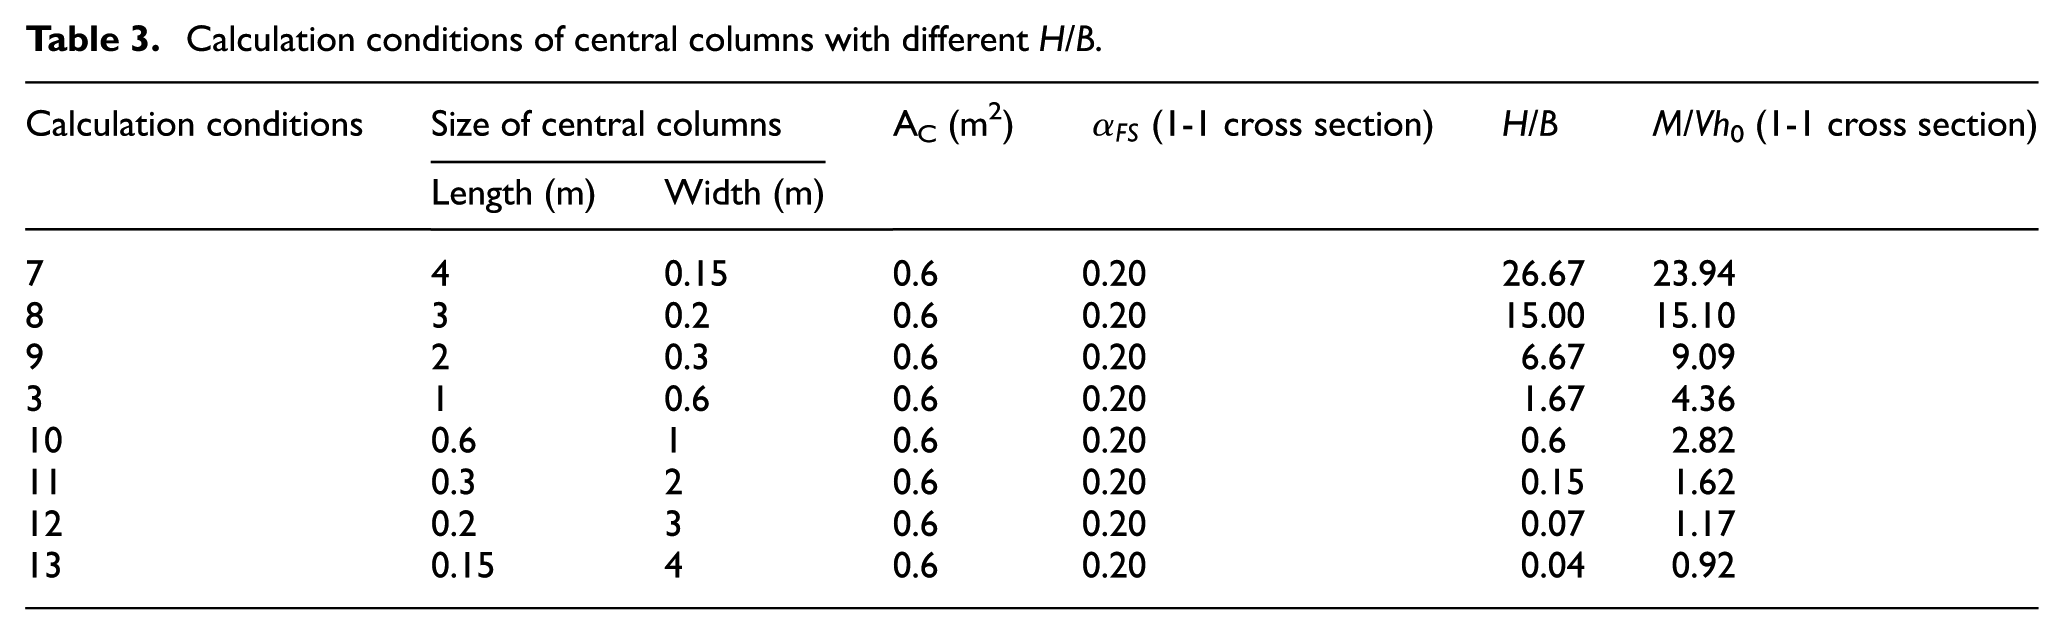
The length (L) and width (W) of the column in this typical metro station is 1.0 and 0.6 m, respectively. The cross-sectional area (AC) of the central columns is 0.6 m2 and H/B is 1.67. To study the influences of the axial compression ratio and H/B of the central columns on the seismic performance of columns and structures, a single variable method is adopted. This means that
Calculation conditions of central columns with different
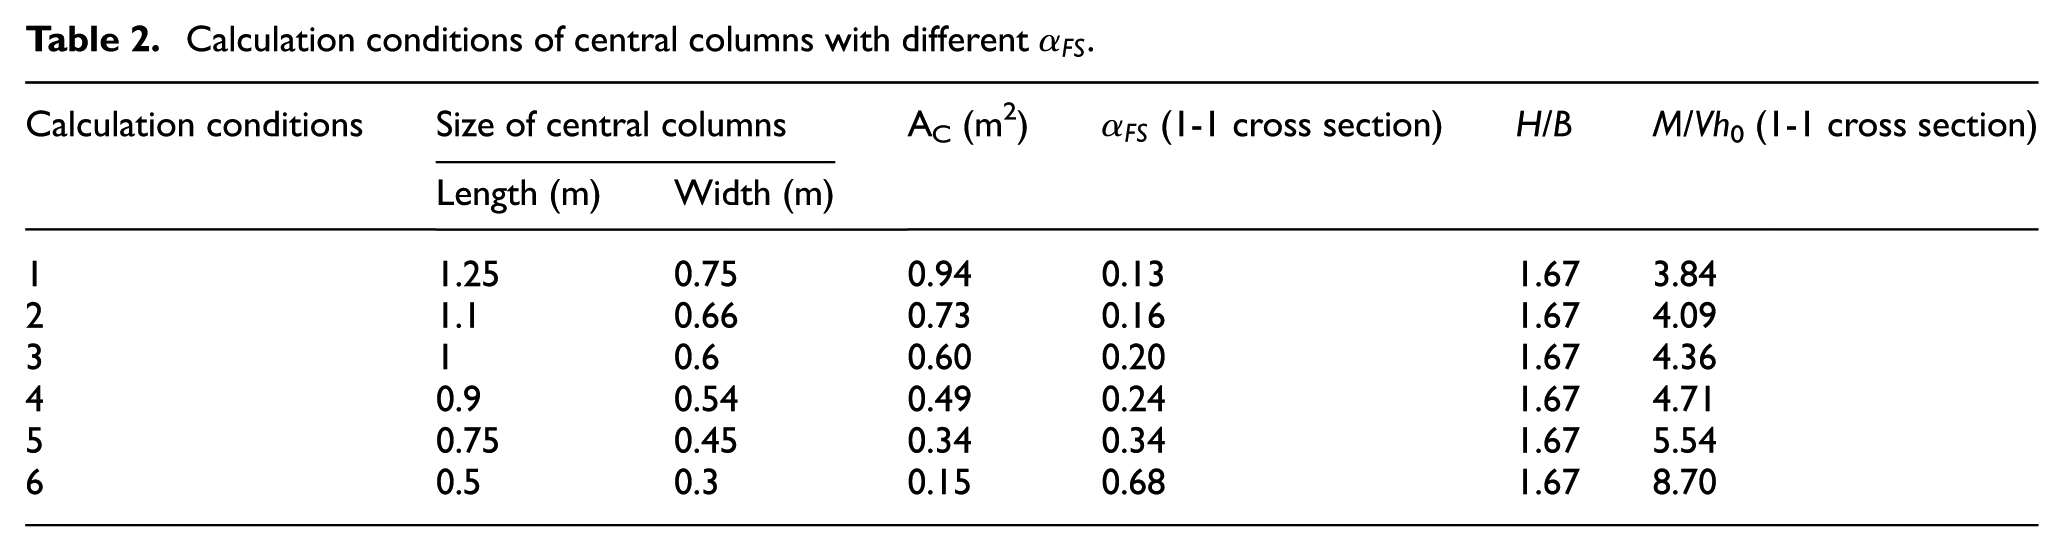
Calculation conditions of central columns with different H/B.
According to the symmetry of the structure, 1-1 cross section in central columns is chosen because it has the maximum axial compression ratio, and 2-2 cross section is chosen because it has the maximum shear force and sidewall bending moment when analyzing internal forces; No. 1 and No. 2 central column drifts and left sidewall drift to represent the structure drift are chosen when analyzing the relative displacement, as shown in Figure 4.
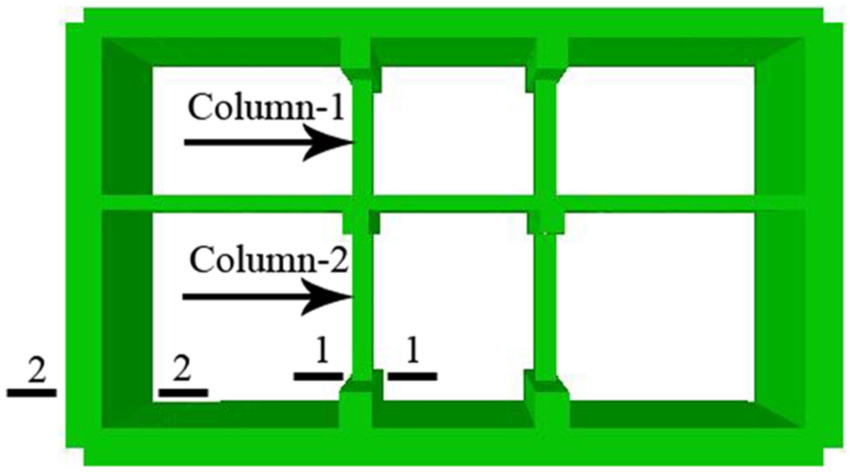
Analysis components and cross sections.
Numerical results and discussion
Story drifts
Figure 5 shows the variation curves of No. 1 and No. 2 central column drifts and the structural drift when
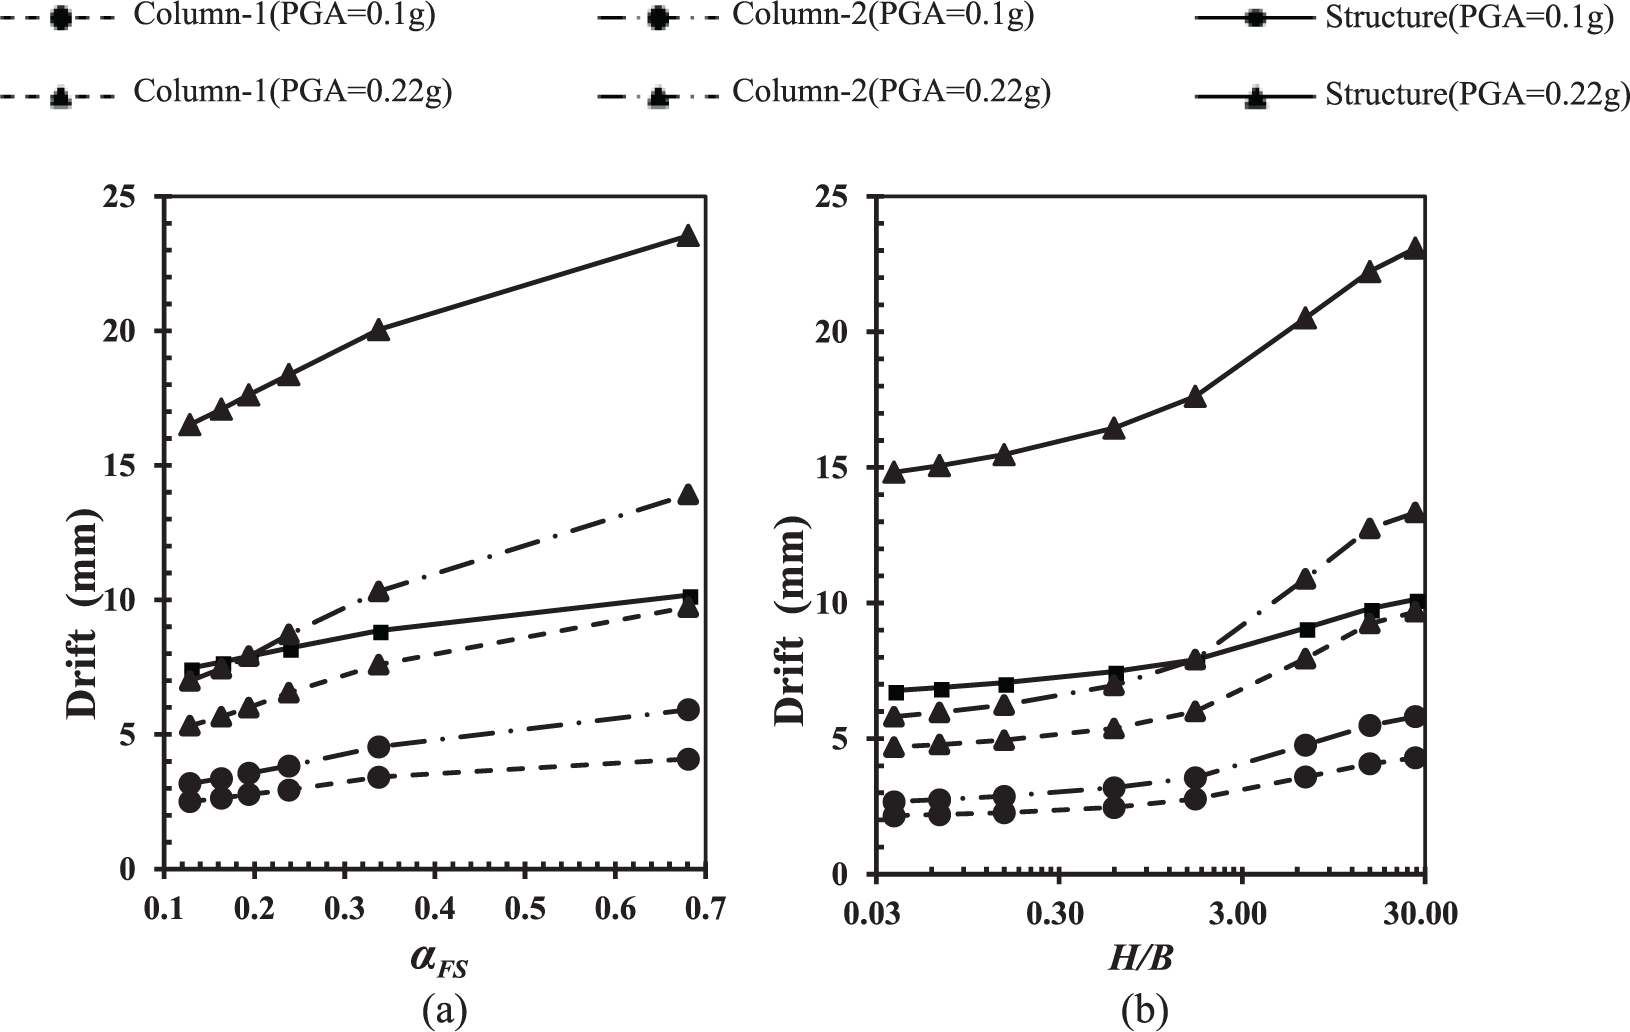
Variation curves of central column drifts and the structure drift: (a) H/B = 1.67 and (b)
As shown in Figure 5(a), for PGA = 0.1 g, the No. 1 and No. 2 central column drifts and the structural drift increase by 63%, 86%, and 36%, respectively; for PGA = 0.22 g, these three drifts increase by 82%, 99%, and 42%, respectively. As shown in Figure 5(b), for PGA = 0.1 g, the No. 1 and No. 2 central column drifts and the structural drift increase by 99%, 117%, and 50%, respectively; for PGA = 0.22 g, these three drifts increase by 106%, 130%, and 56%, respectively. Overall, the variation regularities of the drifts of the columns and the structure with the change of
Internal forces of columns and sidewalls
Axial force
Figure 6 shows the variation regularities of the axial force of the central columns (1-1 cross section) and the sidewalls (2-2 cross section) in a static state (static axial force) and with underground motions (dynamic axial force) when
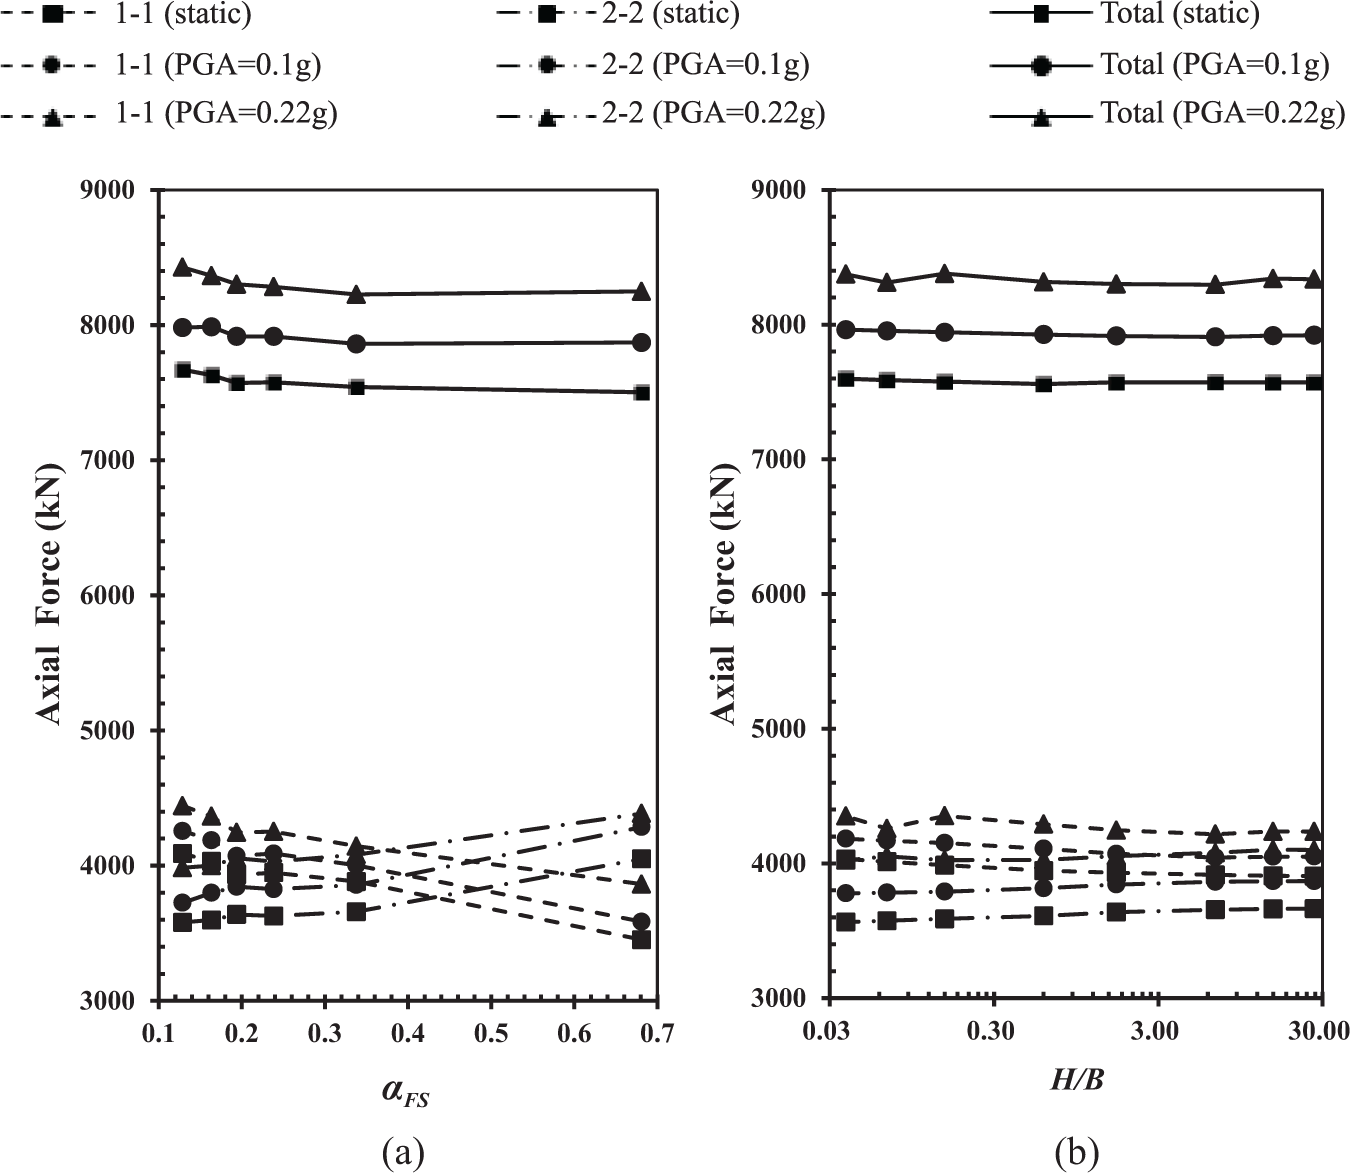
Variation curves of axial force: (a) H/B = 1.67 and (b)
As can be seen from Figure 6(a), when H/B = 1.67, as
As mentioned in the “Introduction” section, AC is considered to be the most important parameter affecting the axial compression ratio in the design, and the influence of H/B on the axial compression ratio of central columns is not considered. In this article, the design of calculation conditions is also based on the control of axial compression ratio by AC. However, according to equation (1), although H/B does not affect the AC and fC, we cannot exclude the possibility that the axial force of components’ changes to some extent. While
In short, although both the increase in
Shear force and bending moment
The variation of the shear forces and bending moments is more significant than that of the axial forces. Theoretically, changes in
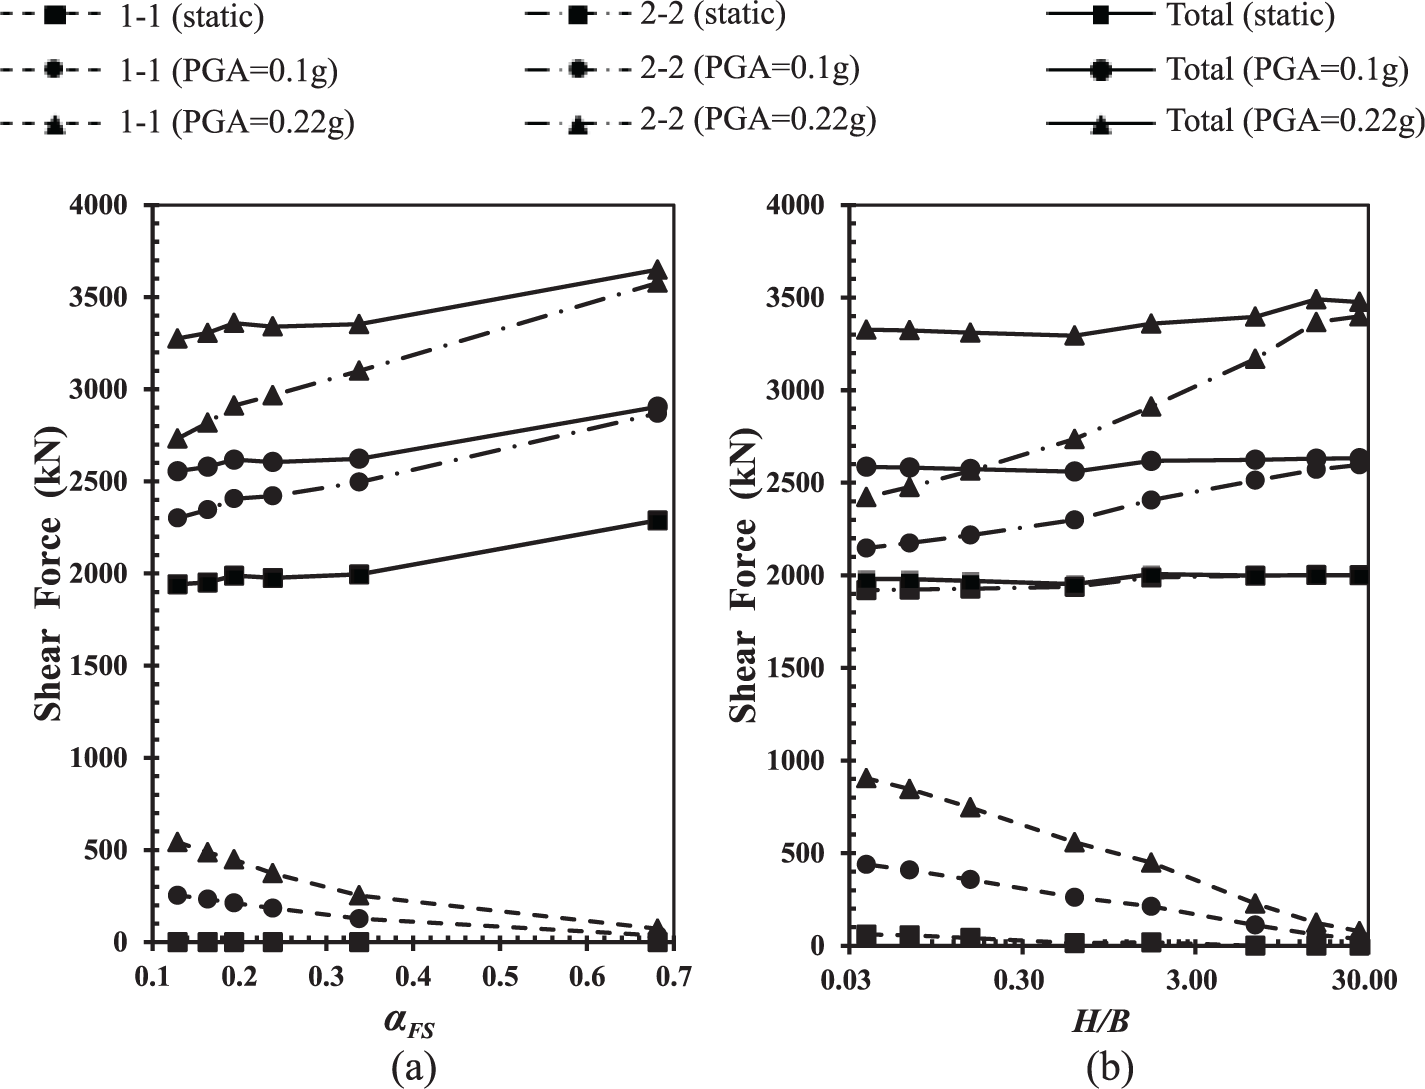
Variation curves of shear force: (a) H/B = 1.67 and (b)
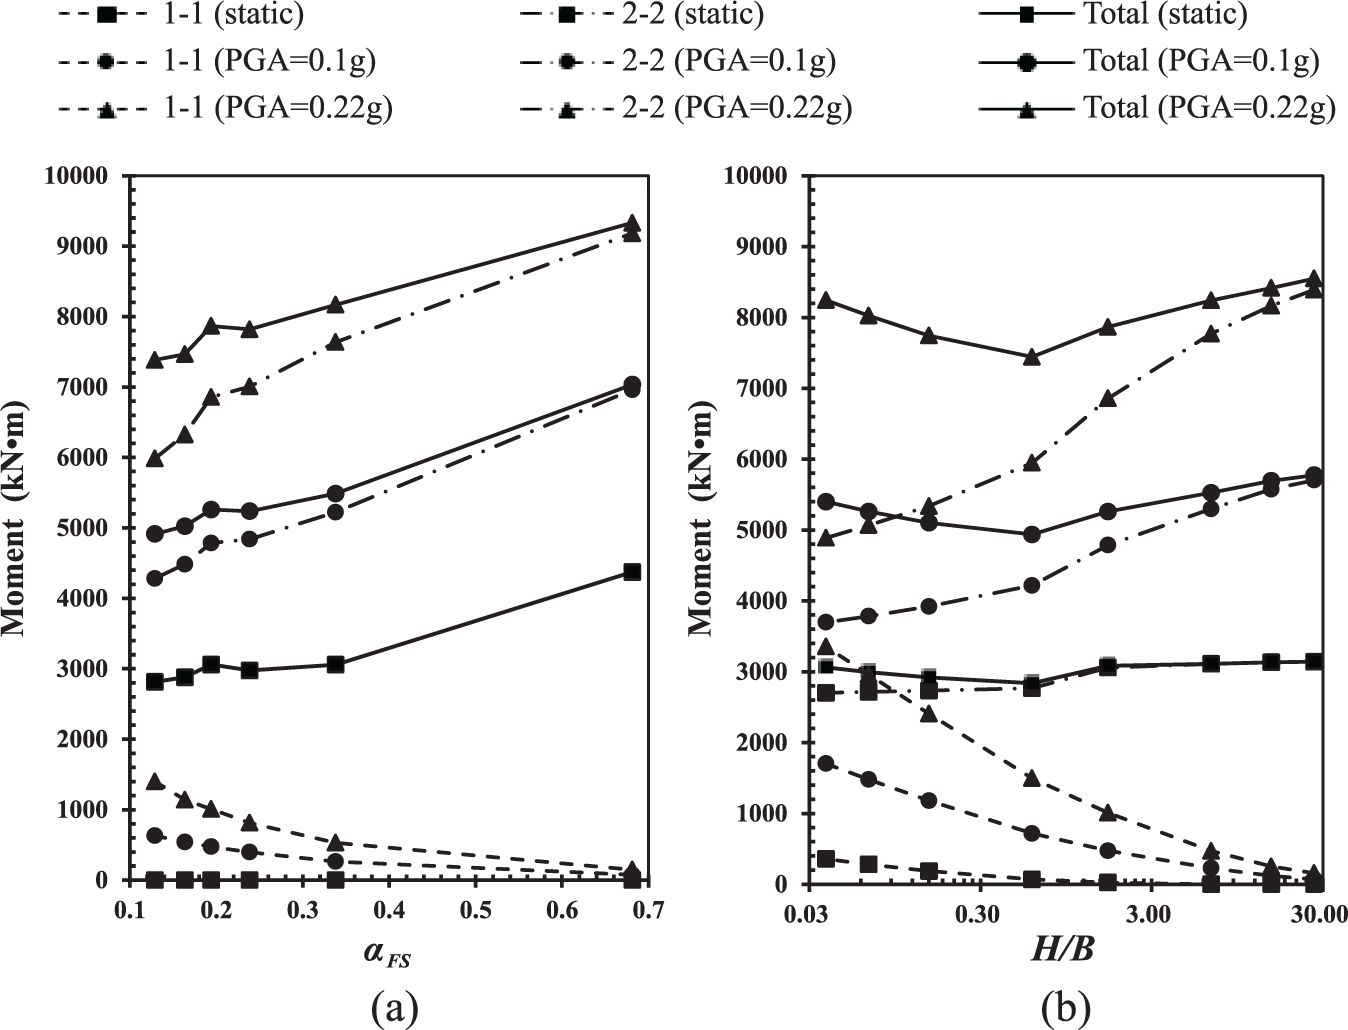
Variation curves of bending moment: (a) H/B = 1.67 and (b)
When H/B = 1.67, with the increase in
As mentioned before, the change of H/B changes the relative stiffness between the sidewall and central column, which may affect the distribution of static and dynamic shear force and bending moment between them, and the distribution is significant for structural design. When
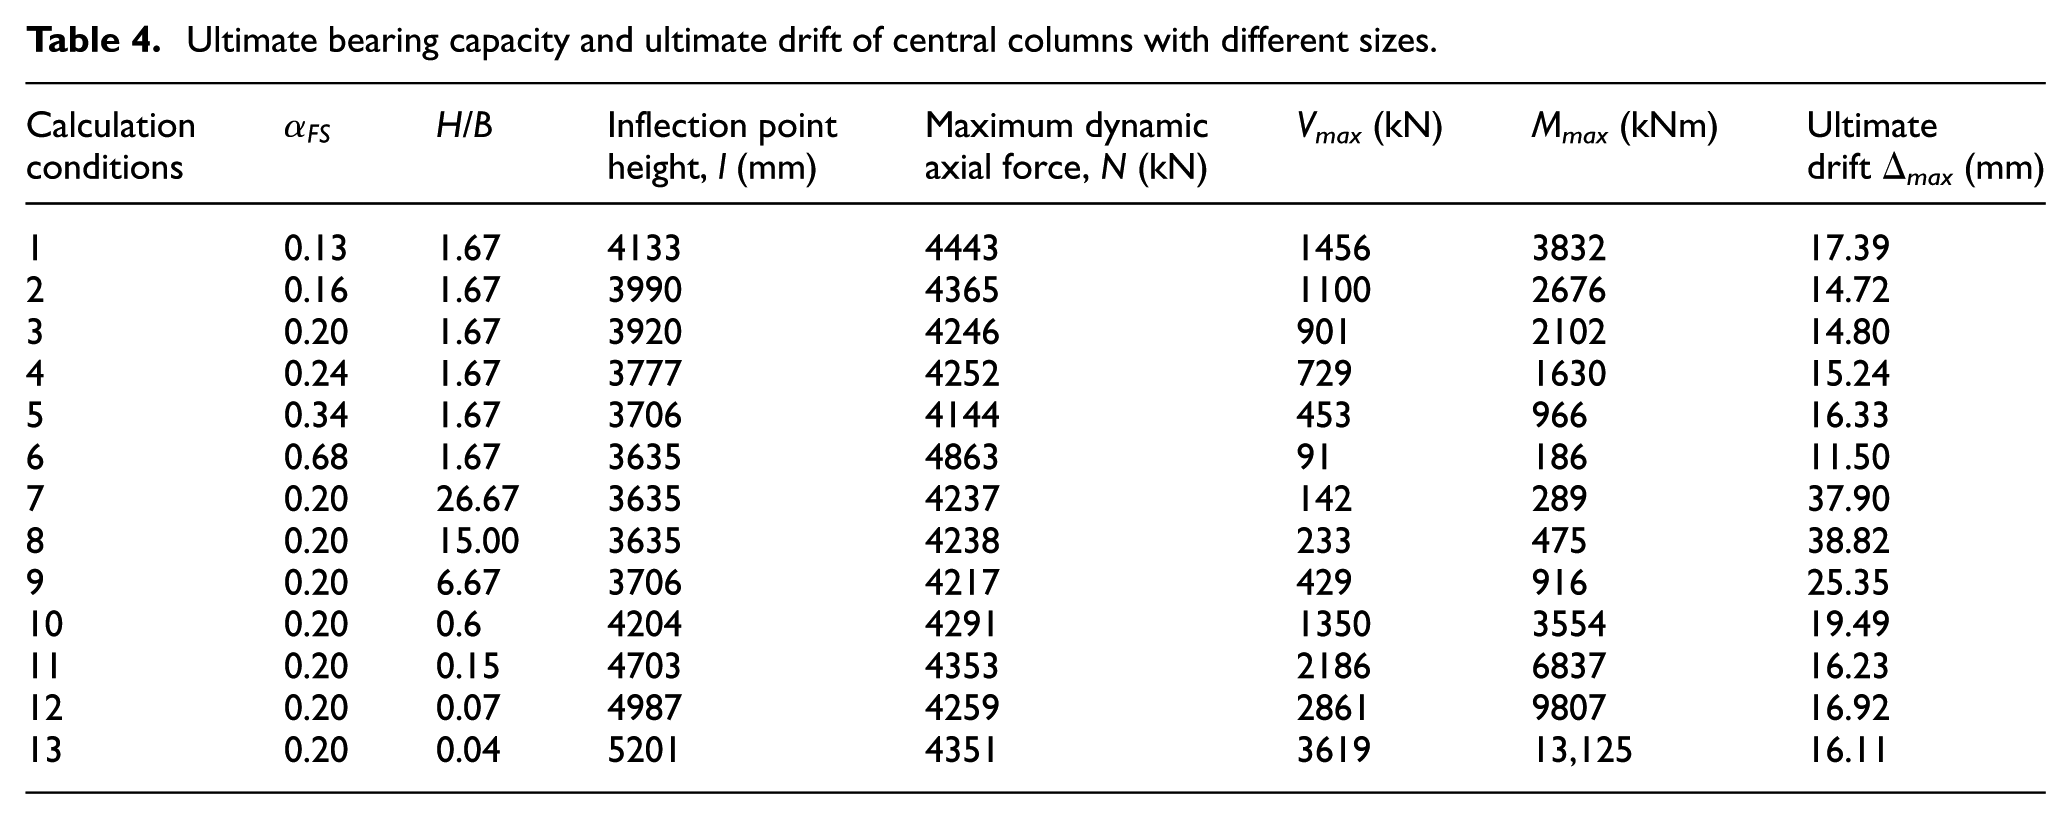
Ultimate bearing capacity and ultimate drift of central columns with different sizes.
In short, the increase in
Ultimate bearing capacity of the central columns
With the increase in
When the column cross-sectional size is close to (or even larger than) longitudinal beam, the column stiffness is close to (or larger than) the longitudinal beam stiffness (such as calculation conditions 12 and 13). Thus, in order to account for these extreme situations, the longitudinal beam and the column should be isolated and analyzed together. Figure 9(a) shows the isolated No. 2 central column with the longitudinal beams in both ends of the column. The length of the central column is 4270 mm, while the cross-sectional heights of the longitudinal beam at the top and the bottom of the column are 850 and 1500 mm, respectively. Because the linear stiffness ratio of bottom plate to vertical member is usually bigger than 10 in this junction, which means that bottom plate can be considered as a rigid body. Thus, it is reasonable that the bottom of the isolated system could be regarded as a fixed end. The upper boundary condition depended on the relative stiffness of each member of the joint, between the fixed and free constraints. If the column section size is small enough, the position of the inflection point (M = 0) should be located at the half-height of the column (l = 3635 mm), as shown in Figure 9(b), and if the column section size is large enough, the top of the isolated system (l = 6620 mm) is the point that meets the condition of M = 0, as shown in Figure 9(c). All the analysis conditions are located between these two limits, coupling the two limit conditions to different degrees. Therefore, as shown in Figure 9(d), the position of the inflection point is between 3635 and 6620 mm. According to the seismic damage of Daikai Station (Nakamura et al., 1996), the bottom of the column can be regarded as the most vulnerable location. So, the isolated system contains the most vulnerable location. The upper end of the isolated system has no bending moment due to the position of the inflection point; thus, the upper end of the isolated system could be free, then the vertical load which equals to the maximum dynamic axial force under rare ground motion (PGA = 0.22 g) and lateral load were applied at the position of the inflection point. After that, the corresponding ultimate lateral bearing capacity of the isolated system under the vertical load was obtained, as shown in Figure 9(e). Aschheim et al. (1997) and Moehle and Lehman (2006) both argue that the total deformation, Δ, of the RC cantilever column is composed of three parts, which are the bending deformation, the shear deformation and the bond-slip deformation. In the numerical analysis, the bond-slip deformation was not considered. Thus, the ultimate drift of the inflection point to the bottom of the isolated system can be described as the total deformation of this part.
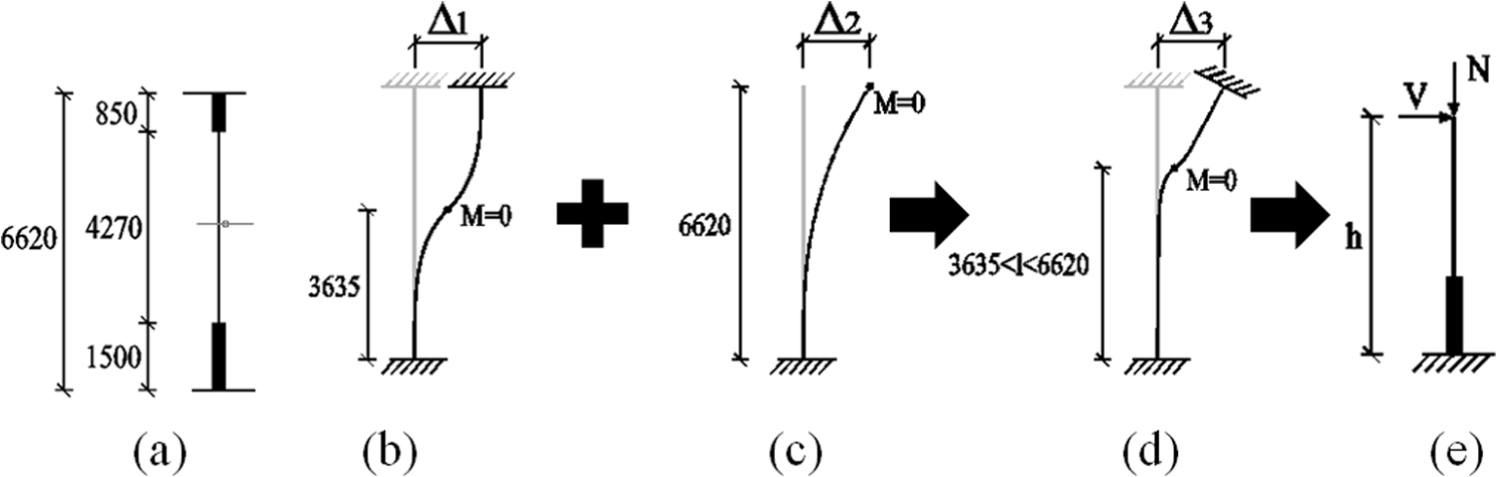
(a) Isolated No. 2 central column and (b–e) ultimate bearing capacity analysis model of No. 2 central column.
Beam element (B21) was used to simulate the isolated system, and it was divided into 185 elements. The concrete damaged plasticity model was adopted in the constitutive model, while the steel bar was simulated by the command *rebar, and materials and parameters were described in section “Constitutive models and properties of materials.”Table 4 reflects the inflection point height of the column with different sizes under rare earthquake as well as the ultimate bearing capacity (Vmax and Mmax) and ultimate drift capacity (Δ max ) under the maximum dynamic axial force (N).
To enable a visual comparison, under rare ground motion (PGA = 0.22 g), the ratio of the maximum dynamic shear force of the 1-1 cross section to the ultimate shear force (V/Vmax), and the ratio of the maximum dynamic bending moment of the same cross section to the ultimate bending moment (M/Mmax) of each column size conditions are shown in Figure 10. The ratio of drift between the inflection point and the bottom of the beam to the ultimate drift (Δ/Δ
max
) of these conditions is shown in Figure 10. It is clear that with the increase in
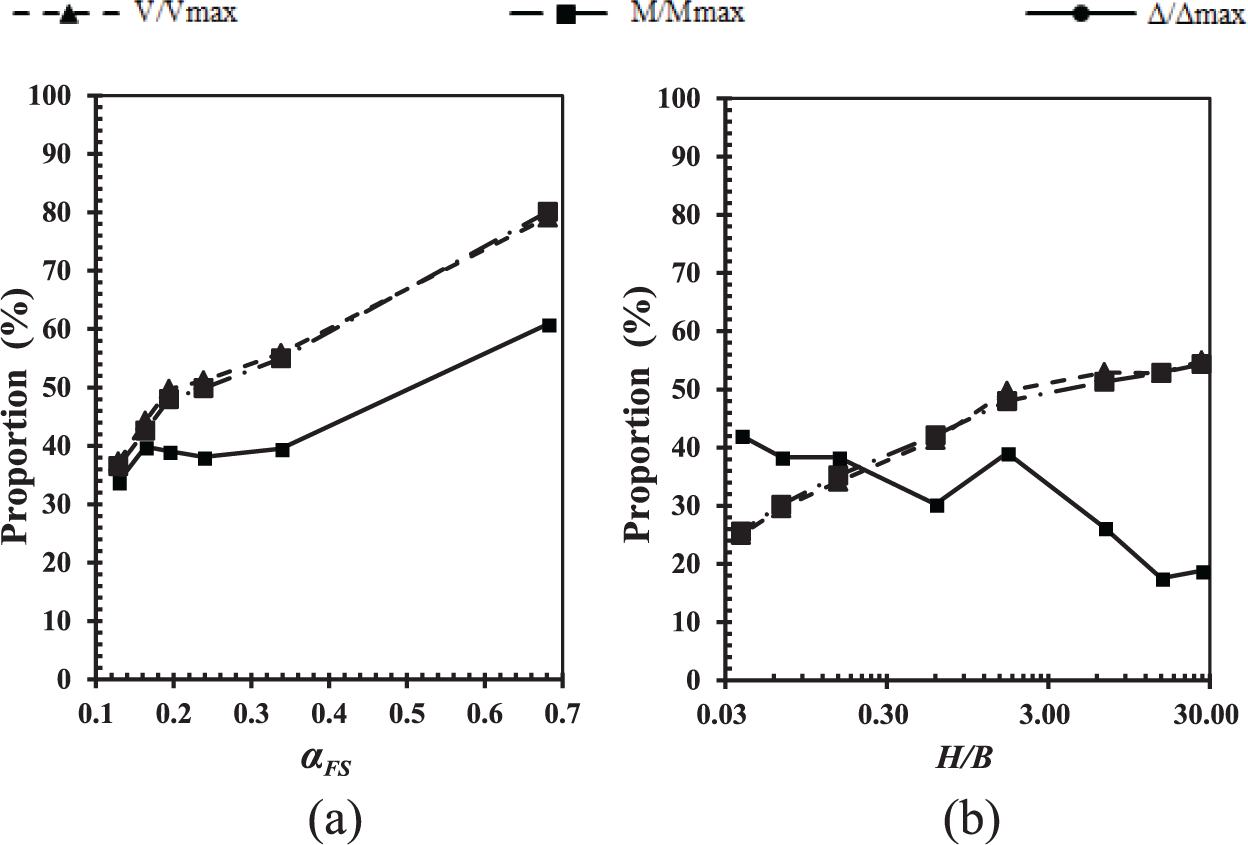
Variation curves of V/Vmax, M/Mmax, and Δ/Δ
max
: (a) H/B = 1.67 and (b)
But if Δ/Δ
max
is analyzed, the results are different. As shown in Figure 10(a), when H/B is 1.67, Δ/Δmax increases from 34% to 60% and
In addition, as can be seen from Figure 10(b), the rising curves (V/Vmax, M/Mmax) and the falling curve (Δ/Δ max ) have an intersection, roughly between 0.15 and 0.6. The intersection means that the column has the same seismic capacity in terms of the internal force and the lateral displacement at this point. Therefore, considering both the seismic capacity of internal force and displacement, 0.15–0.6 is a reasonable range for H/B.
Structural damage
The previous analysis shows that the variation of
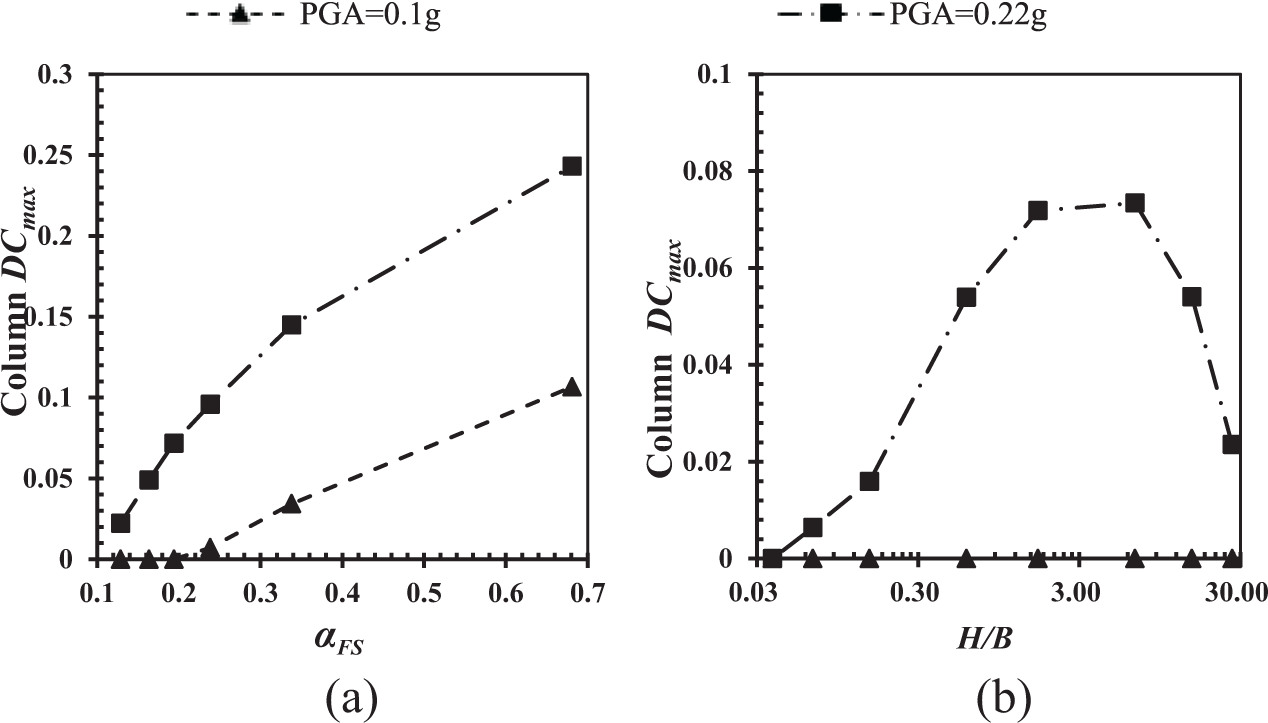
Variation curves of DCmax: (a) H/B = 1.67 and (b)
As shown in Figure 11(a), when the value of H/B is 1.67, with the increase in
Figure 12 shows the variation regularities of structural tension damage (dt) with the variation of
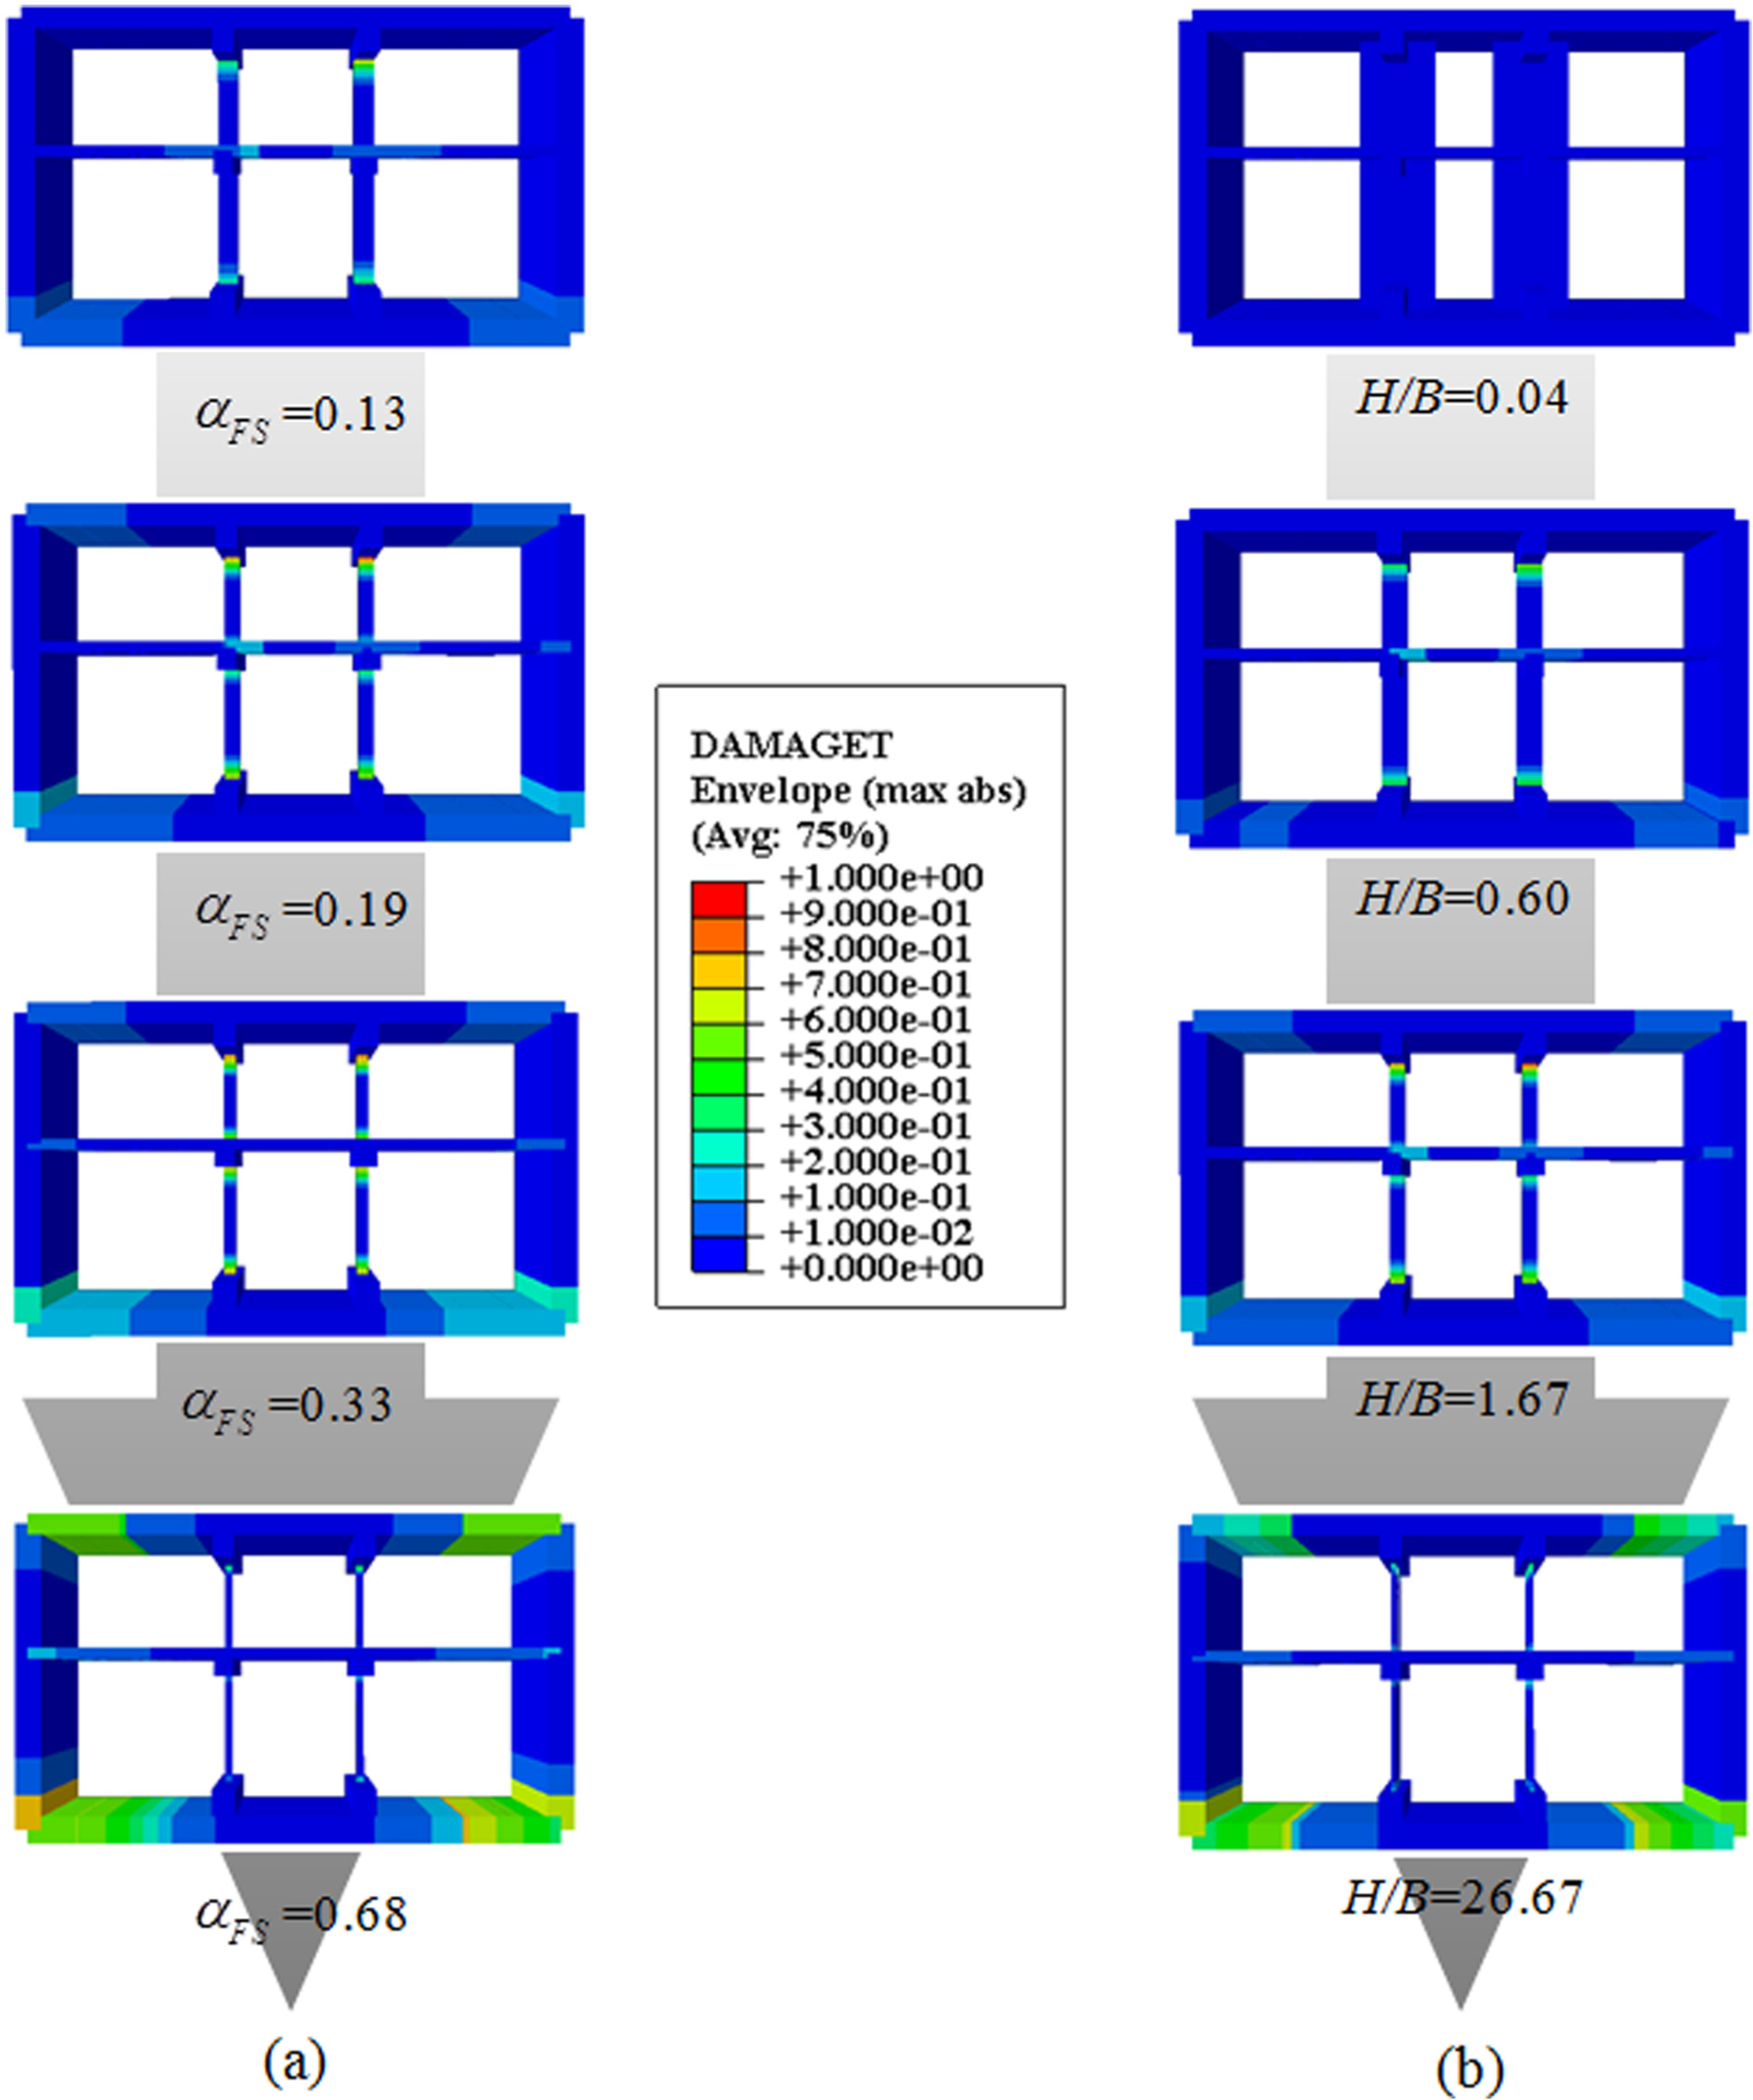
Variation regularities of structure tension damage (dt): (a) H/B = 1.67 and (b)
The variation regularities of dc and dt show that the increase in
Therefore, based on the above research and discussion, after determining the appropriate axial compression ratio parameters according to relevant design specification, the strategy of choosing H/B can be worked out. When H/B is between 1.67 and 6.67, the compressive damage of column is most serious; therefore, (1.67–6.67) is the design range to be avoided. When H/B is larger than 6.67, the compressive damage of column is declined; however, the tension damage of the structure increased significantly, which is not conducive to waterproofing of structure. In addition, central columns seem more like central wall under this condition, lowering the lateral traffic capacity of the station noticeably. Thus, (6.67–26.67) is not suitable for H/B. When H/B is smaller than 1.67, the decrease in H/B reduces the damage of the structure (both tension damage and compressive damage), but it does not mean that the smaller the H/B is, the better is the seismic performance of the structure. The intersection in Figure 10(b) shows that when H/B is less than the intersection point, column seismic capacity declines. Since the intersection point is roughly in the range of (0.15, 0.6), from the point of view of seismic resistance, the ideal H/B should be between 0.15 and 0.6. To select the specific point in the range, it is necessary to determine the actual demand for longitudinal traffic capacity.
Conclusion
In this article, time history analyses and ultimate bearing capacity analysis of central columns were carried out on the seismic behavior of a typical two-story three-span subway station structure. Emphasis was placed on the static axial compression ratio,
The increase in
The influence of H/B on the seismic performance of structures is more complicated. Given constant
From the point of view of seismic resistance, the current design of H/B (1.67) in the subway station is unreasonable. Based on the research of this article, the ideal H/B should be between 0.15 and 0.6. To select the specific point in the range, it is necessary to determine the actual demand for longitudinal traffic capacity.
Footnotes
Declaration of conflicting interests
The author(s) declared no potential conflicts of interest with respect to the research, authorship, and/or publication of this article.
Funding
The author(s) disclosed receipt of the following financial support for the research, authorship, and/or publication of this article: This research was supported by the National Natural Science Foundation of China (grant no. 41472246) and the Key Laboratory of Transportation Tunnel Engineering (TTE2014-01). Both supports are gratefully acknowledged.