



Abstract
This paper presents an analytical model using a modified space truss analogy for predicting the ultimate torsional capacity of reinforced ultra-high-performance concrete (R-UHPC) beams. Both solid and box beams are considered. The credibility of the proposed model is evaluated by comparing the theoretical predictions of the ultimate torsional capacity and its corresponding twist (Tu-αu) to experimental results of several R-UHPC beams (solid and box beams) available in the literature. The results are also compared with the calculation of the existing models. The comparisons show that the proposed model gives acceptable predictions of the ultimate limit torsional capacity of R-UHPC beams and the corresponding twist angle and offers better accuracy than the existing analytical models. Additionally, a parametric study was carried out to determine factors that influence the ultimate torsional capacity. The result shows that the ultimate torsional capacity is not just improved by the increase of the tensile strength of UHPC but also increased by the increase of the reinforcements (transversal and longitudinal).
Keywords
Introduction
Ultra-high-performance concrete (UHPC) is the utmost innovative material in concrete structure technology in these decades (Bajaber and Hakeem, 2021; Graybeal, 2006). It can develop higher tensile strength than ordinary concrete (Scheydt et al., 2008; Shafieifar et al., 2017) and can continue to show outstanding behavior after cracking (Yang et al., 2012). It has been well reported that UHPC members show outstanding structural performance under different loading actions, such as shear, bending, tension, etc. (Al-Quraishi and Fehling, 2014; Fehling et al., 2008, 2016; Grünberg et al., 2008; Harris and Roberts-Wollmann, 2005; Schnellenbach-Held and Prager, 2012). Recently, UHPC has been world widely used in structural engineering, such as buildings, bridges (Bierwagen and Abu-Hawash, 2005; Zhou et al., 2018), thin-walled structures (Preinstorfer et al., 2021; Resplendino, 2004), etc. In these structures, UHPC beams and girders are commonly used. For these members, torsion represents one of the critical loading actions that should be considered.
To date, some experimental studies have been conducted on the torsional behavior of UHPC. Empelmann and Oettel (2012) carried out torsion tests on UHPC box girders. They found that the addition of steel fibers significantly improved the ultimate torsion capacity and the torsional stiffness after cracking. Yang et al. (2013) investigated the torsional behavior of UHPC solid beams with different volume fractions of steel fibers, transverse reinforcement ratios, and longitudinal reinforcement ratios. Fehling et al. (2013) presented an investigation of UHPC solid beams with different combinations of steel fibers, longitudinal and transverse reinforcement under pure torsion. It was also shown that the UHPC beams with steel fibers only presented a ductile behavior, while the addition of either longitudinal or transverse reinforcement to the UHPC beams contribute to ductility rather than ultimate capacity. Kwahk et al. (2015) also conducted a series of torsion tests on thin-walled UHPC box beams, with the same experimental parameters as reported previously (Fehling et al., 2013). It was also found that the stirrups appeared to contribute additionally to the torsional ductility, but the contribution of the steel fibers to the ultimate torsional capacity and the cracking load was more significant than that of the stirrups. It was suggested that design should exploit the contribution of the steel fiber effectively rather than arrange a larger number of stirrups in UHPC structures subjected to torsion.
The current design methods for predicting the torsional capacity of structures are based upon traditional theories developed for normal reinforced concrete (Bredt, 1896; Hossain et al., 2006; Hsu and Mo, 1985; Rausch, 1929). According to the literature, these methods stipulate that the stirrups dominate the torsional strength and ignore the contribution of steel fibers, which is critical for the torsion resistance of UHPC. Therefore, their direct application to UHPC remains unsuccessful, as the neglection of the contribution from the steel fibers would result in an underestimation of the torsional capacity of UHPC element. Moreover, UHPC has higher tensile strength and ductility than normal concrete, which improves the structural performance of members (Bajaber and Hakeem, 2021; Casanova and Rossi, 1997; Yang et al., 2010). It has to be noted that the ductility of UHPC is partially caused by the inclusion of the high tensile strength of steel fiber (Lim et al., 1987).
This led some researchers (Empelmann and Oettel, 2012; Kwahk et al., 2015; Ismael, 2016) to develop new theoretical models capable of estimating the torsional strength of UHPC beam by considering the tensile strength of the steel fiber. The torsional strength of UHPC is considered as the summation of the torsional strength from the contribution of the reinforcement and of the steel fiber of UHPC. Nevertheless, these models do not make any difference between the type of beam and do not consider the probable effect of the beam’s cross-section on the torsional strength. As reported by Kwahk et al. (2015), the types of cross-sections also play a critical role in the torsional performance of UHPC members. Therefore, it is necessary to conduct further theoretical studies on both UHPC solid beam and box beam under torsion to bear a strong theory on the behavior of UHPC structures.
In this regard, the main objective of the research is to develop an analytical model capable of predicting the ultimate limit torsional capacity of UHPC solid and box beams and the torque-twist curve of UHPC beam under torsion at the ultimate limit stage (Tu-αu). To consider the effect of the cross-section and the tensile strength of UHPC beams, the model is developed based on the combination of the specifications for torsion in Chinese code GB 50010-2010 and the space truss analogy. The credibility of the proposed model will be verified through the comparison with experimental results (solid and box beams) available in the literature. Additionally, a parametric study will then be presented to determine the factors that influence the behavior of the ultimate torsional strength of UHPC beams.
Existing analytical models for Ultra-high-performance concrete
Models for reinforced concrete beams
Research on the torsional behavior of reinforced concrete (RC) beams started with Rausch in 1929 (Rausch, 1929), where he proposed strength equations based on the space truss model. Since the late 1960s, the truss model has been undergone significant developments contributed by various researchers, which formed the origin of numerous code design provisions like the ACI building code (ACI Committee 318, 2008) and the Chinese code GB 50010-2010 (MOHURD, 2011). 1. ACI Building Code.
ACI model of calculating the ultimate torsional capacity of RC members detailed as: 2. Chinese code GB 50010-2010 (MOHURD, 2011).

The torsional capacity of members consists of the torsional resistance of concrete and the reinforcement, which is on the origin of the model of variable angle space-truss. The model considers the diagonal angle concerning the horizontal center of members varying the strength ratio of the longitudinal bar over the transverse link. Therefore, the ultimate torsional capacity of members subjected to pure torsion is calculated in two parts given as follows


Existing ultra-high-performance concrete analytical models
Based on theories for determining the torsional strength of normal concrete, some researchers have proposed analytical models to predict the torsional limit capacity of UHPC. The few existing analytical models make use of the communal summative approach, such that the torsional strength of UHPC is expressed as the summation of the torsional strength from the contribution of the traditional reinforcement (longitudinal and transverse) and of the steel fiber of UHPC.
Four UHPC analytical models have been found in the literature. 1. The first model was proposed by Empelmann and Oettel (2012), who, after conducting an experimental study, affirmed that the total torsional capacity could be calculated by the sum of the contribution of the traditional reinforcement and the steel fiber. 2. The second model, proposed by Kwahk et al. (2015), also considered that the nominal torsional capacity of the UHPC beam is decomposed into two components: one is the contribution of the reinforcement, and the other is the contribution of the steel fiber. The model is expressed as follow

To be precise, the models proposed by Empelmann and Kwahk are similar and give the same prediction; hence only Kwahk’s model is included in the comparison and discussion in this study. 3. The third model was proposed by Ismael (2016). Based on experimental observations, the contribution of the steel fibers along the cracking surface was considered not only in the normal direction to the crack but also in the tangential direction. This indicates that the steel fibers contribute to the torsional capacity through both tensile and shear forces. However, the models proposed by Empelmann and Oettel (2012) and Kwahk et al. (2015) considered only the contribution of the steel fibers through tensile force perpendicular to the crack direction. The nominal torsional capacity of fiber-reinforced UHPC members under torsion was expressed as follow 4. The fourth model recommended by the Structural Design Recommendations (SDR) of UHPC (K-UHPC Technology, 2018) stipulates that the design torsional strength can be obtained by equation (5).


The torsion moment T generates a circulatory shear flow around the periphery member over a specific thickness, representing the beam as an equivalent tube (thin-walled tube analogy). It should be noted that three deferent definitions of effective wall thickness teff in the thin-walled tube have been found in literature:
Eurocode 2 (BS EN 1992-1-1, 2004)

ACI Building Code (ACI Committee 318, 2008)

The Structural Design Recommendation of UHPC SDR (K-UHPC Technology, 2018)

This paper adopts the definition according to the SDR of UHPC (K-UHPC Technology, 2018) provisions.
Comparison of the existing models
This article collected ultimate torsional capacity values from experiments conducted on UHPC solid and box beams with or without traditional reinforcement subjected to torsion. The database was collected from the existing literature, which included different cross-sections, such as rectangular solid and box beams (see Appendix for more detail).
Figure 1 and Table 1 present the ratio of experimental versus calculated values of the torsional capacity of UHPC beam by different models in the literature. In Figure 1, the diagonal line represents the reference line indicating the ratio 1 of the experimental torsional value and the calculated value (Exp/Tucal). Comparison of calculated and experimental ultimate capacity using existing ultra-high-performance concrete analytical models. (a) Literature (Yang et al., 2013) (b) Literature (Ismail, 2015) (c). Literature (Kwahk et al., 2015). Average and standard deviation of the ratio of experimental versus calculated values of the torsional capacity of ultra-high-performance concrete (UHPC) using existing UHPC analytical models.
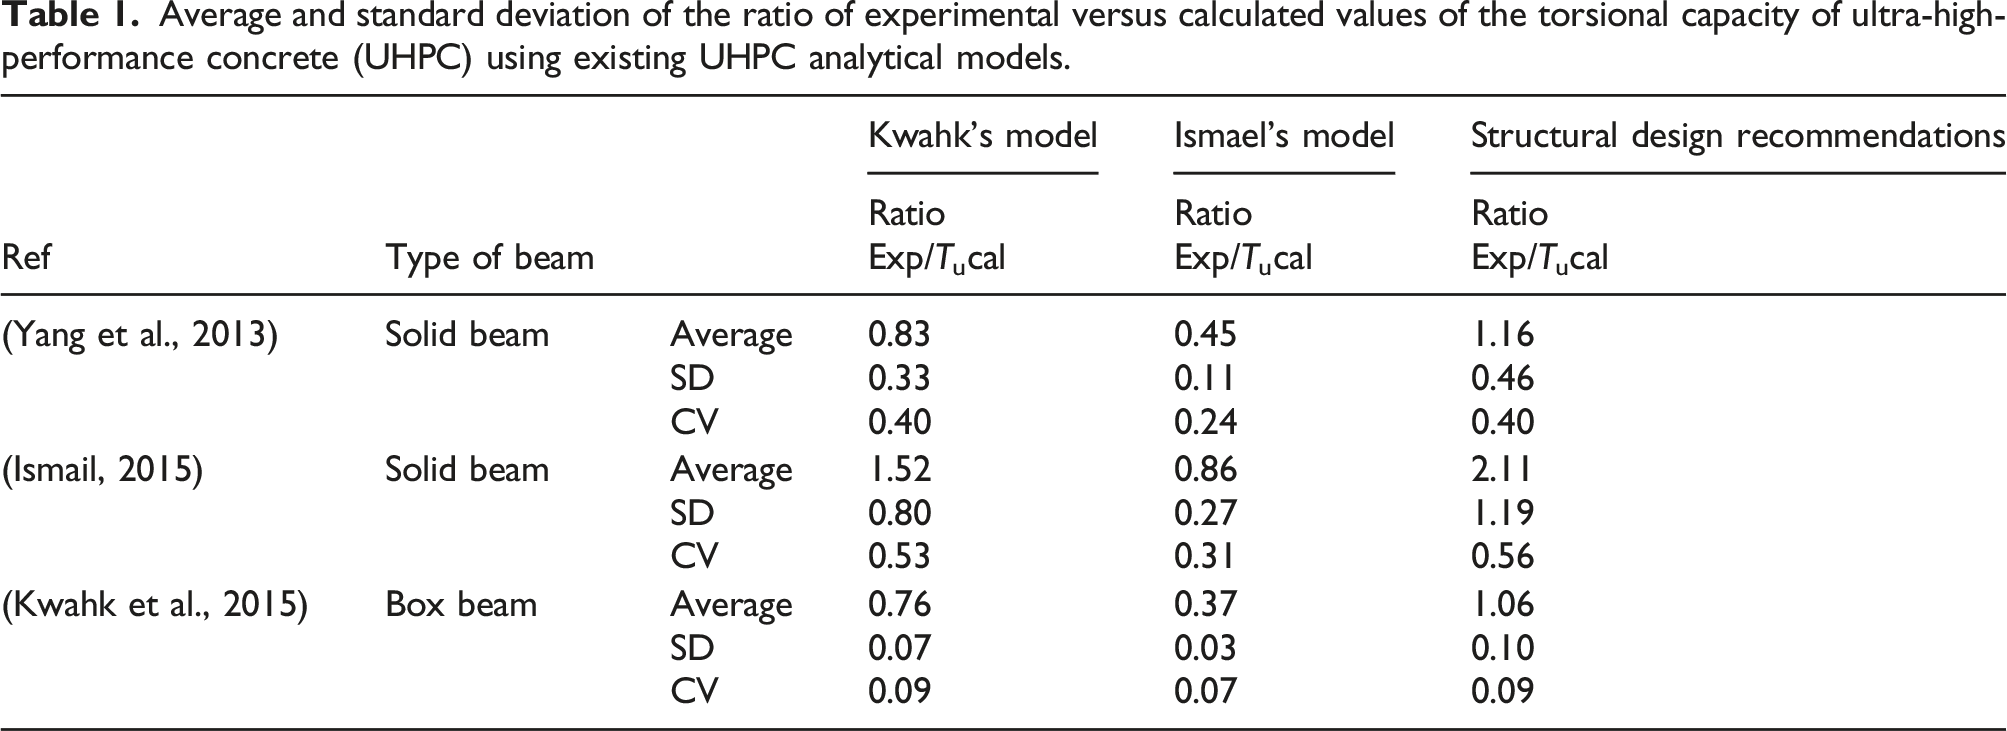
It can be seen in Figure 1 that the values calculated by Kwahk’s model and Ismael’s model were remarkably higher than the values from experimental results of the literature (Yang et al., 2013) and (Kwahk et al., 2015). Except Figure 1(b), where it is shown that the predictions by these models provide values partially closed to the experimental results. Figure 1(c) shows that the model proposed by the SDR fits well following the literature (Kwahk et al., 2015), in which the specimens are box beams, and provides the best outcomes of average value and standard deviation of 1.06 and 0.10, respectively (Table 1). However, in the case of the solid beams’ specimens (Figure 1(a) and (b)), it provides the poorest values and the most underestimated calculation among the models exhibiting the highest average and standard deviation.
Curtly, the prediction of Kwahk’s and Ismael’s models showed a lower average of ratio Exp/Tucal, which indicated an overestimation of the predicted torsional capacity. Contrarily, although the SDR application to box beam is found to be partially good, its application may be limited to one type of UHPC beam because it underestimated the prediction of a solid beam. The comparative study also showed that the existing models stipulated that the inclination angle between the diagonal crack and the centerline is 45°. But the actual test results have a certain deviation (Appendix). This could probably justify the considerable no consistency between the predicted and experimental values. It is then important to improve the precision of the ultimate limit capacity of R-UHPC model, which can confirm and bring its closed approximations in line with the experimental results of R-UHPC members and stands for a theoretical base for engineering applications.
Proposed model of the ultimate capacity of reinforced ultra-high-performance concrete beams
A model based on previous studies is proposed to improve the precision of the ultimate limit capacity of R-UHPC models. The model is a combination of the Chinese code GB 50010-2010 (MOHURD, 2011) specifications for torsion and the space truss analogy, to take into account the plastic ultimate torsional strength from UHPC and the ultimate torsional strength from the variable angle space truss analogy. Compared to the existing models, such a combination is suitable for both types of beams since the Chinese code GB 50010-2010 makes a difference between solid beam and box beam; and could enable the prediction of the angle of twist.
Model resistance mechanism
For design tenacities, the center portion of a beam can conventionally be neglected. Therefore, the beam is idealized as a tube. As stipulated by the space truss analogy, the external torsional moment is resisted through constant circulatory shear flow in the walls of the cross-section of the member (Figure 2). After concrete cracking, a space truss is activated, where the longitudinal reinforcement acts as the triads of the space truss while the inclined concrete struts and the transverse reinforcement act as the webs of the truss. For the R-UHPC beam, if torsion-cracking occurs, the torsional resistance is determined by the vertical rebar, the horizontal chord arranged near the surface, and by the UHPC transforming the load even after cracking. Thin wall in torsion model mechanism (left), and the area enclosed by the shear flow path (right).
Ultimate torsional capacity of reinforced ultra-high-performance concrete beam
As stipulated above, the resistance contribution of the core area materials is not considered in the calculation of R-UHPC pure torsion members. The failure pattern of the member after cracking can also be considered as a space truss. In this case, the UHPC tension on the longitudinal bars and normal sections can be regarded as chords of the truss, the UHPC tension contribution of stirrups and diagonal cracks can be regarded as vertical members of the truss, and the UHPC strips between diagonal cracks can be regarded as diagonal web members of the truss, which constitutes the stress state of the spatial truss as shown in the model mechanism (Figures 2 and 3). Longitudinal and vertical forces on the leftward face of the reinforced ultra-high-performance concrete thin wall (left), and forces equilibrium triangle (right).
According to Bredt’s theory (Bredt, 1896)

Considering the leftward face of the R-UHPC beam (Figure 3)

Figure 3 also shows the vertical forces NUtv, resulting from the RUHPC tensile strength fUt acting on a crack surface. Where α is the inclination angle, fyv the tensile strength of stirrups, and Asv1 the cross-sectional area of one closed stirrup resisting torsion within spacing s. Accordingly, the number of stirrups, including the inclined crack surface at the leftward facet of the UHPC beam, can be obtained by
So

From the force equilibrium triangle (Figure 3)
and
According to the Chinese code GB 50010-2010 (MOHURD, 2011)
Let’s define

Canceling α by combining equations (16) and (19)
Replacing q into Bredt’s torsional equation (10), the ultimate torsional capacity Tu can be derived as
Let’s define

Based on the Chinese code GB 50010-2010 (MOHURD, 2011), the torsional capacity of UHPC members, constitution of torsional resistance of UHPC, steel, and fiber reinforcement, subjected to pure torsion is then as follow


The parameters α and β are obtained based on a practical calculation by regression analysis. Replacing them into equation (22a), the ultimate torsional capacity of R-UHPC beam is then:
The angle of twist αu corresponding to the ultimate torsional capacity of R-UHPC beam is:
Analysis and comparison with experimental results
Comparison to the experimental values
To verify the authenticity of the proposed model, the calculated ultimate torsional strength and its corresponding twist using the proposed model equations (22d) and (23) are compared with the results from the experimental UHPC solid and box beams under pure torsion. The comparative analysis also focused on the ultimate behavior of the beams (Tu-αu), which allows checking if the proposed model provides good predictions for the high loading stage. The ratio of experimental versus calculated values, averages, and standards deviation of the developed model are presented in Figure 4, Tables 2 and 3. Figure 4 shows that the proposed model computes practical predictions of the ultimate limit torsional capacity of UHPC solid and box beams. It exhibits average values of 1.09, 2.20, and 0.99, and standard deviation of 0.22, 0.55, and 0.06 respectively for the references Yang et al. (2013), Ismail (2015), and Kwahk et al. (2015). The proposed model has a similar trend with the ratio located close to the line Exp/Tu cal = 1. Comparison of calculated and experimental ultimate capacity. Comparison of calculated ultra-high-performance concrete solid beam torsional ultimate capacity and its corresponding angle of twist (Tu-αu) with experimental values. Comparison of calculated ultra-high-performance concrete box beam ultimate torsional capacity and its corresponding angle of twist (Tu-αu) with experimental values


The ratios of experimental over calculated results of the proposed model and the existing models are plotted in Figure 5. According to the comparison made to the current models (Figure 5), the predictions by the SDR and the model proposed by this study presented entirely rational outcomes being close to the experimental numbers. Although the predictions by the two models can obtain precise results, a similar underestimation problem in the specimens from literature (Ismail, 2015) is observed (Figure 5(b)). Factors such as the construction of specimens and experimental process may have affected the ultimate torsional capacity or the underestimation of the real tensile strength of the UHPC beam that probably affected the prediction of the ultimate torsional capacity. Comparison of the proposed model to the existing models. (a) Literature (Yang et al., 2013) (b) Literature (Ismail, 2015) (c) Literature (Kwahk et al., 2015).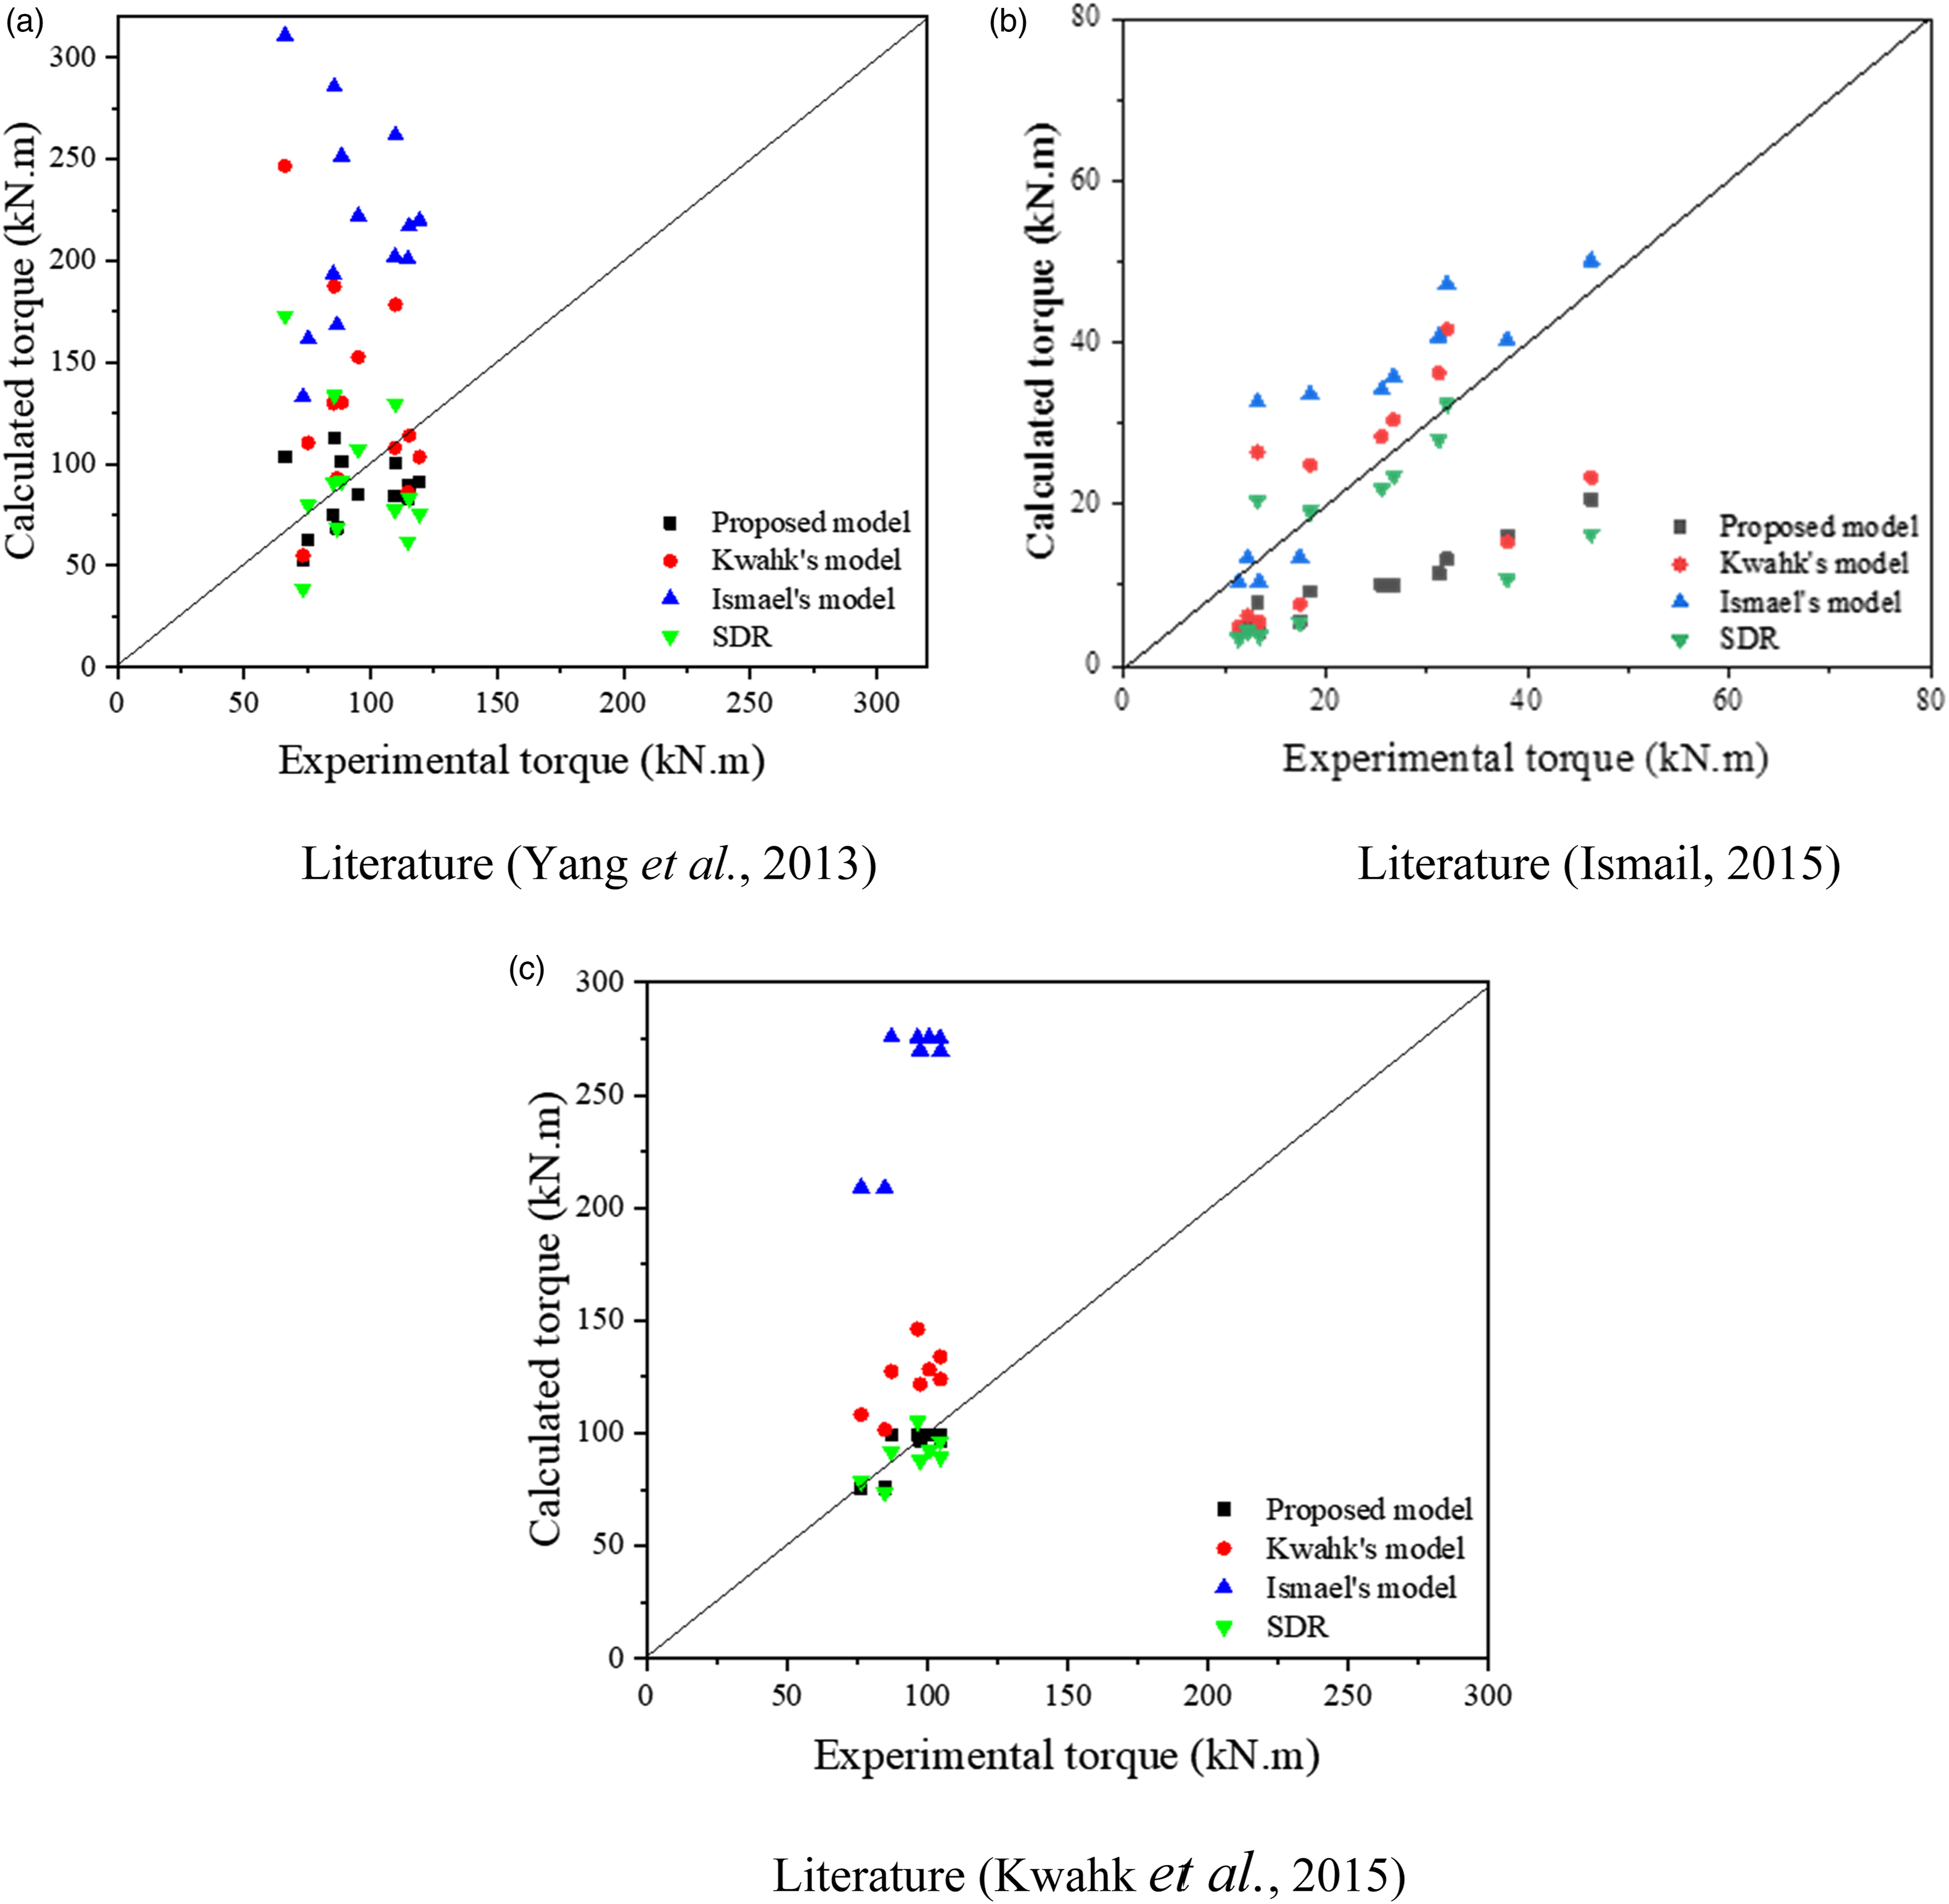
Box beams can be used effectively as an alternative to solid beams, especially for long-span beams. From Table 3, the predictions of the ultimate behavior of the box beams (Tu-αu) by the proposed model are more precise than the results from the existing models in which the two types of beams are not distinguished. For the proposed model, the average ratio and standard deviation of the box section beam from literature (Kwahk et al., 2015) are 0.99 and 0.06, respectively. This suggests that it is crucial to consider the box beam distinctly when designing the torsional strength of beam. Therefore, the proposed model is appropriate for the ultimate torsional capacity prediction of both UHPC solid beam and box beam and its corresponding angle of twist.
Effect of fUt, ζUt, and ζRU on the ultimate torsional capacity
Effect of fUt (5,7,10 MPa) on ζUt and ζRU.
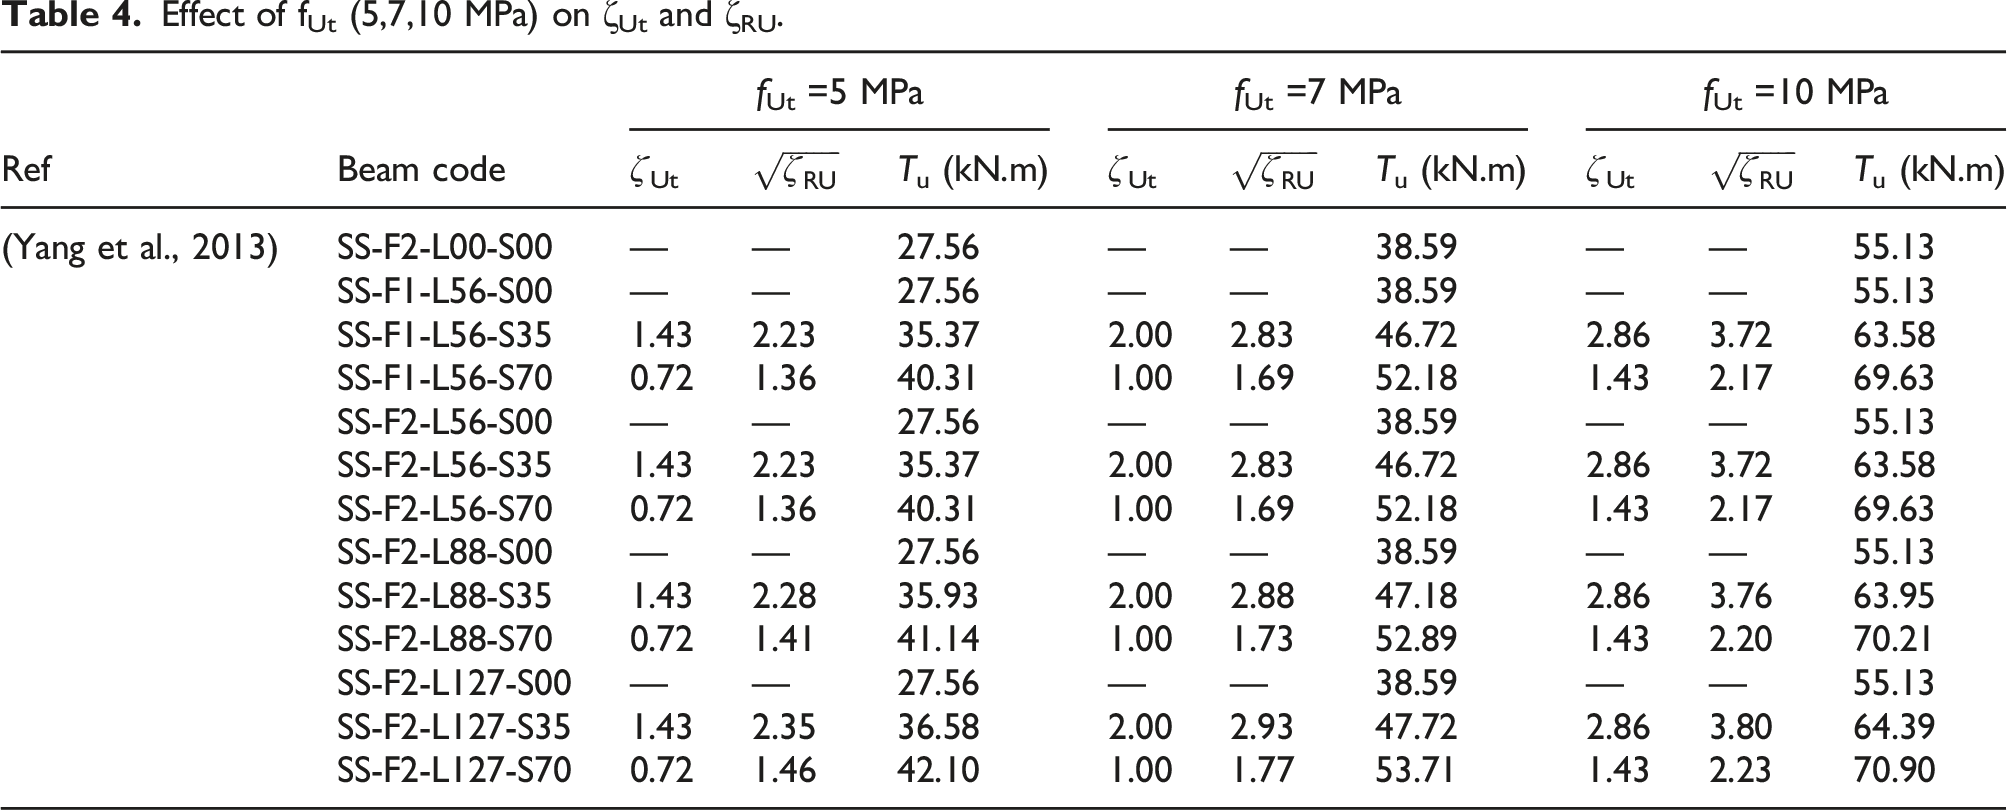
These results show that the ultimate torsional strength of the beam increases as the tensile strength of UHPC increases. For example, the beam SS-F-L56-S35 with a longitudinal ratio of 0.56% and a stirrup ratio of 0.35% had an ultimate torsional strength of 35.37 kN.m when fUt =5 MPa. By contrast, the same beam’s ultimate torsional strength was 46.72 kN.m when fUt =7 MPa. In comparison, the ultimate torsional strength of the beam increases to 63.58 kN.m when fUt =10Mpa. Moreover, for beams with a longitudinal rebar ratio of 0.56% and a stirrup ratio of 0.70, the ultimate torsional strength was 40.31 kN.m, 52.18 kN.m, and 69.63 kN.m when fUt was 5 MPa, 7 MPa, and 10 MPa, respectively. Figure 6(a) shows the effect of fUt on the ultimate torsional strength. The ultimate torsional strength not just increases as the UHPC tensile strength increases but also increases with the increase of the stirrup ratio. Besides, the ultimate torsional strength slightly increases as well when the longitudinal rebar increases. For example, for fUt =5 MPa, the ultimate torsional strength of a beam with a longitudinal rebar ratio of 0.56 and stirrup ratio of 0.35% is 35.37 kN.m., while the ultimate torsional strength of a beam with a longitudinal ratio of 0.56% and stirrup ratio of 0.70% is 40.31 kN.m. However, the ultimate torsional strength of a beam with 1.27% of longitudinal rebar ratio and 0.70% of stirrup ratio is 42.10 kN.m. These results show that when the UHPC tensile strength increases, the influence of the stirrup ratio on the ultimate torsional strength is more significant than that of the longitudinal rebar ratio. Effect of fUt (a), ζUt (b), and ζRU (c) on the ultimate torsional capacity.
To investigate the influence of ζUt on the ultimate torsional strength, Table 4 also shows the ultimate torsional strengths of beams with different ζUt. Comparing the ultimate torsion strength of beams with the same configuration but the different tensile strength of UHPC indicates that the ultimate torsional strength increased as ζUt increased. For example, the ultimate torsional strength of the beam SS-F-L56-S35 with a longitudinal ratio of 0.56% and stirrup ratio of 0.35% when ζUt =1.43 (at fUt =5 MPa) was 35.37 kN.m, while the ultimate torsional strength of the beam when ζUt =2 (at fUt =7 MPa) and ζUt =2.86 (at fUt =10 MPa) were respectively 46.72 kN.m and 63.58 kN.m. Let’s precise here that this increase of the ultimate torsional strength is essentially due to the increase of the UHPC tensile strength. But in the case the beams have a different configuration, the ultimate torsional strength increased as ζUt decreased. For comparison, with fUt =5 MPa, the ultimate torsional strength of the beam SS-F-L56-S35 is 35.37 kN.m when ζUt =1.43, while the ultimate torsional strength of the beam SS-F-L56-S70 is 40.31 kN.m with ζUt =0.72. This decrease of ζUt is due to the increase of the stirrup ratio that conducts to an increase of the ultimate torsional strength. This proves that the design of the ultimate torsional strength should not neglect the configuration of the stirrup and that the smaller ζUt corresponds to the higher ultimate torsional strength. However, the longitudinal rebar ratio does not have any effect on ζUt. Figure 6(b) shows the effect of ζUt on the ultimate torsional strength.
To investigate the effect of ζRU, the ultimate torsional strengths of beams with different ζRU are shown in Table 4. Comparing the ultimate torsional strength of beams having the same configuration but different tensile strength indicates that the ultimate torsional strength proportionally increases with ζRU. That increase in the torsional strength is due to the increase of the UHPC tensile strength. In comparison, the beam SS-F-L56-SS35 with fUt =5 MPa gives an ultimate torsional strength of 35.37 kN.m when
Summary and conclusions
A simple method for calculating the ultimate torsional capacity of R-UHPC solid and box beams and the corresponding angle of twist (Tu-αu) is presented. To include the effect of the cross-section and the tensile strength of UHPC beams on the torsional resistance, the main equation in the model connects the torsional strength to the strength of the reinforcement, the volume fraction of steel fiber, the tensile strength of UHPC, and the type of beam. The model is validated through comparison with the experimental results of both UHPC solid and box beams in the literature. Based on the results presented in this study, the following conclusions can be drawn. 1. The predictions accuracy is improved by distinguishing the type of beams, especially for box beams. It is then advisable to consider the effect of the beam’s cross-section when designing the torsional strength of the beam. 2. Increasing the tensile strength of UHPC improved the ultimate torsional strength of the beams. The ultimate torsional strength also increases with the increase of the reinforcements (stirrup ratio and longitudinal rebar ratio). 3. The influence of the stirrup ratio on the ultimate torsional strength is greater than that of the longitudinal rebar ratio. However, the increase of both longitudinal and transverse reinforcement brings much to the increase of the ultimate torsional capacity. 4. Steel fiber plays a significant role in the load resistance under torsion. The smaller fiber strength ratio ζUt and reinforced fiber strength ratio ζRU, the higher the ultimate torsional capacity is. Consequently, both the contribution of the steel fiber and the configuration of the reinforcements should be considered for the design of the ultimate torsional capacity
However, it should be noted that this study only dealt with the torsional behavior of UHPC beams at the ultimate limit stage without consideration of the pre-cracking and post-cracking torsional behavior of UHPC beams. In fact, pre-cracking and post-cracking are both critical to predict the entire behavior of UHPC beam (torque-twist curve) under torsion and should be incorporated. Besides, the inclusion of prestressing, bending, and shear effects combined with the torsional load should be also considered to create a strong theory of UHPC structures behavior under combined actions. Therefore, these aspects will be the scopes of future work.
Footnotes
Declaration of conflicting interests
The author(s) declared no potential conflicts of interest with respect to the research, authorship, and/or publication of this article.
Funding
The author(s) disclosed receipt of the following financial support for the research, authorship, and/or publication of this article: This work was supported by the National Natural Science Foundation of China (Grant number 52178195), the Xiamen Construction Science and Technology plan project(XJK2020-1-9), and the open fund of Fujian Provincial Key Laboratory of Multi-disasters Prevention and Mitigation in Civil Engineerings (College of Civil Engineering, Fuzhou University).

Collection of databases
This article collected ultimate torsional capacity values from experiments conducted on thirty-three (33) UHPC beams subjected to torsion with or without traditional reinforcement. The database was collected from the existing literature, including different cross-sections, such as rectangular solid and box beams. See Tables A1 and A2 for more detail.
Collection of ultra-high-performance concrete solid beams specimens’ properties and ultimate torsional capacity values.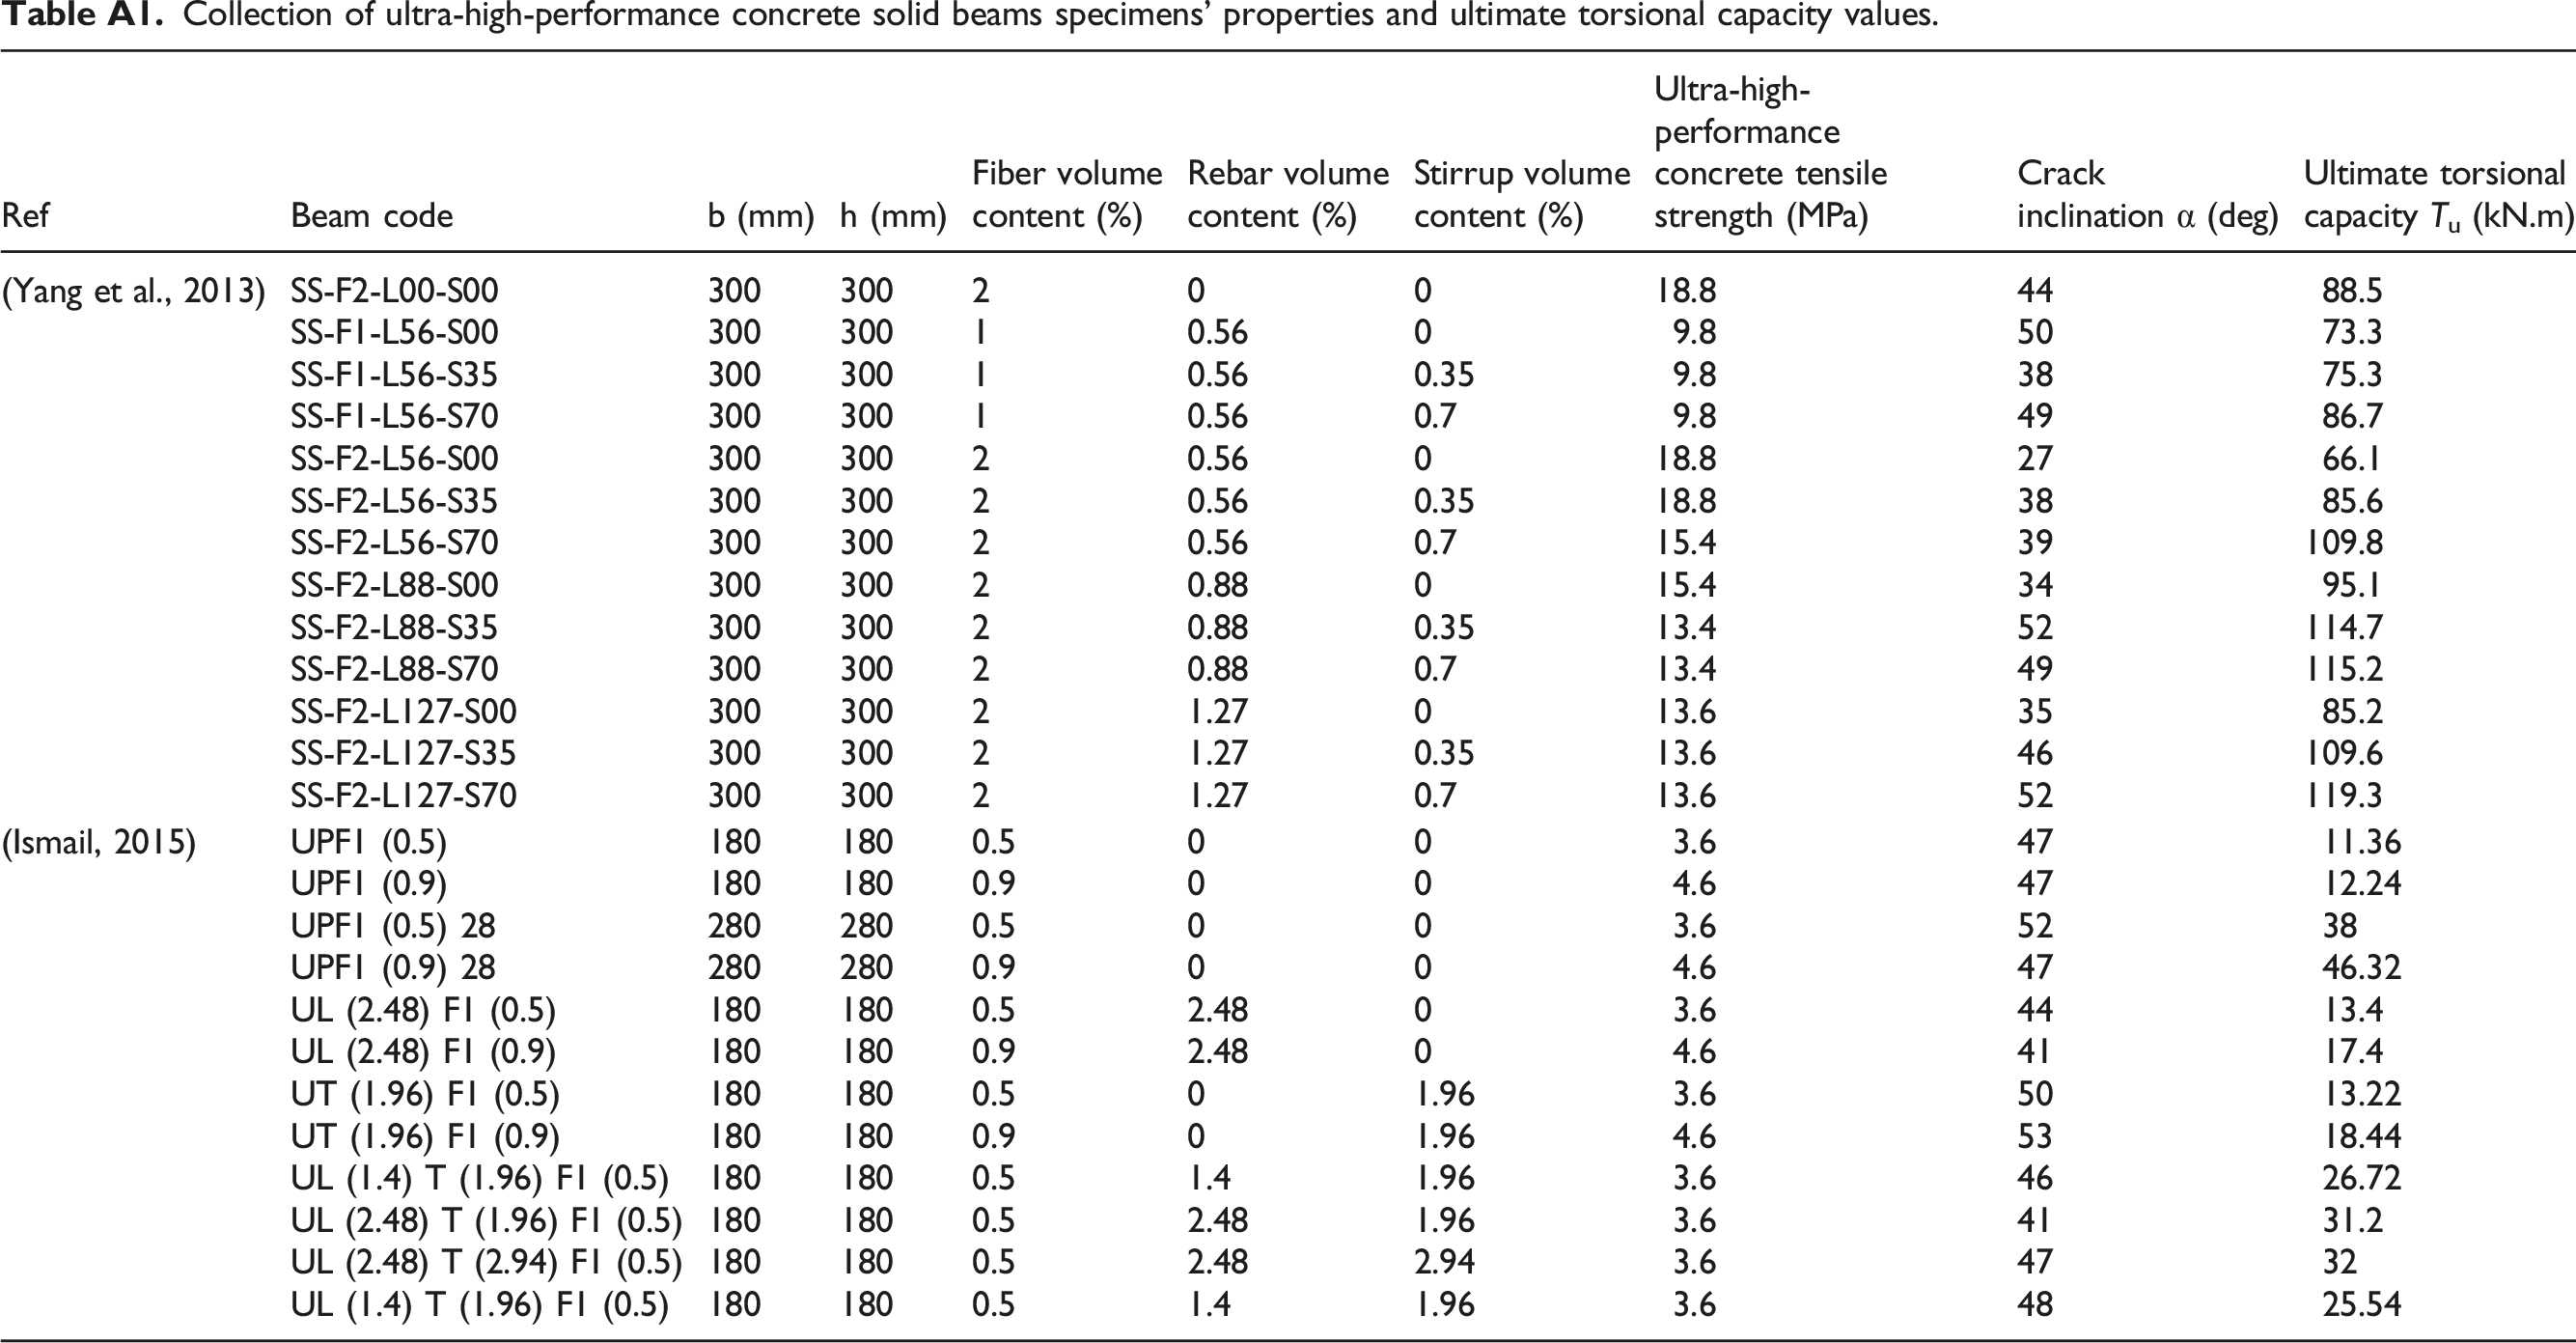
Ref
Beam code
b (mm)
h (mm)
Fiber volumecontent (%)
Rebar volumecontent (%)
Stirrup volumecontent (%)
Ultra-high-performanceconcrete tensilestrength (MPa)
Crackinclination α (deg)
Ultimate torsionalcapacity Tu (kN.m)
(Yang et al., 2013)
SS-F2-L00-S00
300
300
2
0
0
18.8
44
88.5
SS-F1-L56-S00
300
300
1
0.56
0
9.8
50
73.3
SS-F1-L56-S35
300
300
1
0.56
0.35
9.8
38
75.3
SS-F1-L56-S70
300
300
1
0.56
0.7
9.8
49
86.7
SS-F2-L56-S00
300
300
2
0.56
0
18.8
27
66.1
SS-F2-L56-S35
300
300
2
0.56
0.35
18.8
38
85.6
SS-F2-L56-S70
300
300
2
0.56
0.7
15.4
39
109.8
SS-F2-L88-S00
300
300
2
0.88
0
15.4
34
95.1
SS-F2-L88-S35
300
300
2
0.88
0.35
13.4
52
114.7
SS-F2-L88-S70
300
300
2
0.88
0.7
13.4
49
115.2
SS-F2-L127-S00
300
300
2
1.27
0
13.6
35
85.2
SS-F2-L127-S35
300
300
2
1.27
0.35
13.6
46
109.6
SS-F2-L127-S70
300
300
2
1.27
0.7
13.6
52
119.3
(Ismail, 2015)
UPF1 (0.5)
180
180
0.5
0
0
3.6
47
11.36
UPF1 (0.9)
180
180
0.9
0
0
4.6
47
12.24
UPF1 (0.5) 28
280
280
0.5
0
0
3.6
52
38
UPF1 (0.9) 28
280
280
0.9
0
0
4.6
47
46.32
UL (2.48) F1 (0.5)
180
180
0.5
2.48
0
3.6
44
13.4
UL (2.48) F1 (0.9)
180
180
0.9
2.48
0
4.6
41
17.4
UT (1.96) F1 (0.5)
180
180
0.5
0
1.96
3.6
50
13.22
UT (1.96) F1 (0.9)
180
180
0.9
0
1.96
4.6
53
18.44
UL (1.4) T (1.96) F1 (0.5)
180
180
0.5
1.4
1.96
3.6
46
26.72
UL (2.48) T (1.96) F1 (0.5)
180
180
0.5
2.48
1.96
3.6
41
31.2
UL (2.48) T (2.94) F1 (0.5)
180
180
0.5
2.48
2.94
3.6
47
32
UL (1.4) T (1.96) F1 (0.5)
180
180
0.5
1.4
1.96
3.6
48
25.54
Collection of ultra-high-performance concrete box beams specimens’ properties and ultimate torsional capacity values.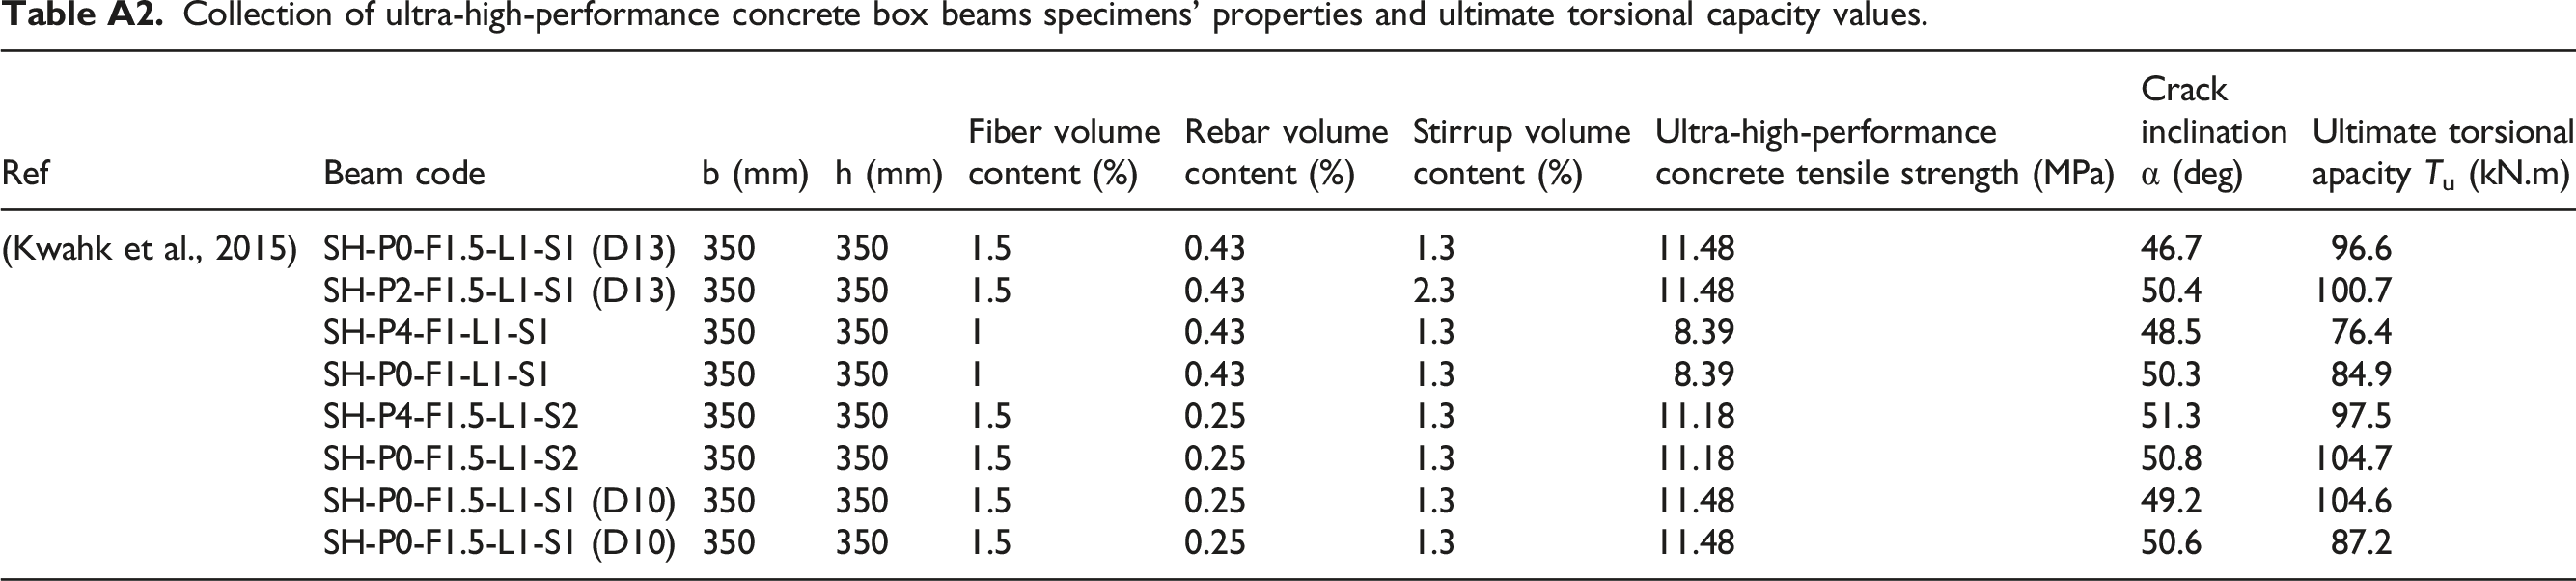
Ref
Beam code
b (mm)
h (mm)
Fiber volumecontent (%)
Rebar volumecontent (%)
Stirrup volumecontent (%)
Ultra-high-performanceconcrete tensile strength (MPa)
Crackinclinationα (deg)
Ultimate torsionalapacity Tu (kN.m)
(Kwahk et al., 2015)
SH-P0-F1.5-L1-S1 (D13)
350
350
1.5
0.43
1.3
11.48
46.7
96.6
SH-P2-F1.5-L1-S1 (D13)
350
350
1.5
0.43
2.3
11.48
50.4
100.7
SH-P4-F1-L1-S1
350
350
1
0.43
1.3
8.39
48.5
76.4
SH-P0-F1-L1-S1
350
350
1
0.43
1.3
8.39
50.3
84.9
SH-P4-F1.5-L1-S2
350
350
1.5
0.25
1.3
11.18
51.3
97.5
SH-P0-F1.5-L1-S2
350
350
1.5
0.25
1.3
11.18
50.8
104.7
SH-P0-F1.5-L1-S1 (D10)
350
350
1.5
0.25
1.3
11.48
49.2
104.6
SH-P0-F1.5-L1-S1 (D10)
350
350
1.5
0.25
1.3
11.48
50.6
87.2
A summary of the comparison of UHPC beams’ ultimate capacity experimental values and calculated values using the existing UHPC analytical models found in literature is presented in Table A3. It includes also the ratio of the experimental versus calculated values of the torsional capacity of UHPC beam, average values, and standard deviation using Kwahk’s model, Ismael’s model and the SDR. Comparison of ultra-high-performance concrete (UHPC) beam ultimate capacity experimental value and calculated value using existing UHPC analytical models.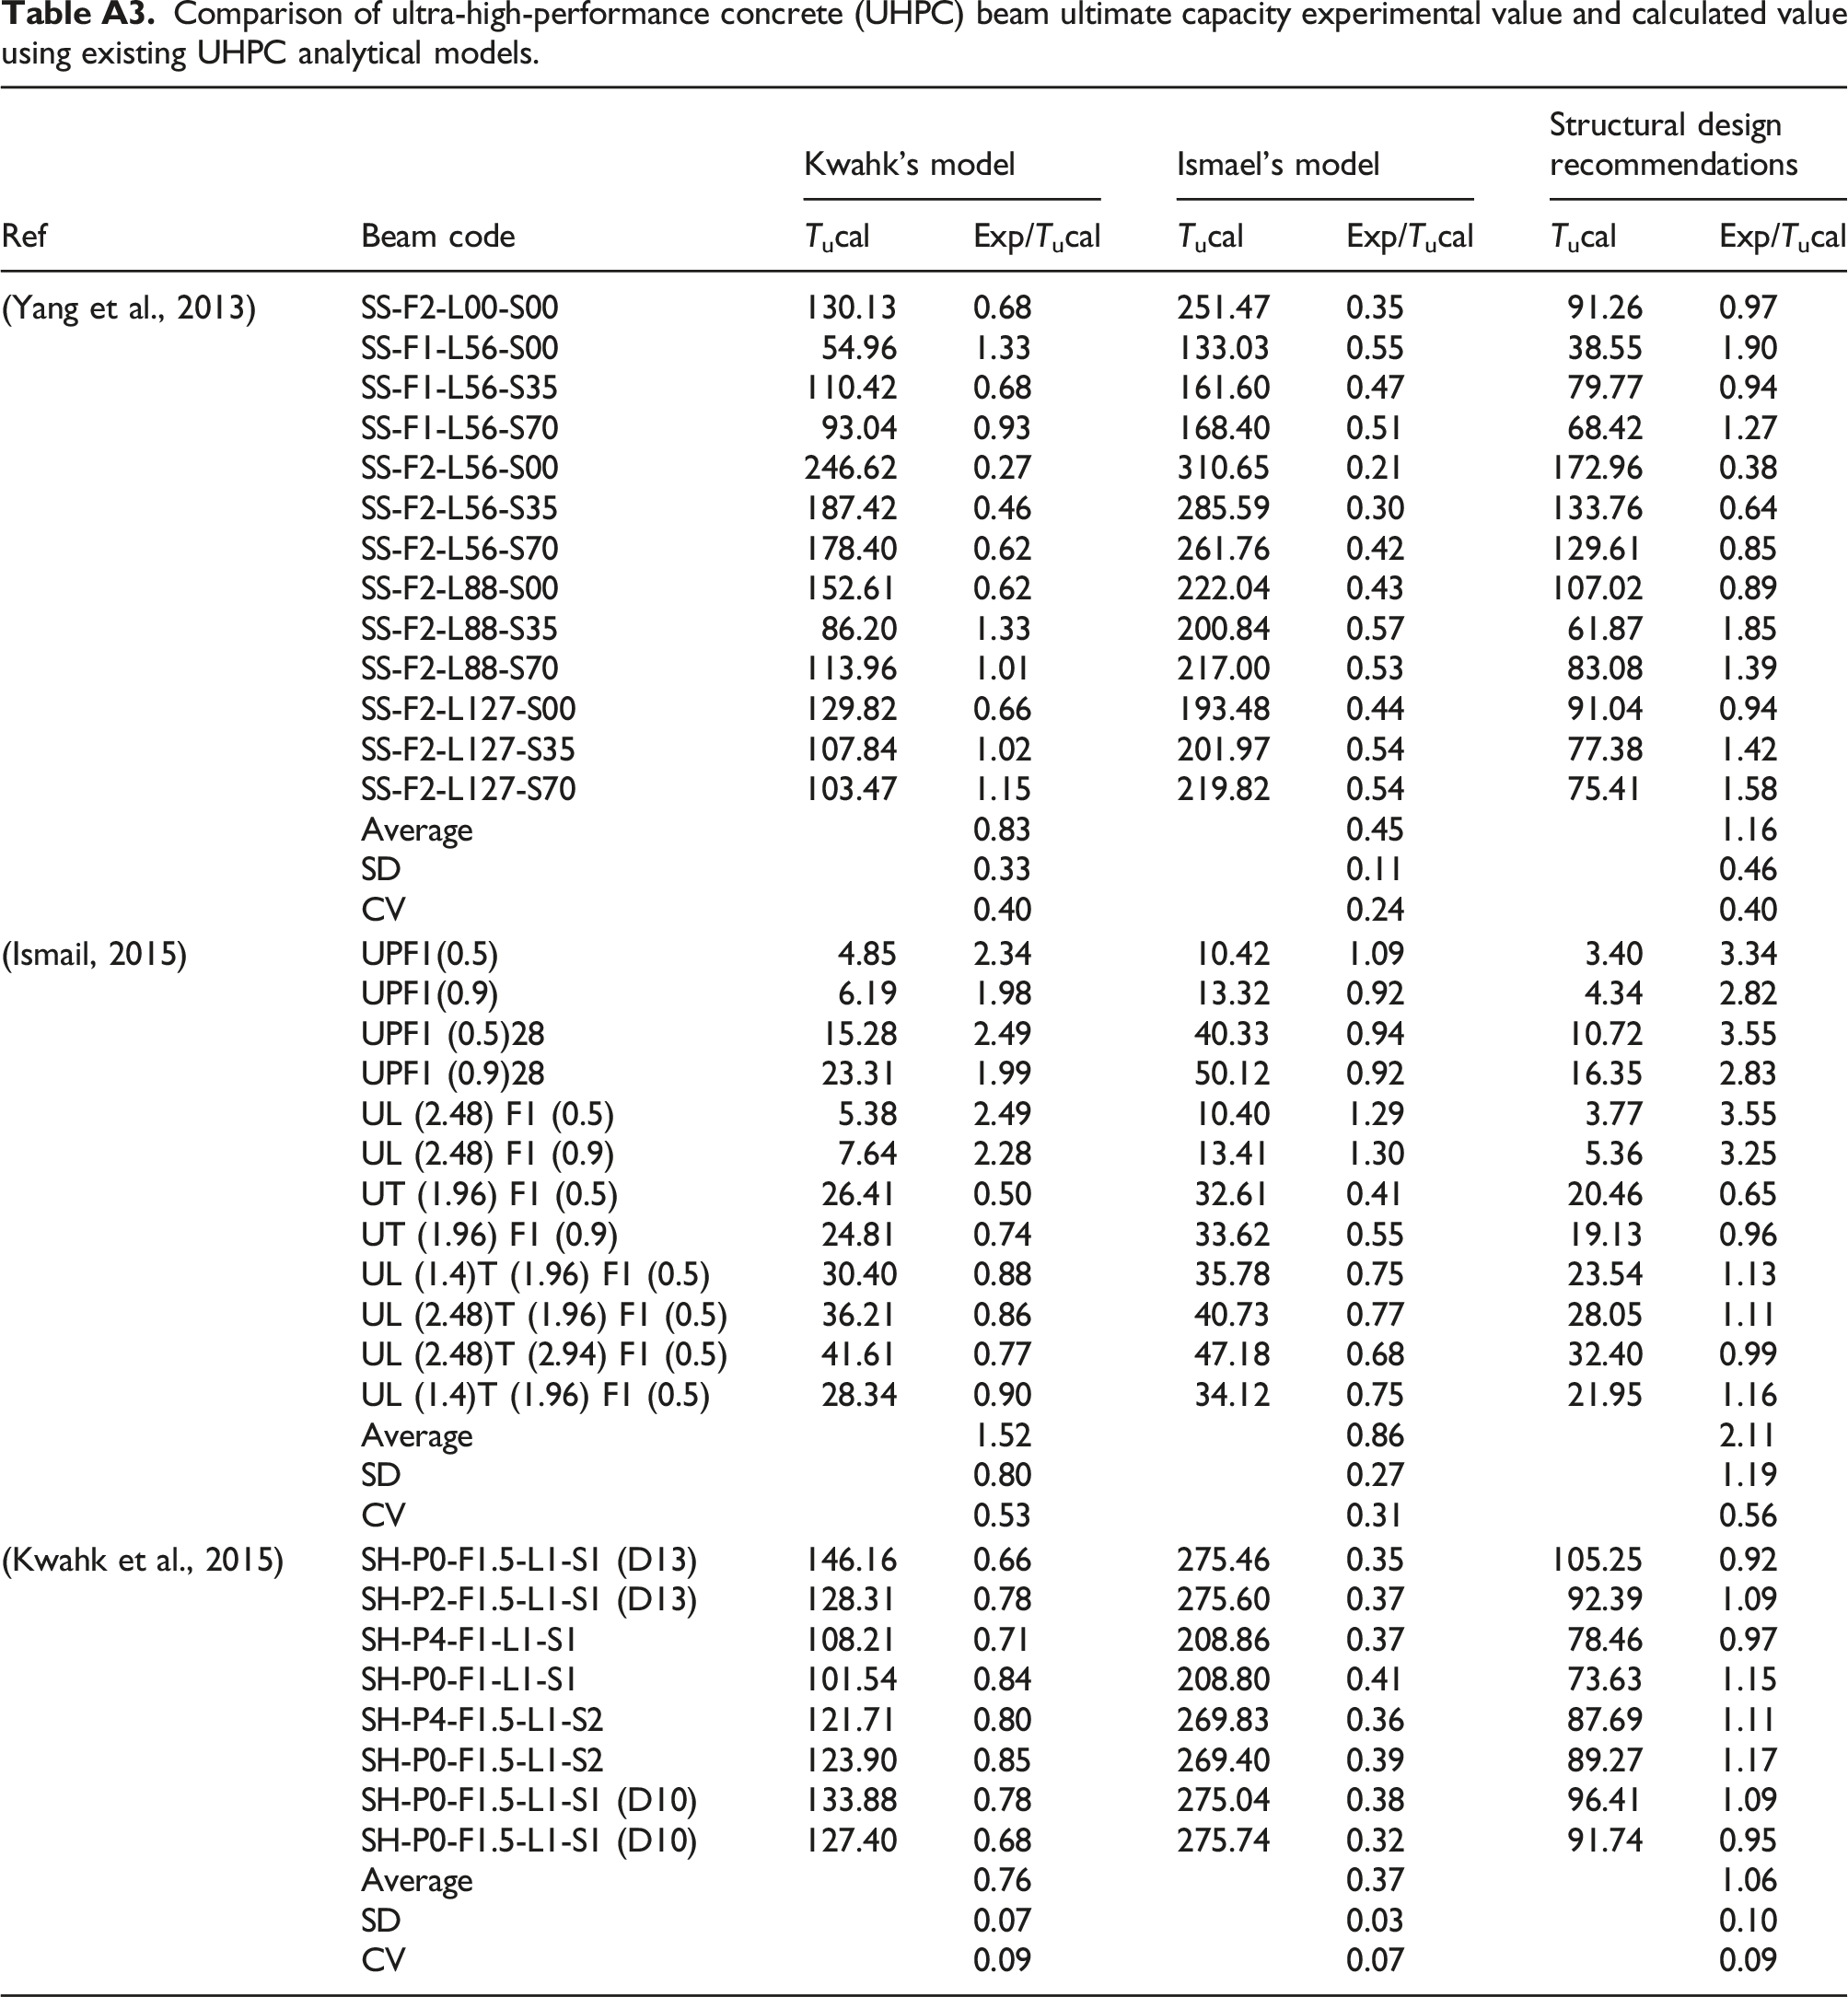
Ref
Beam code
Kwahk’s model
Ismael’s model
Structural design recommendations
Tucal
Exp/Tucal
Tucal
Exp/Tucal
Tucal
Exp/Tucal
(Yang et al., 2013)
SS-F2-L00-S00
130.13
0.68
251.47
0.35
91.26
0.97
SS-F1-L56-S00
54.96
1.33
133.03
0.55
38.55
1.90
SS-F1-L56-S35
110.42
0.68
161.60
0.47
79.77
0.94
SS-F1-L56-S70
93.04
0.93
168.40
0.51
68.42
1.27
SS-F2-L56-S00
246.62
0.27
310.65
0.21
172.96
0.38
SS-F2-L56-S35
187.42
0.46
285.59
0.30
133.76
0.64
SS-F2-L56-S70
178.40
0.62
261.76
0.42
129.61
0.85
SS-F2-L88-S00
152.61
0.62
222.04
0.43
107.02
0.89
SS-F2-L88-S35
86.20
1.33
200.84
0.57
61.87
1.85
SS-F2-L88-S70
113.96
1.01
217.00
0.53
83.08
1.39
SS-F2-L127-S00
129.82
0.66
193.48
0.44
91.04
0.94
SS-F2-L127-S35
107.84
1.02
201.97
0.54
77.38
1.42
SS-F2-L127-S70
103.47
1.15
219.82
0.54
75.41
1.58
Average
0.83
0.45
1.16
SD
0.33
0.11
0.46
CV
0.40
0.24
0.40
(Ismail, 2015)
UPF1(0.5)
4.85
2.34
10.42
1.09
3.40
3.34
UPF1(0.9)
6.19
1.98
13.32
0.92
4.34
2.82
UPF1 (0.5)28
15.28
2.49
40.33
0.94
10.72
3.55
UPF1 (0.9)28
23.31
1.99
50.12
0.92
16.35
2.83
UL (2.48) F1 (0.5)
5.38
2.49
10.40
1.29
3.77
3.55
UL (2.48) F1 (0.9)
7.64
2.28
13.41
1.30
5.36
3.25
UT (1.96) F1 (0.5)
26.41
0.50
32.61
0.41
20.46
0.65
UT (1.96) F1 (0.9)
24.81
0.74
33.62
0.55
19.13
0.96
UL (1.4)T (1.96) F1 (0.5)
30.40
0.88
35.78
0.75
23.54
1.13
UL (2.48)T (1.96) F1 (0.5)
36.21
0.86
40.73
0.77
28.05
1.11
UL (2.48)T (2.94) F1 (0.5)
41.61
0.77
47.18
0.68
32.40
0.99
UL (1.4)T (1.96) F1 (0.5)
28.34
0.90
34.12
0.75
21.95
1.16
Average
1.52
0.86
2.11
SD
0.80
0.27
1.19
CV
0.53
0.31
0.56
(Kwahk et al., 2015)
SH-P0-F1.5-L1-S1 (D13)
146.16
0.66
275.46
0.35
105.25
0.92
SH-P2-F1.5-L1-S1 (D13)
128.31
0.78
275.60
0.37
92.39
1.09
SH-P4-F1-L1-S1
108.21
0.71
208.86
0.37
78.46
0.97
SH-P0-F1-L1-S1
101.54
0.84
208.80
0.41
73.63
1.15
SH-P4-F1.5-L1-S2
121.71
0.80
269.83
0.36
87.69
1.11
SH-P0-F1.5-L1-S2
123.90
0.85
269.40
0.39
89.27
1.17
SH-P0-F1.5-L1-S1 (D10)
133.88
0.78
275.04
0.38
96.41
1.09
SH-P0-F1.5-L1-S1 (D10)
127.40
0.68
275.74
0.32
91.74
0.95
Average
0.76
0.37
1.06
SD
0.07
0.03
0.10
CV
0.09
0.07
0.09