
Abstract
Fatigue cracking is a major problem in orthotropic steel decks (OSDs). This study investigated the fatigue resistance of an OSD system with novel double-side welded rib-to-deck joints. The fatigue strengths of the novel rib-to-deck and conventional rib-to-diaphragm joints were determined by fatigue testing two full-scale segmental models. A framework for evaluating the dominant crack mode of an OSD system was then developed and applied; the inner weld toe-deck crack and weld toe-rib wall crack were identified as the dominant crack modes of the double-side welded and rib-to-diaphragm joints, respectively. The nominal and hot spot stress fatigue strengths of the novel rib-to-deck joint were 90.53 and 108.95 MPa, respectively, whereas those of the rib-to-diaphragm joint were 44.27 and 98.66 MPa, respectively.
Keywords
Introduction
Orthotropic steel decks (OSDs) have been widely used in long span bridges owing to their advantageous load-bearing efficiency and convenience in construction (Wolchuk, 1990). However, numerous fatigue cracks have been reported in OSDs around the world (Fisher and Barsom, 2016; Xiao et al., 2006). These cracks weaken the local stiffness of an OSD and accelerate the damage to its overlying asphalt pavement, resulting in increased maintenance cost. Therefore, studies on the fatigue cracking of OSDs have attracted considerable attention.
The statistics describing cracking cases in existing bridges indicate that the rib-to-deck (R-DK) and rib-to-diaphragm (R-DP) joints of an OSD are the most vulnerable details to cracking, as shown in Figure 1 (Zhang et al., 2017). Extensive research has therefore been devoted to investigating the fatigue behaviors of these joints. Ya et al. (2011), Fu et al. (2017), and Li et al. (2018) experimentally studied the fatigue behavior, fatigue strength, and crack modes of R-DK joints with different weld penetrations. Their results indicated that the fatigue strength for the weld toe-deck crack mode is higher than that for the weld root-deck or weld root-weld throat crack modes and that cracks initiating from the weld root can be prevented by increasing the weld penetration. Zhang et al. (2015), Zhou et al. (2016), and Yokozeki and Miki (2016) investigated the fatigue behavior of the R-DP joint by studying the fatigue strength of the cope hole and weld joints within using fatigue tests and subsequently recommended evaluation methods for different crack modes. The results of previous research have improved the understanding of fatigue behavior in OSDs and resulted in two primary findings: (1) both the R-DK and R-DP joints exhibit multiple fatigue crack modes, and the fatigue strength for different crack modes are distinct; (2) optimizing the design parameters and improving the manufacturing quality using advanced manufacturing techniques represent effective methods for promoting the fatigue resistance of OSDs. Typical potential fatigue crack modes of conventional R-DK and R-DP joints.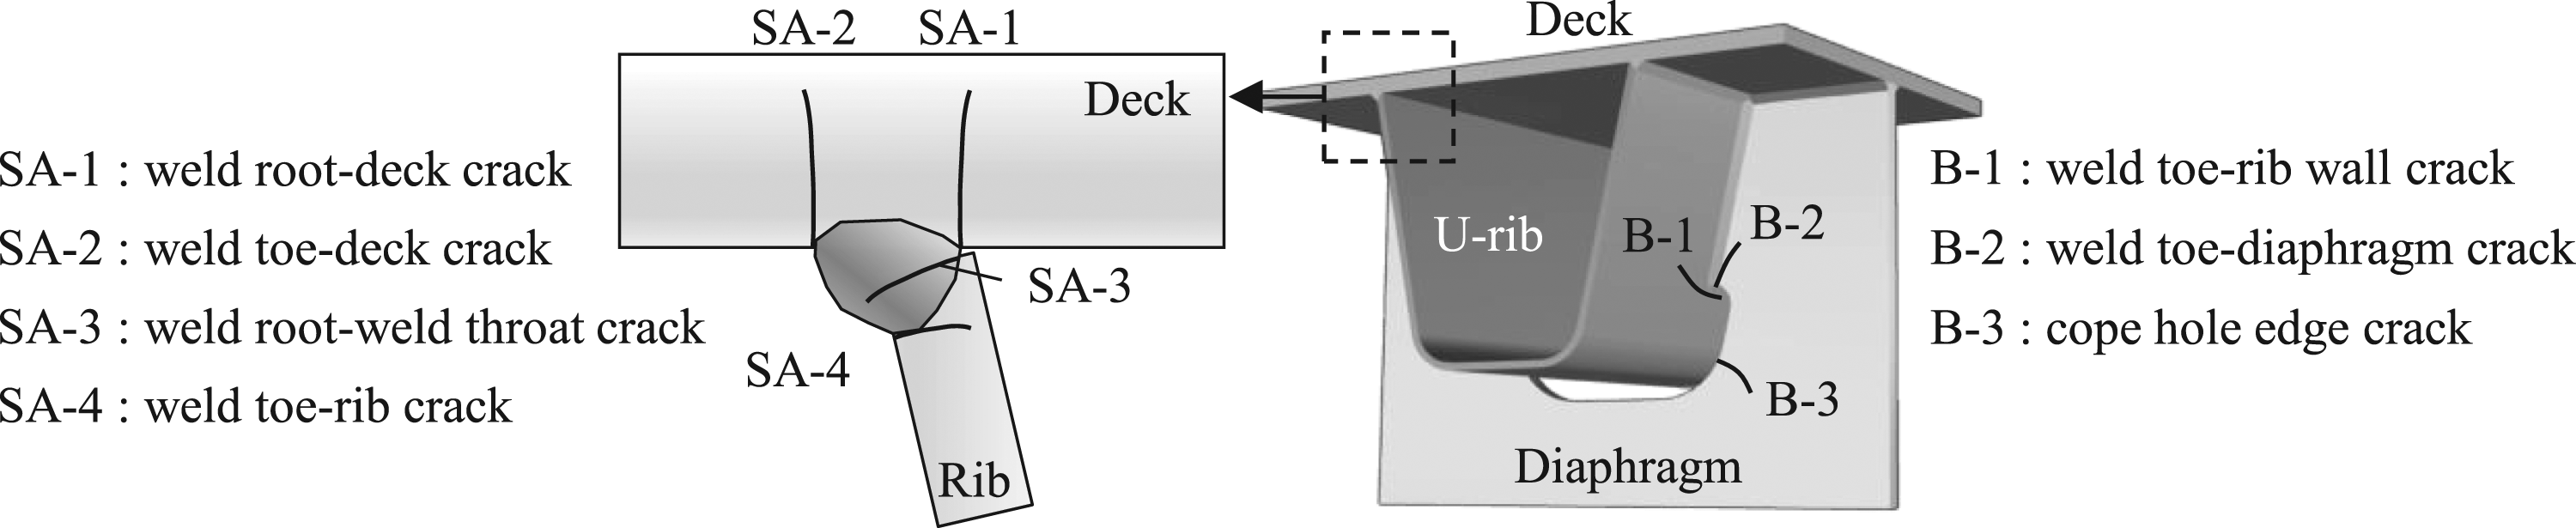
Design parameter optimization has indicated that an increase in deck plate thickness from 12 to 16 mm and an increase in diaphragm thickness from 10 to at least 14 mm (Connor, 2012) respectively reduce the nominal stresses in the welds of the R-DK joint and at the cope hole of the R-DP joint. Advanced manufacturing techniques developed to improve the quality of OSDs include the recent development of a welding robot to add a weld seam to the weld root of the conventional R-DK joint inside the U-rib, as shown in Figure 2, thereby addressing the low fatigue strength of the weld root owing to the notch effect and welding defects (Fang et al., 2020; Zhang et al., 2021). As a result, the weld root-deck crack and weld root-throat crack of the conventional R-DK joint were replaced with an inner weld toe-deck crack, significantly improving the fatigue strength of the joint. To distinguish this novel R-DK joint from the conventional one, the conventional joint with only an outside weld is called a “single-side welded R-DK joint” and the novel joint with an additional inner weld seam is called a “double-side welded R-DK joint.” Comparison of the conventional single-side welded R-DK joint and novel double-side welded R-DK joint (Zhang et al., 2021).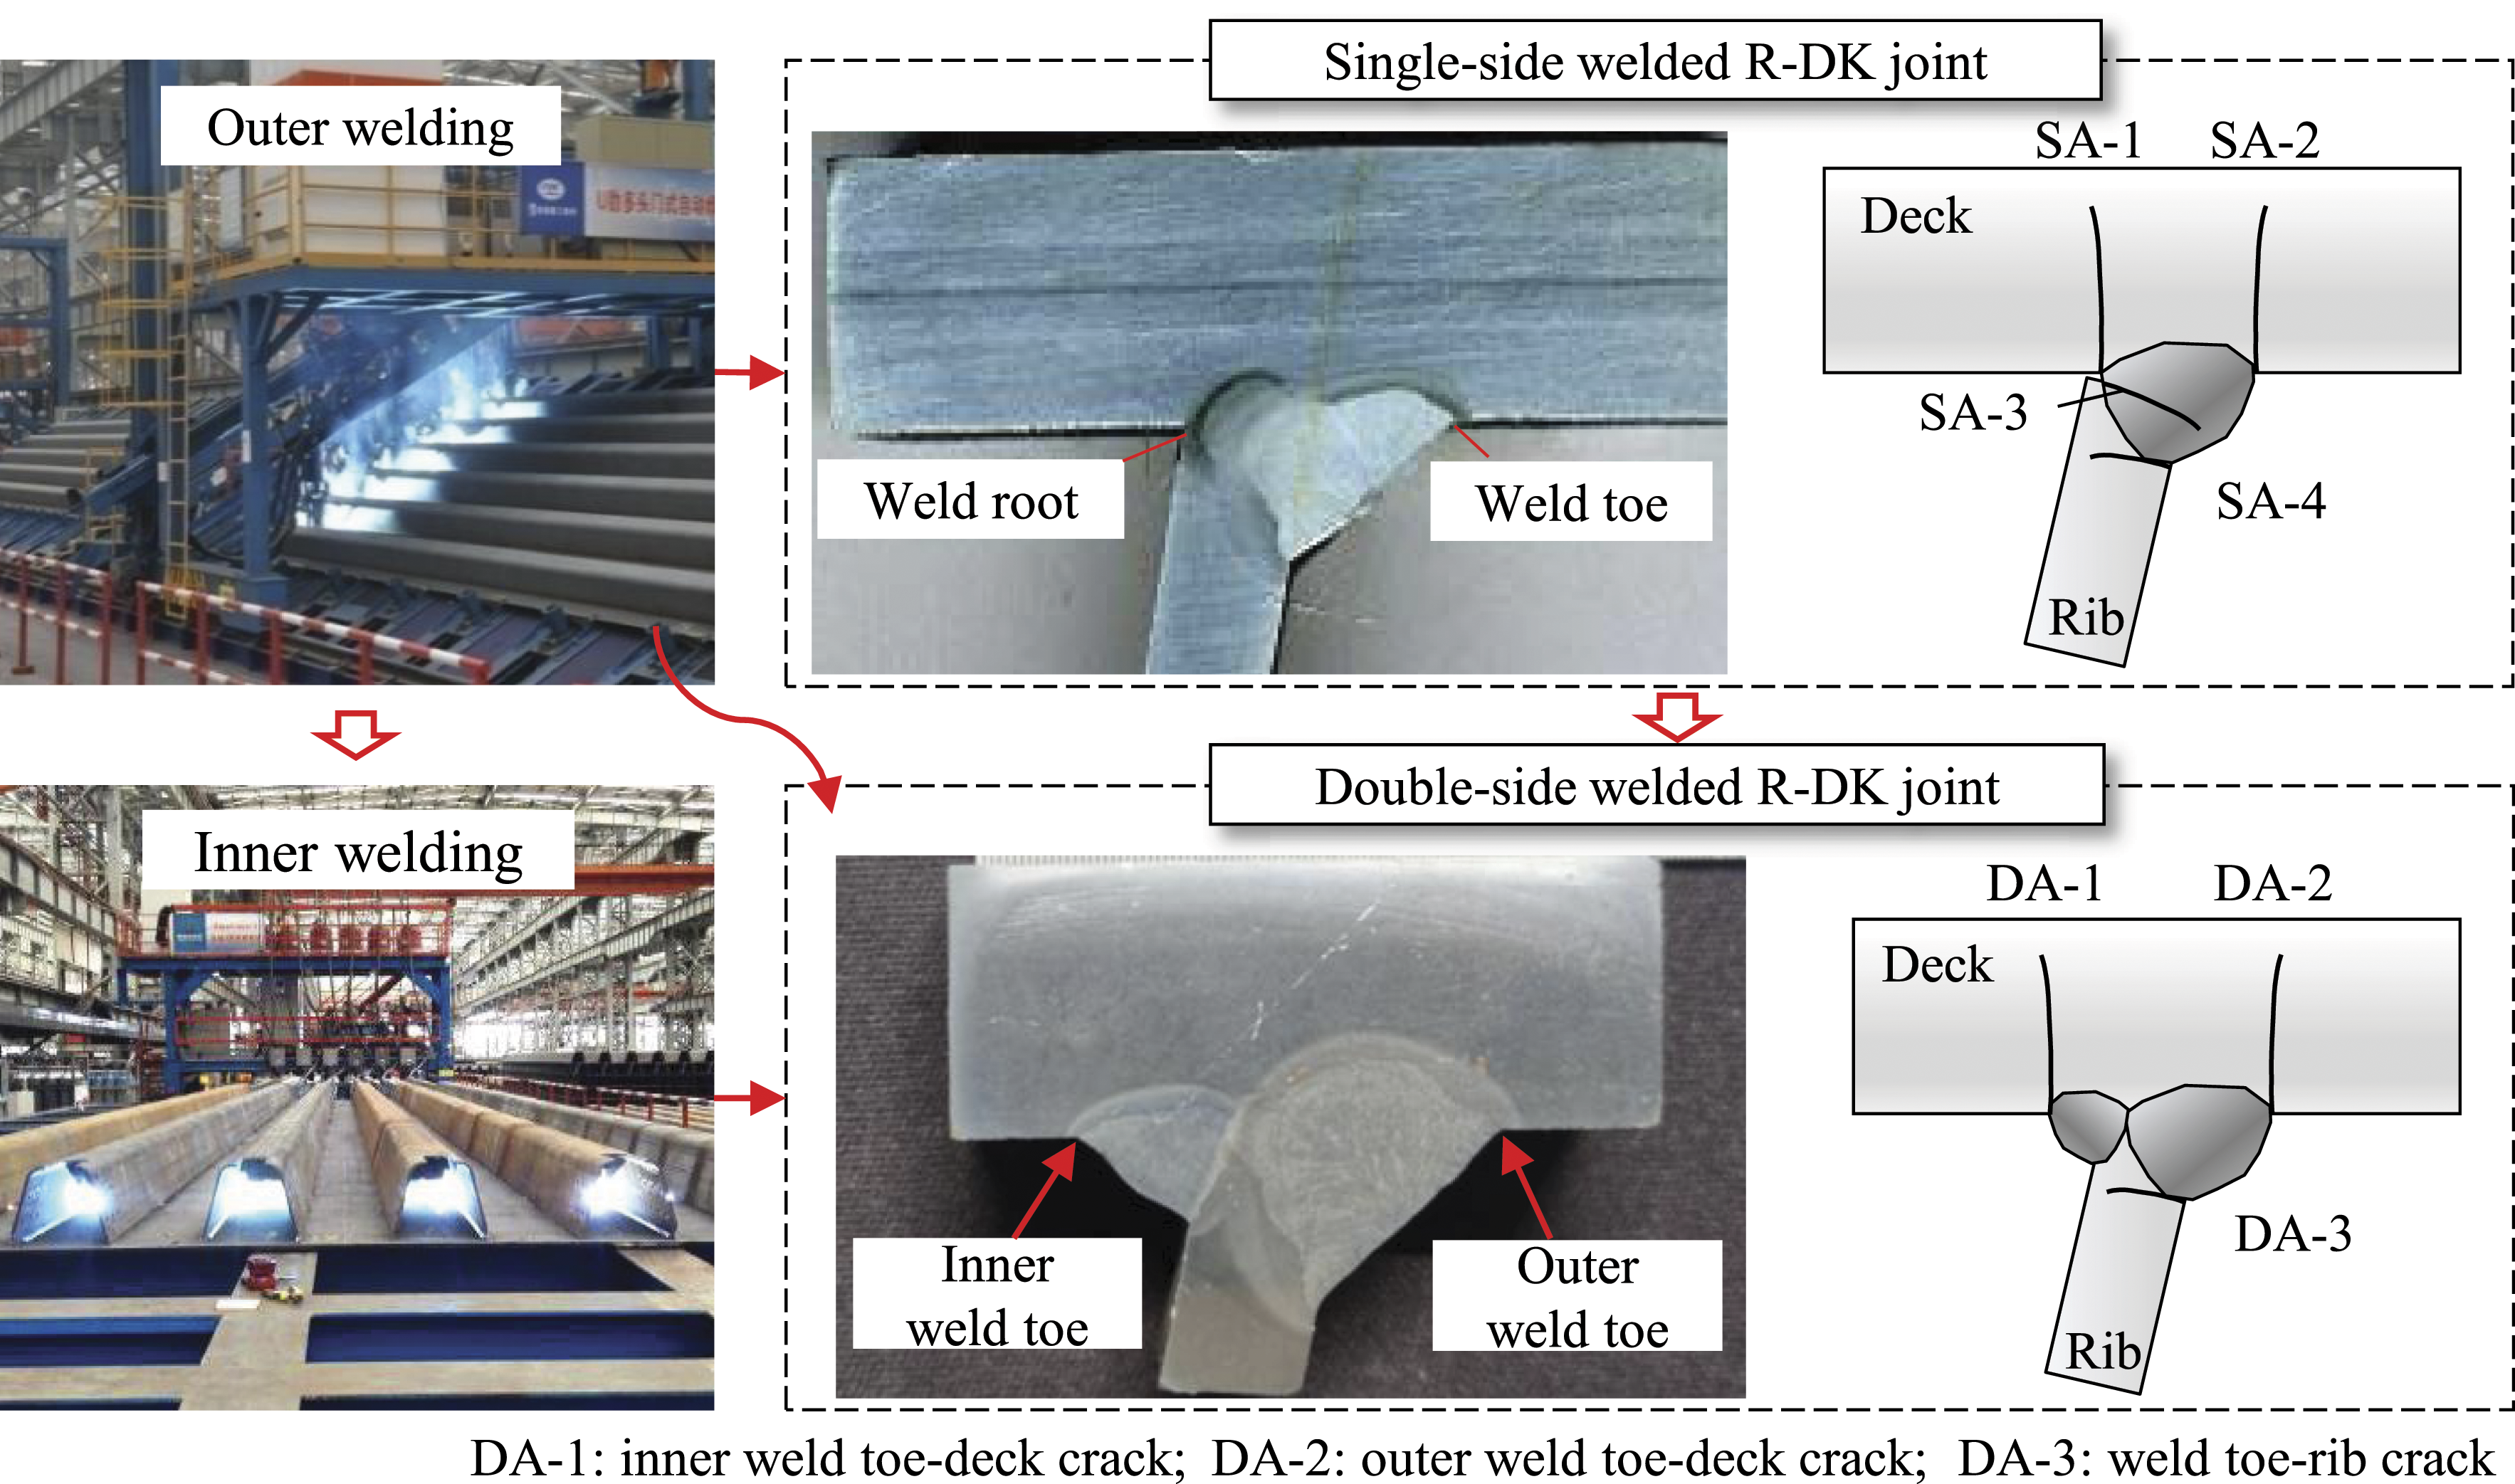
Under the action of stochastic wheel load, the multiple fatigue crack modes in the R-DK and R-DP joints accumulate fatigue damage at different rates. The mode with the fastest rate will be the first to crack, and the resistance of this mode dictates the fatigue resistance of the detail as well as the overall OSD system (Li et al., 2019). This is commonly referred to as the “short board effect”, as the fatigue resistance of the crack mode with the fastest damage accumulation rate represents the “short board” of the OSD system; this mode can be taken as the dominant fatigue crack mode. Previous research has focused on improving the fatigue strength of a single crack mode. However, if the investigated crack mode is not the dominant one, the fatigue resistance of neither the detail nor the OSD system will change. For example, a U-rib with a locally increased thickness at the edge near the R-DK joint was proposed to facilitate larger weld penetration and reduce the probability of melt-through (Heng et al., 2017). Though the fatigue strength of the weld toe-deck crack was improved owing to the resulting decrease in nominal stress at the deck toe, the fatigue resistance of the R-DK joint remained nearly unchanged as there was no noticeable improvement in the fatigue strength at the weld root (Luo et al., 2019). Therefore, the dominant crack mode must be determined to improve the fatigue resistance of the OSD joint details and overall system.
The double-side welded R-DK joint has become increasingly widely used in China, and has been applied with conventional R-DP joints in the OSDs of the Shenzhen-Zhongshan and Qingshan bridges. However, the dominant crack mode of an OSD system containing these joints must be determined to clarify its fatigue resistance and guide maintenance efforts. This study therefore investigated the fatigue resistance of an OSD system employing double-side welded R-DK and conventional R-DP joints by subjecting two full-scaled segmental models to fatigue loading. The fatigue strengths corresponding to the typical crack modes of each joint type were then obtained based on the results. Finally, an evaluation framework was developed and applied to determine the dominant crack mode of the subject OSD system.
Experimental program
Test model and setup
Two full-scale segmental models with double-side welded R-DK and conventional R-DP joints were designed for fatigue testing. These models measured 6300 mm long, 2100 mm wide, and 736 mm high, and each comprised a 16-mm thick deck plate, three 14-mm thick diaphragms, and three 8-mm thick U-ribs, as shown in Figure 3. The diaphragms were spaced 3000 mm apart in the longitudinal direction and measured 700 mm high and 2100 mm wide. As shown in Figure 3(b), the geometry of the cope holes in the diaphragm webs satisfied the requirements of Eurocode 3 (EN 1993-1-9, 2005). The U-ribs were 300 mm wide at the top and 280 mm high; they were spaced 600 mm apart in the transverse direction. As shown in Figure 3(c), the U-ribs were connected to the deck plate using double-side welded R-DK joints with 80% penetration. Full-scale segmental models (unit: mm): (a) layout and dimensions, (b) detailed dimensions of the U-rib and cope hole, and (c) details of the double-side welded R-DK joint.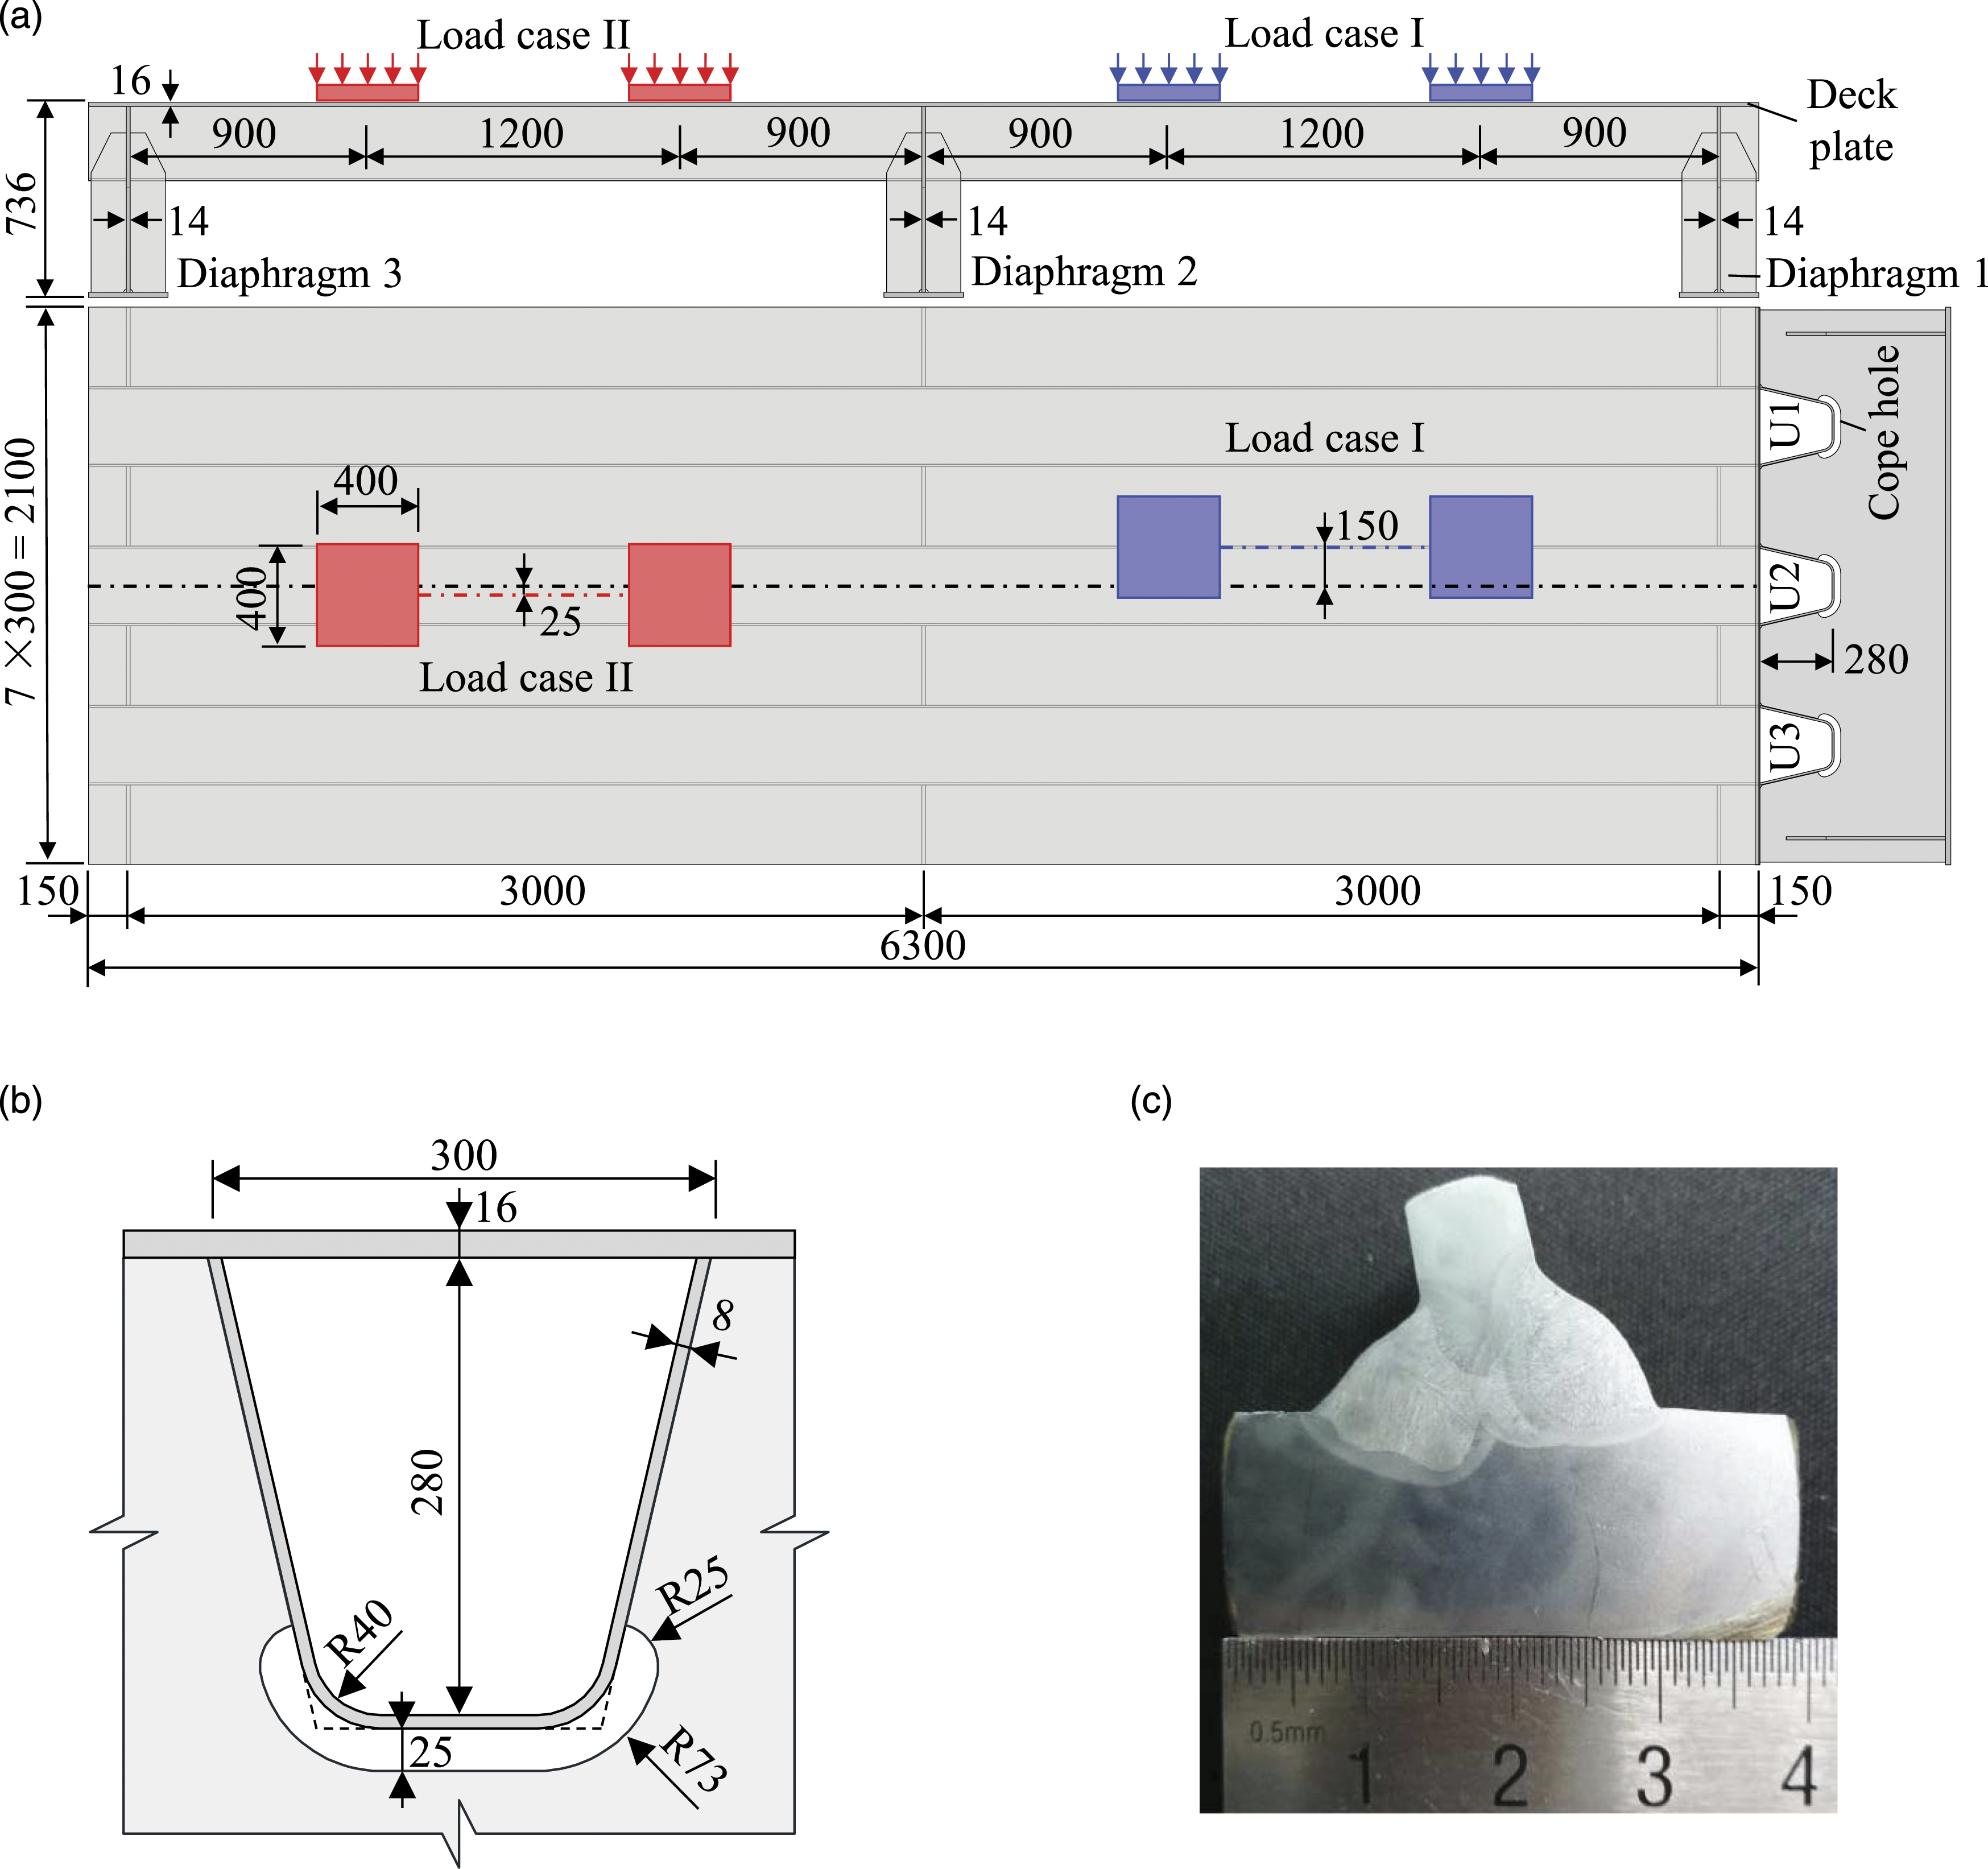
Figure 4 depicts the test setup used in this study. The OSD specimen was rigidly supported by six pedestals, one at each flange end of the three diaphragms, and the pedestals were bolted to the supporting beams, which were in turn fixed to the ground. The fatigue load was applied by an MTS actuator with a load capacity of 500 kN through a rigid spreader beam measuring 1900 mm long, 500 mm wide, and 400 mm high. Two 50-mm thick rubber plates measuring 400 mm square were provided to transfer the fatigue load from the spreader beam to the deck plate. Test setup.
Loading protocol
Previous research demonstrated that the stresses in the R-DK and R-DP joints of an OSD are primarily influenced by the application of wheel loads midway between the diaphragms in the longitudinal direction and within 2000 mm in the transverse direction (Connor and Fisher, 2004; Lu et al., 2017). Therefore, a pair of wheel loads was applied along the longitudinal direction to reflect loading consistent with fatigue load model 3 in Eurocode 1 (EN 1991-2, 2003), as shown in Figure 3(a). Load cases I and II were applied to the different spans in each model to determine the fatigue strengths for crack modes DA-1 and DA-2, respectively (defined in Figure 2). Figure 5 shows the three-dimensional finite element model (FEM) of the test specimen established using the ANSYS software to analyze the stress distribution around the R-DK and R-DP joints and thereby determine the reasonable loading positions for each load case. The deck plate, U-ribs, and diaphragms were simulated using the linear 3D element (Solid 45) and linear elastic material properties with a modulus of 210 GPa. A mesh size convergence analysis was conducted to determine a grid-independent mesh size. The minimum mesh size of the deck plate near the R-DK joint was determined to be 2.6 mm and that of the U-rib near the R-DP joint was 1.3 mm. The mesh size gradually increased to the global mesh size (50 mm) beyond these points of interest. Fixed restraints were applied to the bottom surfaces of both ends of the diaphragm flanges for consistency with the test setup. Finite element model (FEM) of the test specimen and the transverse stress at the inner and outer weld toes of the R-DK joint at the mid-span section.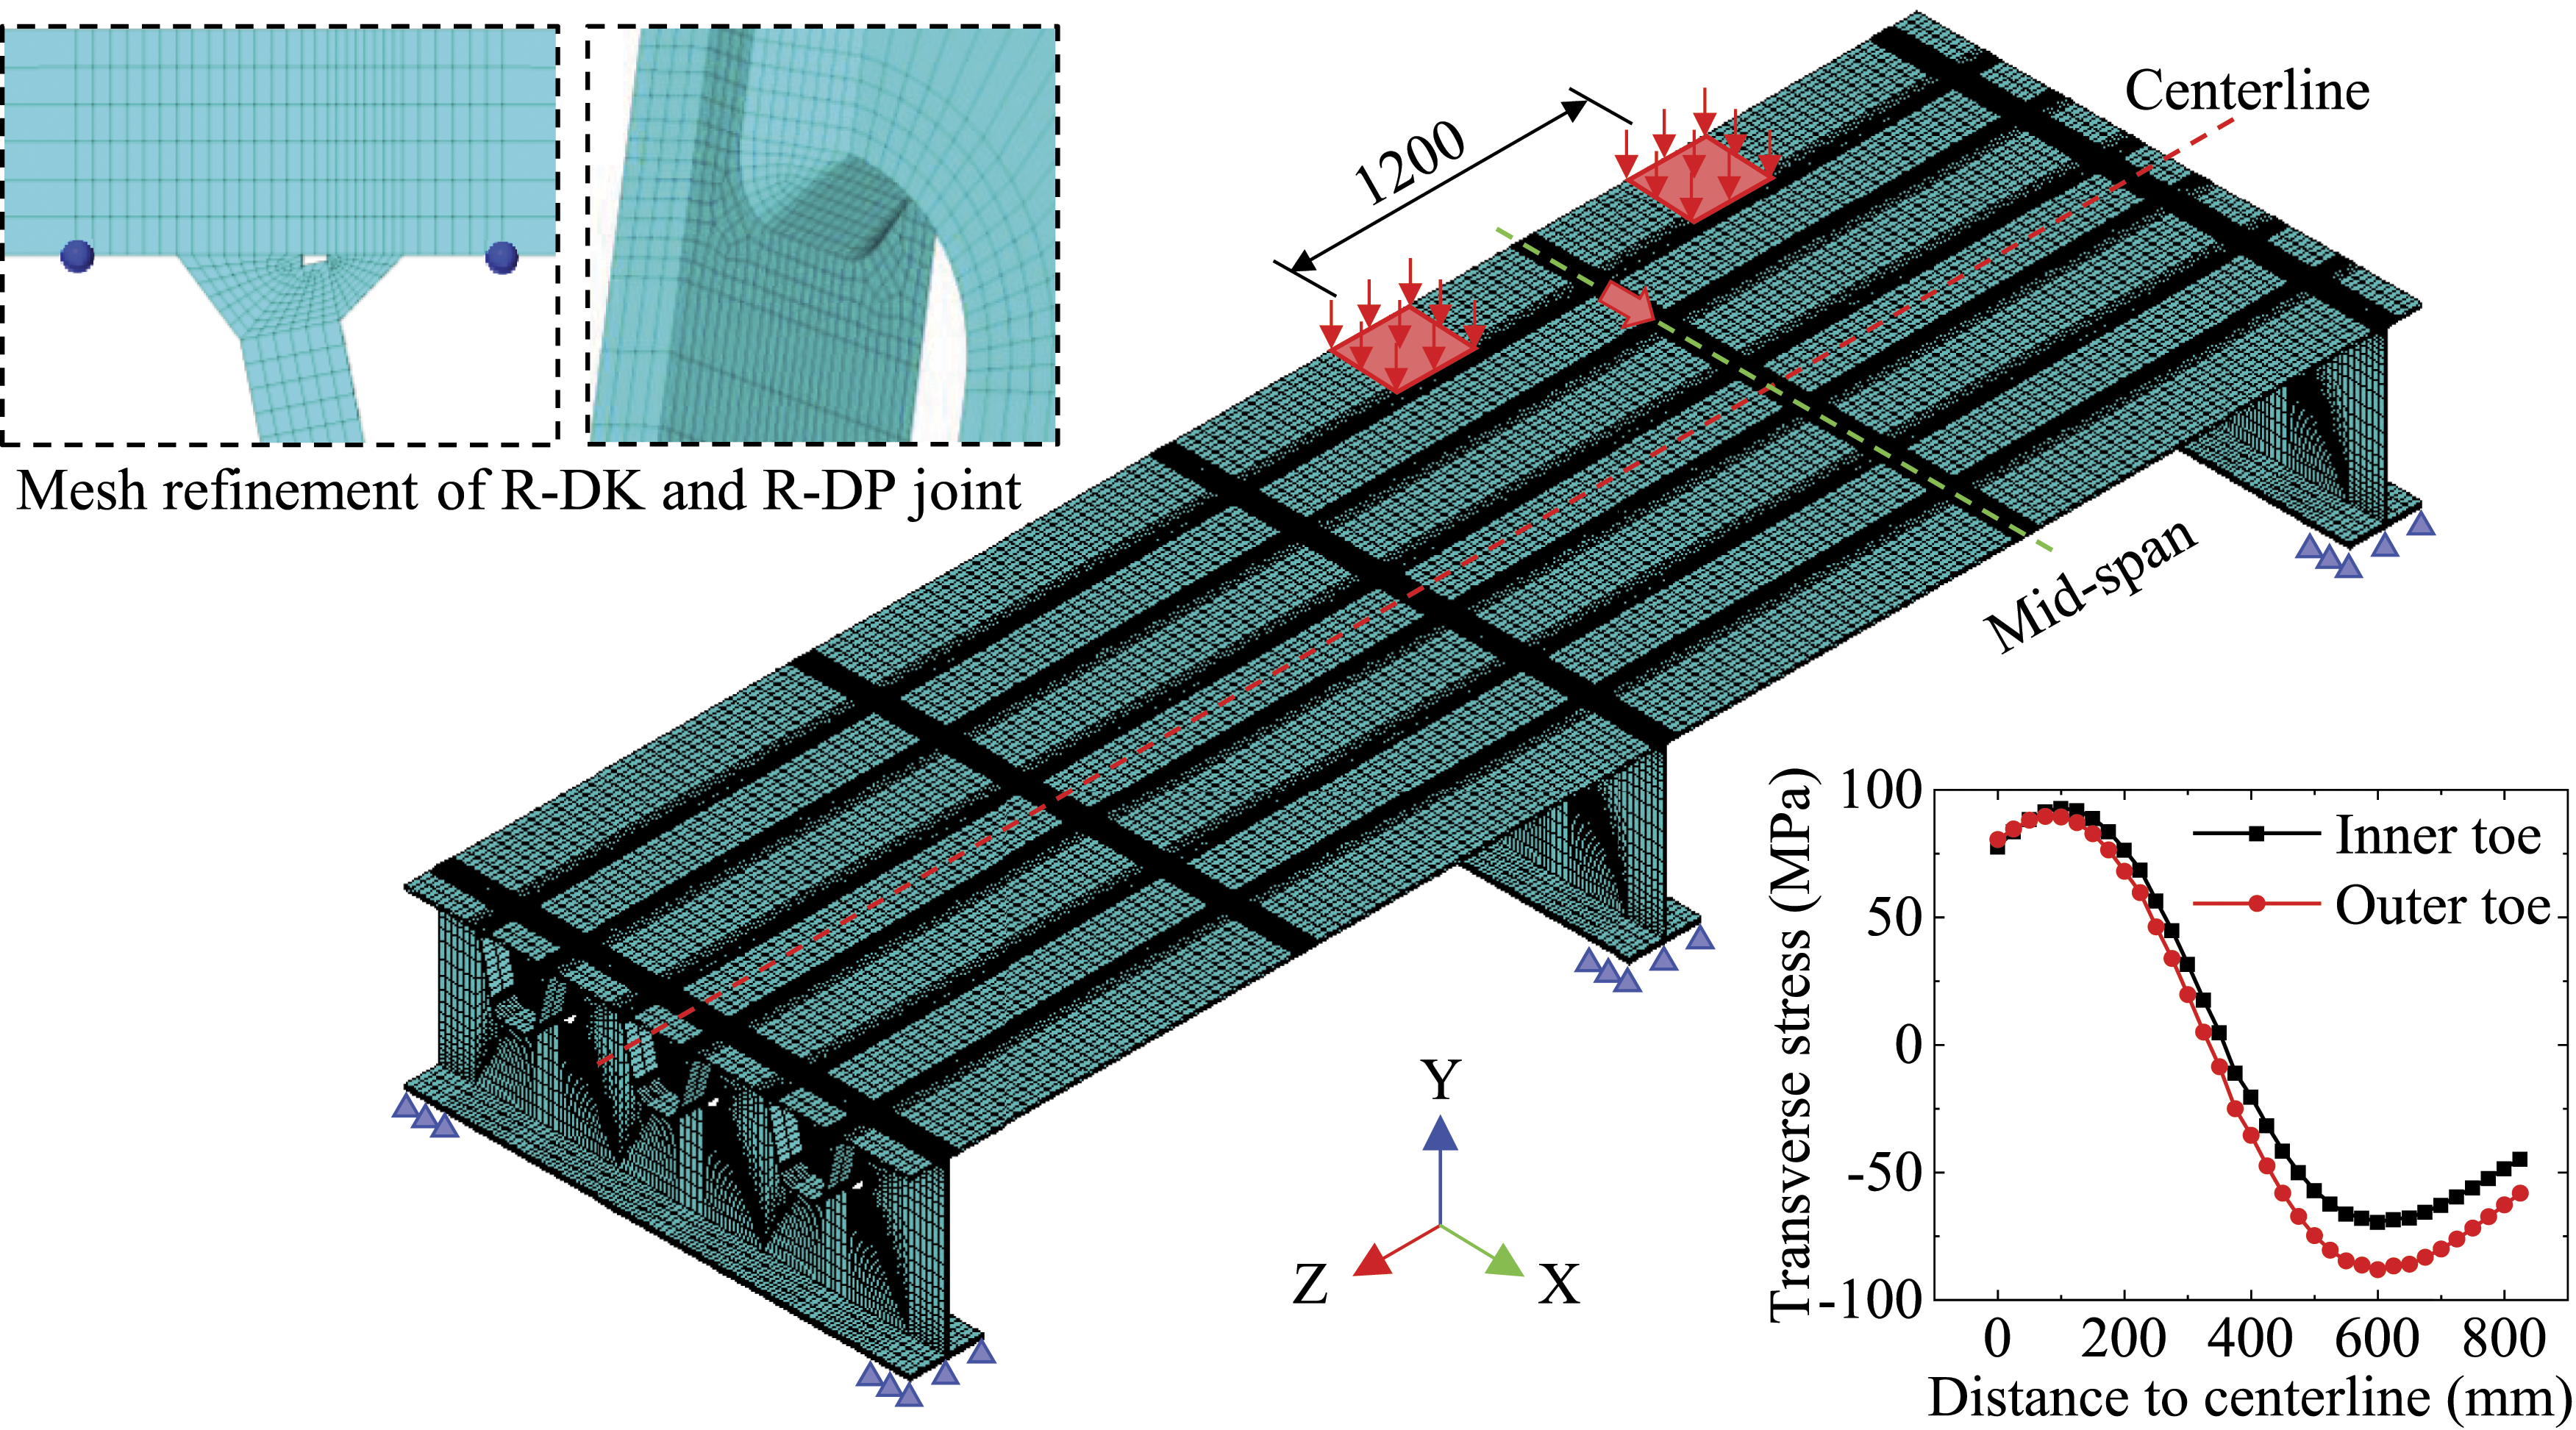
As shown in Figure 5, the wheel load pair was moved from the side of the model to the centerline in 25 mm increments along the transverse (X) axis. The resulting transverse stresses at the inner and outer weld toe of the R-DK joint on the left side of the middle U-rib are also illustrated in Figure 5. The stress at the inner weld toe was slightly greater than that at the outer weld toe in most locations, but when the longitudinal centerline of the wheel load was within 50 mm of the specimen longitudinal centerline, the stress at the outer weld toe was higher than that at the inner weld toe. Hence, for load cases I and II, distance between the centerlines of the load and specimen was set to 150 and 25 mm, respectively.
Considering the need for loading efficiency and the fatigue strength recommended for the R-DK joint in Eurocode 3 (EN 1993-1-9, 2005), a constant amplitude cyclic load with a range (ΔP) of 360 kN was applied in both load cases. To ensure the stability of the test system, a minimum load (Pmin) of 20 kN and a maximum load (Pmax) of 380 kN were applied. The frequency of the cyclic load was adjusted between 3.8 Hz and 4.5 Hz to avoid the resonance of the test system. During the fatigue test, static loading was periodically performed at intervals of 5 × 10⁴ cycles to measure the strain response. The same loading protocol was applied to each of the two specimens.
Instrumentation
Electric strain gauges were employed to measure the strain near the potential crack points. Fatigue cracks were detected in the R-DK joint using the strain gauge data and verified by ultrasonic non-destructive testing; fatigue cracks were detected in R-DP joints using the gauge data and verified by visual observation.
According to the results of the FEM analysis, the potential crack points were the R-DK joint between the loading areas and the end toe of the rib-to-diaphragm weld. Hence, the strain gauges were arranged around these locations, as illustrated in Figure 6. Considering that fatigue cracking of the R-DK joint is primarily caused by the bending deformation of the deck plate, uniaxial strain gauges measuring 1 mm wide and 2 mm long were used to measure the transverse strain around the R-DK joint. The strain gauges at the outer weld toe were arranged following the recommendation of the International Institute of Welding (IIW) (Hobbacher, 2016); two gauges were placed on the bottom surface of the deck plate with centers 6.4 mm (0.4td) and 16 mm (1.0td) from the outer weld toe, and an additional gauge was placed on the top surface of the deck plate above the outer weld toe. As strain gauges could not be placed along the inner weld toe, one gauge was also placed on the top surface of the deck plate above the inner weld toe. Thus, eleven columns of four strain gauges were arranged as shown in Figure 6(b). The strain gauges on the bottom surface of the deck plate were labeled OTB-1-11 I/II, in which OTB denotes the bottom surface of the deck plate near to the outer weld toe, 1–11 denotes the column number, and I and II denote the measurement points at 0.4td and 1.0td, respectively. The strain gauges on the top surface of deck plate were labeled OTT/ITT-1-11, in which OTT and ITT denote the top surface of the deck plate corresponding to the outer and inner weld toes, respectively, and 1–11 again denote the column number. Arrangement of strain gauges around the R-DK joint (unit: mm): (a) overview, (b) detail of section A-A, and (c) actual photograph.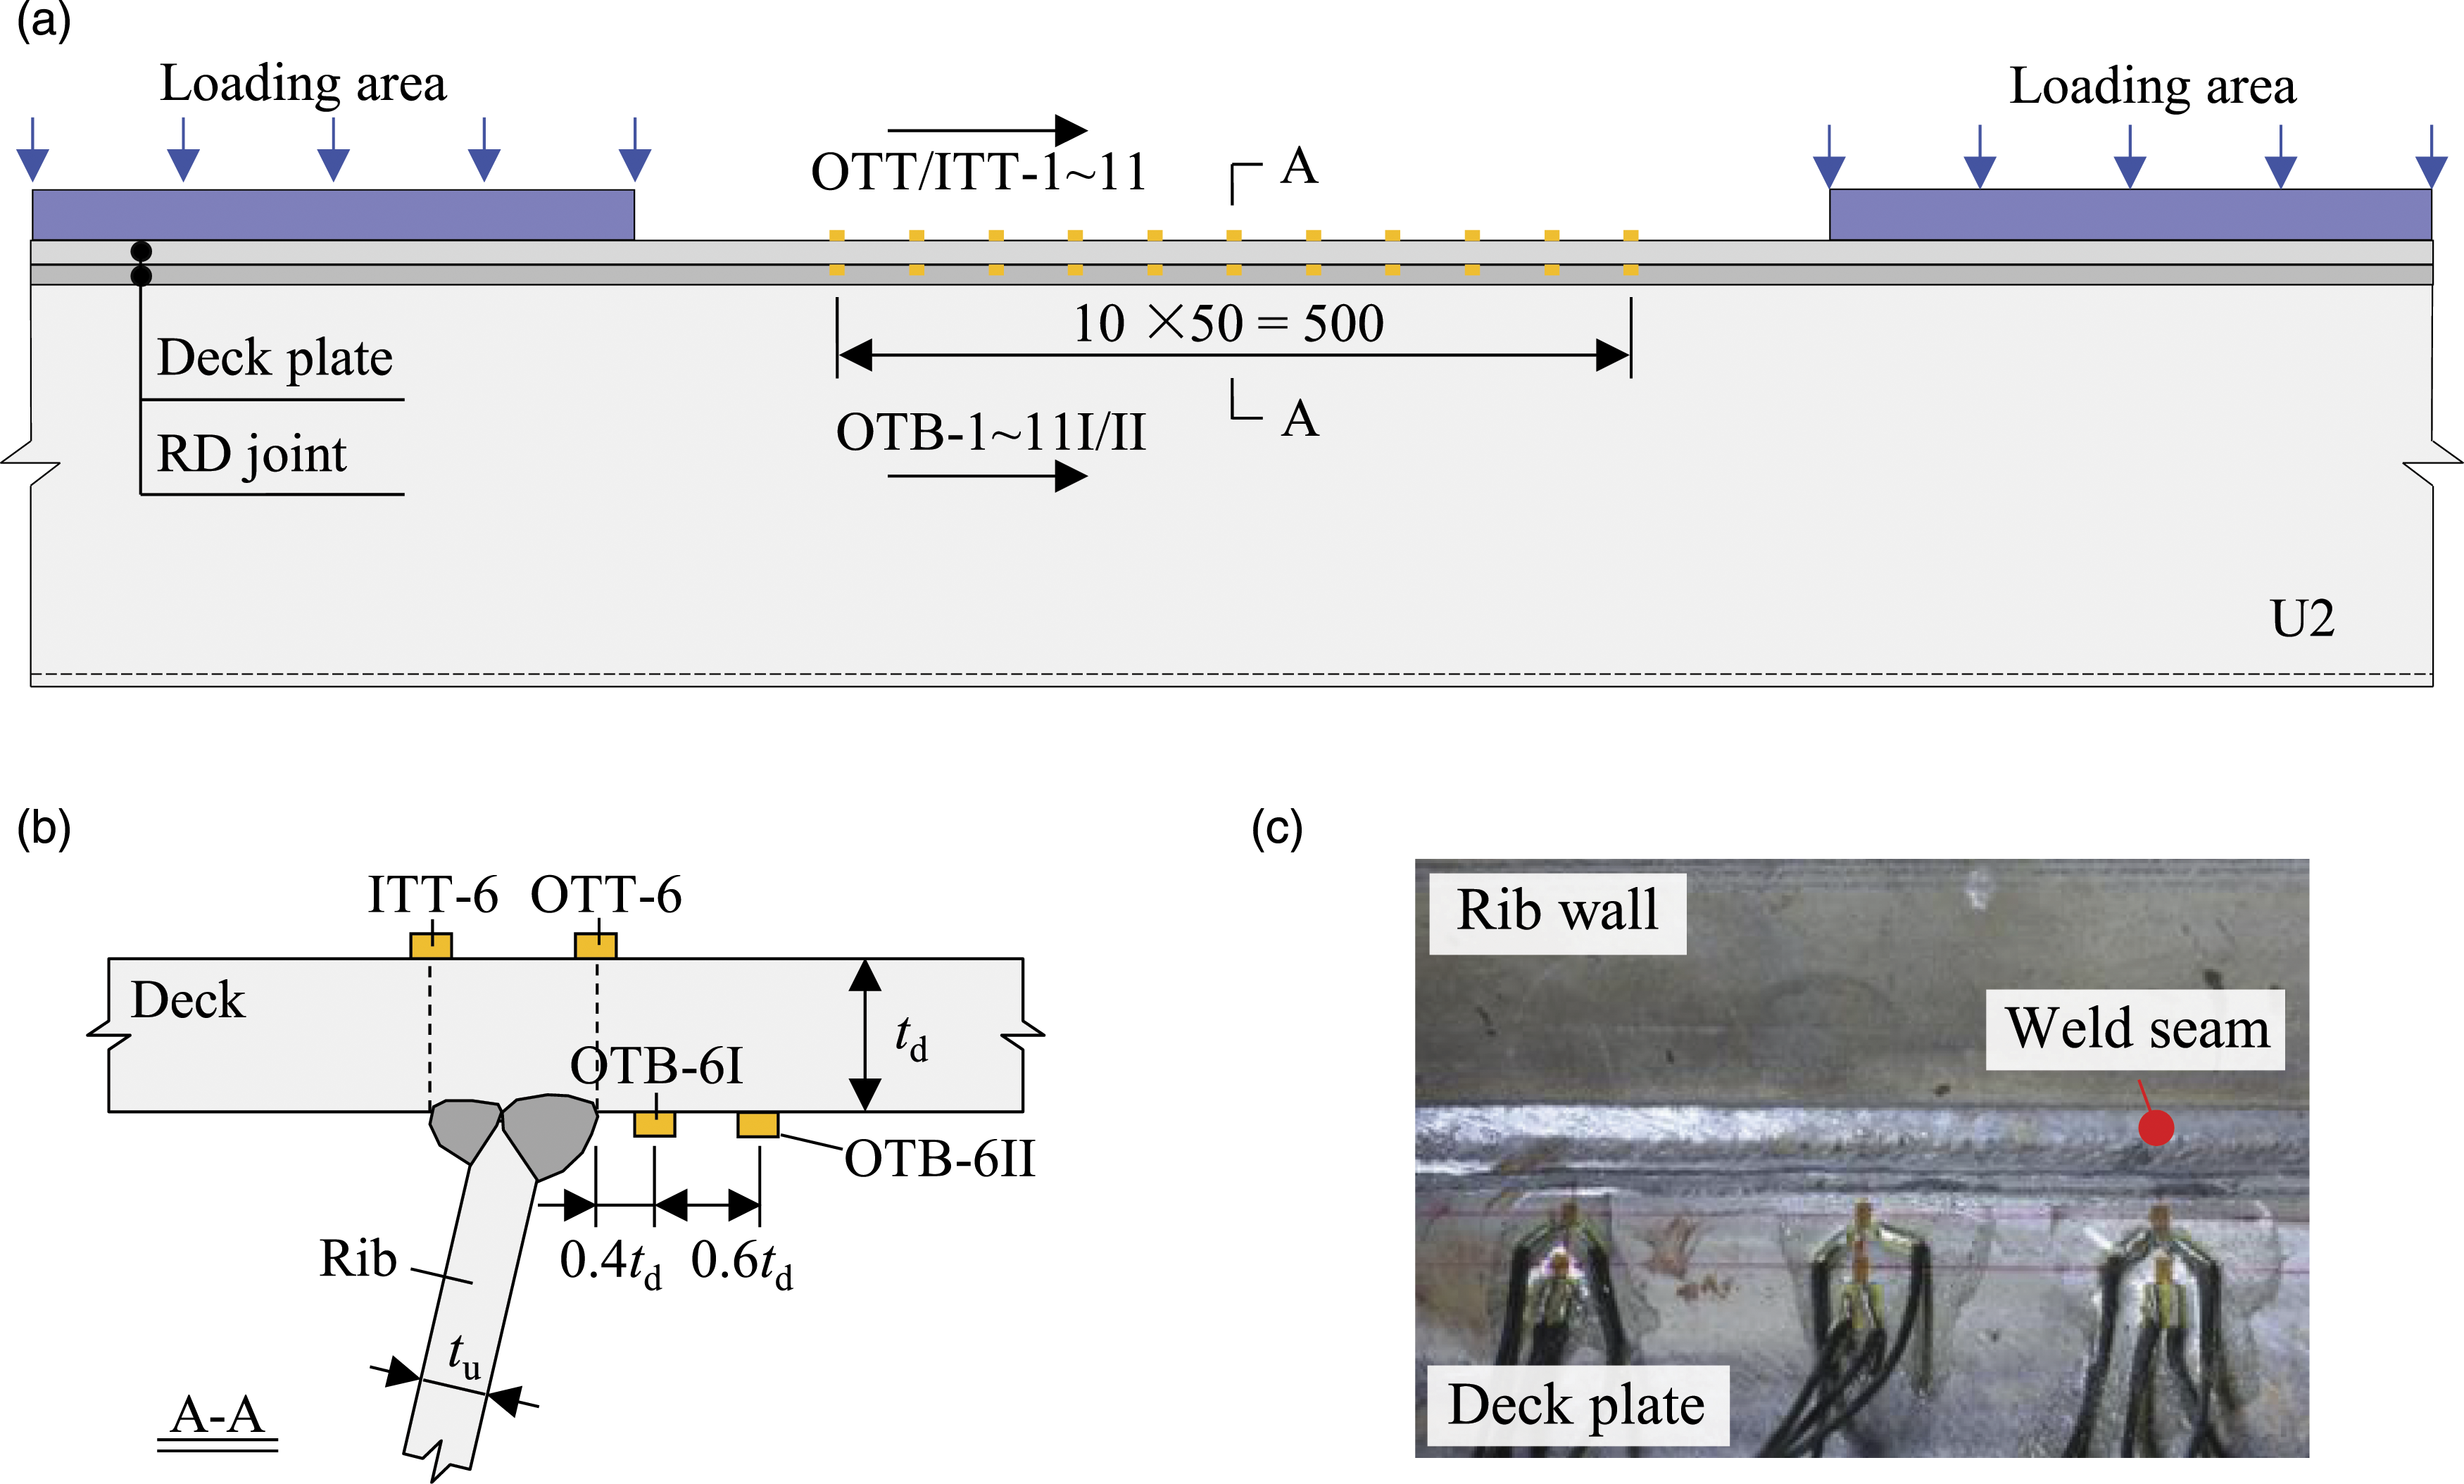
The arrangement of strain gauges around the end toe of the rib-to-diaphragm weld in the R-DP joint is illustrated in Figure 7. For load case I, the strains were measured on the left side of U1 and the right side of U2 on diaphragms 1 and 2; for load case II, the strains were measured on the left side of U2 and the right side of U3 on diaphragms 2 and 3. Because there were no other differences in the strain gauge arrangement, Figure 7 only presents the arrangement for load case I. For each measured region, two strain rosettes were centered 4 mm (0.4tu) and 8 mm (1.0tu) away from the weld toe on the rib wall to measure the hot spot stress, as recommended by the IIW (Hobbacher, 2016). Two strain additional rosettes were placed away from both the weld toe and the edge of the 5-mm cope hole on the diaphragm. The strain gauges on the rib wall were defined as D1U1/2-RI/II, in which D1 denotes the diaphragm number, U1/2 denotes the U-rib number, R denotes the rib wall, and I and II denote the measurement points at 0.4tu and 1.0tu, respectively. Arrangement of strain gauges around the R-DP joint (unit: mm): (a) overview, (b) detail B, and (c) detail C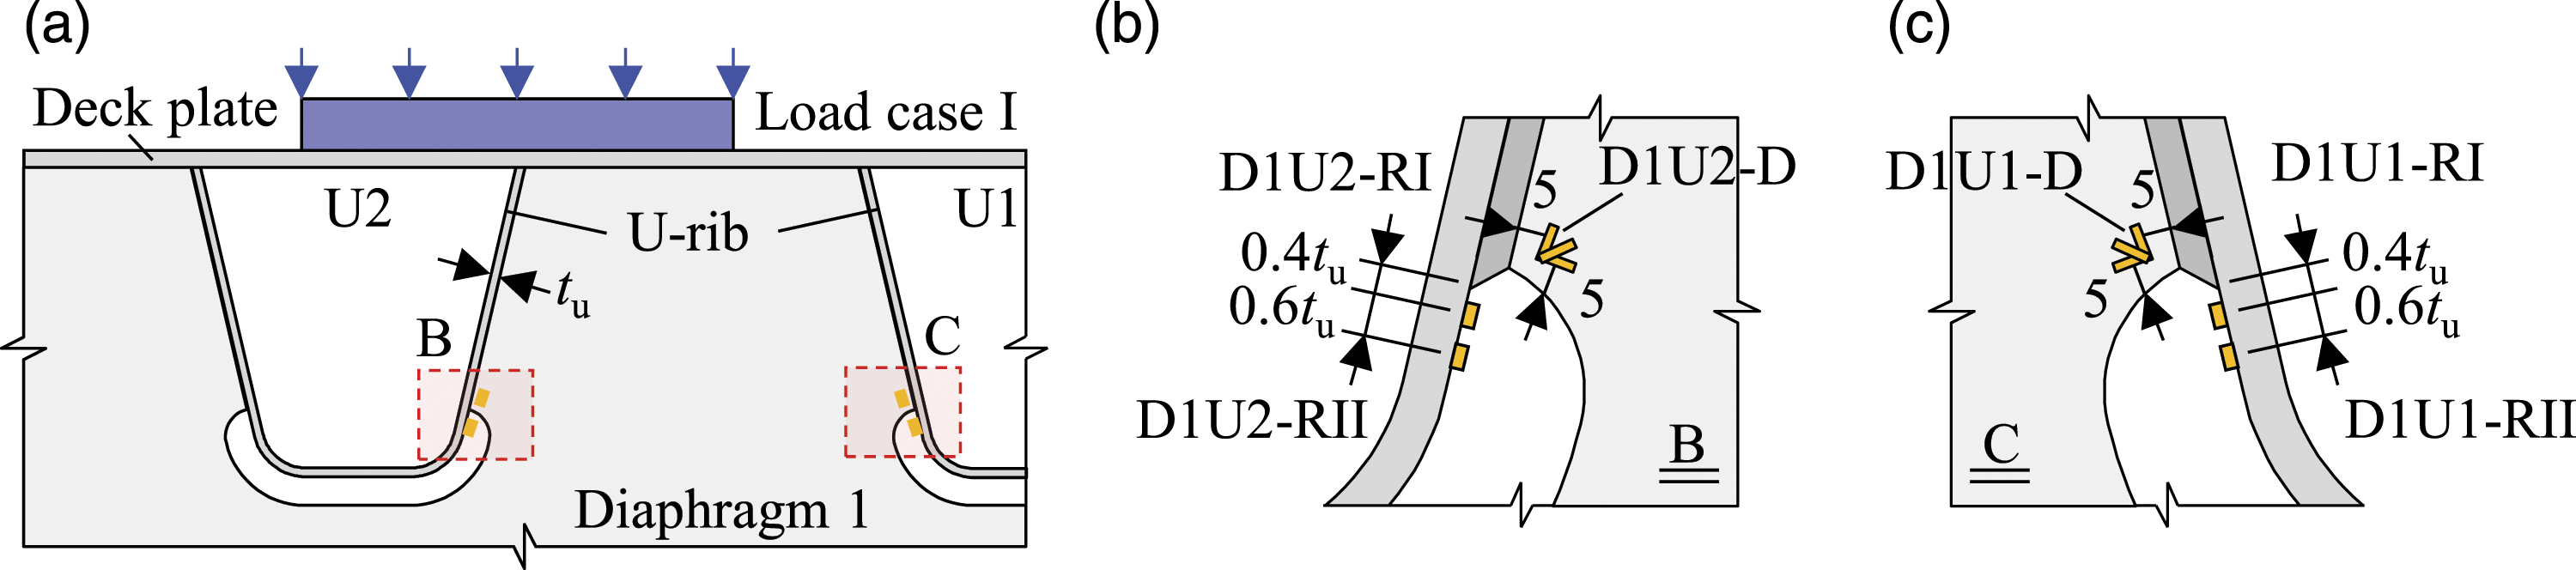
Test results
Prior to formal loading, a monotonic preload was applied to verify that the stress state in the concerned details agreed with the desired exceptional state. Figure 8 show comparisons between the measured and FEM-calculated stress ranges in the R-DK and R-DP joints, respectively. The stress indicator of R-DK joints was transverse stress and that of R-DP joints was principal stress. The differences between the measured and calculated stresses at the R-DK joint were within 10% at the outer and inner weld toe, indicating suitable agreement. However, for the R-DP joint, the measured stress at 0.4tu was significantly lower than the calculated stress. This disagreement was likely a result of the relative proximity of the measurement point at 0.4tu to the weld toe, where the measured stress was highly sensitive to the exact location of the gauge and the geometry of the weld. In fact, the measured stress further away from the weld toe at 1.0tu agreed with the calculated value. Generally, the stress states of the concerned details were determined to effectively reflect the desired exceptional state. Comparison of the measured and FEM-calculated stresses: (a) load case I, and (b) load case II.
Figure 9 shows the test results obtained under load case I. The measured stresses in the R-DP joint at U-rib 2 (D1U2 and D2U2) decreased in the early stage (below 1.0 × 10⁶ cycles) owing to the high induced stress level, indicating fatigue crack initiation. During the test, visual inspection was conducted to verify the fatigue cracking of the R-DP joint, a typical example of which is shown in Figure 9(b) to be consistent with crack mode B-1 defined in Figure 1. In the later stage, the stresses in the R-DP joint at U-rib 1 (D1U1 and D2U1) also decreased and the fatigue crack mode was again consistent with B-1. The fatigue cracks in the R-DP joint propagated continuously with ongoing cyclic loading. For the R-DK joint, the measured stress at IIT-5 in test model 1 began to decrease after 5.75 × 10⁶ cycles and the measured stress at IIT-6 in test model 2 began to decrease after 4.50 × 10⁶ cycles; ultrasonic non-destructive testing revealed fatigue cracks at the inner weld toes of both models at this time. After the fatigue test, the R-DK joint was investigated by wire cutting between measurement points IIT-5 and IIT-6: the discovered fatigue crack, shown in Figure 9(d), was consistent with mode DA-1 defined in Figure 2. Test results under load case I: (a) measured stresses at the cracked R-DP joint, (b) typical crack in the R-DP joint, (c) measured stresses at the cracked R-DK joint, and (d) typical crack in the R-DK joint.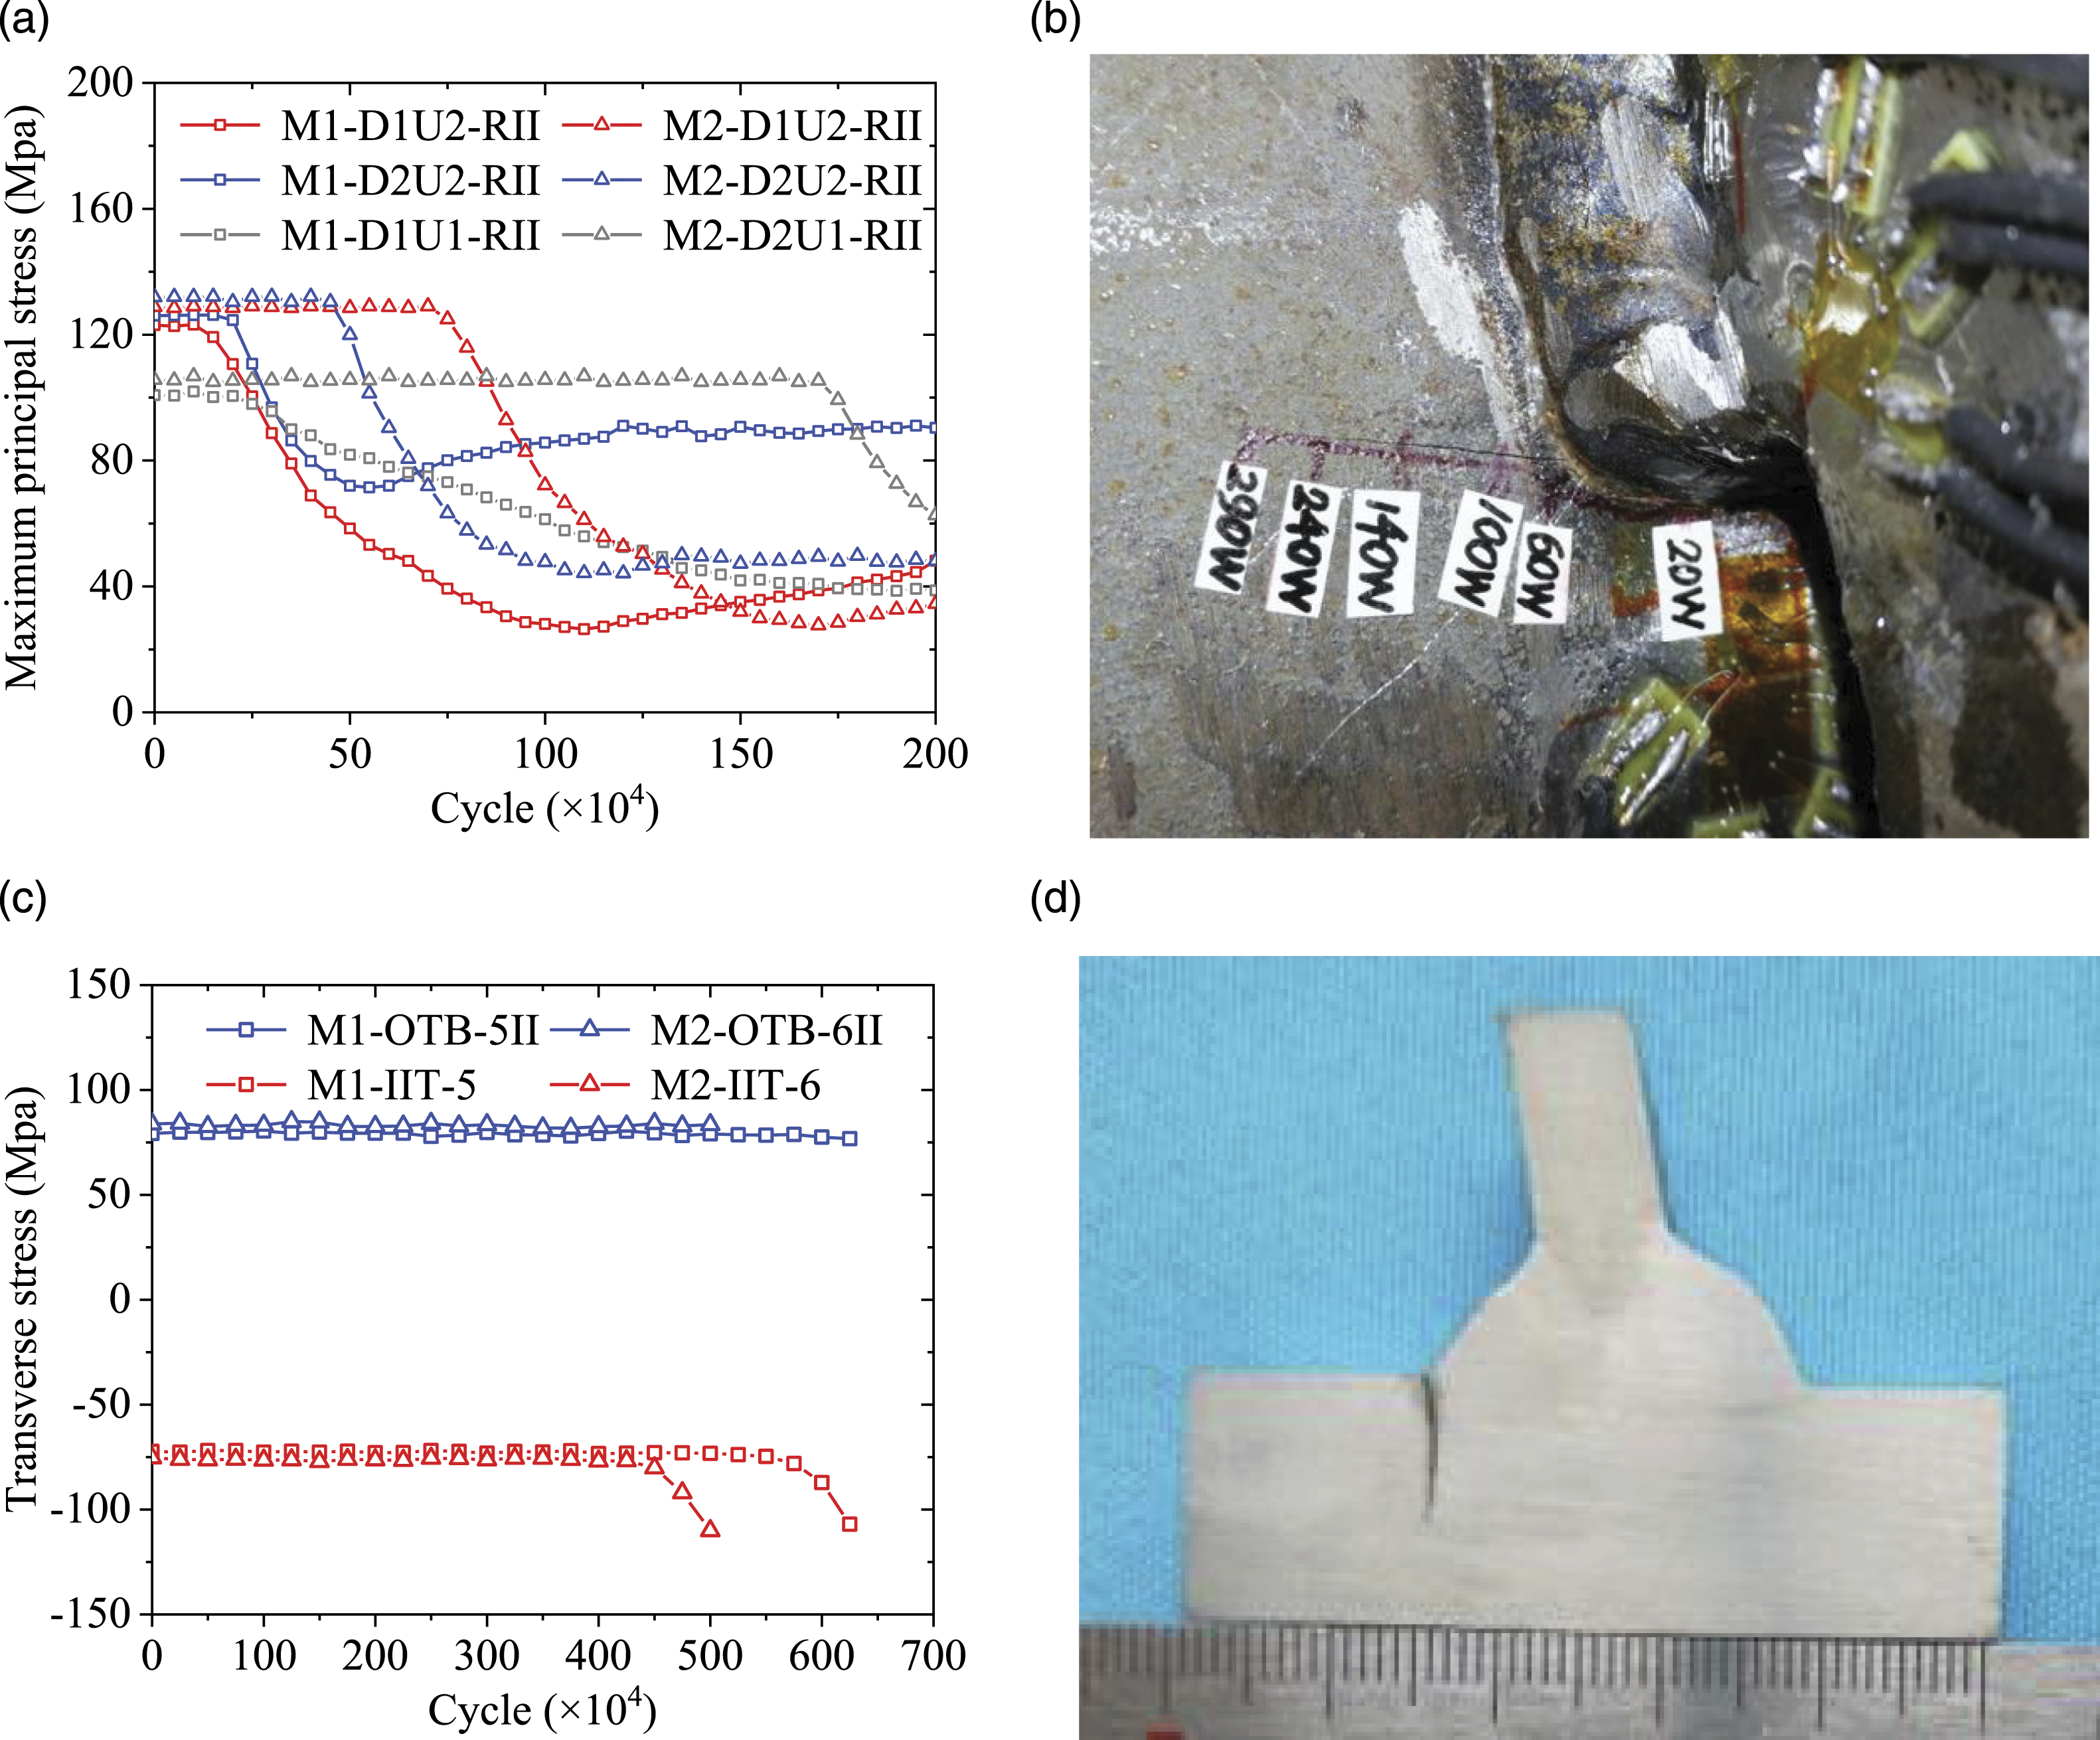
Figure 10 shows the test results obtained under load case II. The measured stresses in the R-DP joint were much smaller than those obtained under load case I. Fatigue cracking occurred in only one R-DP joint at diaphragm 2 and U-rib 2 in test model 1 (M1-D2U2-RII); the crack mode was consistent with mode B-1. For the R-DK joint, the stresses measured at OTB-5II in test model 1 began to decrease after 3.25 × 10⁶ cycles, and those in test model 2 began to decrease after 5.50 × 10⁶ cycles; ultrasonic non-destructive testing revealed a fatigue crack in each model at the outer weld toe at this location. After the fatigue test, the R-DK joint was investigated by wire cutting between measurement points OTB-5II and OTB-6II; the discovered fatigue crack, shown in Figure 10(d), was consistent with mode DA-2 defined in Figure 2. Test results under load case II: (a) measured stresses in the cracked R-DP joint, (b) typical crack in the R-DP joint, (c) measured stresses in the cracked R-DK joint, and (d) typical crack in the R-DK joint.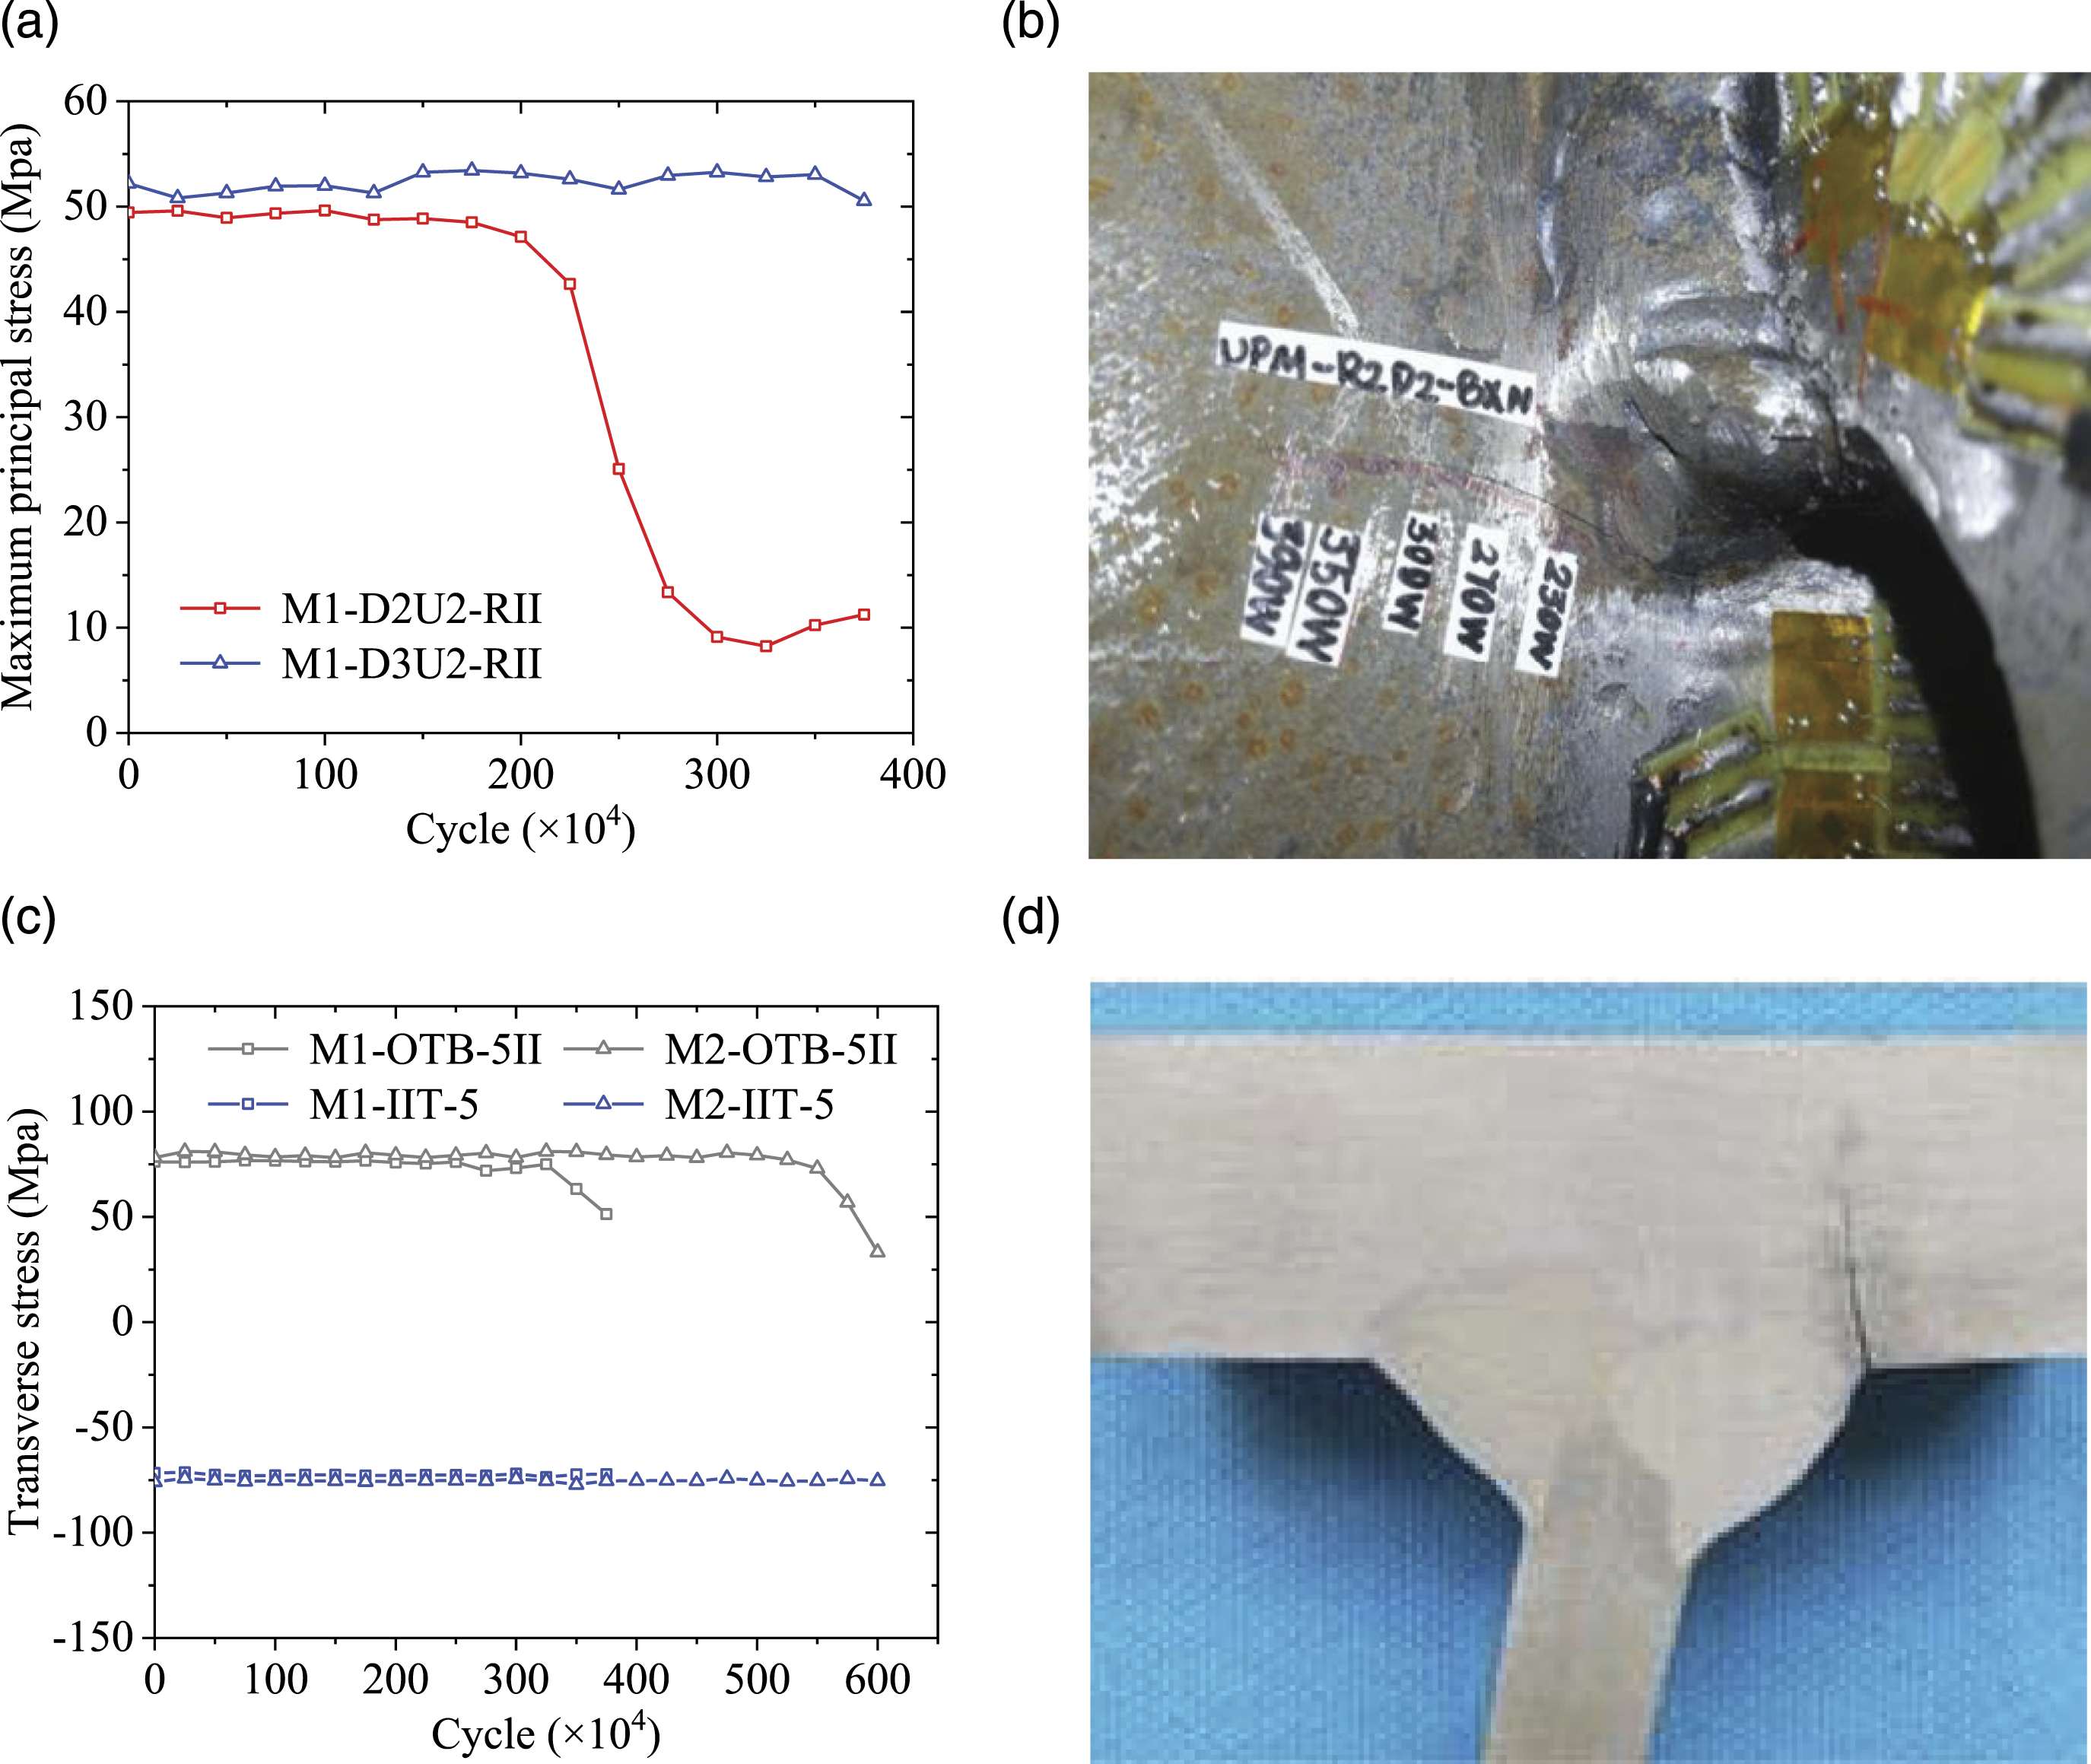
Fatigue strength evaluation
Evaluation criterion
The nominal and hot spot stress methods are the most commonly used approaches for fatigue verification in structural design. Therefore, this study evaluated the fatigue strengths of the joint details using the nominal and hot spot stresses. To do so, reasonable definitions of the nominal stress and fatigue failure criteria of the details were required. However, the definition of nominal stress for R-DK joints is inconsistent in existing research, as the distance between the reference point for nominal stress and the weld toe can vary from 5 mm to 1.0t (Kolstein, 2007; Wang et al., 2019; Zhang et al., 2018). For the end weld toe of R-DP joint, the reference point for nominal stress has typically been defined at 1.0tu. In this study, the reference points for the nominal stresses in the R-DK and R-DP joints were therefore both defined as being 1.0t from the relevant weld toe. For the hot spot stress, a linear extrapolation equation between two reference points was adopted as follows (Hobbacher, 2016):

Because the stresses in the inner weld toe of the R-DK joint could not be measured, the stresses calculated by the validated FEM were used for fatigue strength evaluation instead. In addition, because the measured hot spot stress in the R-DP joint was much smaller than the FEM-calculated value, it was computed based on the measured nominal stress σnom and the calculated stress concentration factor SCF as follows:

Fatigue results for all cracks observed during the fatigue tests.

Fatigue strength evaluation
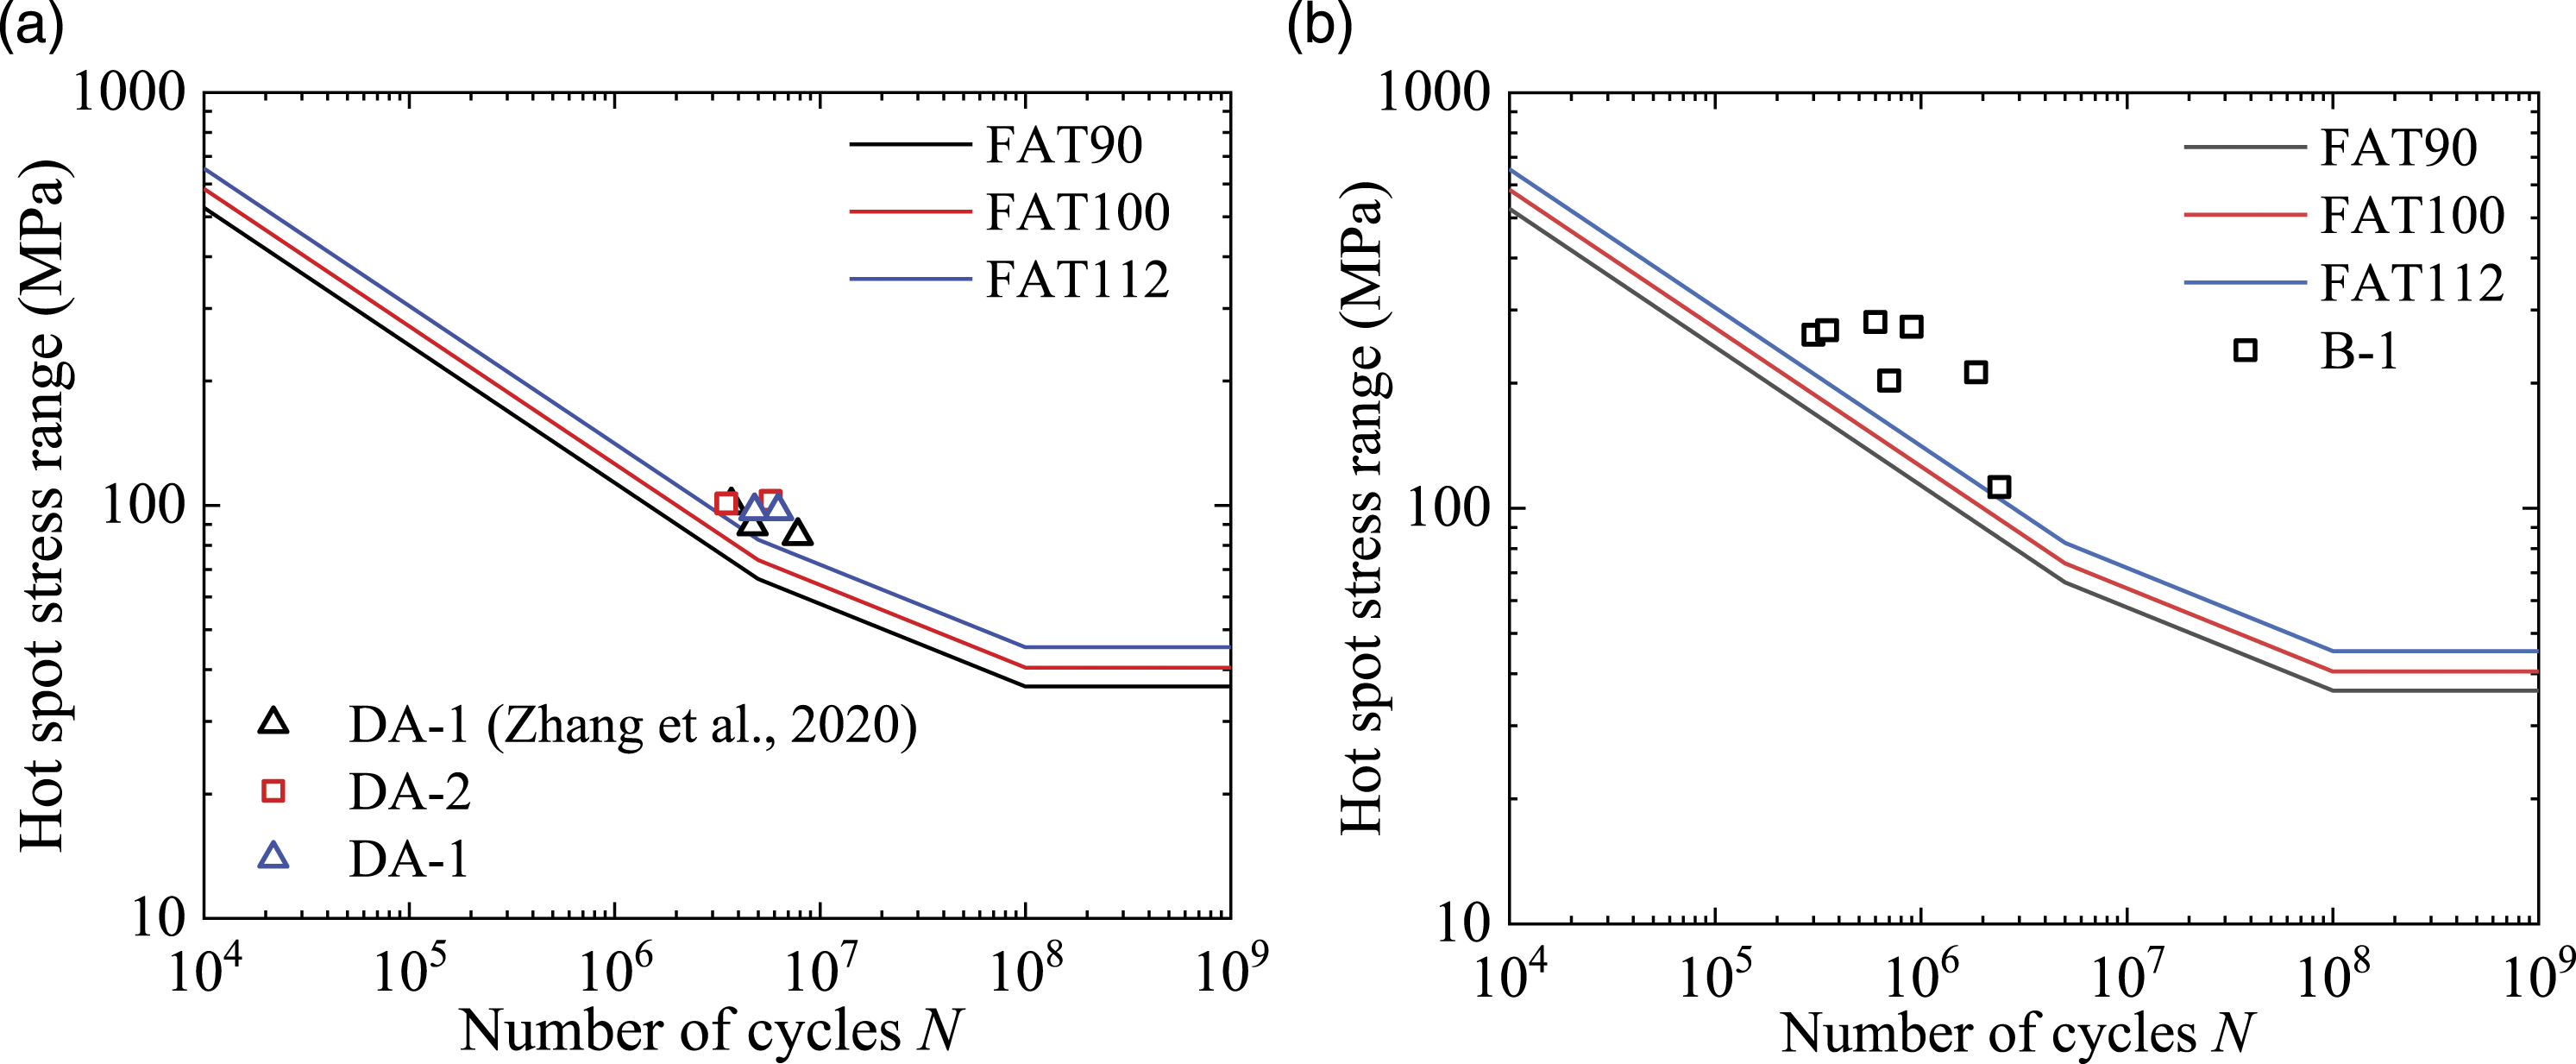
Figures 11 and 12 respectively compare the nominal and hot spot stress fatigue test data listed in Table 1 for each joint with the specific nominal and hot spot stress-cycle number (S-N) curves in Eurocode 3. Test data from previous research is also provided for the double-side welded R-DK (Zhang et al., 2020). The nominal stress fatigue strengths for crack modes DA-1 and DA-2 of the double-side welded R-DK joint were determined to be above the FAT90 limit; the corresponding hot spot stress fatigue strengths were determined to be above the FAT112 limit. As no distinguishing difference was observed between modes DA-1 and DA-2, the same fatigue strength was used for both. The nominal stress fatigue strengths for crack mode B-1 of the R-DP joint were widely scattered, with four data points below the FAT71 limit, which is specified as the minimum fatigue strength of such joints in Eurocode 3; however, all hot spot stress fatigue strengths for the R-DP joint were above the FAT112 limit. Nominal stress fatigue strengths and limits for the: (a) R-DK joint and (b) R-DP joint. Hot spot stress fatigue strengths and limits for the: (a) R-DK joint and (b) R-DP joint.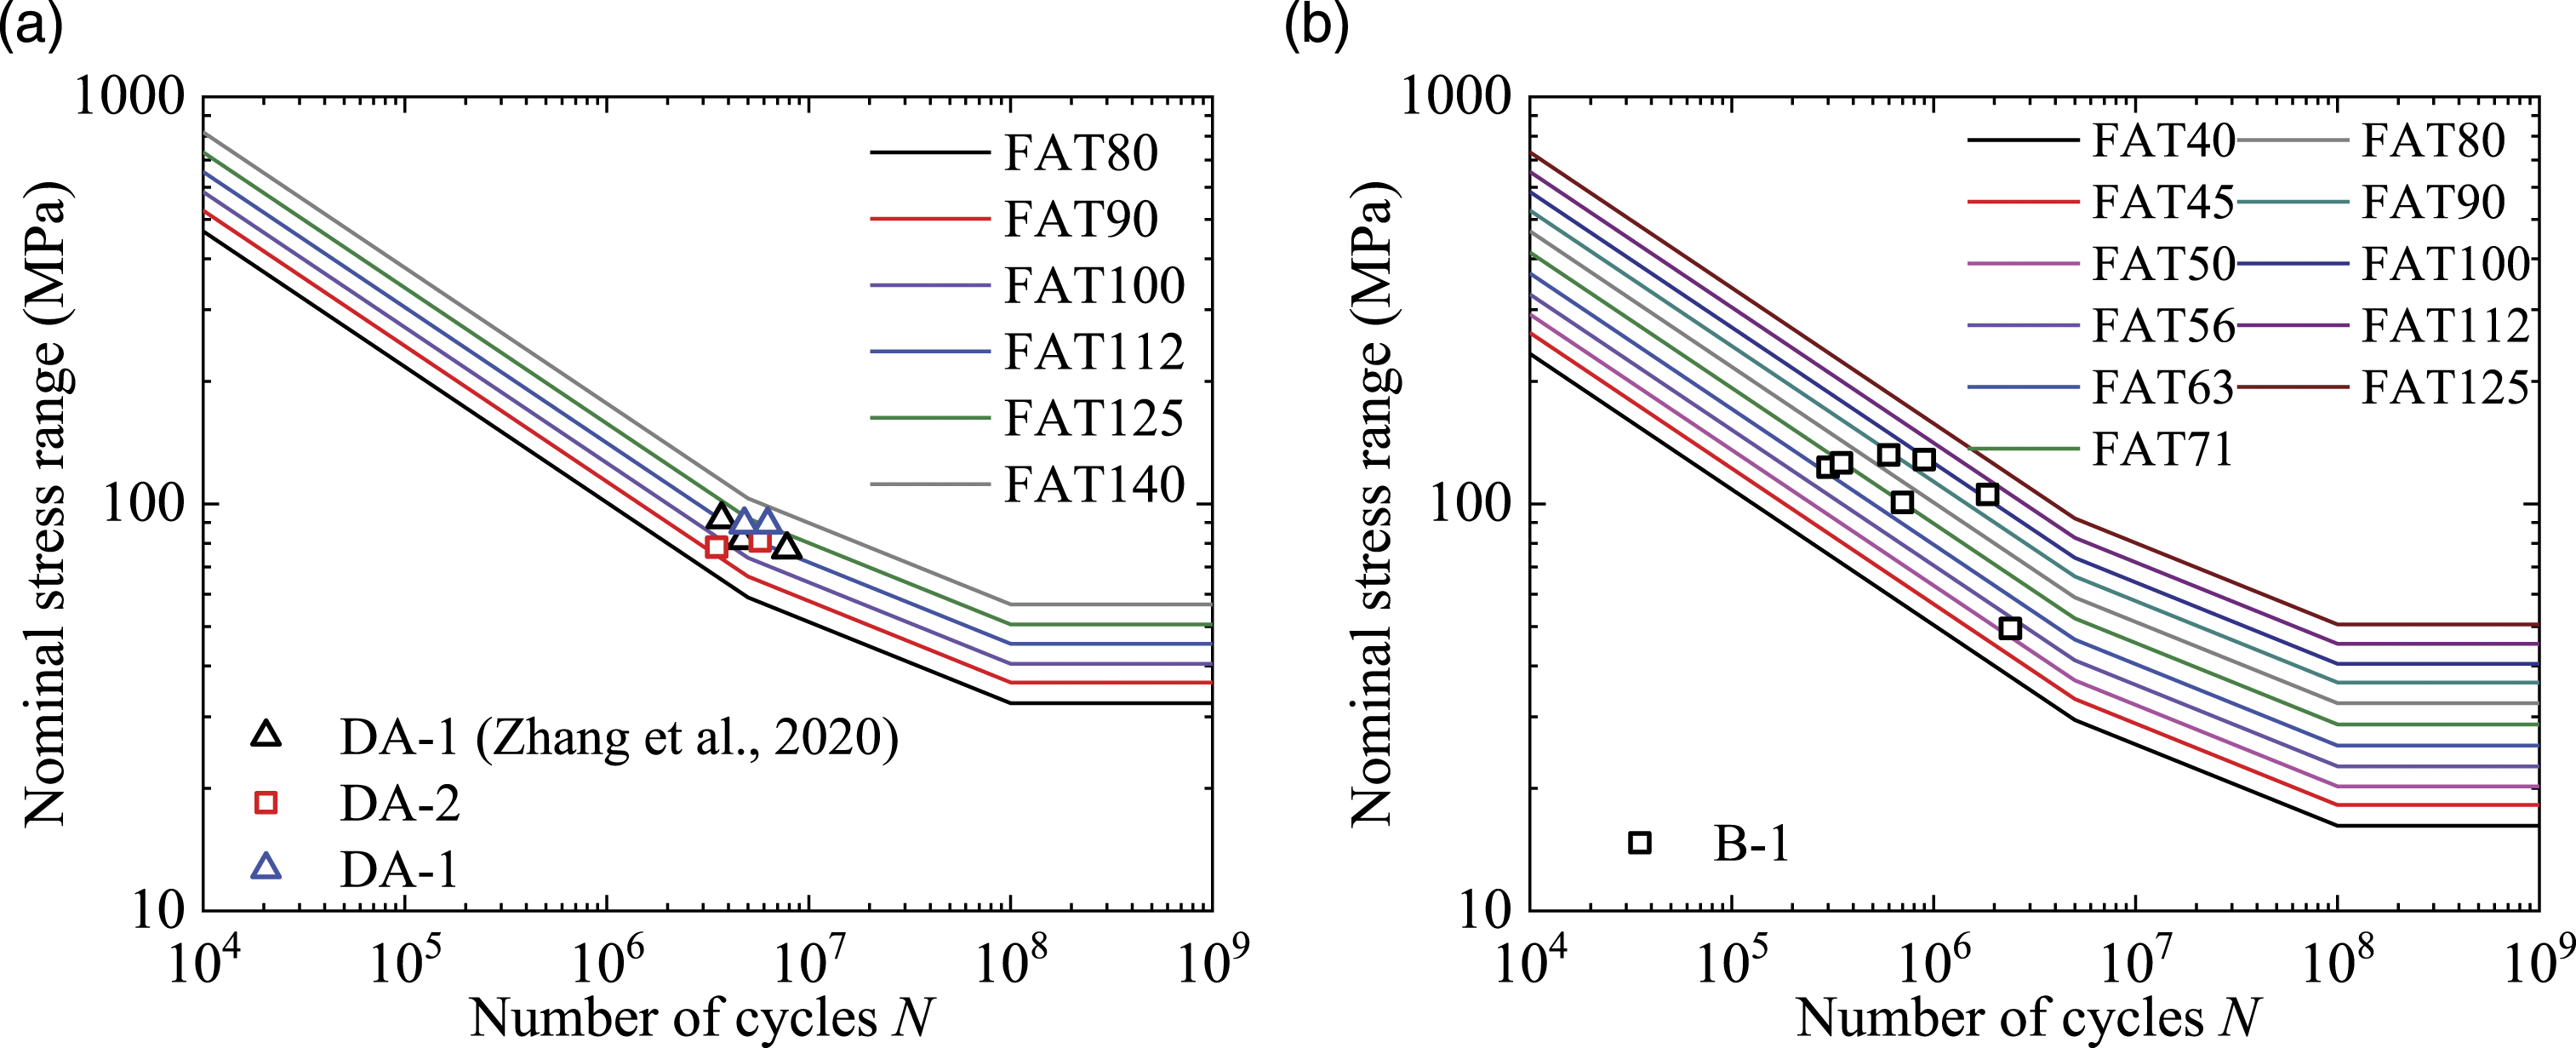
Fatigue strength typically evaluated using the S-N curve, which can be obtained by fitting the fatigue test data. The fatigue strength evaluation of the R-DK and R-DP joints in this study followed the recommendation in IIW (Hobbacher, 2016). The typical equation for the S-N curve is expressed as follows:
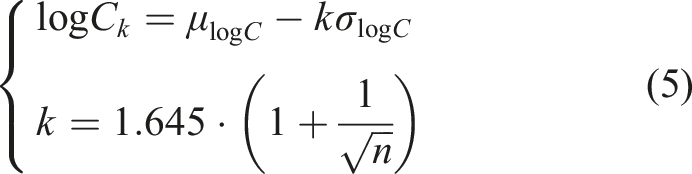
When test data is used to determine the appropriate fatigue design curve for a construction detail, the curve expressing a 95% probability of survival should be used to consider the SD of the test data. As the slope of the S-N curve was set to 3 in this study, the mean value (μlogC) and the SD (σlogC) of logC can be calculated as follows: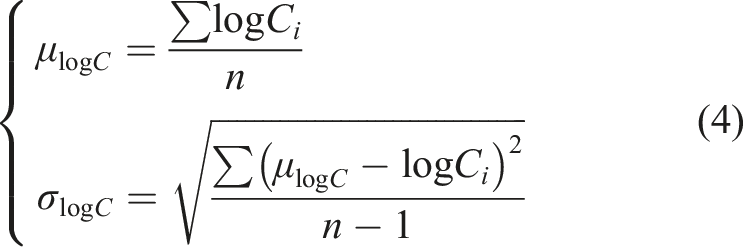
Regression values of the fitting constants logC of the S-N curves.

As reported in Table 2, the fitted nominal stress S-N curves of the R-DK and R-DP joints for a 95% survival probability were respectively obtained as follows

Similarly, the fitted hot spot stress S-N curves of the R-DK and R-DP joints for a 95% survival probability were respectively obtained as follows:

According to the S-N curves, the nominal stress fatigue strengths of the R-DK and R-DP joints in an OSD subjected to 2 million cycles with a 95% survival probability are 90.53 and 44.27 MPa, respectively; the hot spot stress fatigue strengths of the R-DK and R-DP joints under the same conditions are 108.95 and 98.66 MPa, respectively.
Identifying the dominant crack mode
Evaluation framework
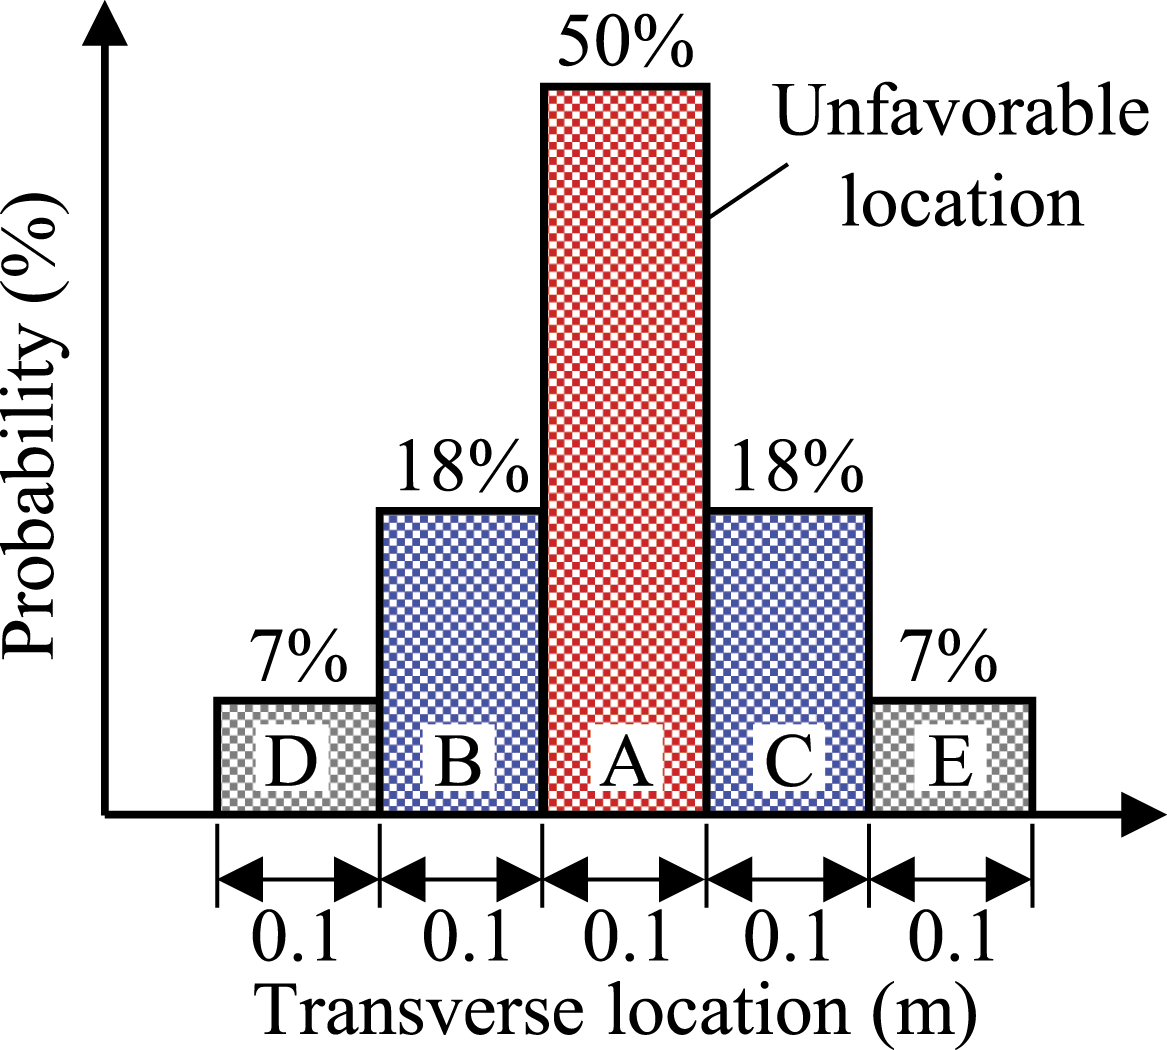
The key to identifying the dominant crack mode is to obtain the fatigue damage rate for each potential crack mode under the stochastic wheel load. Herein, the distribution of the stochastic wheel load in the transverse direction refers to the recommended frequency distribution of vehicle’s lateral location across the lane width, as shown in Figure 13 (EN 1991-2, 2003). The dominant crack mode evaluation framework was applied as follows: (1) Establish a segmental FEM model of the OSD system containing the potential crack modes. (2) Calculate the influence surface of the potential crack modes using the wheel loads for standard fatigue model 3 in Eurocode 1. (3) Find the transverse location with the largest stress amplitude in the influence surface and consider it as the most unfavorable location. Then, apply fatigue load model 3 to the influence surface according to the transverse locations presented in Figure 13. This results in five stress histories corresponding to different transverse loading locations. (4) Use the rain flow method to count the stress ranges and number of cycles and thereby calculate the equivalent fatigue damage according to the frequency of each transverse location, as expressed by: (5) Determine the dominant fatigue crack mode based on the calculated fatigue damage and the “short board theory.” Frequency distribution of vehicle lateral location along the lane width.


Evaluation of the dominant crack mode
Figure 14 shows the segmental FEM used for the influence surface calculations evaluating the R-DK and R-DP joints. This FEM contains seven U-ribs and three diaphragms measuring 6400 mm long, 4200 mm wide, and 700 mm high. The design parameters of the OSD system were otherwise the same as those shown in Figure 3, and the refined meshes of the R-DK and R-DP joints remained consistent with the meshes depicted in Figure 5. As shown in Figure 14, the edges of the segmental model were rigidly constrained to simulate the effect of the remaining deck system. The R-DK and R-DP joints on the right side of U-rib 5 were used to calculate the influence surface. Because the loading area only covered part of the influence surface, the remaining influence surface was obtained by mirror symmetry. Segmental FEM of the orthotropic steel deck system for influence surface calculation (unit: mm).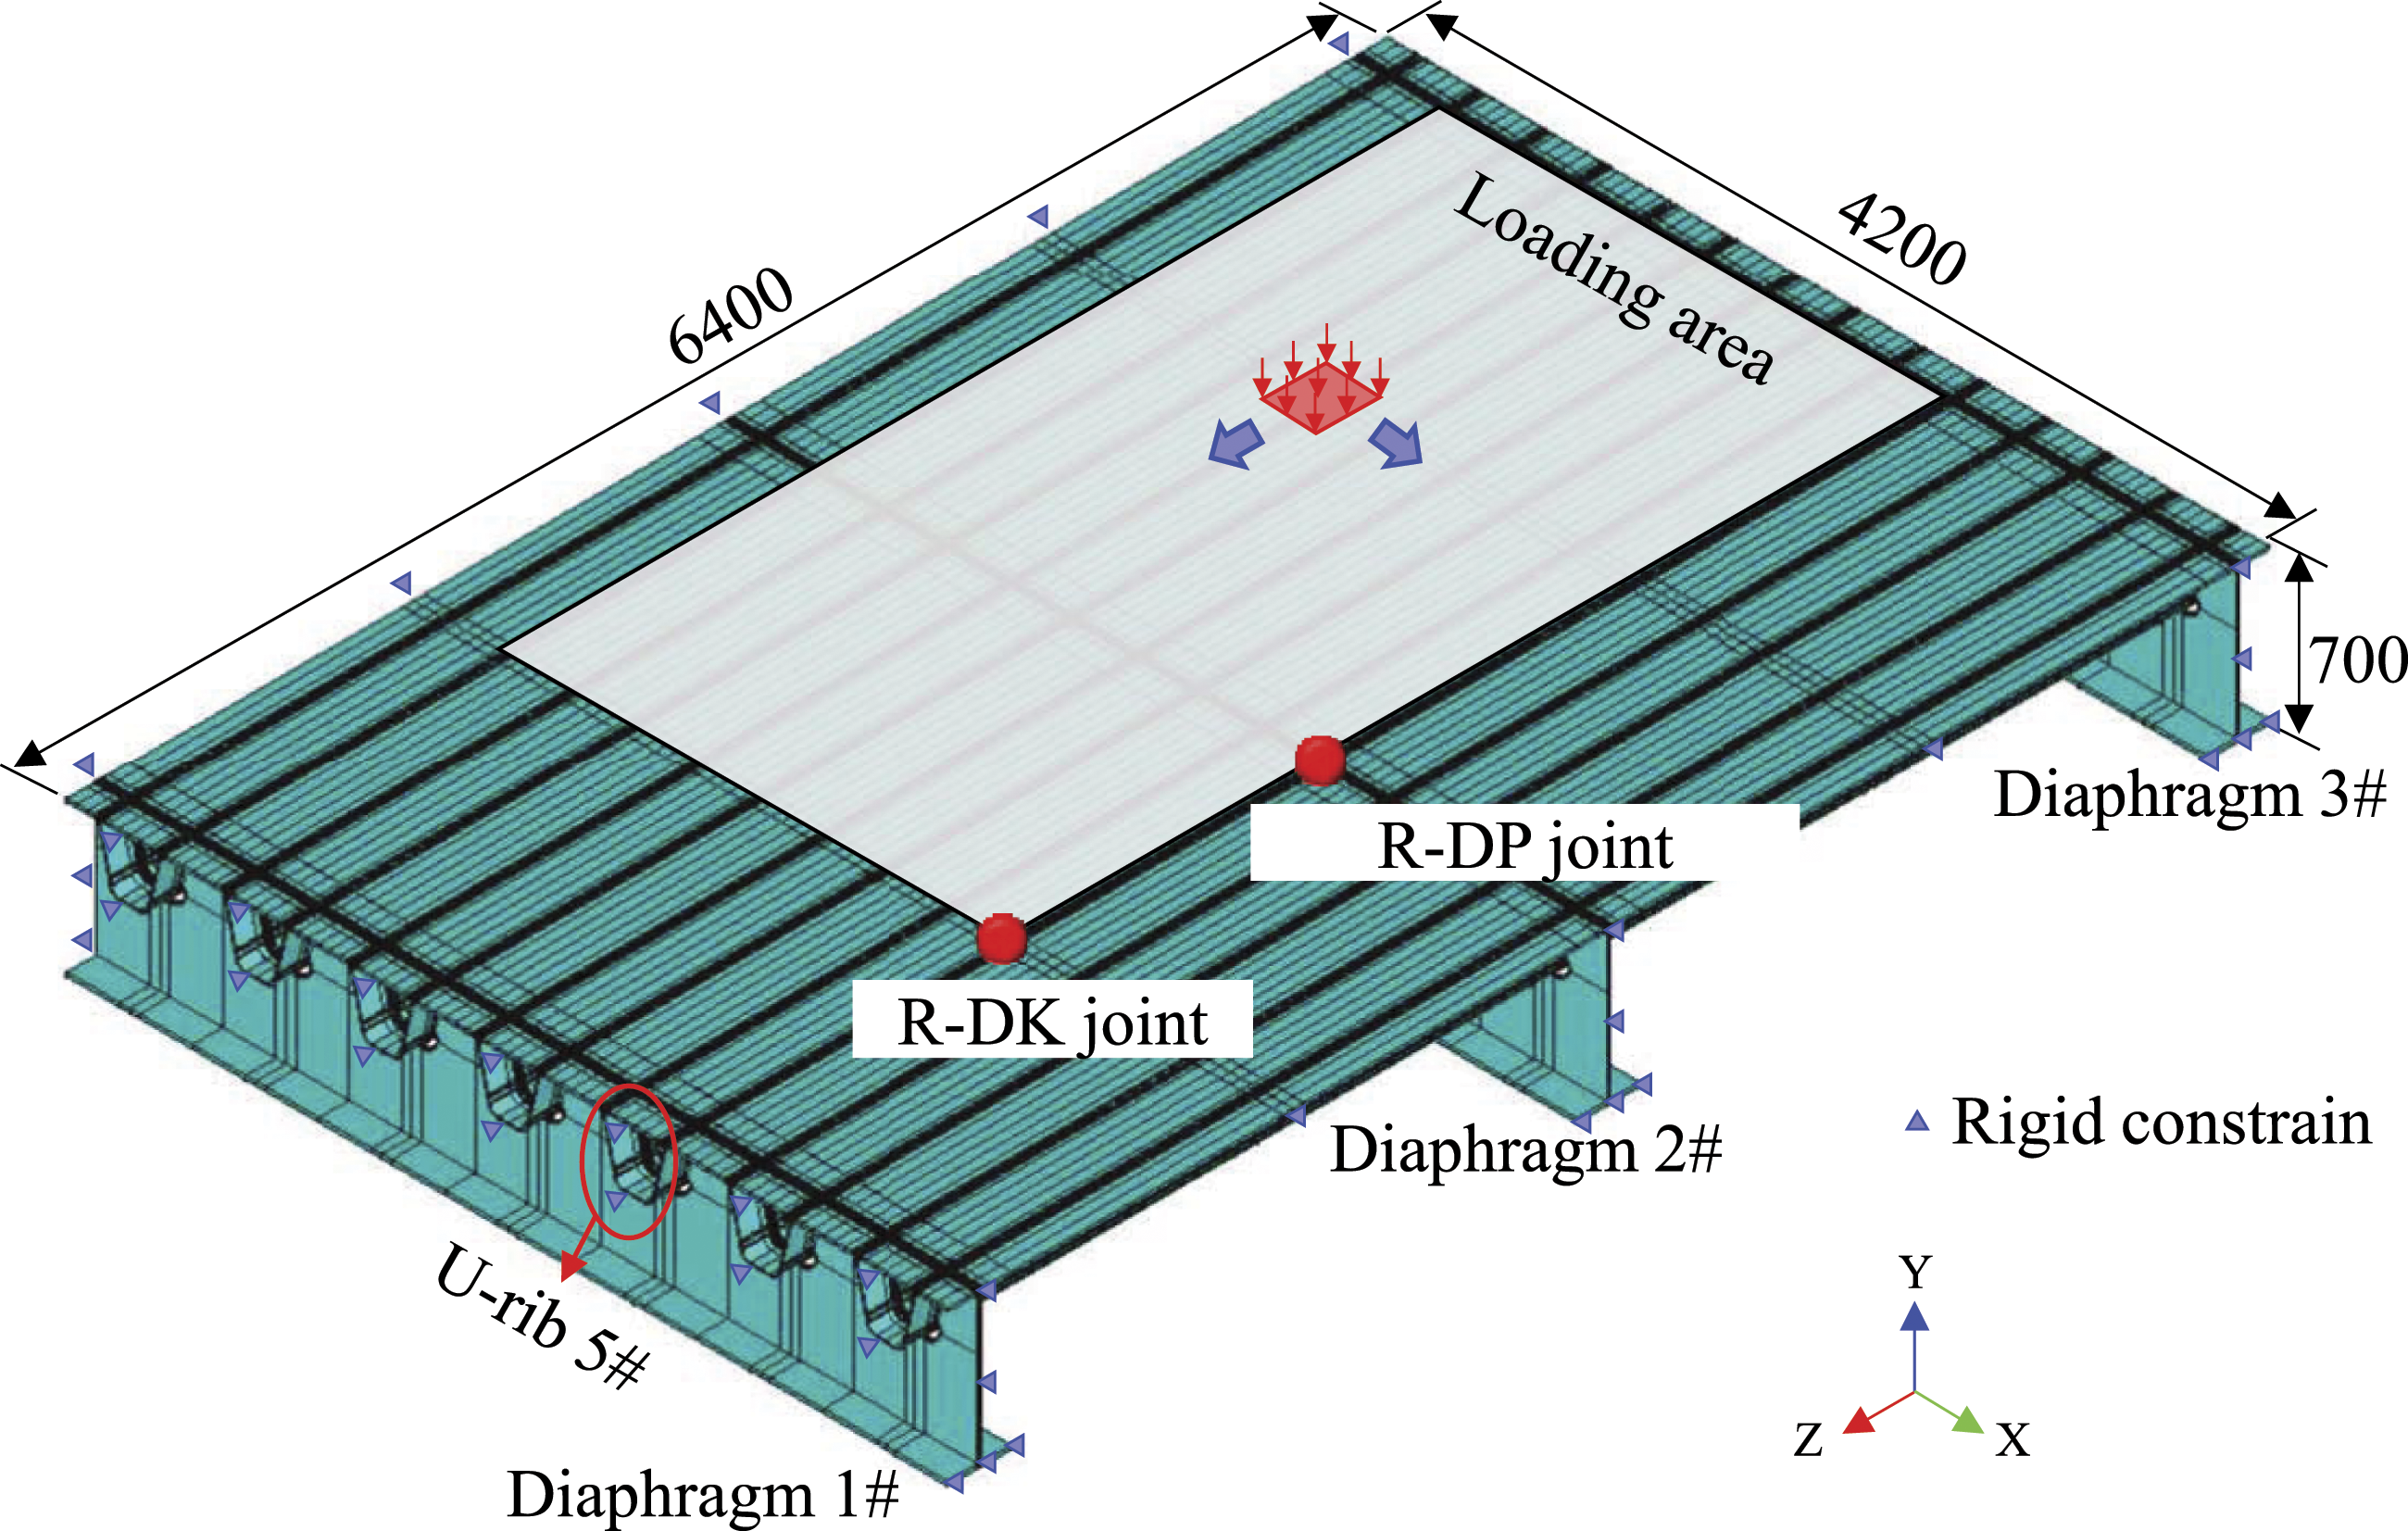
The hot spot stress method was adopted herein to evaluate the fatigue damage corresponding to potential crack modes. Crack modes B-2 and B-3 were not considered as they have rarely been reported recently owing to the increasing application of thicker diaphragms and polished cope holes. Figure 15 shows the hot spot stress influence surfaces for crack modes DA-1, DA-2, DA-3, and B-1. The stress influence areas for the three crack modes of the R-DK joint are concentrated within 1 m of the joint. Although the influence area for crack mode B-1 in the R-DP joint is also concentrated in the transverse (X) direction, it is sensitive to the location of the wheel load between adjacent diaphragms in the longitudinal (Y) direction. As the wheel load center distance of the Eurocode 1 standard fatigue model 3 is 2 m, the superposition effect in the transverse direction of the wheel load was ignored when calculating the stress history. For crack modes DA-1, DA-2, and B-1, the unfavorable location was found to exist directly above the joint between the deck/diaphragm and relevant U-rib wall; however, it was 200 mm away from the joint for crack mode DA-3. Based on the unfavorable location and the influence surface of each crack mode, the stress history was calculated according to Figure 13, and the results are shown in Figure 16. Each wheel axle location produced one major stress cycle for crack modes DA-1, DA-2, and DA-3, whereas one wheel axle location produced one major stress cycle for crack mode B-1, which is related to the range of the influence surface. In addition, the major stress range for crack mode B-1 in the R-DP joint was significantly larger than those for the crack modes in the R-DK joint. Hot spot stress influence surfaces for potential crack modes: (a) DA-1, (b) DA-2, (c) DA-3, and (d) B-1. Hot spot stress histories for potential crack modes: (a) DA-1, (b) DA-2, (c) DA-3, and (d) B-1.

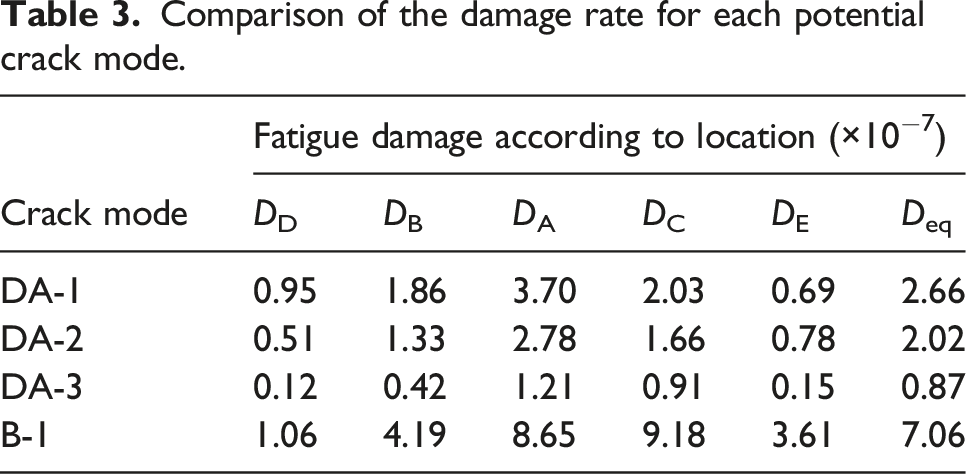
Comparison of the damage rate for each potential crack mode.
Conclusions
This study experimentally and numerically investigated the fatigue resistance of an OSD system with double-side welded R-DK and conventional R-DP joints. The following conclusions can be drawn from the results: • The inner weld toe-deck crack (DA-1) and outer weld toe-deck crack (DA-2) of a double-side welded R-DK joint exhibited similar fatigue strengths; therefore, the same S-N curve is recommended for fatigue verification. The nominal and hot spot stress fatigue strengths for the 95% survival probability of a double-side welded R-DK joint were determined to be 90.53 MPa and 108.95 MPa, respectively. • Considerable stress gradient was observed around the lower end weld of the R-DP joint, and the fatigue strengths for fatigue crack mode B-1 were widely scattered. The nominal and hot spot stress fatigue strengths for the 95% survival probability of fatigue crack mode B-1 were determined to be 44.27 MPa and 98.66 MPa, respectively. It is recommended to evaluate the fatigue strength of weld toe-rib wall crack in R-DP joint using hot spot stress method. • For the OSD system considered in this study, the dominant fatigue failure mode of the R-DP joint was determined to be the weld toe-rib wall crack (B-1), whereas that of the double-side welded R-DK joint was determined to be the inner weld toe-deck crack (DA-1). • The use of a double-side welded R-DK joint can improve the fatigue resistance of an OSD system to a certain extent; however, the fatigue strength of the R-DP joint must be increased to further improve the fatigue resistance of the system.
Footnotes
Acknowledgments
The authors would like to thank the Poly Changda Engineering Co., LTD for financial support of this study.
Declaration of conflicting interests
The author(s) declared no potential conflicts of interest with respect to the research, authorship, and/or publication of this article.
Funding
The author(s) received no financial support for the research, authorship, and/or publication of this article.