
Abstract
To improve the bending performance of long-span bamboo scrimber beams, a new method of prepressing-cold pressing-hot forming was used to produce steel-reinforced bamboo scrimber composite beams. For steel-RBSC beams, four-point bending experiments were performed to study the failure mode, bending performance, load-displacement relationships, and strain history curves of composite beams. Based on cohesive zone model theory, finite element models of steel-RBSC beams were established and the bonding stress of the adhesive layer in steel-RBSC beams revealed. The results indicated that the failure mode of composite beams was fracture failure of the bamboo scrimber at the bottom between the loading rollers. Steel reinforcement had a significant effect on the strength and stiffness of bamboo scrimber beams. The maximum static stiffness of composite beams was increased by 70.15%, compared with that of bamboo scrimber beams. The load-displacement curves, mechanical properties, and section strains predicted by finite element models were consistent with the test results, verifying that these finite element models were correct. The main influence factors for the peeling of the adhesive layer were normal stress, shear stress, and mixed stress in the areas of pure bending section, bending-shear section, and loading roll area, respectively.
Keywords
Introduction
Bamboo has been extensively applied in composite industries because it is a fast-growing type of material that has high specific strength and specific rigidity. Ready for harvest in 3–5 years, it could regenerate after being cut and degrades well after being discarded (Yu, 2019; Fang et al., 2018; Li et al., 2018). However, it was restricted for the use of construction material mainly because of its small diameter, hollow walls, and easy cracking. To overcome these constraints, bamboo scrimber and laminated bamboo were typical composite products based bamboo fiber (Li et al., 2018; Huang et al. 2016a, 2016b; Xiao et al., 2014; Gottron et al., 2014). However, the strength and stiffness of bamboo scrimber were less than those of traditional steel bars, concrete and other materials, so it is difficult to meet the requirements of large-span structures (Huang et al., 2015; A G M R et al., 2015; Zheng et al. 2017; Glisovic, et al., 2015). Therefore, potential strengthening technology for enhancing the stiffness and strength of bamboo scrimber should be explored.
There had been various strengthening techniques described in previous studies for wood and bamboo structures strengthened with steel and fiber-reinforced polymer (FRP), in a section or on a section surface. FRP was usually bonded on the surface of wood and bamboo structures. In FRP-reinforced bamboo, Wei et al. (2017, 2014, 2015, 2015) studied bamboo scrimber beams strengthened by FRP composite sheets, which were bonded onto a bamboo beam with epoxy resin adhesive. The flexural rigidity of the product was increased between 16.4% and 40.3% at the deflection of L/300. Zhou Aiping (2017) pasted 1–2 layers of carbon FRP (CFRP) cloth on the surface of bamboo scrimber beams, which were then subjected to a four-point bending test. The results indicated that when stress in the compression zone was less than the compressive ratio limit, showing the load-displacement curve as a completely linear relationship. After exceeding the proportional limit, the load-displacement curve changed from a linear relationship to a nonlinear relationship. Pasting two-layer CFRP could increase the ultimate load-carrying capacity by 27%. Nadir et al.(2016) discussed the flexural properties of laminated wood beams that were strengthened with CFRP and glass FRP (GFRP) composite sheets. The results showed that the flexural strength and stiffness of FRP-wood composite beams were significantly increased.
The elastic modulus of FRP is smaller than that of steel, and bonding steel more effective in improving stiffness. The steel can be bonded in or on wood and bamboo. Luca and Marano (2012) investigated the flexural behavior of reinforced-prestressed glue-laminated timber beams with steel bars. Li et al. (2015) studied the bending resistance of I-section bamboo-steel composite beams consisting of two pieces of cold-formed thin-walled steel channel and three pieces of bamboo plywood laths. It was pointed out that adhesive stripping was a failure mode of composite beams. Zhong et al. (2017) studied the flexural performance of reinforced bamboo scrimber composite (RBSC) beams. The reinforcements were steel bars wrapped in a 2–3 mm thick linen, paved along the grain direction of the bamboo scrimber, and the composite beam was made by primary hot pressing. The results indicated that both the ultimate load capacities and bending stiffness of RBSC beams could be significantly improved, with a maximum increase of 58% and 82%, respectively. However, the fabrication process of the beam was complicated.
From the above literature, bonding steel and FRP could effectively improve the rigidity and strength of bamboo (wood) structures. There were many studies on FRP-reinforced bamboo structures in the existing literature, but few studies on steel-reinforced bamboo structures. The reasons were that the adhesive layer between steel and bamboo was easy to peel off and there was no simple and reliable method for fabricating steel-reinforced composite bamboo beams. In the present study, a newly designed steel-RBSC beam made by prepressing-cold pressing-hot forming method was developed. Four-point bending experiments were used to evaluate the beam flexural performance, a finite element model of these beams was established based on the theory of the cohesion zone model, and the bonding stress of composite beams was studied.
Experimental section
Materials
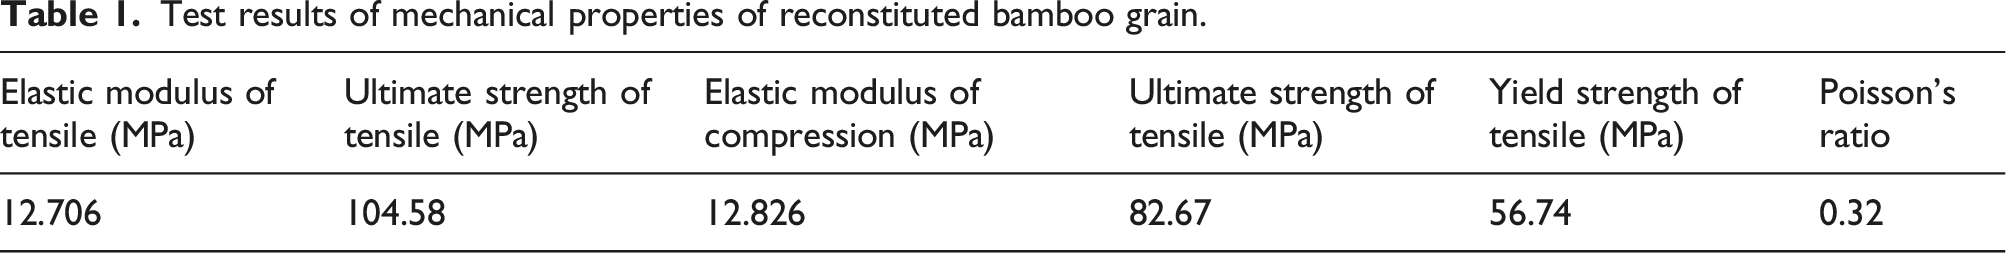
The bamboo scrimber was manufactured from Moso bamboo (Phyllostachys pubescens), which was harvested from Jiangxi province, in the south part of China, and aged 3–5 years. The impregnated adhesive was the water-soluble phenolic resin adhesive from Guangdong Taier Co., Ltd. By following the Chinese national standards of GB/T 1935–2009 “test method for compressive strength of wood along the grain”(2009), GB/T1577-2017 “determination method for compressive elastic modulus of wood along the grain”(2017), GB/T1938-2009 “test method for tensile strength of wood along the grain” (2009) and JG/T199-2007 “test method for physical and mechanical properties of bamboo for construction” (2007), we made the specimens of bamboo scrimber with along-grain tensile strength and elastic modulus, specimens with along-grain compressive strength, and specimens with along-grain compressive elastic modulus. The number of each group was 5, and the tensile and compressive stress-strain curve of the bamboo scrimber along the grain was shown in Figure 1 and Table 1. The tensile and compressive stress-strain curve of the bamboo scrimber along the grain. Test results of mechanical properties of reconstituted bamboo grain.
Specimen preparation
Specimens were prepared in accordance to Chinese national standards, GB/T 50329-2012 “Test methods for wood structures” (2012), with dimensions of 1900 × 100 × 100 mm, where the length was measured along the grain. The section shape of a specimen is shown in Figure 2. Section shape of a specimen: 1 represented bamboo scrimber, 2 represented steel bar, and 3 represented steel plate.
The details of the specimens.

1900 × 4 was length × diameter, 1900 × 50 × 2 was length × wide × thick.
Steel-RBSC beams were made by a new method of prepressing-cold pressing-hot forming (Figure 3). The method involved the following steps: (a) Bamboo bundle retreatment. Bamboo was processed by mechanical rolling, drying, dipping, and redrying, to obtain a pretreated bamboo bundle. (b) Steel pretreatment. The steel was polished with 120 grit sandpaper to remove the oxide layer and pollutants on the steel surface. The steel was then arranged as required and a steel plate welded to the steel ends. The steel surface was scrubbed with alcohol to remove grease and contaminants, immersed in phenolic resin for 20–30 s, and dried at 40–60°C for 30–60 min. (c) Prepressing bamboo bundles. According to the center position of the steel, the composite beam was divided into upper and lower parts, with the lower part of the bamboo bundle placed in the mold and prepressed at 30–40 MPa, with the bamboo bundle now compacted and flat on the surface. (d) Laying the steel. Pretreated steel was laid on the prepressed bamboo bundles according to the location requirements. (e) Cold forming. The upper part of the bamboo bundle was placed into the mold, pressed at 30–40 MPa, and the mold locked with pins. (f) Thermal curing. Put The mold was placed in a tunnel kiln for high temperature curing at 125–160°C for 8–16 h. After curing, specimens were cooled to 10–30°C for 20–36 h. Bamboo scrimber beam specimens were made by the same process and the finished product had a density of 1.15 t/m3. The production process of steel-RBSC beams: (a) bamboo bundle retreatment, (b) steel pretreatment, (c) prepressing bamboo bundles, (d) laying the steel, (e) cold forming, (f) thermal curing.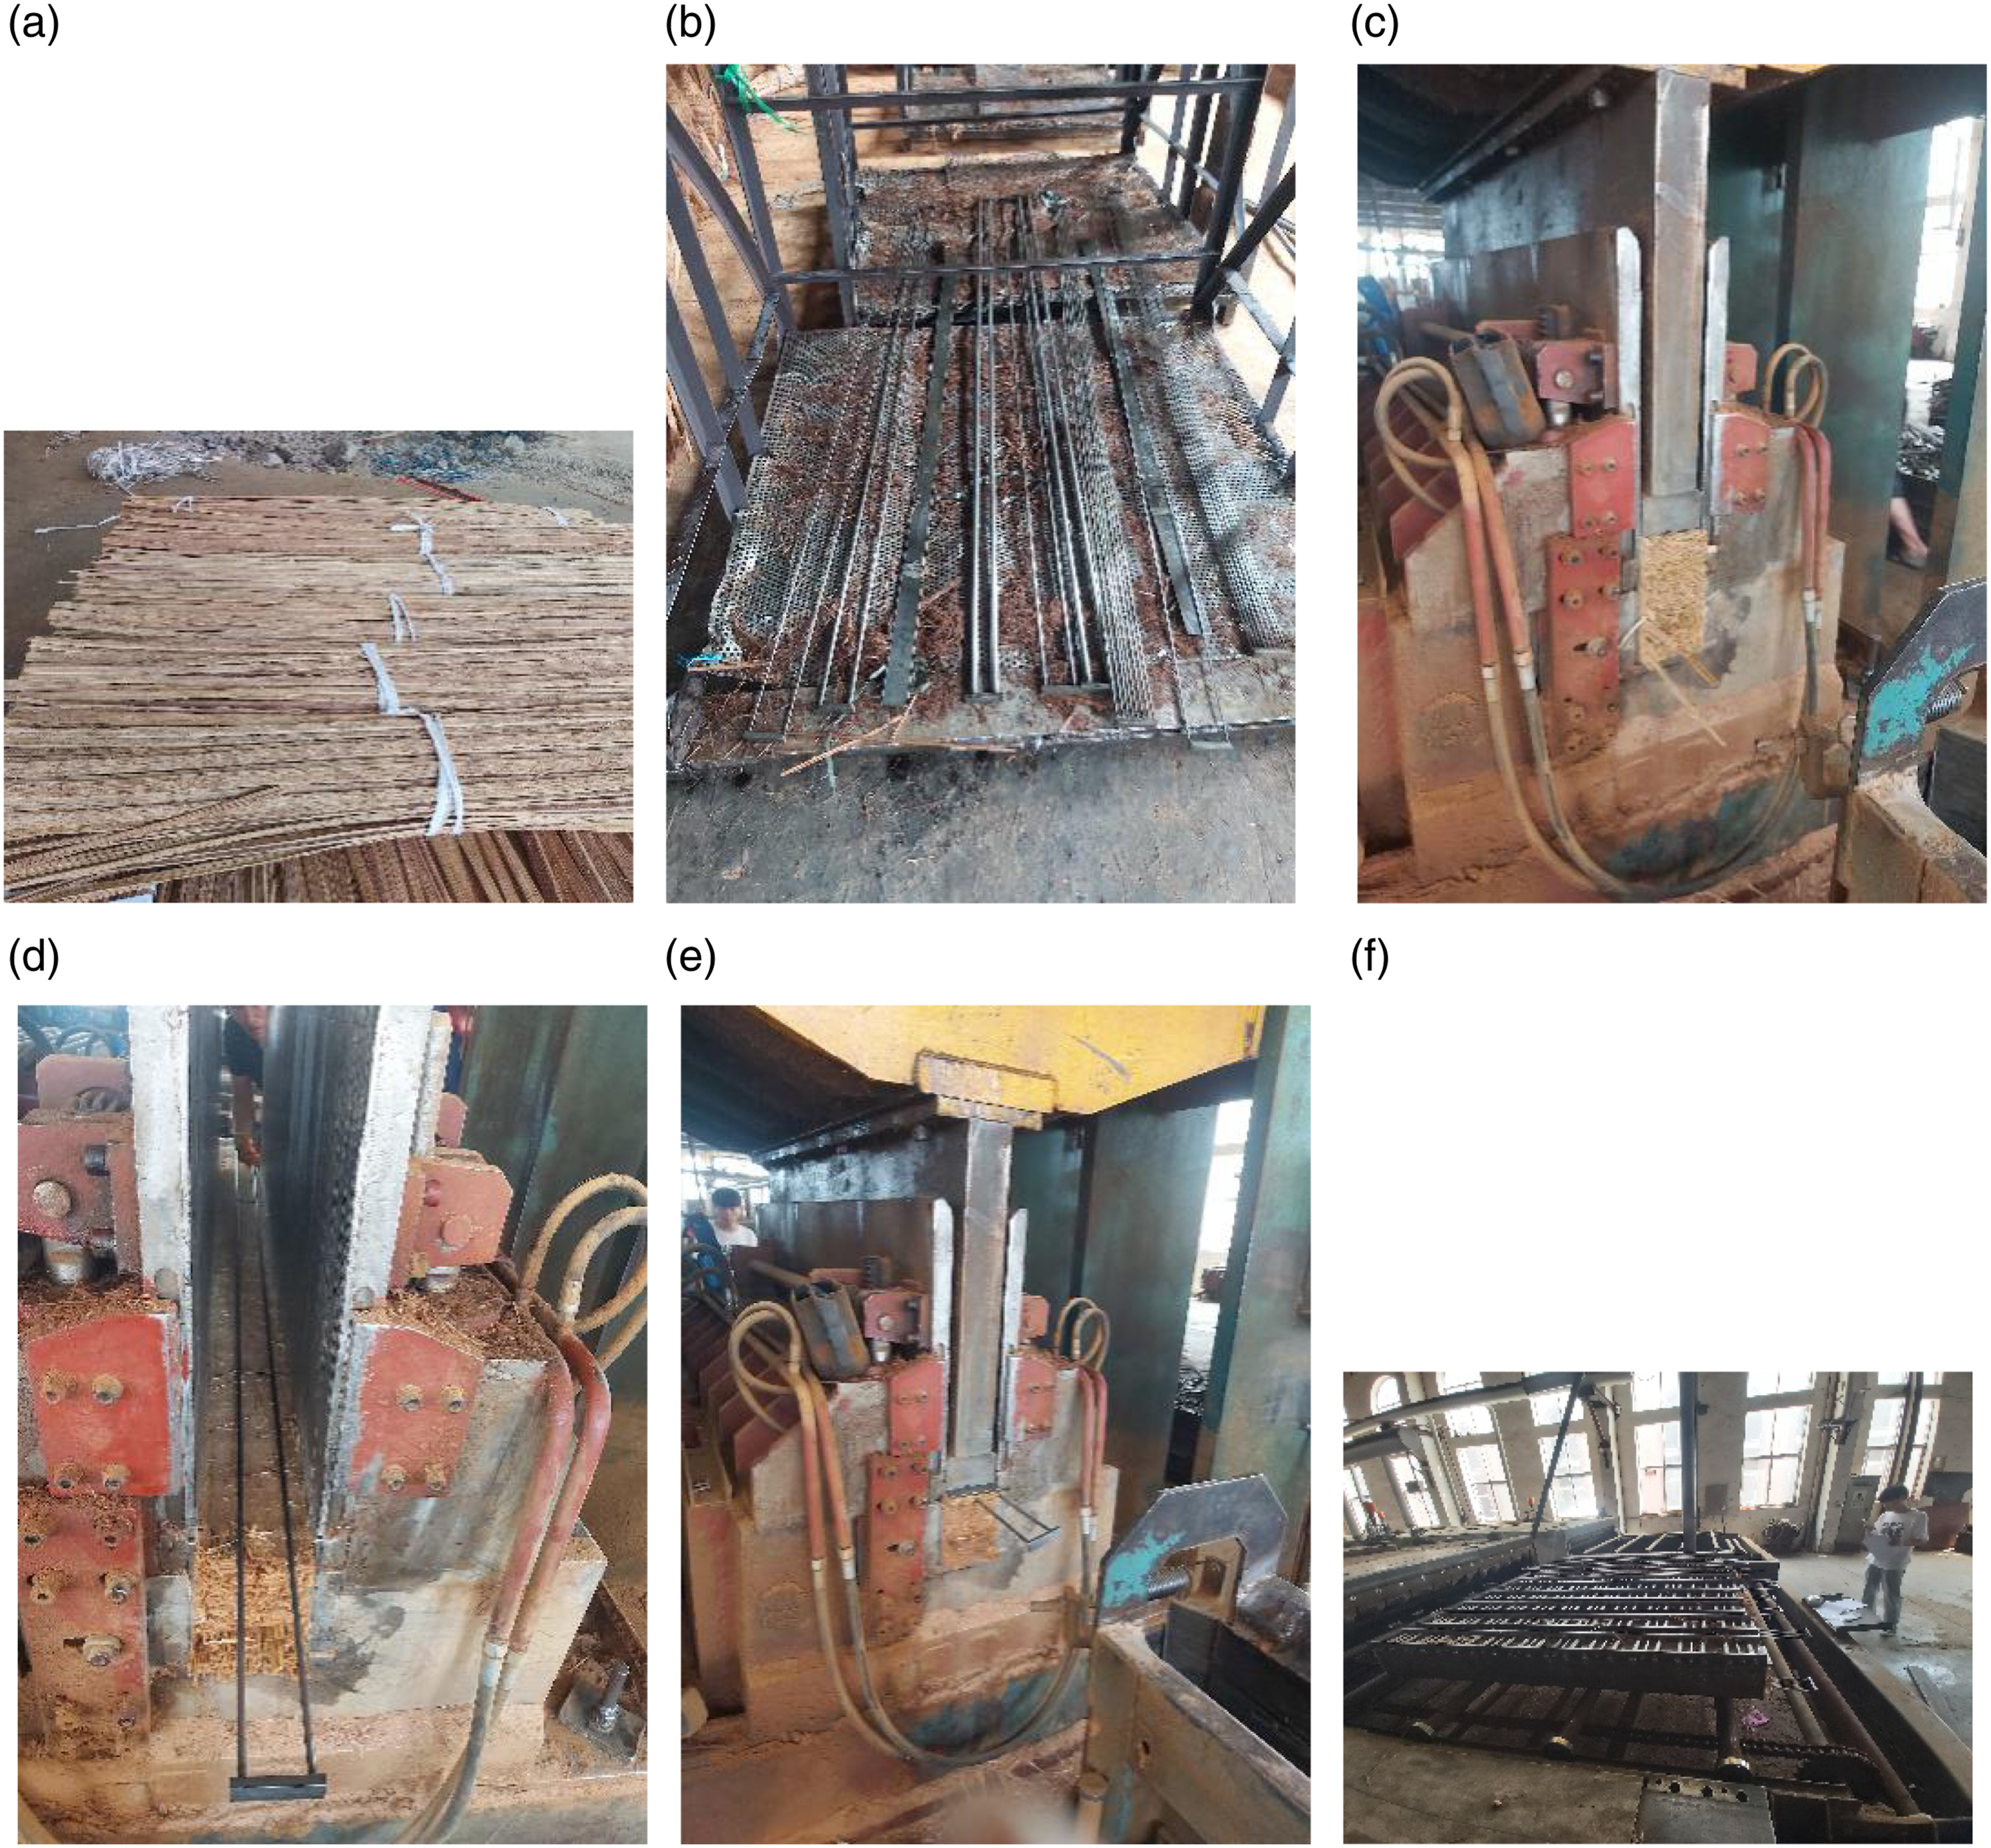
Flexural test
A four-point bending test was adopted in accordance with Chinese national standard GB/T 50,329-2012 “Test methods for wood structures”(Figure 4). One end of the support roller was a fixed cylinder, which freely rotated, and the other end of the support roller was a movable cylinder, which freely rotated and moveable. A similar device was also used for the loading roller. The distance between the two supporting points was 1700 mm, the distance between the two loading rollers 566.7 mm, and they were all located the center of symmetry. A manual hydraulic cylinder was used for loading, with a maximum axial load of 100 kN. A pressure sensor with a range 100 kN was used to measure the cylinder force. The laser displacement sensor of HG-C1030 (Panasonic Co., Newark, NJ, USA) was used to measure the displacement of the beam at mid-span, with a measuring range of 160 mm and an accuracy of 0.2 mm. Four-point bending test of steel- RBSC beams: (a) schematic drawing, (b) photo.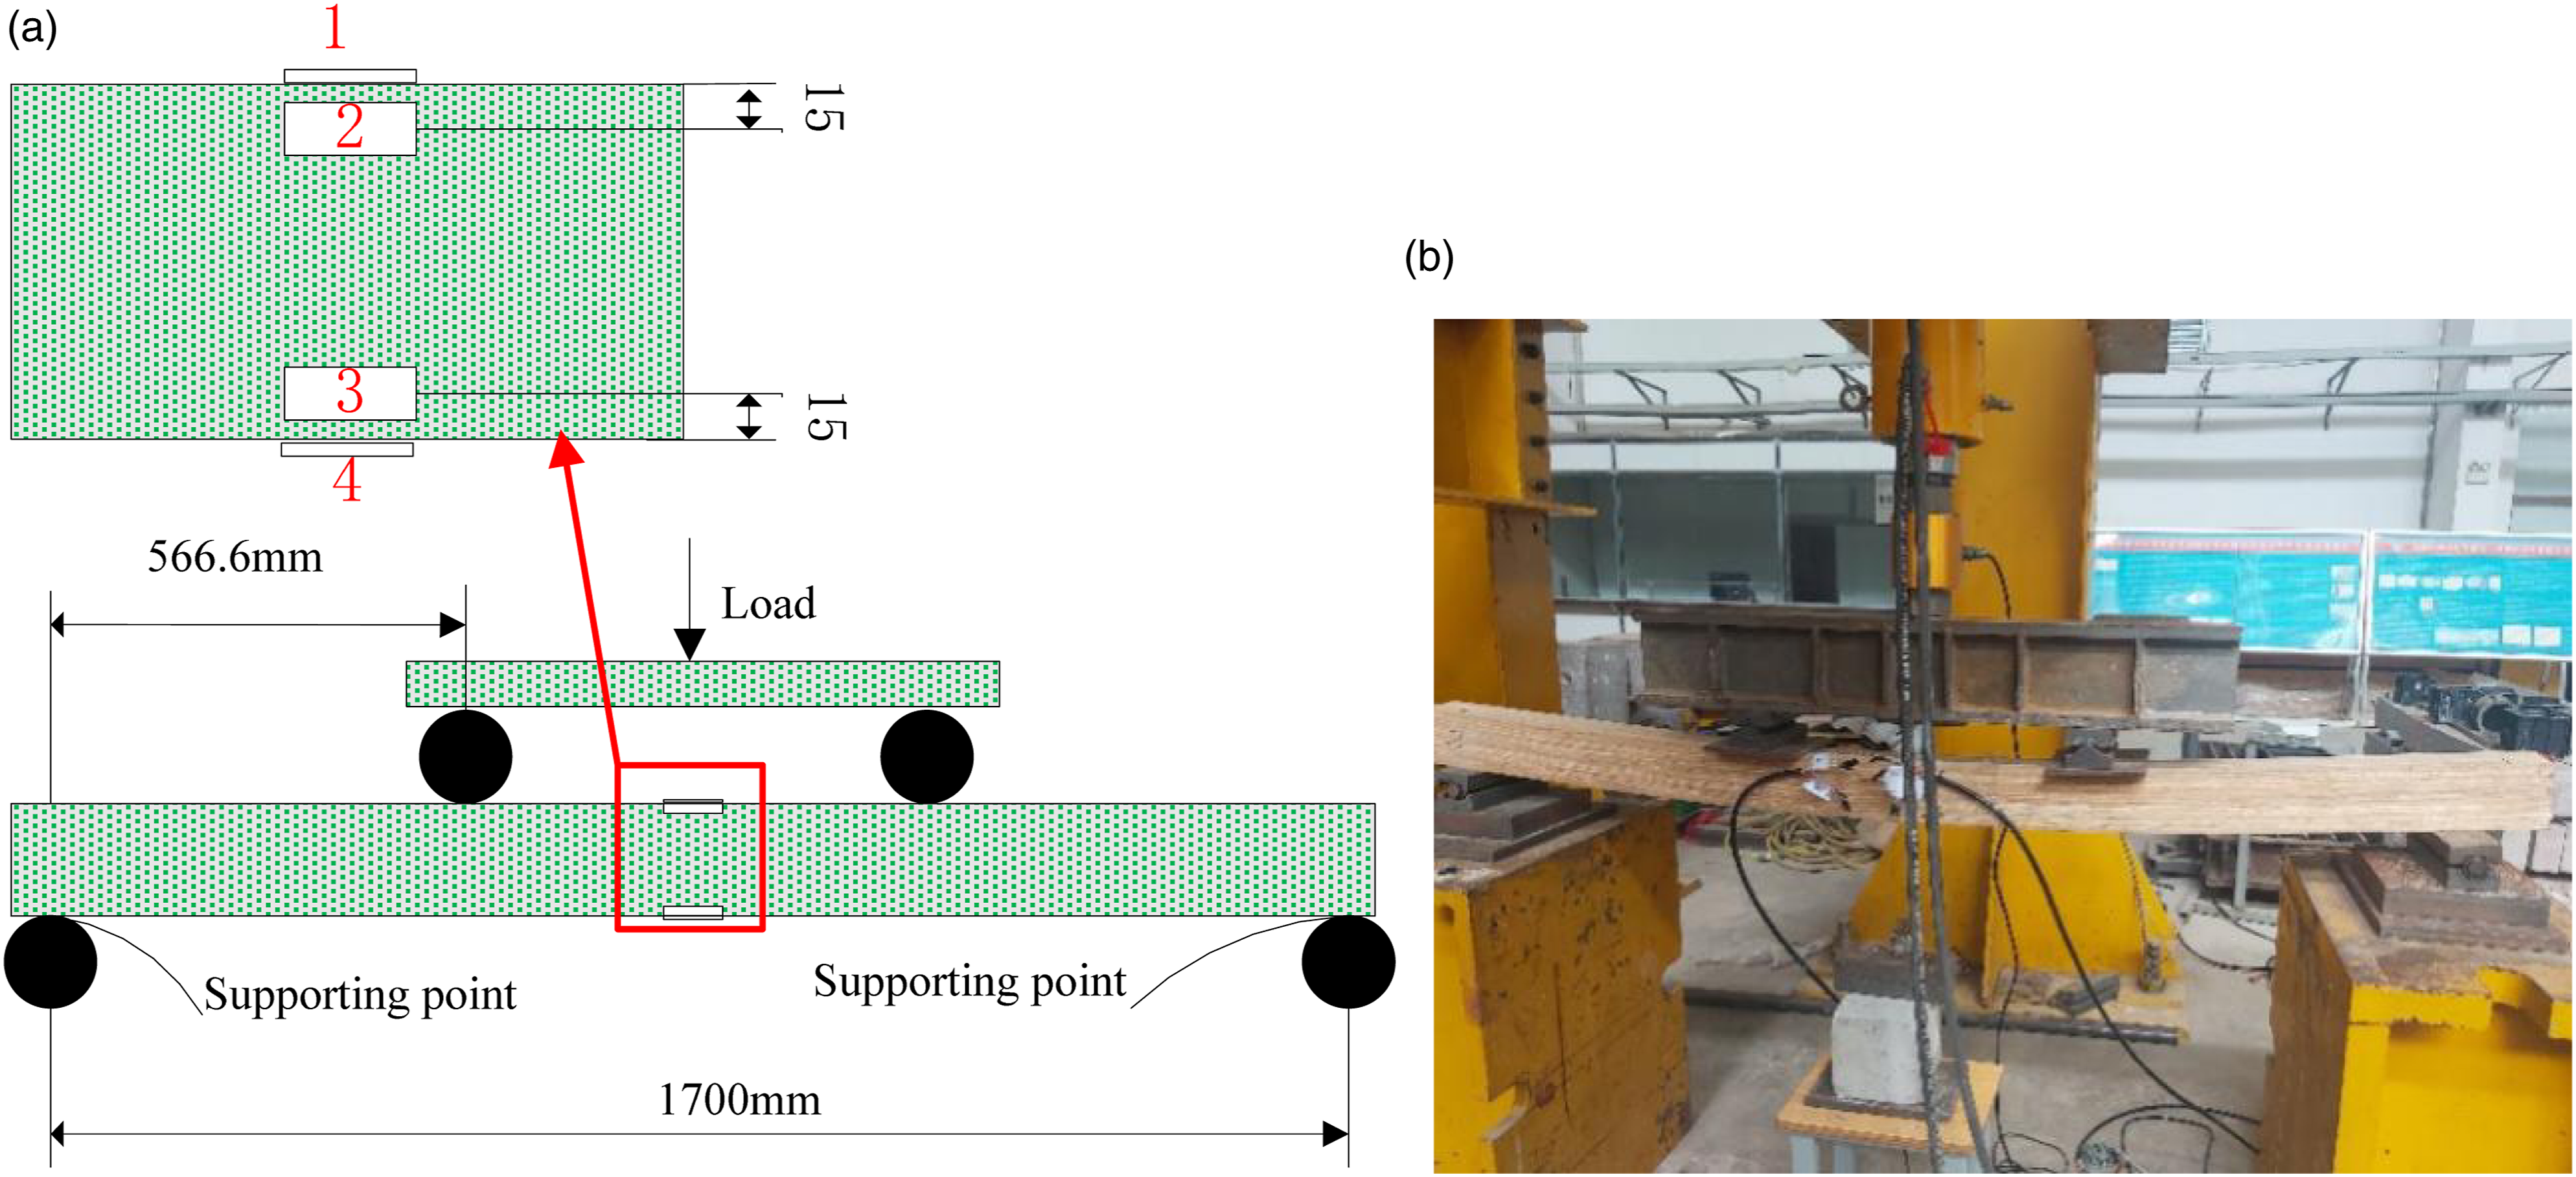
In a test, the static flexural strength was calculated using equation (1) (MPa), expressed as
The static flexural modulus was calculated using equation (2) (MPa), expressed as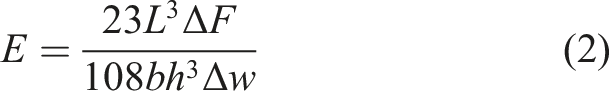
To monitor the strain trend during deformation, strain gauges were attached (Figure 4). The mid-span gauge position at the top was recorded as Point 1, mid-span position at 15 mmm from the top surface Point 2, mid-span position at 15 mm from the bottom surface Point 3, mid-span position at the bottom Point 4, and all strain gauges arranged longitudinally. The strain gauges were BE120-3AA units ( AVIC Electric Instrument Co., Ltd., Xi’an, China)with a sensitive grid length of 3 mm and nominal resistance of 120 Ω. Α 9235 dynamic module (NI, Austin, TX, USA) was also used to collect strain data.
Test results and discussion
Failure modes
The failure modes of specimens are shown in Figure 5, with specimen S0-1 representing the bamboo scrimber beams and SR8-1 the composite beams. From the ventral surface of the specimen, both specimen types broke at the bottom of the reassembled bamboo between the loading rollers and extended to the end along the longitudinal direction, without penetrating cracks in the vertical direction. From the bottom specimen surface, there were clear irregular cracks in the two specimens, some penetrating the entire specimen laterally, while some did not penetrate. There was no visible local bending or breakage at the specimen top and no visible slippage between the steel and bamboo scrimber at the ends. In the experimental process, all specimens occasionally produced small noises during the loading process, with no visible damage found with the naked eye. Finally, there was a sudden loud noise, the load dropped rapidly, the mid-span displacement increased rapidly, and the beam bottom damaged. As there were no loud noises during the test of composite beams and no visible slippage between the steel and bamboo scrimber at the ends until damage occurred, it was inferred that the adhesive layer of the composite beam between the steel and bamboo scrimber had not peeled off in a large area. In short, all specimens had the same failure mode and the bottom bamboo scrimber damaged by the bending load, which is similar to Zhong et al.’s (2017) paper. The failure modes of specimens: (a) S0-1 ventral surface, (b) SR8-1 ventral surface, (c) S0-1 bottom surface, (d) SR8-1 bottom surface.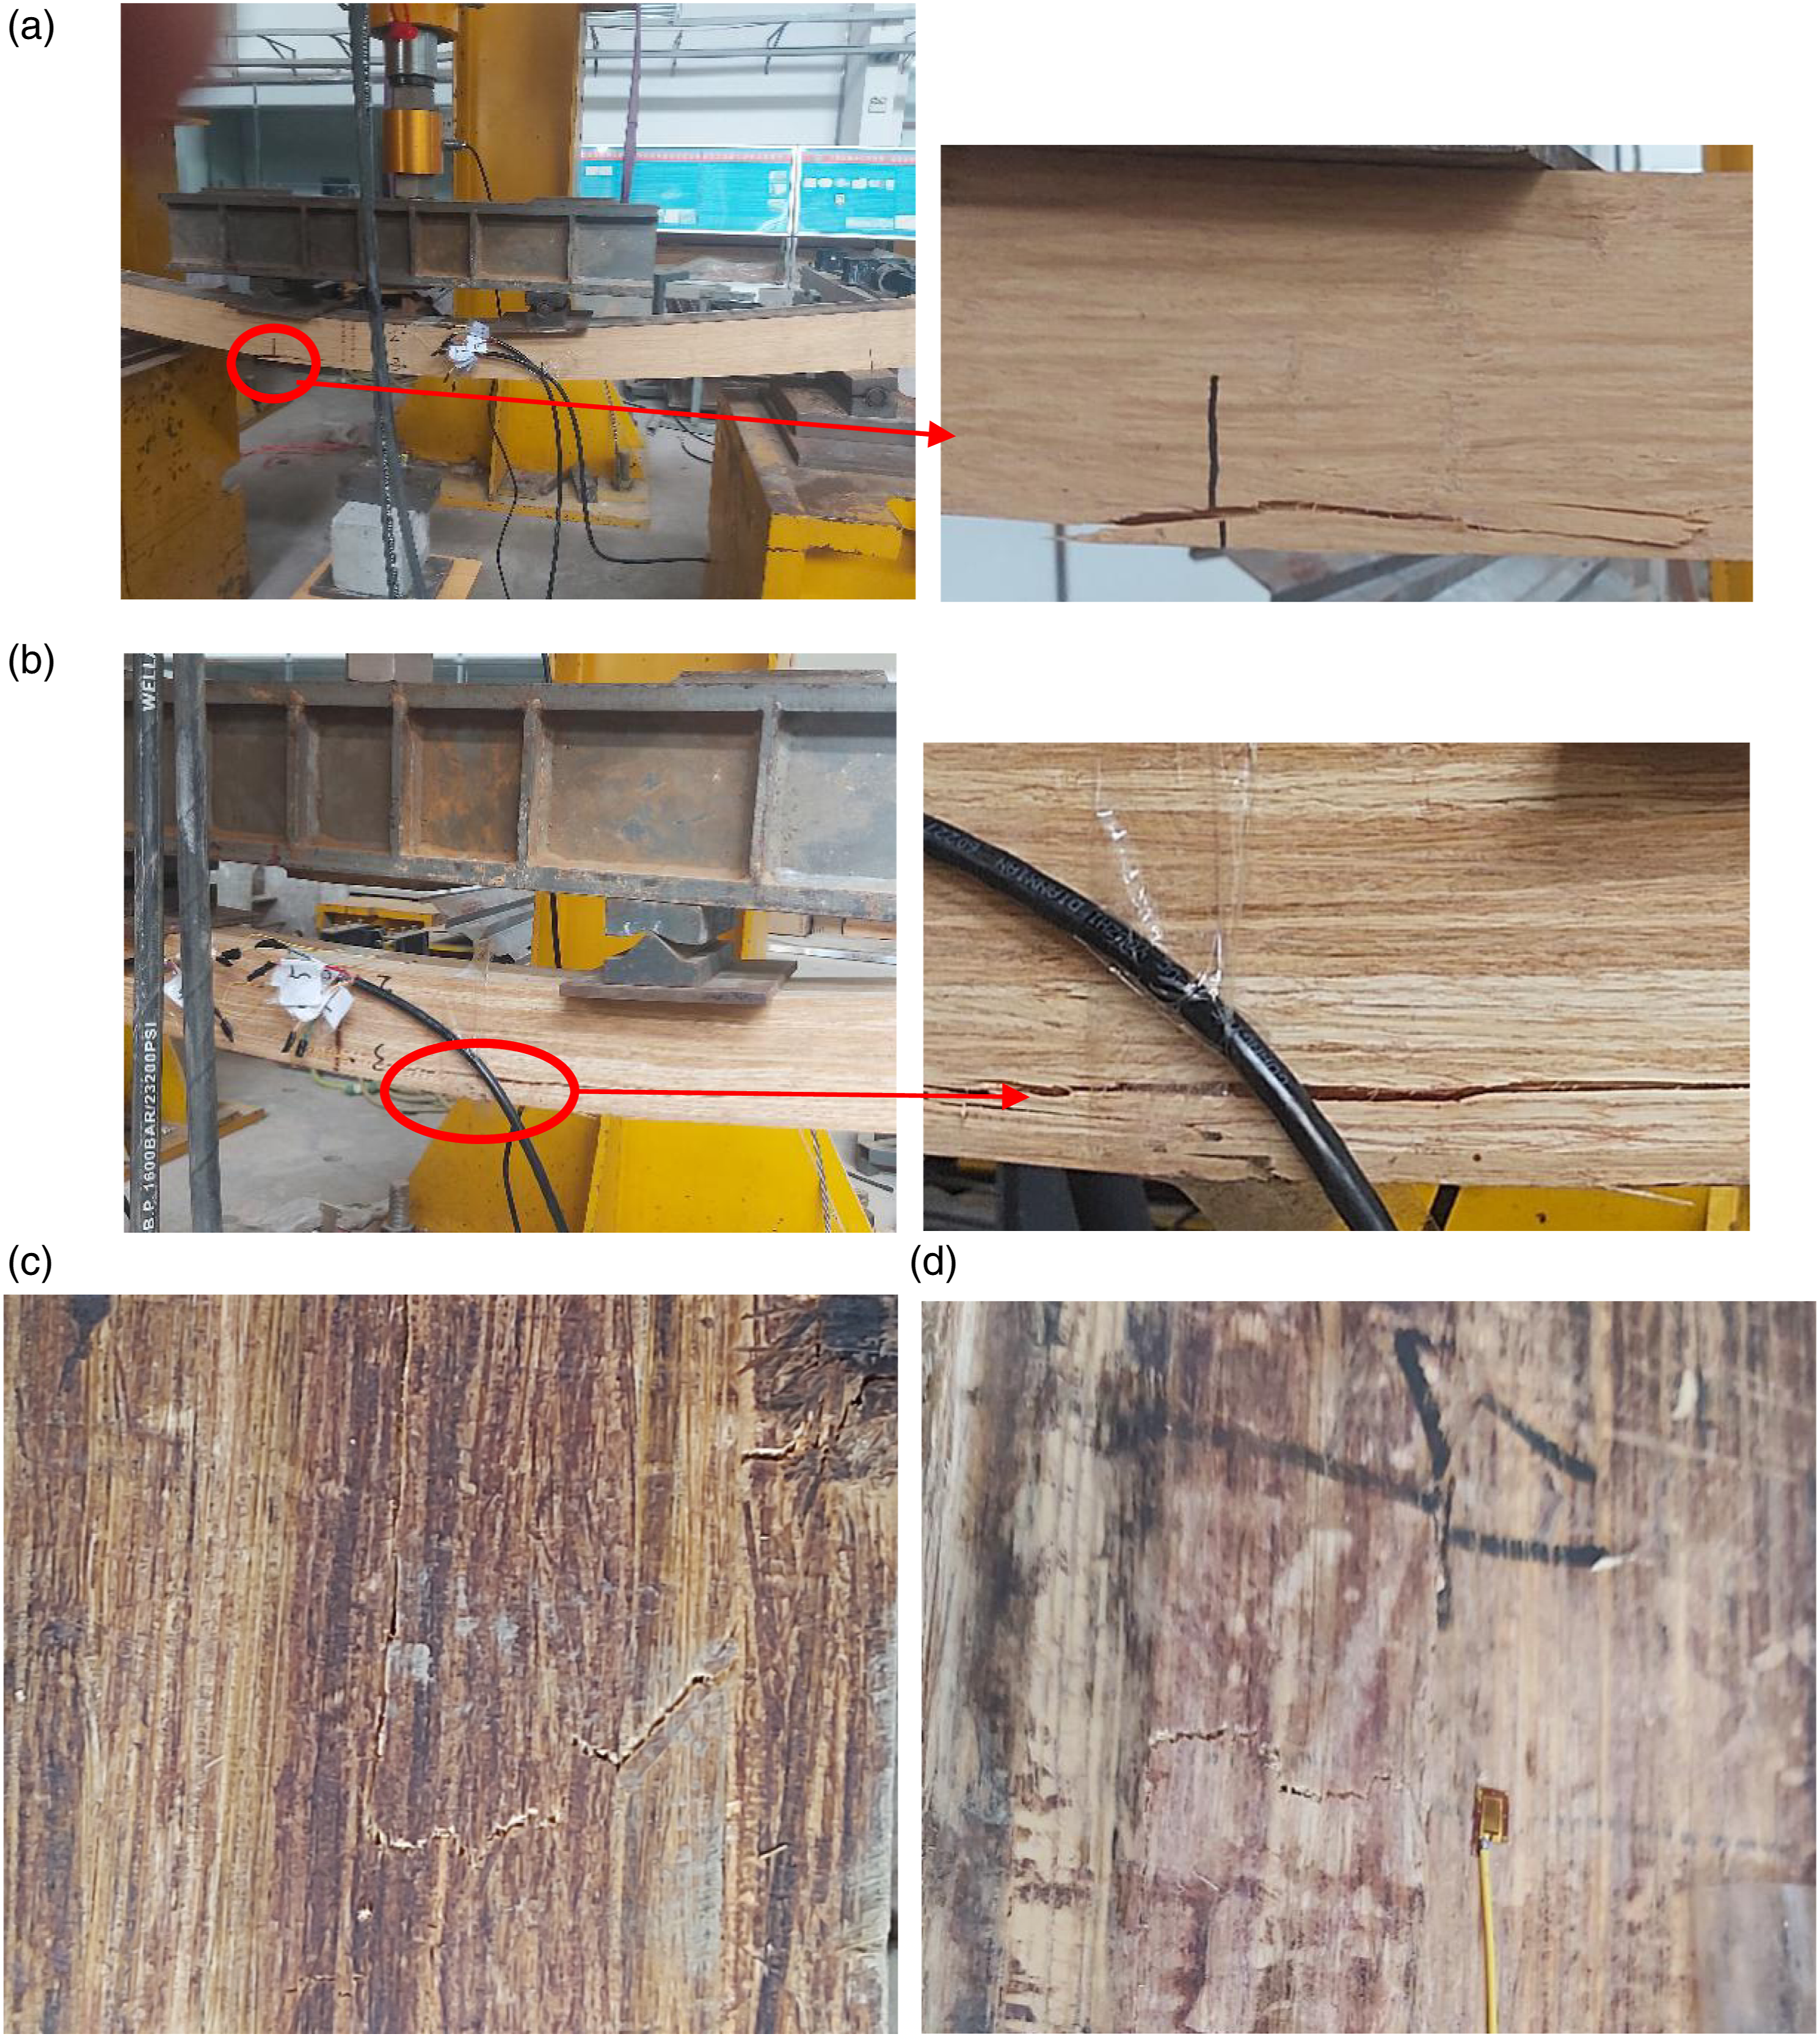
Load-displacement curves
The load-displacement curves of the specimen are shown in Figure 6. (1) According to the Chinese wood structure design code GB 5005-2017 (2017), the limit of the mid-span deflection in the normal service limit state is L/250, with L the beam span. In these experiments, the specimen span was 1700 mm and the limit of its mid-span deflection 6.8 mm. The minimum mid-span deflection of a specimen was 59.8 mm when damage occurred, which was much larger than the limit deflection and indicated that the bamboo scrimber beam and steel-RBSC beams had better toughness relative to code, and stiffness the limiting index that affected bearing capacity (Figure 6). (2) The load-displacement curves of bamboo scrimber and composite beams were nonlinear. In the initial stage (displacement of 0–20 mm), the load-displacement curves of all specimens were approximately linear. As the load continued to increase, the slopes of load-displacement curves kept decreasing and the specimen loads dropped rapidly until the end of the experiment. The nonlinearity of load-displacement curves were related to the nonlinear mechanical properties of the bamboo scrimber along the parallel-grain direction. (3) There was no sudden change in the load-displacement curves of all specimens until the experiment ended with damage, indicating that there was no large-area peeling of the adhesive layer between the steel and bamboo scrimber. (4) The stiffness of specimen S0-1 was the smallest and that of specimen SR16-1 the largest, indicating that the steel had a significant effect on specimen stiffness of bamboo scrimber. The load-displacement curves of the specimen. The strain history curve of specimens: (a) S0-1, (b) SR4-1, (c) SR8-1, (d) SP2-1.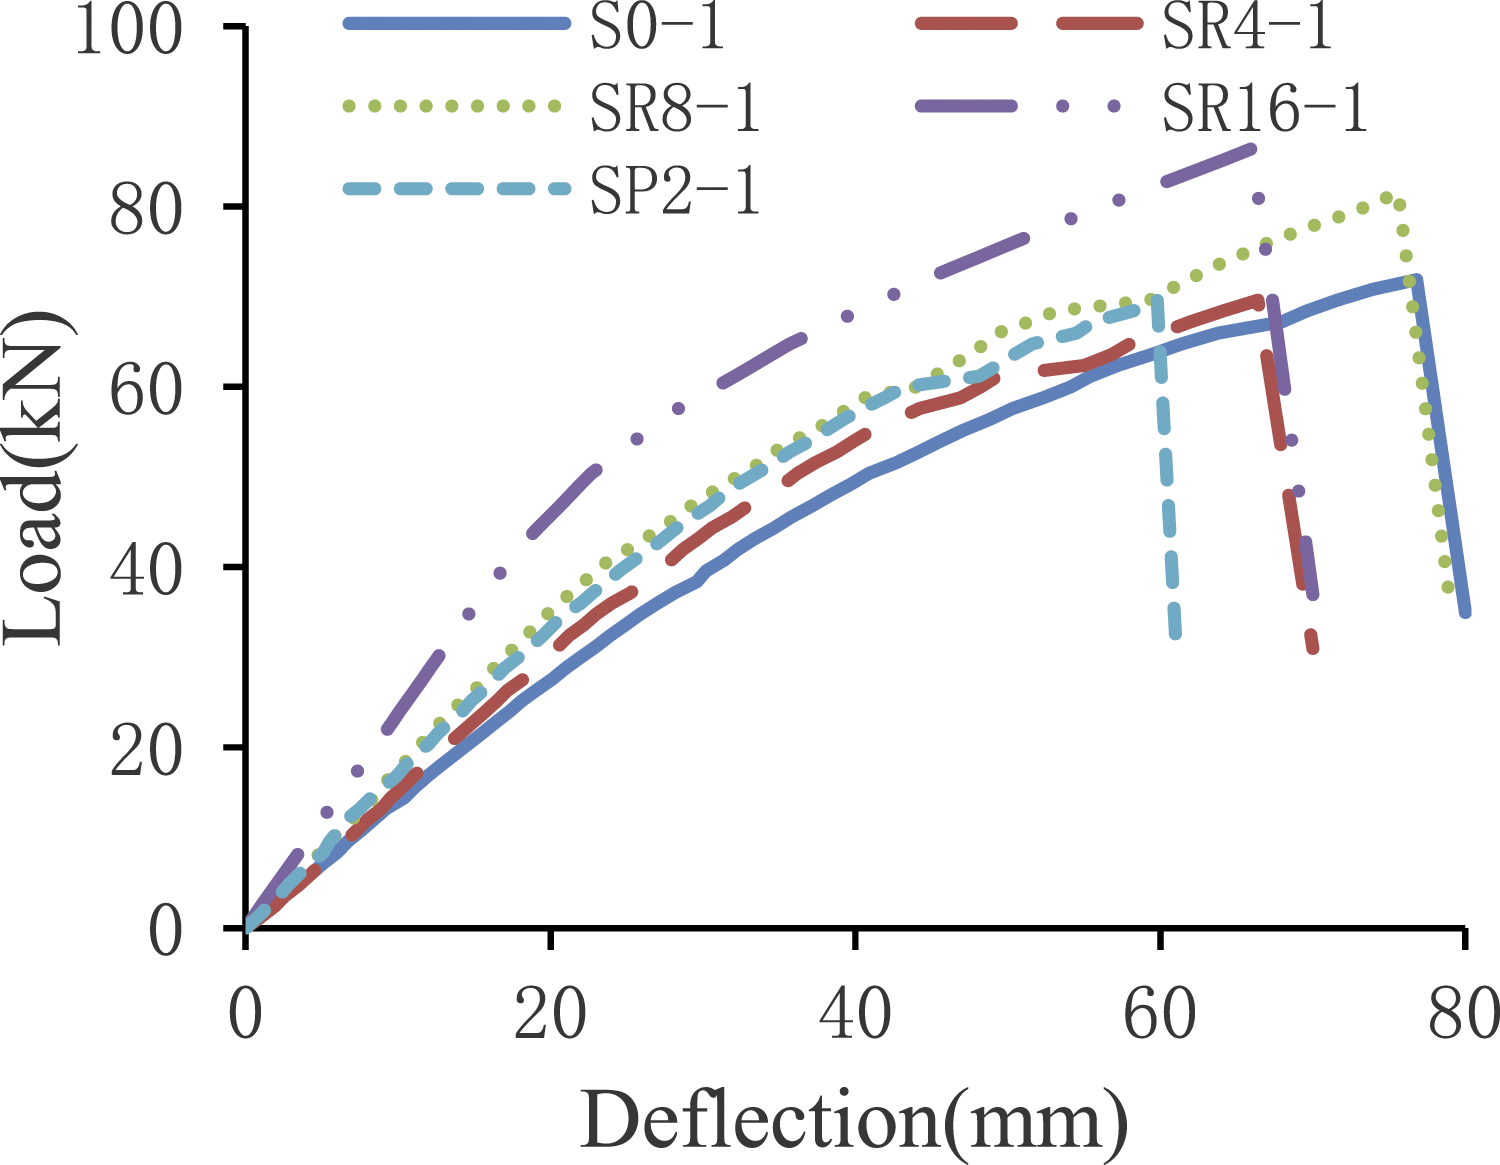
Flexural performance analysis
The mechanical properties of the four-point bending of specimens.

Strain history curve
The strain history curve of specimens showed that: (1) Strain gauge 4 of S0-1 specimens was suddenly broken at 593.5 s, while the other strains did not change suddenly and specimen stiffness also did not change suddenly (Figure 7). This indicated that the specimen overall stiffness did not change suddenly and only locally failed at strain gauge 4. At 969 s, strain gauge 3 was suddenly destroyed, as the bottom of the specimen was damaged and a crack passed through strain gauge 3. (2) All strain gauges of other specimens only changed abruptly upon failure, which was consistent with no visible naked-eye damage during the experiment. When the specimens were damaged, the strain at most test points increased, while that at a small number of test points decreased, such as strain gauge 4 of Specimen SR4-1. This was because when the bottom of the specimens were damaged, the load of the bamboo scrimber at the damaged place was reduced (or no load), and the load of the bamboo scrimber far away from the damaged place was increased. The stress-strain model for bamboo scrimber.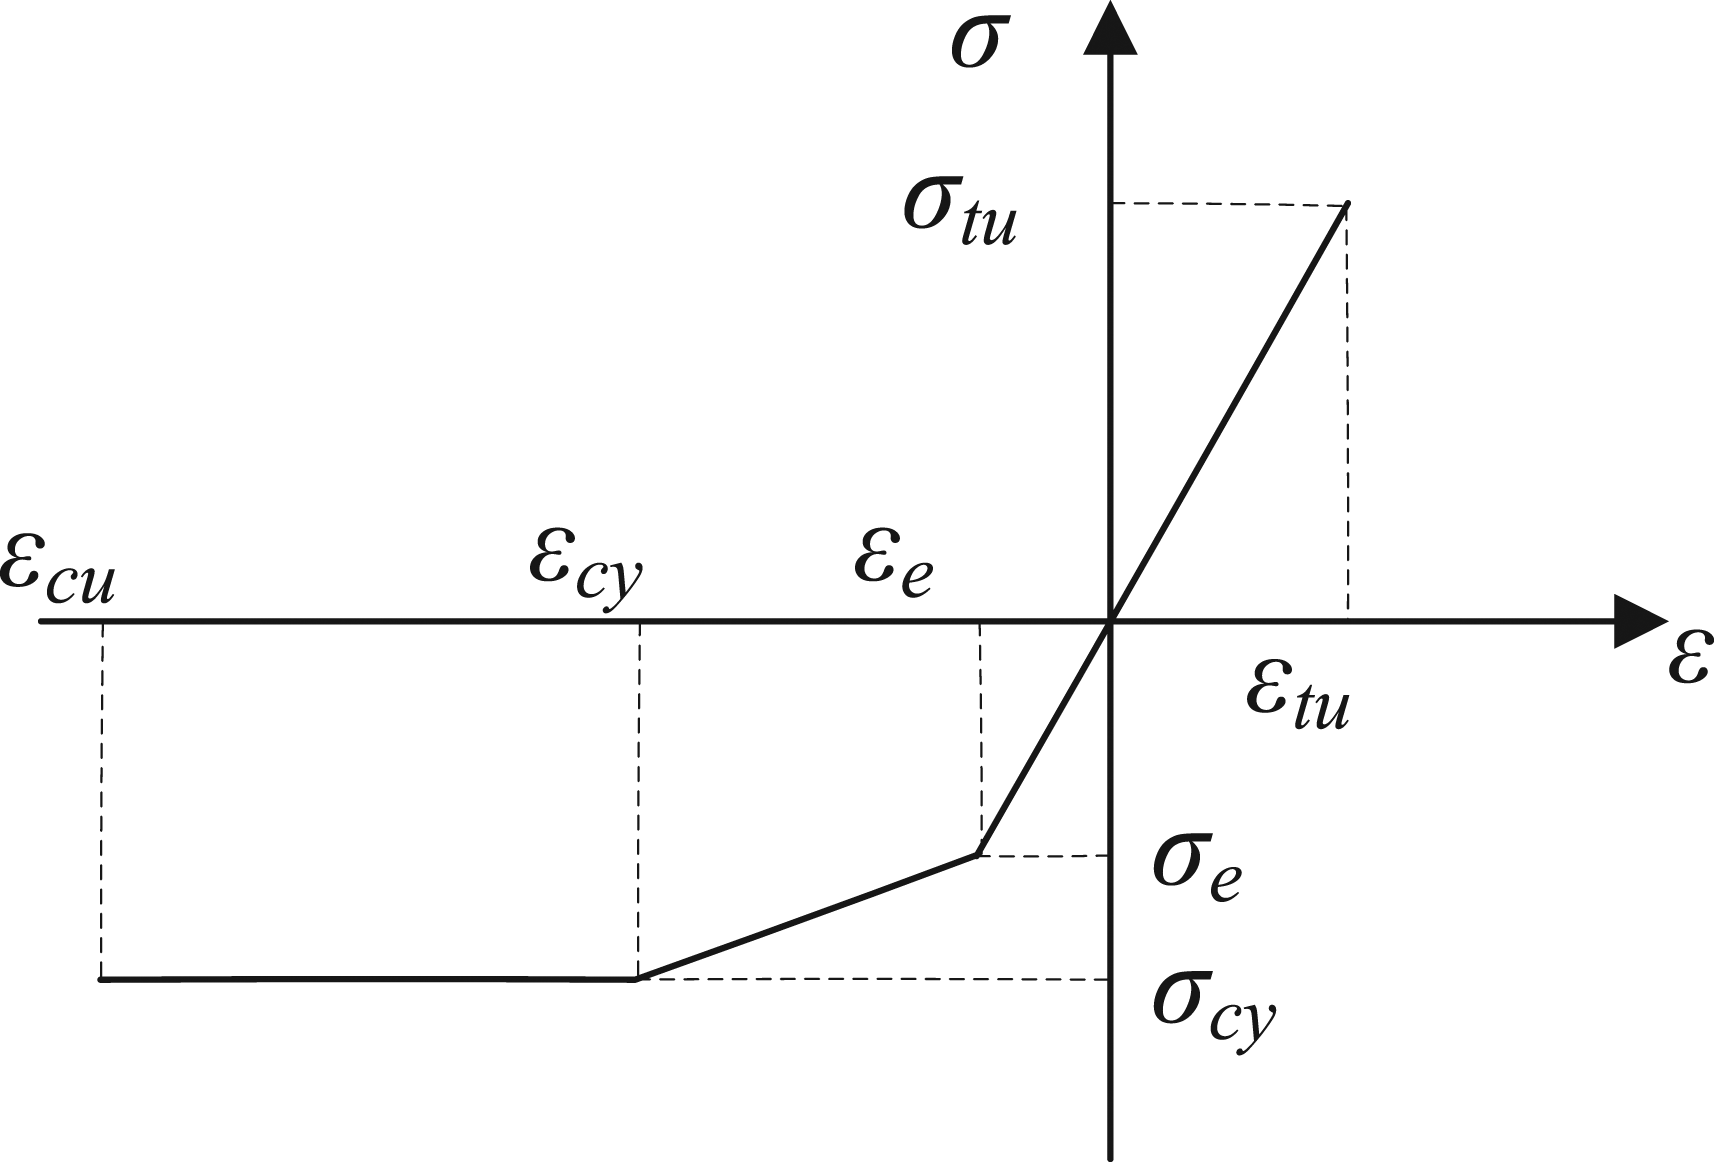
Finite element analysis of steel-RBSC beam
Material properties
The thesis did not consider the anisotropic mechanical properties of the bamboo scrimber. The stress-strain model for bamboo scrimber is similar to the Baza-Buchanan law for wood, as shown in Figure 8, with the following equation for the stress-strain relationship.
For tension:
For compression:
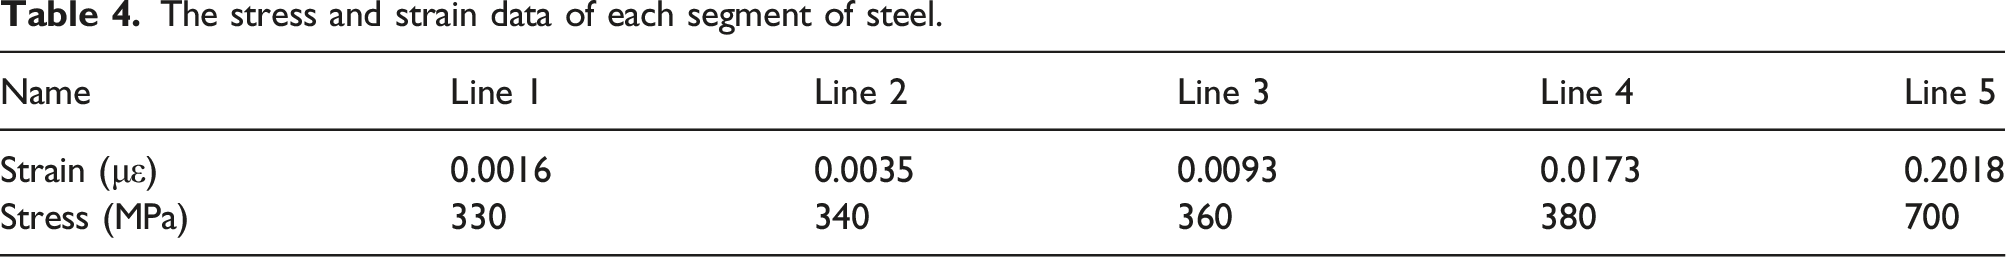
The stress and strain data of each segment of steel.
Finite element model
Steel-RBSC beams belonged to a composite structure, including a three-layer structure of steel, glue layer and bamboo scrimber. The thickness of the adhesive layer was very thin, and the traditional finite element elements would cause calculation convergence problems. The paper assumed that the adhesive layer damage only occured inside the glue layer, and the cohesion zone model theory was used to simulate the adhesive layer.
The cohesive zone model is a phenomenological model based on continuum damage mechanics and linear elastic fracture mechanics. Its constitutive equation defines relationships between the interface opening displacement and the cohesive force. It is generally believed that there is no coupling phenomenon between the normal cohesive force and the tangential cohesive force. That is, the normal displacement won’t generate tangential cohesive force, and the tangential sliding won’t lead to normal cohesive force. The constitutive equation is given as follow:
The parameters of the cohesive zone model.

The finite element model of the steel-RBSC beam is shown in Figure 9. It was built by half of the model due to symmetry geometry and boundary conditions. the bamboo scrimber and steel were modeled using eight-node reduction integral body element (C3D8R) and six-node linear body element (C3D6), with the unit size of 3–5 mm. The adhesive layer was modeled by using eight-node cohesive element (COH3D8), with nodes shared with the bamboo scrimber and steel respectively. The softening phenomenon of the adhesive layer was described by bilinear traction separate law, the initial damage criterion for mixed damage was given by the quadratic nominal strain criterion, and the damage criterion for mixed damage was the quadratic power criterion. The number of elements in the model is 202,358 and the number of nodes is 220,709. The boundary conditions and loads were as follows: the Y-direction and Z-direction DOFs of a row of nodes at the left end of the composite beam were constrained, the Z-direction DOF of a row of nodes at the right end of the composite beam was constrained, the X-direction symmetric constraint was applied on the ventral surface of the composite beam, and the concentrated load was applied at the left and right loading rollers of the composite beam. Finite element model of steel-RBSC beam: (a) front, (b) Local section.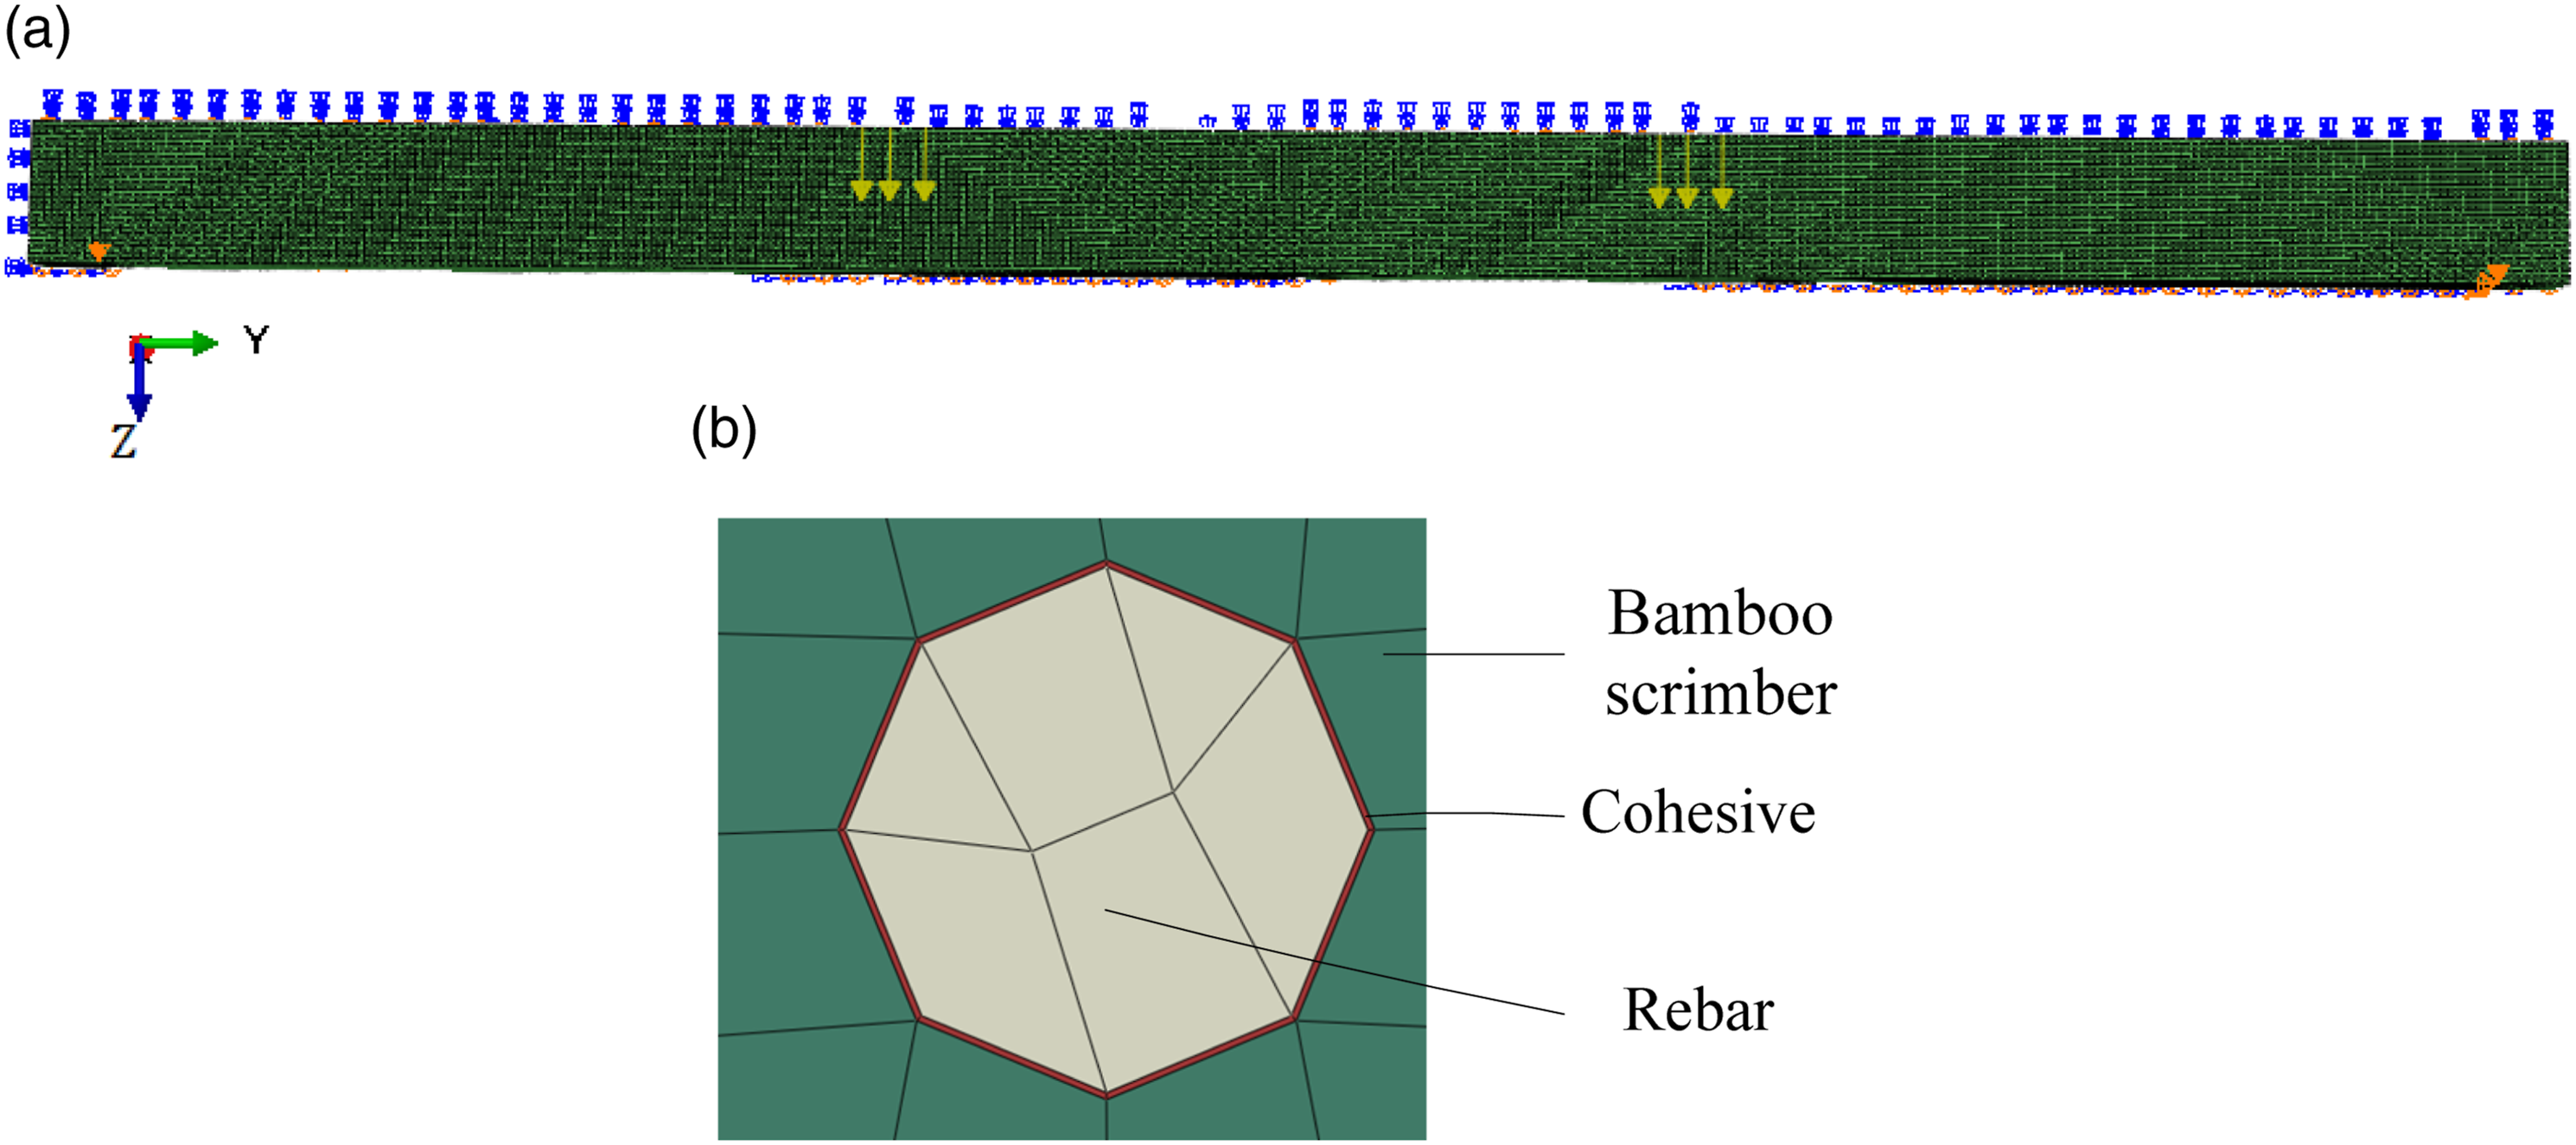
Comparison of simulation and test results
Comparisons of test load-displacement curves of the steel-RBSC beams with the simulation prediction curves are shown in Figure 10. In the linear elastic deformation stage, the test load-displacement curves almost coincided with the simulation prediction curves. At the yield stage, there was only a slight difference between the two curves, the simulation curves were relatively smooth and there were slight fluctuations in the test curves, which were caused by a variety of factors in the test process. However, there were some errors between the simulation limit deflections of the specimens and the experimental limit deflections. The finite element model set the ultimate tensile strain of the bamboo scrimber as 11,600με, so the maximum simulation deflections of the specimens were about 70 mm. In test curves, the ultimate tensile strain of the bamboo scrimber was related to many factors, such as the growth environment and age of the bamboo, mechanical rolling, drying, paving, and curing of the bamboo bundles, etc., which would make the ultimate deflections of test specimens vary greatly. In short, the simulated load-displacement curves were in good agreement with the test curves. Comparisons of test load-displacement curves of steel-RBSC beams with simulation prediction curves: (a) S0-1, (b) SR4-1, (c) SR8-1, (d) SR16-1, (e) SP2-1.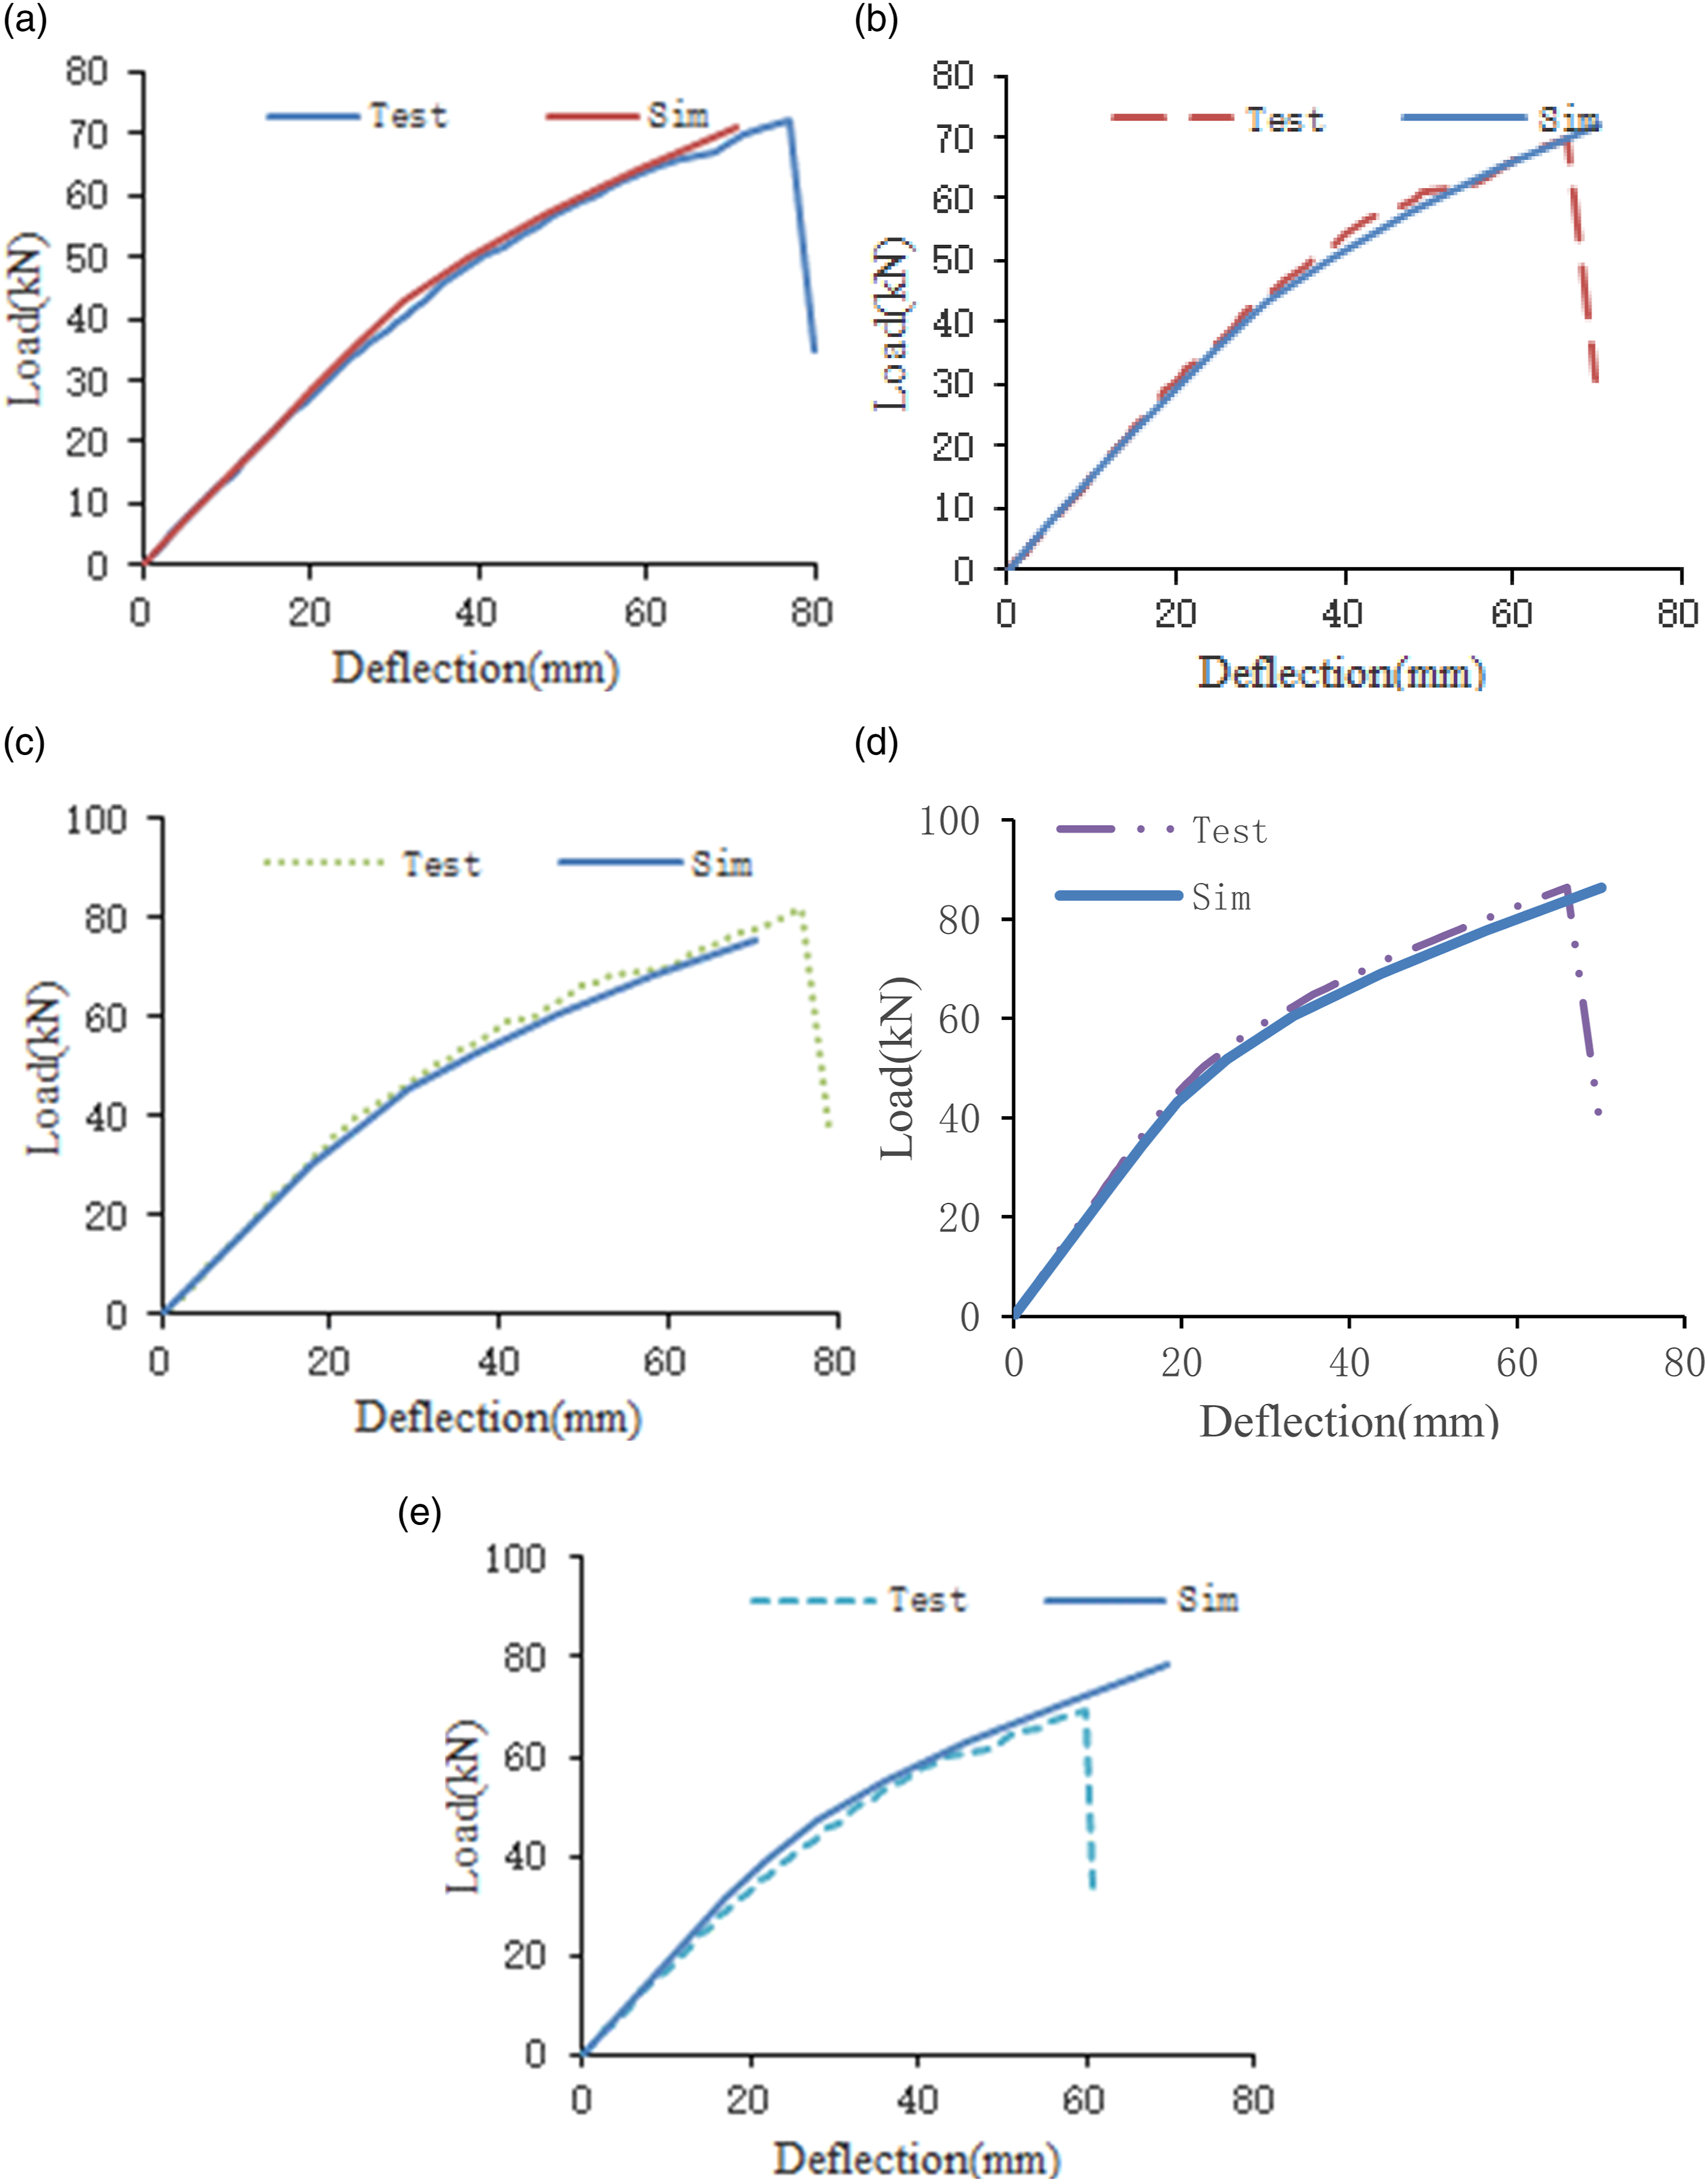
The comparisons between the experimental mechanical properties of the steel-RBSC beams and the simulation prediction results.

Comparisons between simulation predictions and experimental results of cross-sectional strains of steel-RBSC beams showed that the simulated predicted value of cross-sectional strain was close to the experimental value under all load levels (Figure 11). The average error of cross-sectional strain of the four specimens was 10.0%, 6.5%, 17.4%, and 6.7%, respectively, indicating that the finite element model accurately predicted the cross-sectional strain of a specimen. With increased steel volume, the strain of bamboo scrimber in the compressed area under the same load was greater and the material more fully utilized. For example, under 0.8 times the ultimate load, the top mid-span strain of specimens SR4, SR8, and SR16 were −7552, −8027, and −8415, respectively. Comparisons between simulation predictions and experimental results of cross-sectional strains of steel- RBSC beams: (a) SR4, (b) SR8, (c) SR16, (d) SP2. L is the limit load, with 0.3 L the limit load times 0.3, T represents measured data, S the simulation prediction data, and x-coordinate the distance from the specimen top surface.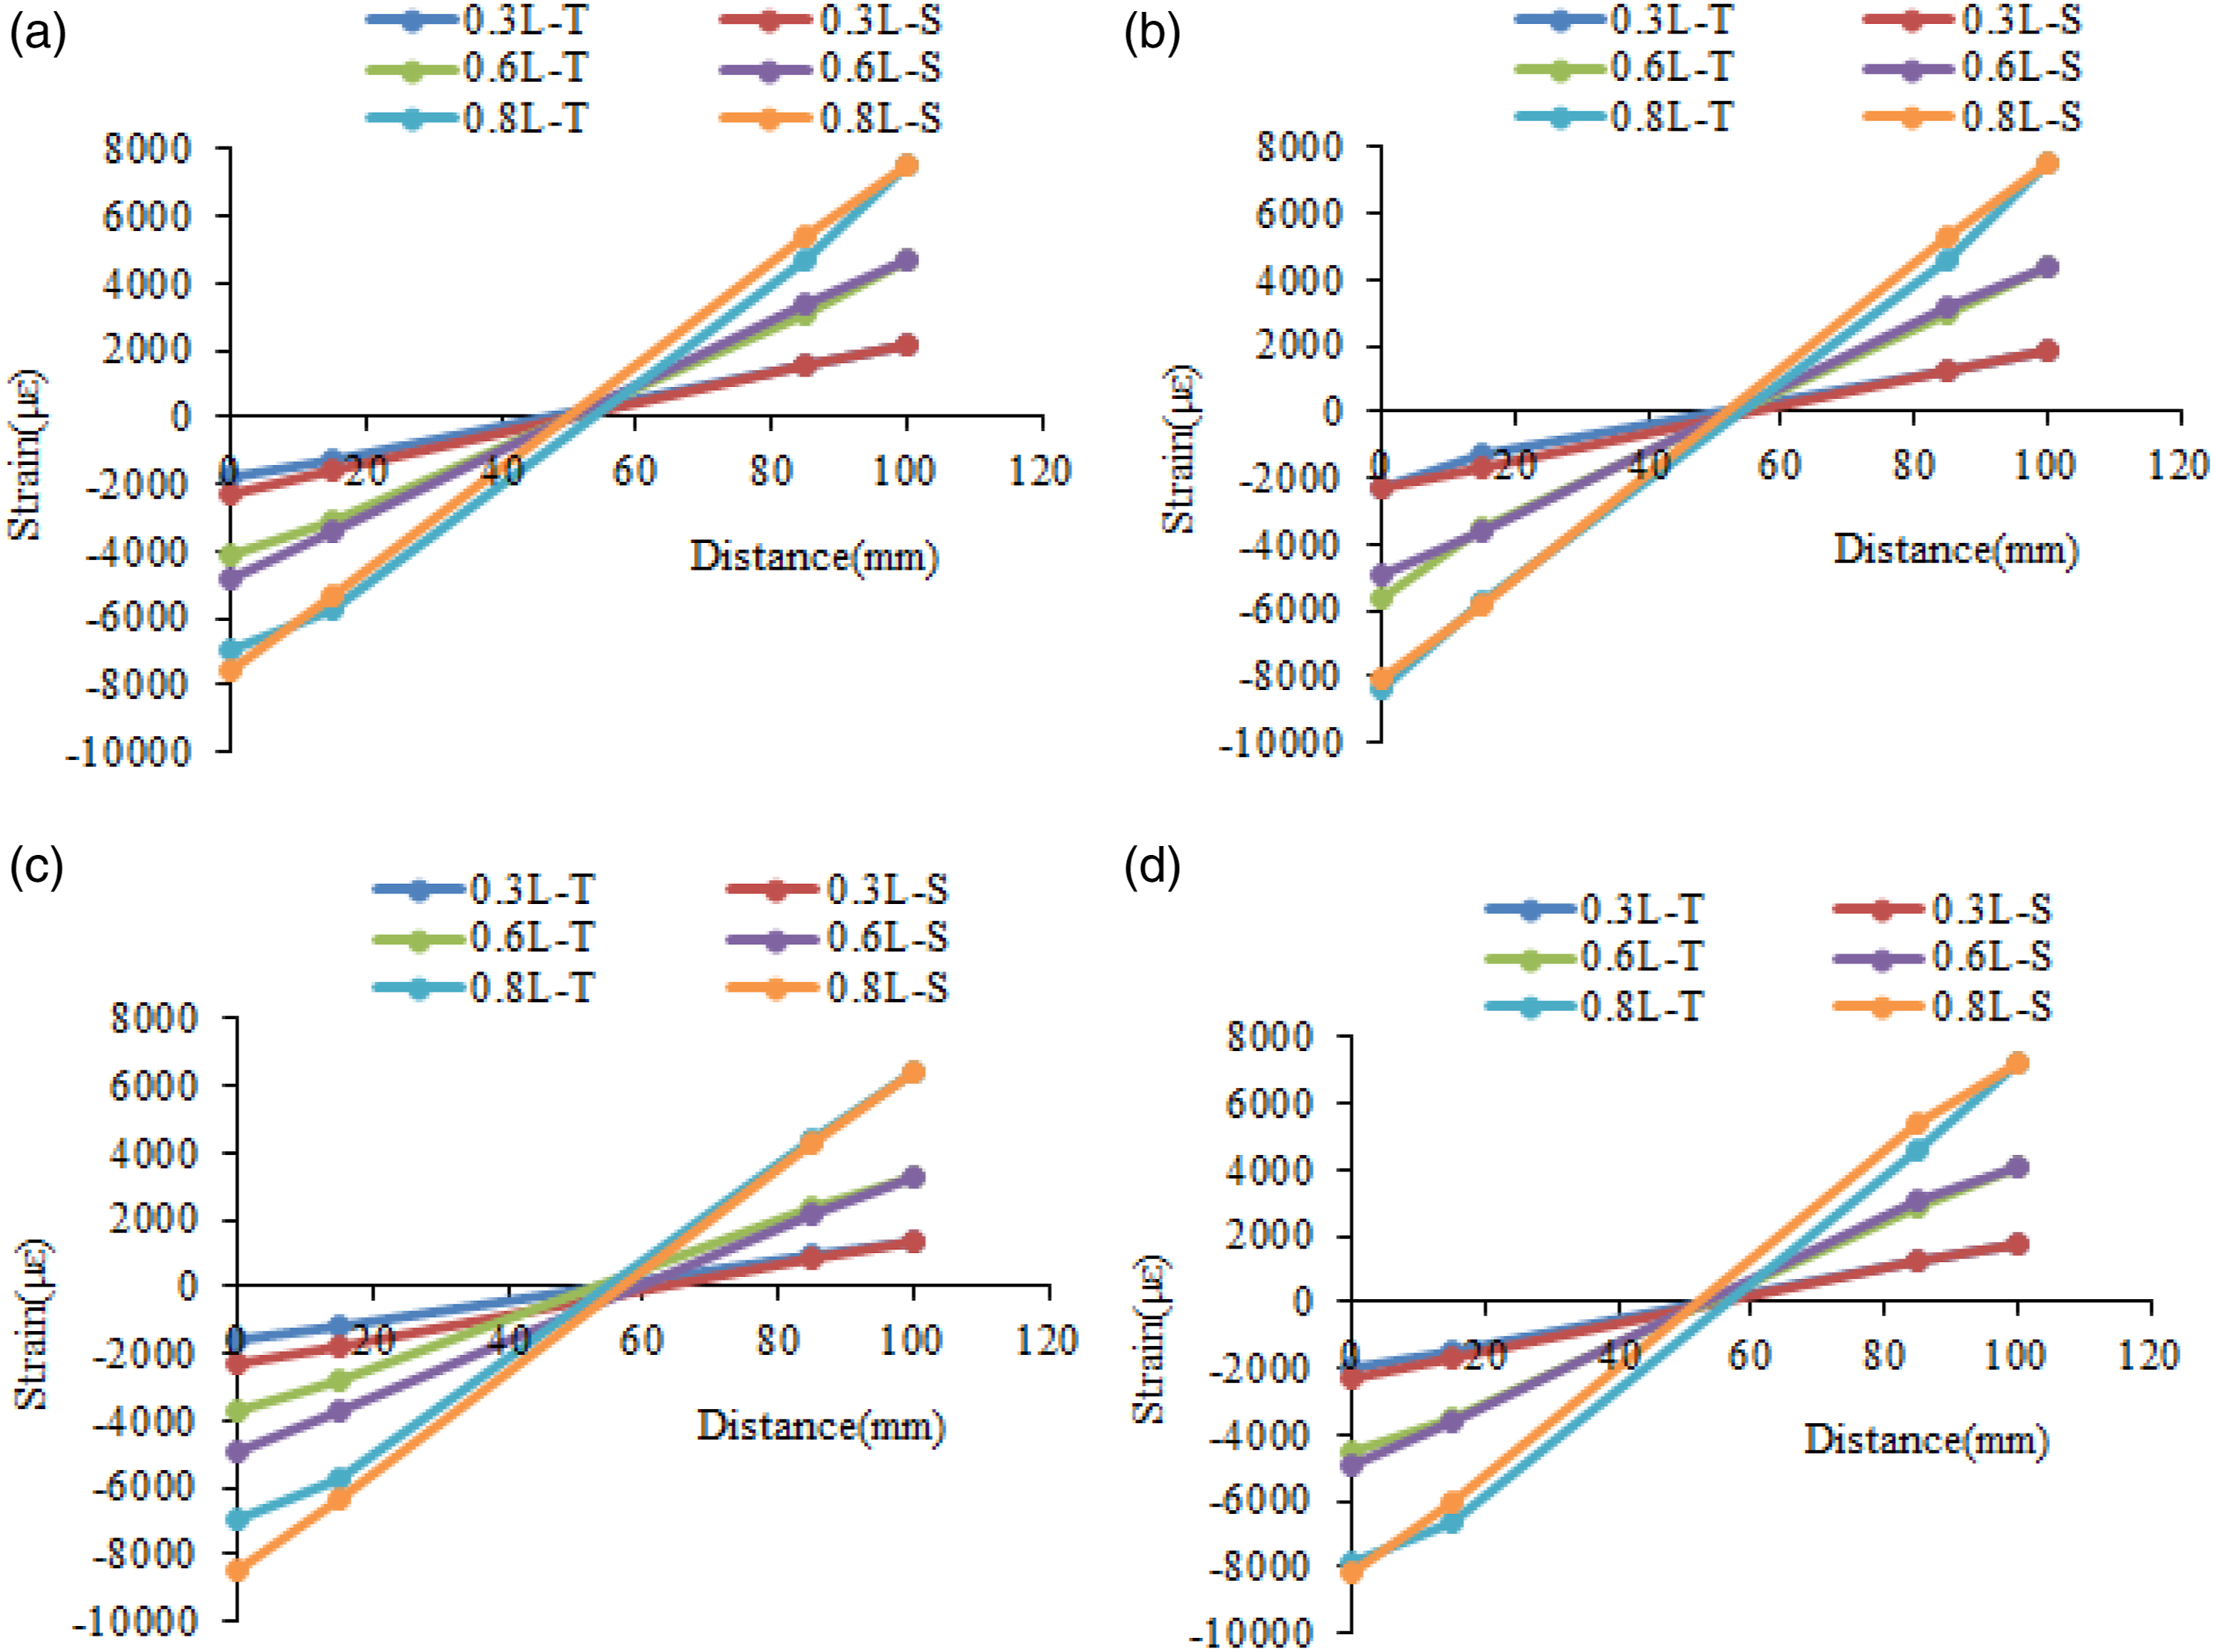
Bonding stress of adhesive layer
According to cohesion zone model theory, the stress nephograms of the adhesive layer of steel-RBSC beams showed that specimen SR16 represented steel bar-RBSC beams and SP2 steel plate-RBSC beams (Figure 12). The Mises stress of the adhesive layer on the lower surface of the steel bar of specimen SR16 was concentrated at the end support and relatively small in other areas. On the upper surface, the Mises stress of the adhesive layer was not concentrated at the end support, relatively high in the bending-shear section (cross-section 1–3), and relatively low in the pure bending section (right of cross-section 3).The Mises stress distribution pattern of specimen SP2 was similar to that of specimen 3. The maximum Mises stress of the adhesive layer of specimens SR16 and SP2 was at the end support. The maximum Mises stress of specimen SR16 was 125 MPa, the shear stress S23 of this node at 65.7 MPa, the shear stress S13 at 15.3 MPa, and the normal stress S33 at −53.5 MPa. The maximum Mises stress of specimen SP2 was 25.2 MPa, the shear stress S23 of this node at 9.8 MPa, the shear stress S13 at 3.9 MPa, and the normal stress S33 at −16.2 MPa. Among the three stress components, shear stress S23 and normal stress S33 were larger for the two specimens, which was because the adhesive layer was adjacent to the lower beam surface. This was greatly affected by the concentrated load of the supporting roller reaction force, which transmitted a larger normal compressive stress S33 and shear stress S23 caused by the sudden change of load. As the adhesive layer in this area mainly bore compressive normal and shear stresses, the compressive strength of the adhesive layer was relatively large. Also, damage of the local pressure-bearing adhesive layer was not easily peeled and expanded to a large area, such that the stress in this area was not later analyzed. Stress nephograms of the adhesive layer of steel-RBSC beams: Only half of beams shown, (a) adhesive layer on the lower surface of steel bar of specimen SR16, (b) adhesive layer on the upper surface of steel bar of specimen SR16, and (c) adhesive layer of specimen SP2. Sections 1–4 are respectively located at the center of the support roller, the support roller, the midpoint of the loading roller, and a distance of 50 mm from the mid-span section.
The relationship between the adhesive layer stress and angle of the four cross-sections of specimen 3 was examined, with 0° directly above the section and clockwise as the rotation direction. This showed that the normal stress and shear stress varied greatly with the angle (Figure 13). The section of Figure 13(a) was located in a pure bending section, and the normal stress S33 of this section was the main stress component, which was located at an angle of 90°. The shear stress S23 was basically zero. The section of Figure 13(b) was located at the loading roller. Compared with Figure 13(a), the normal stress S33 was still the main stress component, but shear stress S23 was significantly increased. The maximum normal stress S33 was located at an angle of 90° and the maximum shear stress S23 was located at an angle of 0°. The section of Figure 14(c) was located at the midpoint of the bending and shearing section. Compared with Figure 13(a), the shear stress S23 was the main stress component and normal stress S33 were close to 0. The maximum shear stress S23 was located at an angle of 0°. The section of Figure 13(d) was located at the support roller and the normal stress S33 and shear stress S23 suddenly increased near 180°. In short, for specimen 3, the stress of the section in Figure 13(d) was not considered. When the main stress component was normal stress S33, the maximum normal stress was located at 90°. When the main stress component was shear stress S23, the maximum shear stress S23 was located at 0°. Shear stress S13 was usually small and not a major stress component. The relationship between the adhesive layer stress and the angle of the four cross-sections of Specimen 3: (a) Section 4, (b) Section 3, (c) Section 2, (d) Section 1. Relationship between the adhesive layer and the longitudinal position for the four specimen types: (a) S23, (b) S13, (c) S33.

The relationship between adhesive layer stress and longitudinal position of the four specimens, with the mid-span section as the coordinate origin, was regardless of the adhesive layer stress near the support roller area (Figure 14). For steel rebar-RBSC beams, the normal stress S33 of the adhesive layer was located at nodes of 90° and the shear stresses S23 and S13 of the adhesive layer located at nodes of 0°. For steel plate-RBSC beams, all stresses were located at the middle joint. The maximum adhesive shear stress S23 of SR4/SR8/SR16/SP2 was 14.5 MPa and the maximum adhesive shear stress S13 at 1.66 MPa, both of which were less than the allowable shear stress of the adhesive layer, at 20 MPa. The maximum normal stress S33 was 5.76 MPa, which was smaller than the allowable normal stress of the adhesive layer, at 15 MPa. Therefore, all adhesive layers of these specimens did not peel off, which was consistent with the test results.
From the observed relationship between adhesive layer stress and the longitudinal position (Figure 14): (1) The three kinds of adhesive layer stress curves of all specimens were similar to each other, and the maximum adhesive layer shear stress and adhesive layer normal stress of steel plate-RBSC specimens were smaller than all steel rebar-RBSC specimens. (2) For steel rebar-RBSC specimens, as the steel bar diameter increased, the maximum shear and normal stresses increased. (3) When the distance was < 283 mm (pure bending section), the shear stresses S23 of the adhesive layer of all specimens were close to 0 and shear stress S23 increased rapidly near the loading point. When the distance was > 400 mm, the shear stress S23 of specimen SR16 continued to increase and the shear stress S23 of specimens SR4 and SR8 first remained stable and then increased. The shear stress S23 of specimen SP2 remained stable. The maximum shear stress S23 of specimens were all located in the flexural shear section. (4) When the distance was <283 mm, the normal stresses of the adhesive layer of all specimens were relatively stable and, near the loading point, the normal stresses of the adhesive layer decreased rapidly. When the distance was >600 mm, the normal stresses of the adhesive layer was close to 0. The maximum normal stress was located in the pure shear section. (5) The change trend of shear stress S13 of the adhesive layer was similar to normal stress of the adhesive layer. (6) In the area adjacent to the loading roller (in the bending and shearing area), there were both large adhesive layer shear stress S23 and normal stress S33. In short, the diameter of the steel bar should not be too large when used to reinforce the bamboo beam, as it would cause a large adhesive layer stress. Near the support roller area, the adhesive layer mainly bore compressive normal and shear stresses and the local pressure-bearing adhesive layer might be crushed, but such damage did not easily extend very far. Near the loading roller area (in the bending and shearing area), the adhesive layer shear stress S23 and normal stress S33 affected adhesive layer peeling. In the bending and shearing area (away from the area of the loading roller), the adhesive layer shear stress S23 mainly affected adhesive layer peeling. In the pure bending section, the normal stress S33 of the adhesive layer mainly affected adhesive layer peeling.
Conclusion
In this study, newly designed Steel-RBSC beams were produced by prepressing-cold pressing-hot forming method. Four-point bending experiments were used to study the failure mode, bending performance, load-displacement relationship, and strain history curve of the composite beams. The finite element model of steel-RBSC beams was established based on the theory of the cohesion zone model and the bonding stress of the adhesive layer of steel-RBSC beams revealed. The research results are as follows:
The failure mode of steel-RBSC beams involved damage to the bottom of bamboo scrimber by the bending load and there was no large-area peeling of the adhesive layer between the steel and bamboo scrimber. Steel reinforcement had a significant effect on improving the bamboo scrimber beam strength and more effect on improving the stiffness, which verified that the prepressing-cold pressing-hot forming method was feasible.
Using the cohesive zone model to simulate the adhesive layer, a finite element model of the steel-RBSC beam was established. The predicted load-displacement curves, mechanical properties, and section strains were all consistent with the test results, which verified the correctness of the finite element model.
The bonding stress of the adhesive layer of the steel-RBSC beam was studied: Near the support roller area, the adhesive layer mainly bore compressive normal and shear stresses, which might cause crushing, but such damage did not extend very far. In the pure bending area, the adhesive layer normal stress S33 mainly affected adhesive layer peeling. Near the loading roller area, the adhesive layer shear stress S23 and normal stress S33 affected adhesive layer peeling. In the bending and shearing area, the adhesive layer peeling was mainly affected adhesive layer shear stress S23.
For steel rebar-RBSC specimens, as the steel bar diameter increased, the maximum shear and normal stresses increased. The maximum shear and normal stresses of the adhesive layer of steel plate-RBSC specimens were smaller than those of all steel rebar-RBSC specimens. So the steel plate was a better choice than the steel rebar.
Footnotes
Declaration of conflicting interests
The author(s) declared no potential conflicts of interest with respect to the research, authorship, and/or publication of this article.
Funding
The author(s) disclosed receipt of the following financial support for the research, authorship, and/or publication of this article: The project is supported by Natural Science Foundation of Hunan Province (No 2020JJ5986), Hunan Provincial Department of Education Project (No 19B591), China Postdoctoral Science Foundation (No 2021M690768).
Data availability
The data used to support the findings of this study are available from the corresponding author upon request.