
Abstract
6A13-T6 high-strength aluminium alloy material has excellent mechanical properties, but the lack of research on its mechanical properties is the biggest obstacle to its application in building engineering. This paper reports the test results of material tensile and member bending and finite element simulation to reveal the constitutive curve, failure mode, and ultimate bearing capacity of 6A13-T6 high-strength aluminium alloy. Specifically, the non-proportional yield strength of 6A13-T6 exceeds 340 MPa, the ultimate strength reaches 352 MPa, and the elongation after fracture is 14.5%. All the tested members have an evident bending phenomenon, and the width-to-thickness ratio determines the significant degree of local buckling. The Chinese code takes too much account of the reduction of section thickness and does not consider the plastic development of the section, so the predicted bearing capacity is conservative. The American code does not fully consider the effect of section plasticity, which is also conservative. The finite element modelling technology adopted is reasonable and feasible. The section can provide a greater bearing capacity when it enters the plastic strengthening stage. The local buckling will limit the bearing capacity, while the plate group effect can improve the bearing capacity of the member. It is suggested to increase the section plastic development coefficient in the Chinese code to 1.15. The results of this survey provide a reference for designers and engineers to use 6A13-T6 conveniently.
Keywords
Introduction
Parameter performance comparison of different metals.
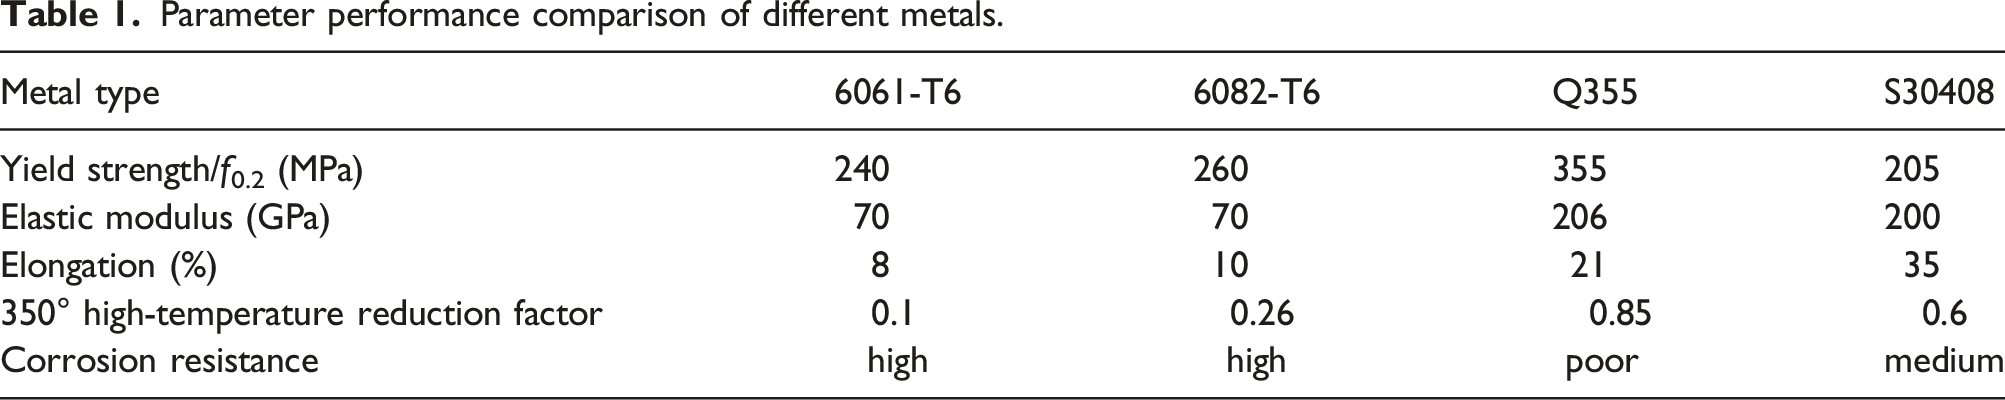
Test and numerical simulation are effective methods to study the mechanical properties of components. So far, many scholars have carried out a series of studies on aluminium alloy beams of 17ST (Dumont, 1937), 27ST (Dumont, 1940), 6082-T6 (Moen, 1999, 1999, 2001, 1999), 6061-T6 (Wu, 2005, 2006), 6061-T4 (Wu, 2005, 2006) and 6063-T5 (Shi, 2007; Wang, 2015), and have a deep understanding of their bearing capacity and failure mode. Unfortunately, in the face of the continuous improvement of the performance requirements of aluminium alloys in construction projects, the aluminium mentioned above alloys have lost their advantages. Fortunately, the newly developed high-strength aluminium alloy (6A13-T6) can solve the problem of low strength and elongation of existing T6 series aluminium alloys. The f0.2 of 6A13-T6 is 340 MPa, and the elongation after fracture is 14.5%, so it is very attractive as a structural member. However, up to now, there is a lack of basic understanding of its component performance, which seriously limits the application of this high-strength aluminium alloy in civil engineering. Therefore, studying its mechanical properties and design methods is of great significance.
This study describes the experimental study, finite element parameters and refined analysis (Zhong, 2021, 2022) of 6A13-T6 aluminium alloy bending beam to obtain the data to solve the above problems. First, 40 tensile specimens were tested to obtain the basic mechanical properties of 6A13-T6. Then, the bending tests of two aluminium alloy beams of curtain wall were carried out to determine their failure modes and ultimate bearing capacity. Secondly, the test results are compared with the design methods of Chinese and American codes to determine the code’s applicability. In addition, the finite element parameter analysis is carried out, and the section plastic development coefficient of Chinese code is modified. Hopefully, this study can improve engineers’ understanding of the structural design of high-strength aluminium alloy and promote the application of 6A13-T6.
Experimental study on 6A13-T6 high-strength aluminium alloy beam under four-point bending
Specimen preparation and experimental procedure
The experimental research includes the tensile strength test of the specimen and the four-point bending test of the aluminium alloy beam. The sample is the 6A13-T6 high-strength aluminium alloy provided by China Tongxi Group Co., Ltd.
Tensile strength specimens and test setup
The member section thickness of the bending test to be carried out in this paper is 3.2 mm and 2.0 mm. However, to explore the material properties of 6A13-T6 aluminium alloy more comprehensively, 40 tensile specimens were designed and fabricated according to Chinese code (GB/T 228.1-2010GB/T 228.1-2010) (China Iron and Steel Industry Association, 2010). There are seven groups with thicknesses of 2 mm, 3.2 mm, 4 mm, 5 mm, 6 mm, 7 mm, and 8 mm, including ten samples with a thickness of 8 mm and 5 samples in each group. The specimens with thickness of 2 mm and 3.2 mm are non-machined specimens, and the specimens with other thickness are machined specimens (Figure 1). Material property test.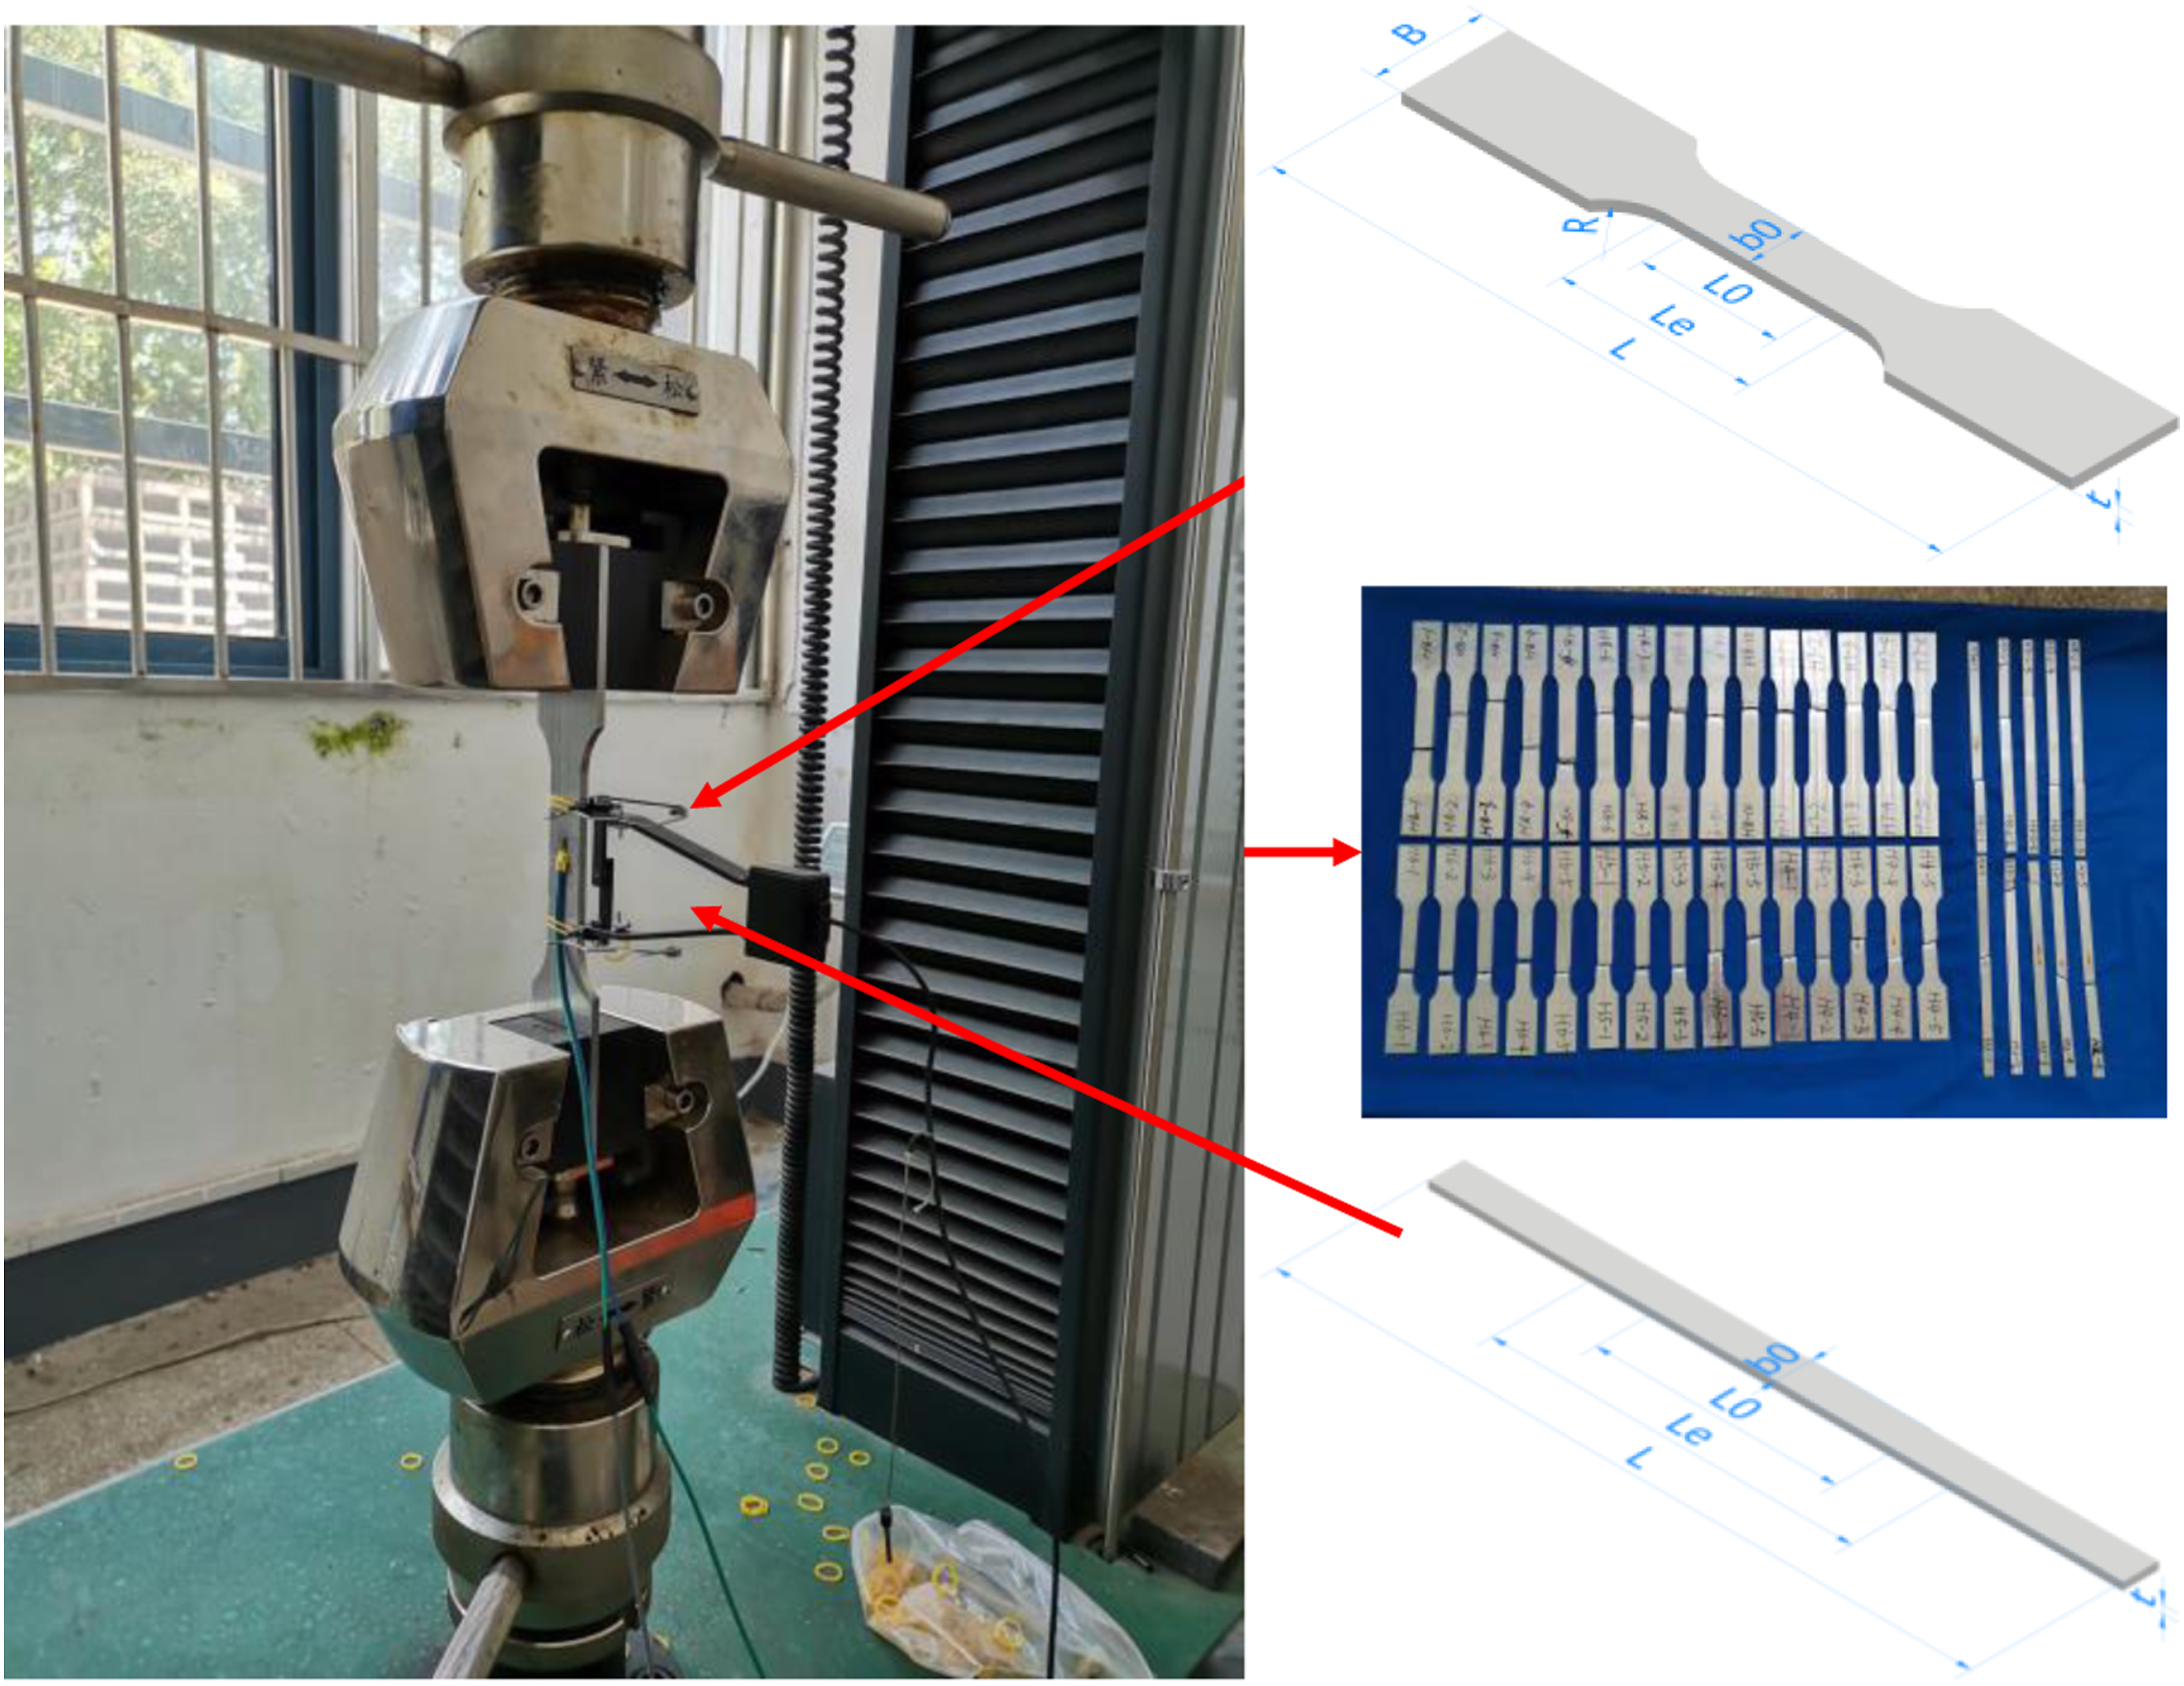
After the tensile specimens of 6A13-T6 aluminium alloy were made, the tensile test was carried out with the universal testing machine of the testing center of the Department of Civil Engineering of Southeast University. The loading speed is 1 mm/min, and the strain is measured with a high-precision extensometer with a gauge distance of 50 mm.
Beam specimens and test setup
To promote the application of 6A13-T6 high-strength aluminium alloy materials in the field of curtain wall engineering, the section form of components selected in this test is the section form of standard aluminium alloy components of the glass curtain walls. The section appearance is generally box type, as shown in Figure 2. There are 2 test members in total, and the sections are divided into the S1 section and S2 section (the member numbers are S1-L3000 and S2-L3000). The length is 3000 mm, and the span between supports at both ends of the member is 2800 mm. Schematic diagram of member section size: (a) S1 section; (b) S2 section.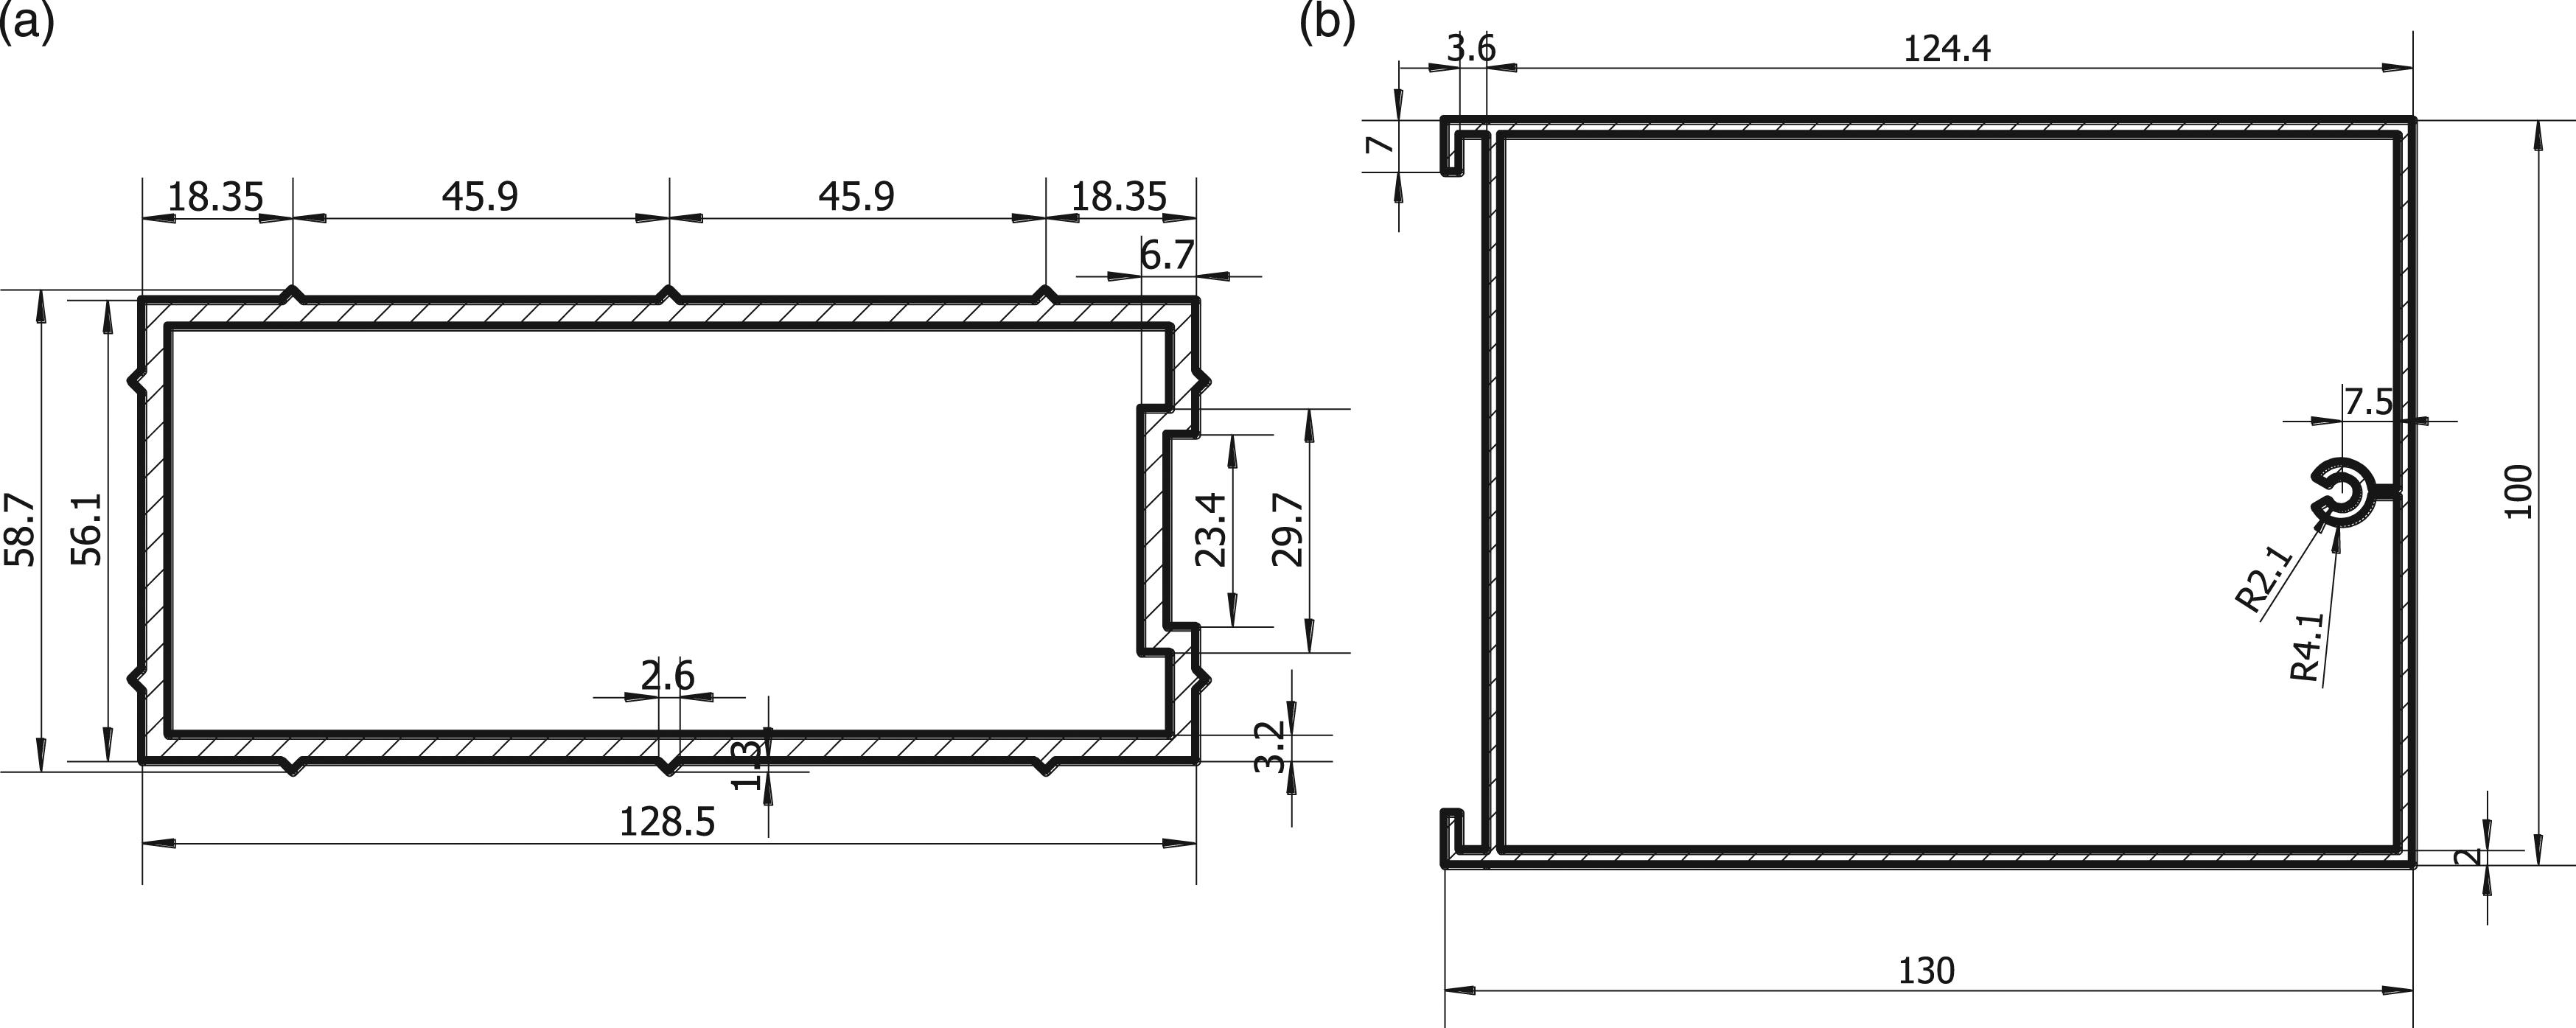
If the component is directly placed on the roller, the lateral torsion at the end is easy to occur, leading to early failure of the bending component. Therefore, a special clamp support is designed in this paper (Figure 3). The support can ensure that the end of the member can freely develop longitudinal displacement along the length direction, rotation in the main plane and free warpage of the plate. In addition, the support can also prevent out-of-plane displacement and torsion of the end. Test support.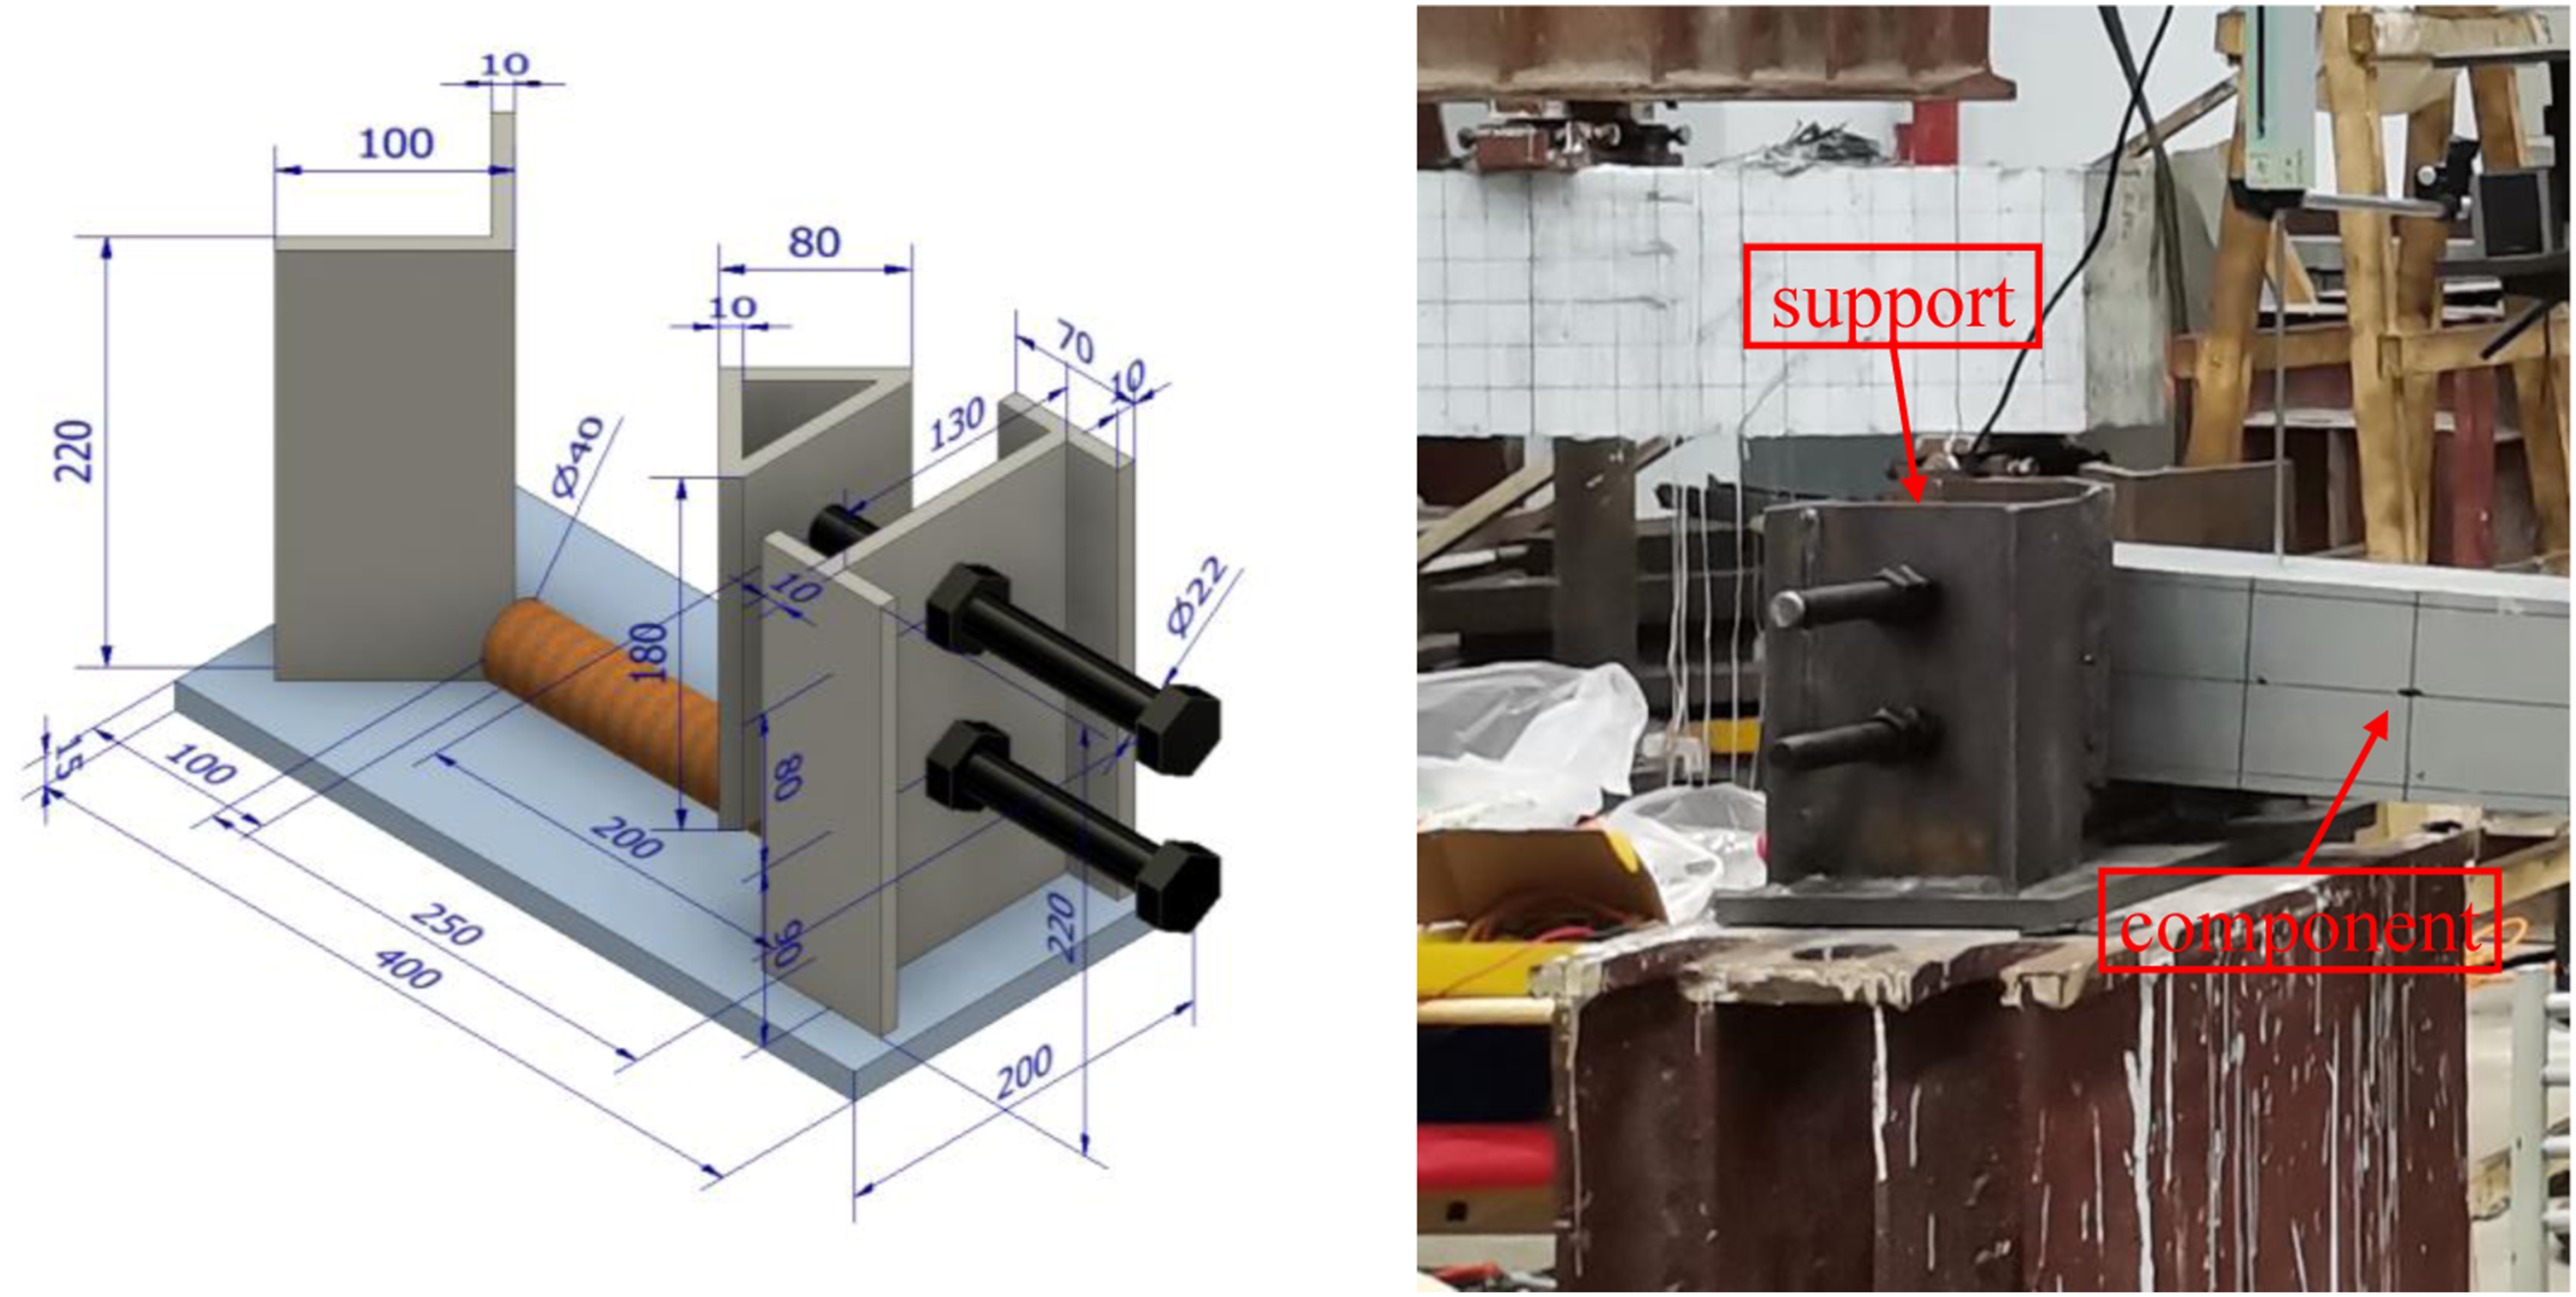
Due to the limitation of test conditions, the bending test is loaded by an oil pump. A steel backing plate is placed between the bending member and the jack to realize the boundary condition of point loading. The load data is measured by the 10 T force sensor, which is placed above the jack lifting head and is close to the reaction beam (Figure 4). In addition, due to the insufficient control accuracy of the oil pump, the test conditions for graded loading cannot be met. Therefore, load control loading is adopted throughout the process, and no load holding time is set. Photo of the component loading device and position of loading point.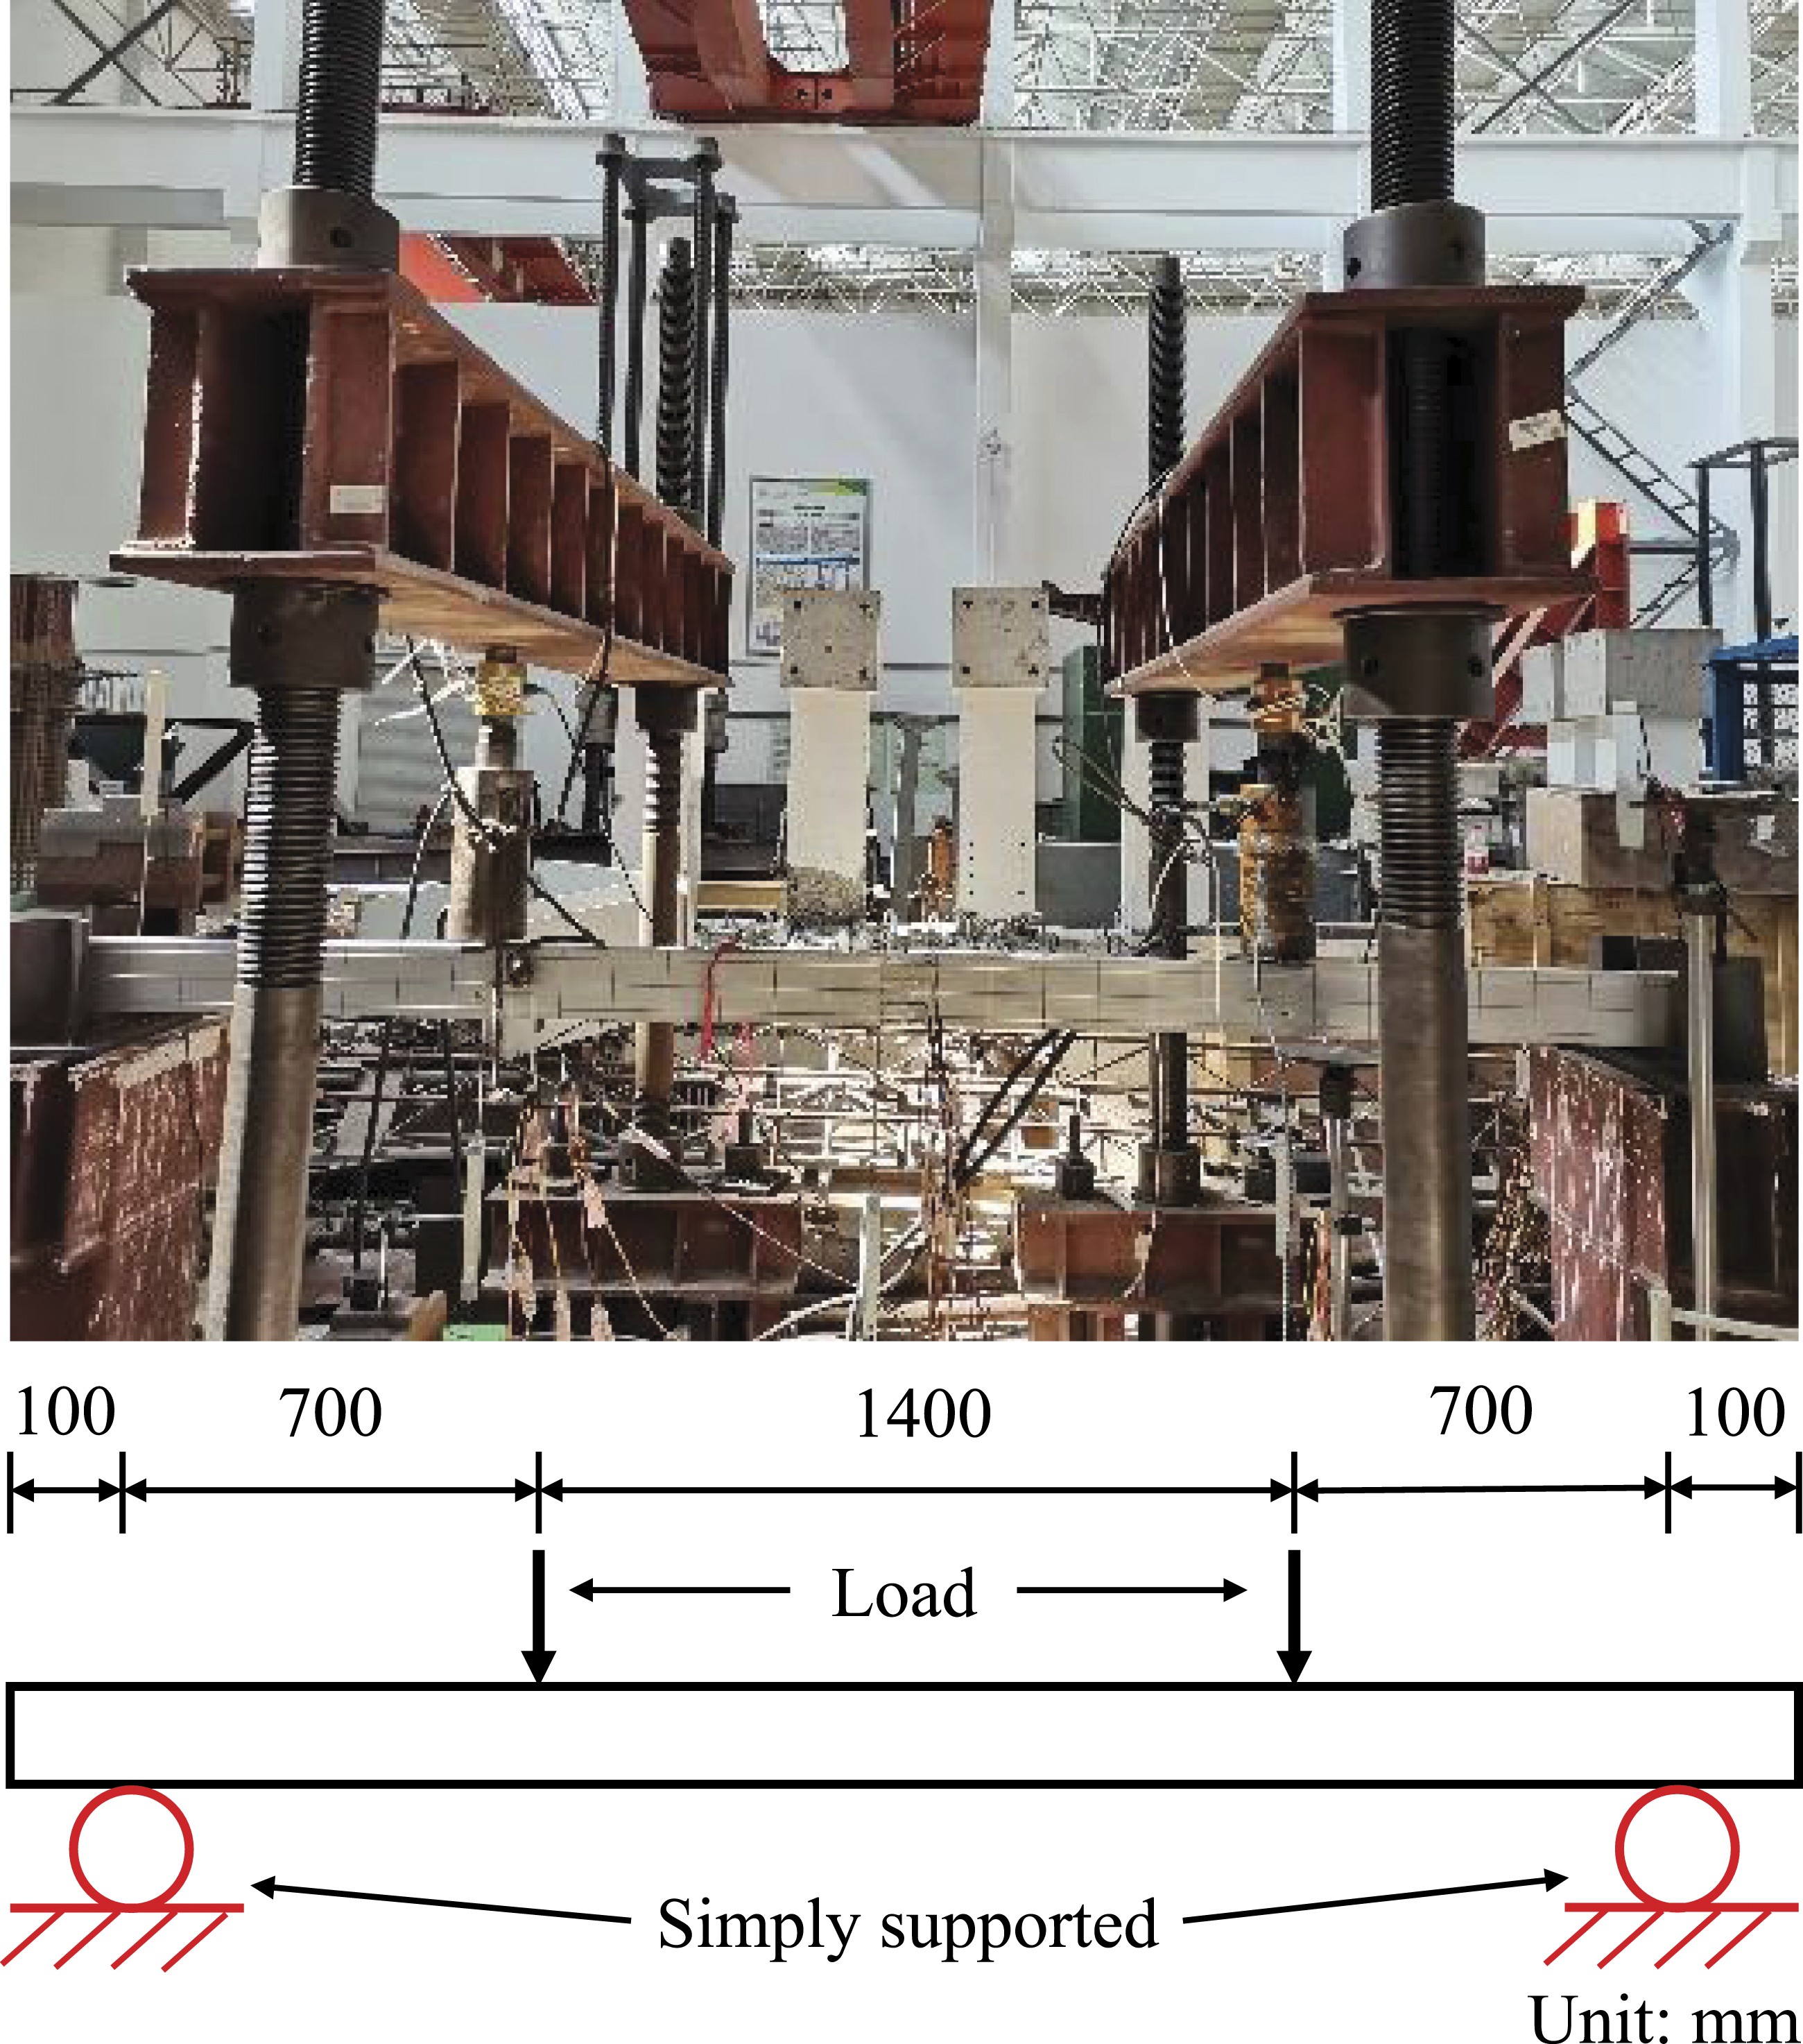
The measurement system of flexural members with different sections is shown in Figure 5, including the displacement gauge’s layout position and the strain gauge’s pasting position. Displacement meters are arranged at the 1/4 span and midspan of the bottom surface of the member to measure the deflection change of the member during loading. In addition, two displacement meters are symmetrically arranged at the end of the member to measure the warping of the end of the member. Strain flowers are symmetrically arranged at the member’s quarter-point to measure the bending-shear section’s principal stress. Several strain gauges are placed on the four sides of the midspan to measure the strain development of the pure bending section. The layout of the measurement system for test components.
Experiment results and discussion
Basic material properties of 6A13-T6
Tensile test results.

Note: The average elongation after fracture does not include the data of the sample with a thickness of 2 mm.

Typical stress-strain curve (Ramber-Osgood (W., 1943) model is adopted for prediction curve and Steinhardt (Steinhardt, 1971) recommended method is adopted for strain hardening index).
Test results of the curtain wall section beams
Figure 7 shows the test piece’s failure mode and load-displacement curve. The failure mode of the S1-L3000 is mainly strength failure (S). During the test, the S1-L3000 member has a large overall bending along the span, but there is no obvious local buckling phenomenon. The reason is the width-to-thickness ratio of the S1-L 3000 member is small, and the small stiffening ribs protruding locally outside the section have a reinforcing effect. When the load is continued, local bulging and cracking will occur at the loading point, and the component will be damaged when the load increase is small. The concentrated load causes this phenomenon. In addition, it can be seen from Figure 7(a) that the load-deflection curve of the S1-L3000 member is composed of linear and nonlinear sections. Finally, the load stops when local bulging and cracking occur at the loading point, and the ultimate load is close to 19 kN. Results of curtain wall section beams under bending; (a) failure mode; (b) load-displacement curve.
The failure mode of the S2-L3000 member is mainly local buckling(L). During the loading process, the S2-L 3000 member has a large overall bending phenomenon along the span. There are many obvious local buckling phenomena at the loading point and the middle of the span. Specifically, the top plate of the member has a wavy bulge and depression along the span direction, but the bulge is not as obvious as the depression. In addition, the lateral plate at the loading point is bulging. The reason is the width-to-thickness ratio of the S2 section is large, which leads to local buckling. At this time, although it can be seen from Figure 7(b) that the load-deflection curve is still in the linear stage, the member has undergone significant and disturbing deformation. It can be seen that the bearing capacity of the member is controlled by local stability, and the failure mode is the failure mode of the coupling of global bending and local buckling. Subsequently, personnel evacuated the dangerous area and continued loading. In the case of a small load increase, the member will buckle and crack locally. Finally, the ultimate bearing capacity of the S2-L3000 member is slightly greater than 13.5 kN.
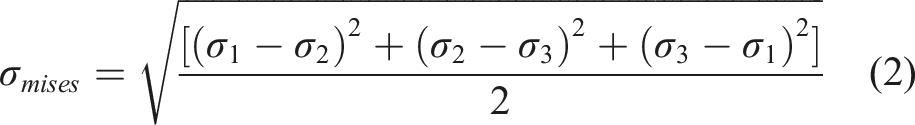
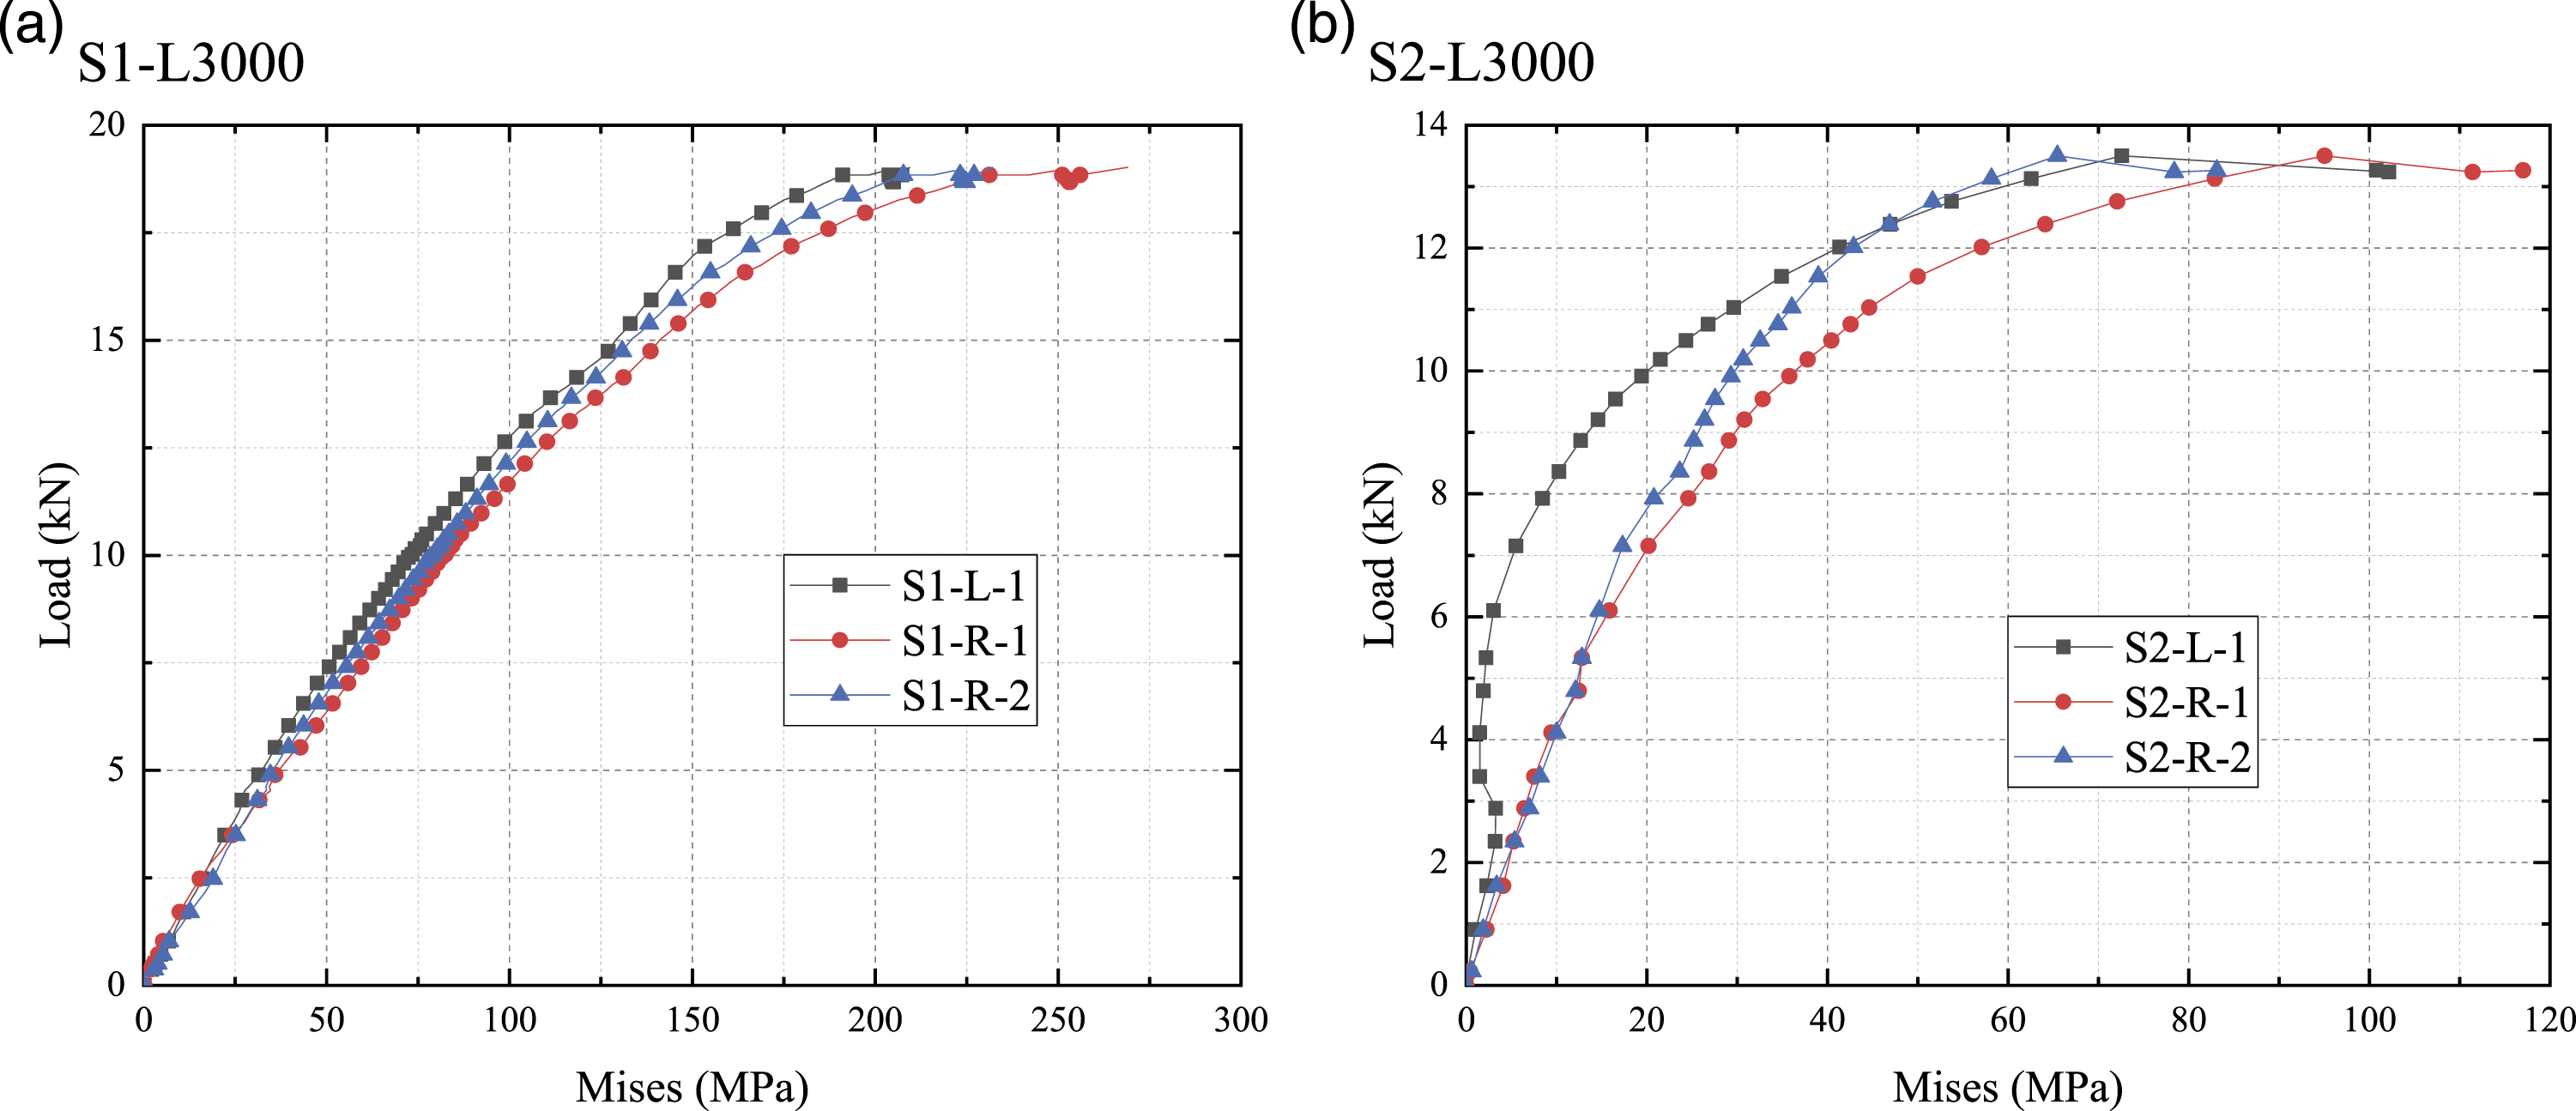
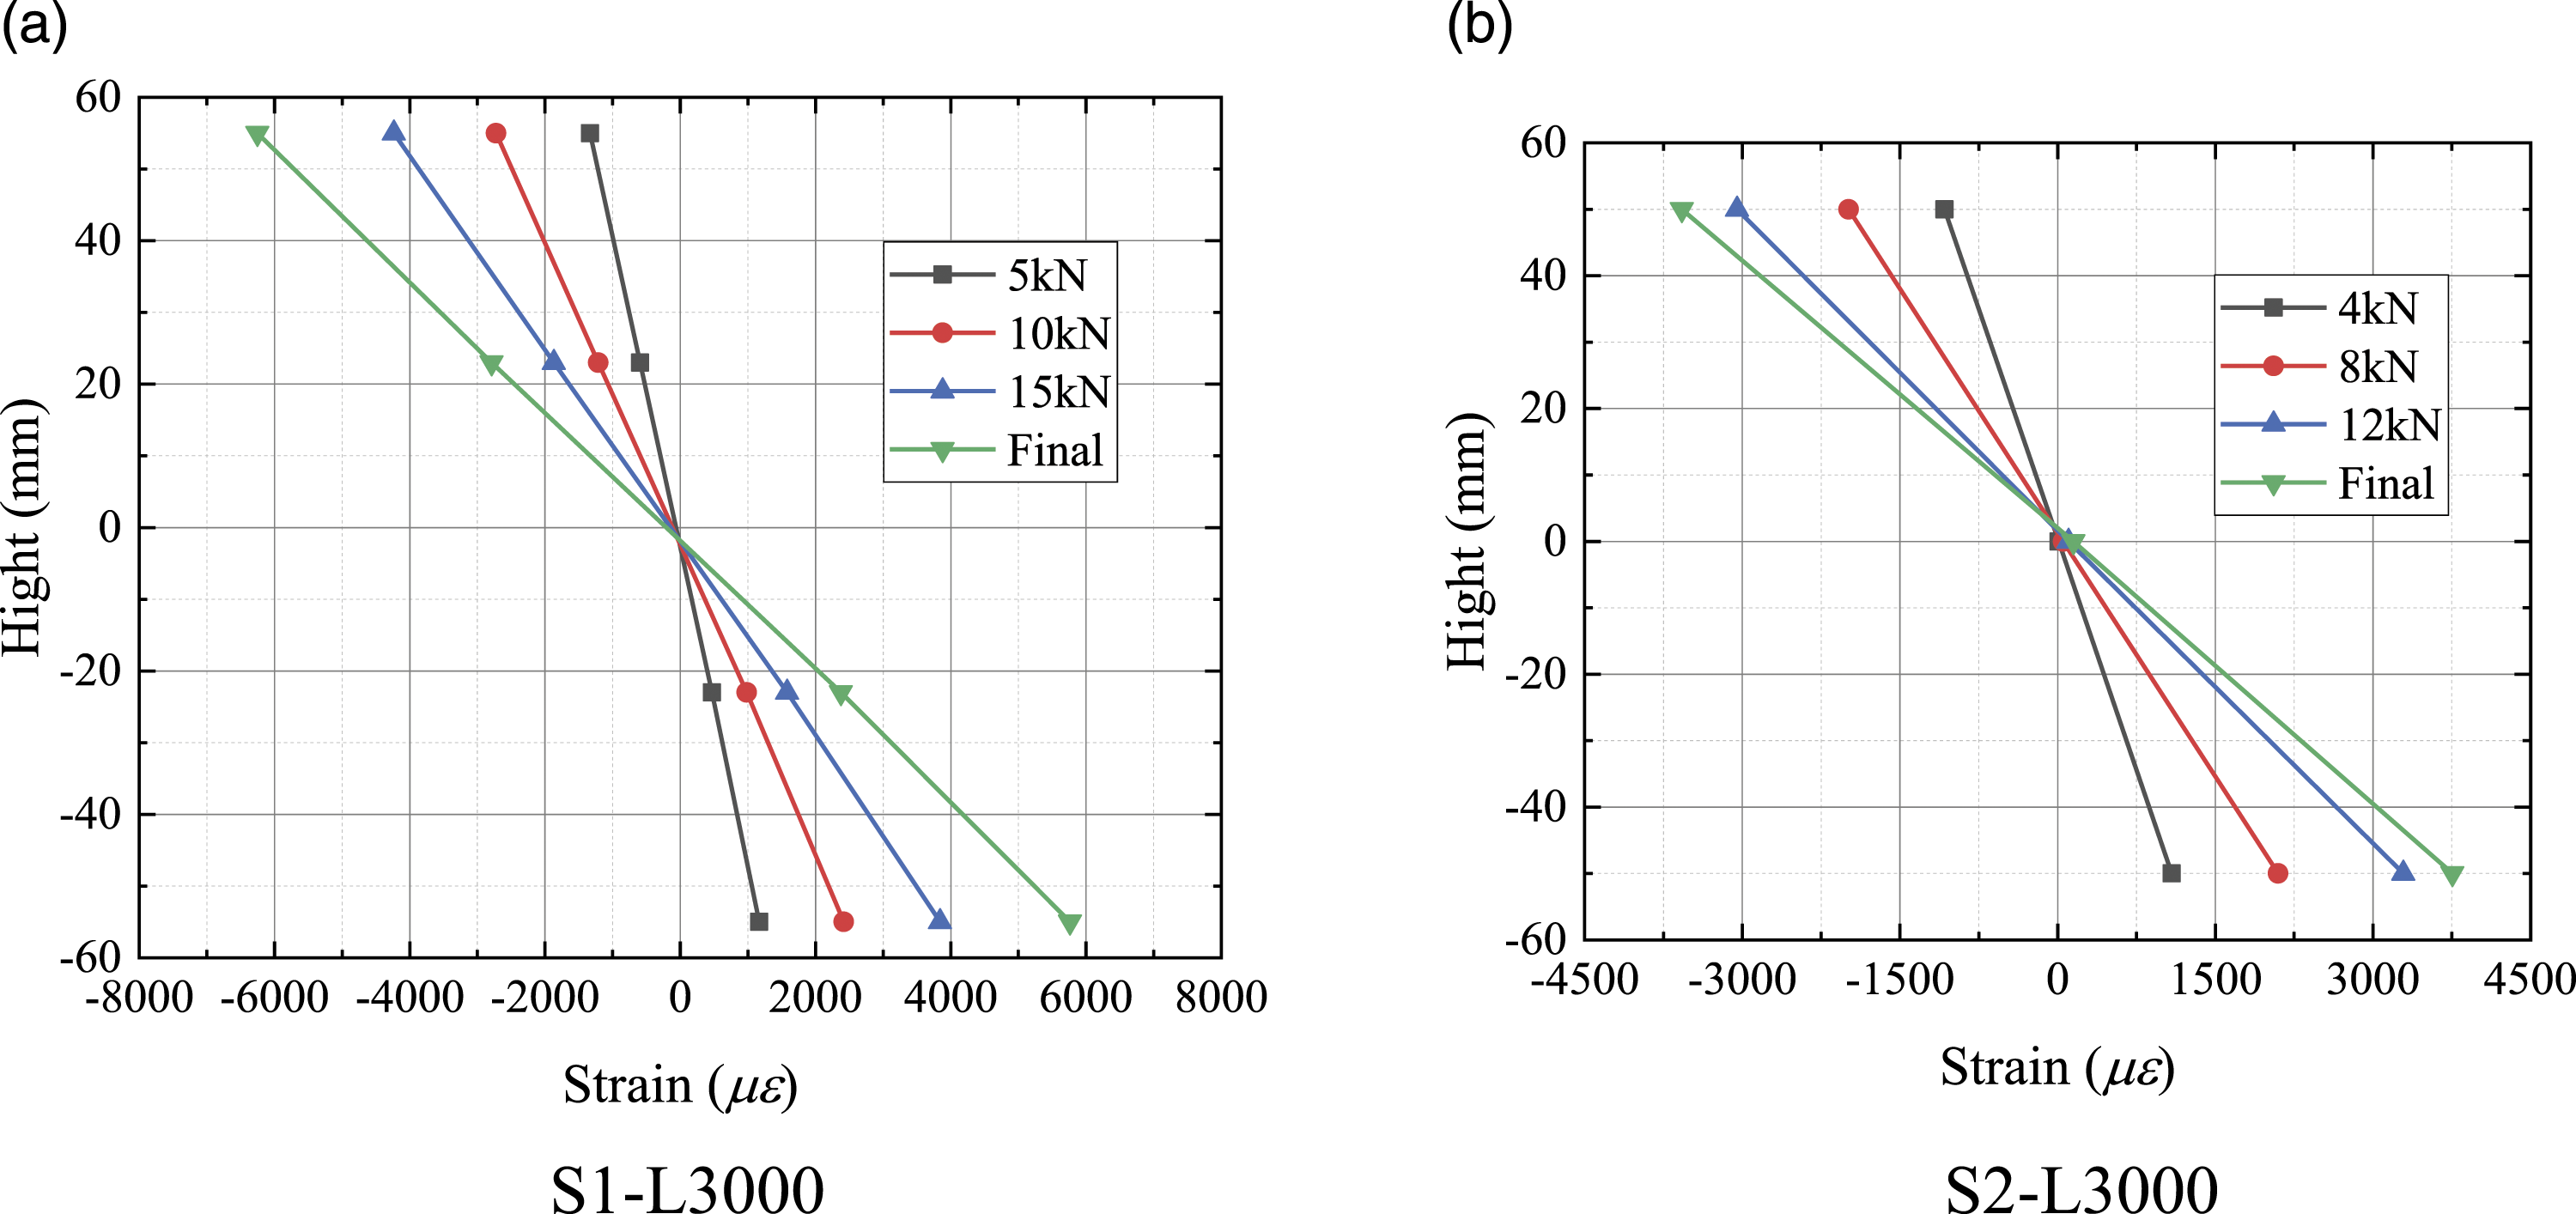
Due to space limitation, this study only gives the load-equivalent stress curve of the bending shear section and the strain of the side plate of the midspan section changing with different loads. Use the formula (1) and (2) to convert the strain measured by strain flower into equivalent stress. The results are shown in Figure 8. There are obvious “linear segment,” “elastic-plastic segment,” and “horizontal segment” in the load-equivalent stress curve of the S1-L3000 member. In addition, at the later stage of the test loading, the equivalent stress at the measuring point reaches 270 MPa. The equivalent stress of each measuring point of the S2-L3000 member is well symmetrical in the early and late stages of loading. Still, there is a certain difference in the equivalent stress of the measuring points on the left and right sides of the member in the middle stage of loading. In addition, there are obvious “linear segment”, “elastic-plastic segment” and “horizontal segment” in the load-equivalent stress curve. However, when the test stops loading, the equivalent stress does not exceed 120 MPa, which is far from reaching the f0.2 of the material. This fact further indicates that the bearing capacity of the S2-L3000 members is controlled by local buckling. However, at this time, with the increase of load, the equivalent stress increases rapidly, indicating that the ultimate load is approaching. As shown in Figure 9, the midspan section meets the plane section assumption at each load stage. The strain of each measuring point increases with the increase of load. Under the final load, the strain of the top and bottom measuring points has entered the plastic stage. In addition, as the load increases, the neutral axis position changes slightly. Among them, the neutral axis of the S1-L3000 component changes very little, while the S2-L3000 component moves up slightly. The difference between the two sections leads to this result. Load-equivalent stress curve. Strain distribution of side plate of midspan section of members under different loads.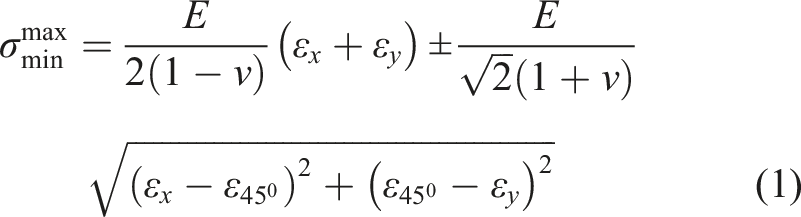
Ultimate bearing capacity and comparison of Chinese code
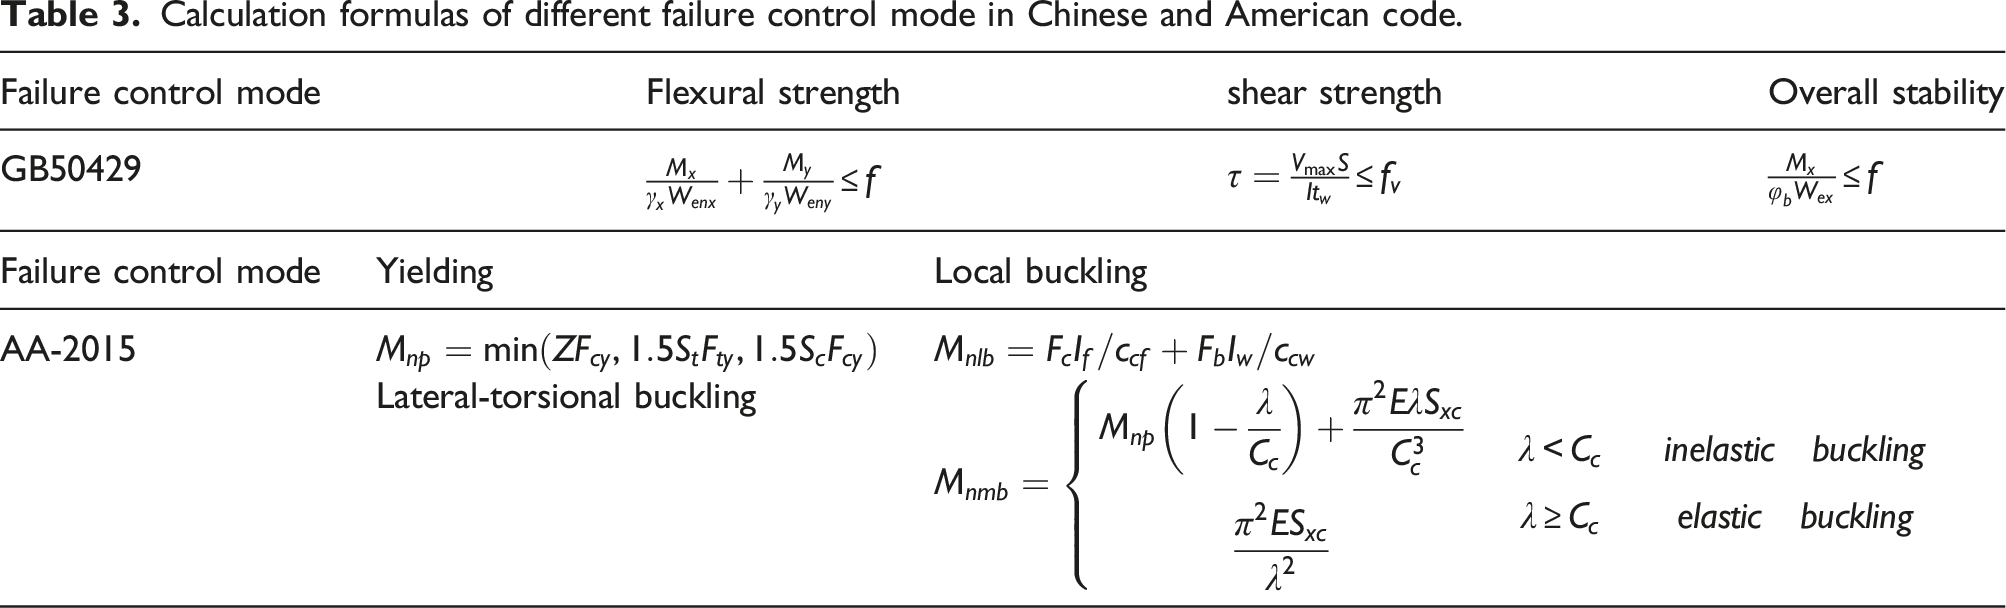
Calculation formulas of different failure control mode in Chinese and American code.
Comparison between ultimate bearing capacity test value and code calculation value.
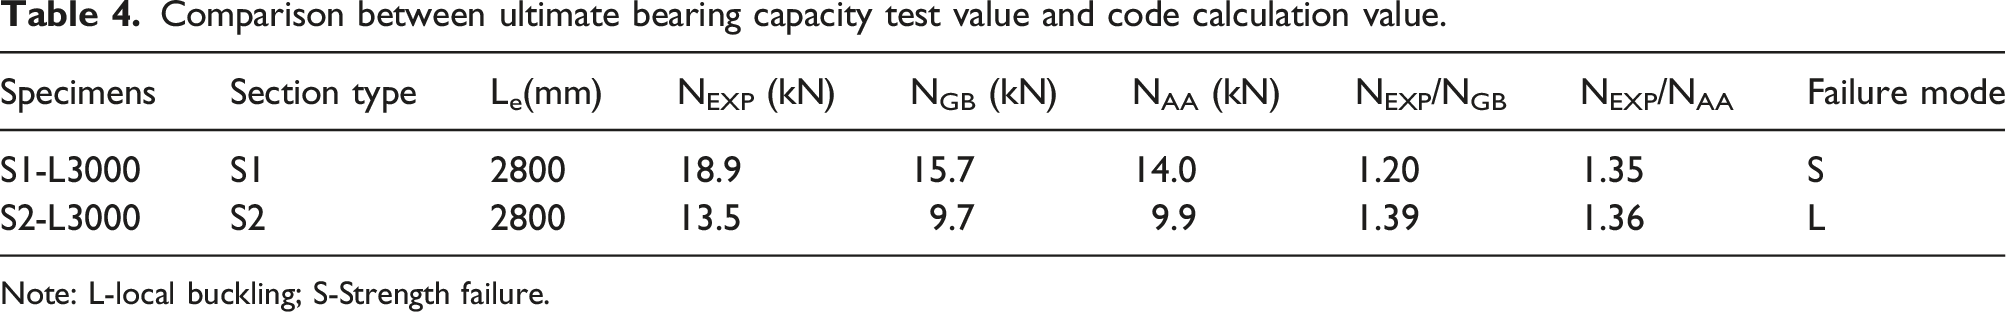
Note: L-local buckling; S-Strength failure.
Numerical simulation verification
Establishment of finite element model
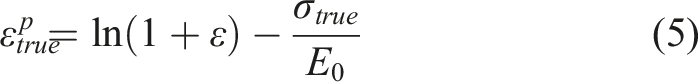
The 6A13-T6 high-strength aluminium alloy bending beam’s finite element model was established using the large-scale general finite element software ABAQUS. The finite element model considers the influence of initial geometric defects and takes the first-order global buckling mode as the global bending defect and the first-order local buckling mode as the local defect. Jack loading is simplified in the model to a steel plate simulation with a reference point. The reference point is located directly above the steel backing plate and is coupled to constrain 6° of freedom of the upper surface of the steel backing plate. Surface contact is adopted between steel plate and aluminium alloy. The contact attribute is set to: the normal direction is “hard” contact; the Tangential is friction penalty contact (friction coefficient is 0.1). A plane-cutting member is used in the finite element model to simulate the boundary conditions of the bearing fixture. The cutting position is the bearing fixture, and the constraint conditions are imposed on the dividing line. The boundary is set as lateral displacement constrained by the side plate divider; At the contact between the lower flange of the member and the support, three line displacements are constrained at the right end, and two line displacements are constrained at the left end. The material constitutive model of the model adopts the Ramber-Osgood model (Ramberg, 1943), as shown in (3). As described above, the strain hardening index is a simple method recommended by Steinhardt (1971). The material parameters are taken according to the results of the material property test, and the engineering stress-strain and the real stress-strain are converted according to equations (4) and (5).
Due to the limitations of the experimental conditions, the overall and local defects of the test components are not measured in this paper. However, many scholars have measured the test components in the existing studies (Wang, 2016; Zhao, 2016, 2019). At the same time, the Chinese code (China Standards Press, 2017) (GB/T 5237.1-2017(2017)) also stipulates the defects of aluminium alloy components with different accuracy. Referring to the existing research results, the amplitude of the initial defect of the tested component is assumed. Finally, the assumed defect amplitude is evaluated based on the test and simulation results. The initial defect amplitude is assumed as follows: S1-L3000 components do not consider the impact of local defects but only the overall defects' impact. And 0.5% of the component length is taken as the amplitude of the initial defect. The reason is small stiffeners protrude on the outer surface of section S1, and the test shows that the failure mode is dominated by overall bending. For the S2-L3000 member, 1% of the member length is used as the amplitude of the overall bending defect, and 0.6% of the section width is used as the amplitude of the local defect.
The finite element model is composed of steel base plates and components. The steel base plate is simulated by solid element C3D8R, and the S4R shell element simulates the aluminium alloy component. The elastic modulus of the steel base plate is large, and the sensitivity to the grid size is low, so the grid size is determined to be 10 mm. The grid sensitivity analysis results of components are shown in Figure 10 (Windows 64-bit operating system with 8-core and 8-thread Intel (R) core (TM) i7-9700 and 16g RAM). Considering the analysis accuracy and the required time cost, the mesh size of the finite element model of the S1-L3000 component is finally determined to be 10 mm. Because the S2-L3000 member has stiffening ribs with a small size, its grid size is defined as 5 mm. The effect of different mesh sizes on simulation: Nu,FEA represents the ultimate bearing capacity obtained by finite element analysis, and time represents the time required for operation.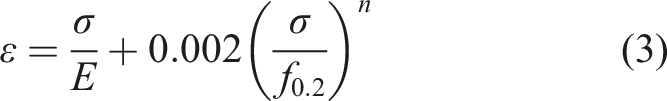


Verification of finite element model
It can be seen from Figure 7 that the slope of the simulation curve and test results is close, indicating that the finite element simulation can better simulate the overall stiffness of the component. When the S1-L3000 member has a large deflection, the test stops loading. However, with the development of plasticity, the S1-L3000 members can continue to bear. This phenomenon is confirmed by the load-displacement curve obtained by finite element simulation, and the deviation between the two bearing capacities is less than 1%. For the S2-L3000 component, there is some deviation between finite element simulation and test results. The possible reasons are that the local defects of the test member are more minor than those imposed by the finite element model, and the material strength of the member is larger than the average value of the material property test. However, the difference in bearing capacity between the simulation and test results is less than 12%, and the prediction accuracy is significantly higher than the standard calculation results. In addition, it can be seen from Figure 11 that the finite element method can well simulate components’ global bending and local buckling. In conclusion, the modeling technology adopted in this paper is reasonable. Comparison of failure modes between test and finite element simulation.
Finite element parametric analysis
In the finite element simulation, it was found that the stiffener of the member had little effect on the ultimate bearing capacity and failure mode, so the selection of section form was adjusted in the parametric analysis. The object of parameter analysis in this section is the square aluminium alloy pipe members commonly used in engineering. The section width of the members is 60–200 mm, the thickness is 2–8 mm, and the length is 1000–5000 mm. And the loading mode of the model is three-point bending. In addition, 1% member length is used as the amplitude of overall bending defects, and 0.6% of section width is used as the amplitude of local defects.
According to the calculation of the China code, the limit value of the effective width-to-thickness ratio of components is 18.1. Combined with the figure below, the influence of the width-to-thickness ratio can be analyzed. As can be seen from the Figure 12, the ratio of the bearing capacity calculated by the finite element and the standard decreases with the increase of the width-to-thickness ratio. For effective members with full section, the bearing capacity ratio tends to decrease with the increase of the slenderness ratio when the width-to-thickness ratio is the same, but the change is little. However, for the large-width component, the changing trend is the opposite. Secondly, for effective members with full sections, the bearing capacity predicted by the code is very conservative, and the bearing capacity ratio is more significant than 1.3. For the members requiring thickness reduction, the bearing capacity predicted by the norms is also relatively conservative, and the bearing capacity ratio is concentrated around 1.18. At the same time, only a few members have a bearing capacity ratio of less than 1.0, and they are all members with a large width-to-thickness ratio and a small slenderness ratio. In addition, it can be found from the statistical analysis that the maximum carrying capacity ratio is 1.736, the minimum is 0.751, the mean is 1.283, and the coefficient of variation is 0.125. The reason for the conservative bearing capacity predicted by the code is that the Chinese code does not allow the plastic zone in the section of the flexural member. In the finite element simulation, when the section enters the plastic, the member will be able to bear a greater load with the expansion of the plastic zone. As shown in Figure 13, the finite element simulation results show that under the peak load of the member, most of the mid-span section of the member enters a plastic state, giving full play to the bearing capacity of the material. The American code allows a certain degree of plastic development in the section of the member, so the bearing capacity ratio is smaller, and the dispersion of the results of the parameter analysis is smaller. However, the carrying capacity predicted by the American code is still conservative. According to the statistical analysis, the maximum carrying capacity ratio is 1.359, the minimum is 0.850, the mean is 1.207, and the coefficient of variation is 0.0542. The essence of the above phenomenon is that the aluminum alloy has a strong strain-strengthening effect after reaching the nominal buckling strength. At the same time, the section with large width is prone to local buckling, and its plastic development degree is low, affecting the member’s bearing capacity. When the width and thickness ratio is small, the plate group effect between the plates will be more substantial, the overall resistance of the section to local buckling will be improved, and the overall bearing capacity of the member will be greater. The above conclusions can also be seen in Figure 14: (1) Due to the influence of local buckling, the section plastic zone of the B160-T4-L1500 member is smaller than that of the B160-T6-L1500 member under peak load. (2) Due to the effect of the plate group, the section plastic zone of the B60-T4-L1500 member is more significant than that of the B160-T4-L1500 member. Finite element parameter analysis results: (a) NFEA/NGB; (b) NFEA/NAA. Stress and strain distribution of midspan section of member B160-T8-L5000 under peak load: (a) Mises stress; (b) Strain; (c) Stress. Mises stress distribution of typical member midspan section under peak load: (a) B160-T6-L1500; (b) B160-T4-L1500; (c) B60-T4-L1500.


The square section is a biaxial symmetric closed section, so the member has significant out-of-plane stiffness and strong lateral overturning resistance. Therefore, when calculating its stable bearing capacity, it is only necessary to carry out the section strength check calculation without the overall stability check calculation of the member. The Chinese code does not allow the plastic zone in the section of bending members. The section plastic development coefficient is taken as 1.0, which wastes the material strength of components to a large extent and is not conducive to the economy of structural design. Therefore, equation (3) is modified according to the results of parameter analysis. Figure 15 shows the parameter correction curve for square aluminium alloy pipe members. It can be seen from the figure that since only the section plastic development coefficient is modified, the COV of the bearing capacity ratio is constant. The mean bearing capacity ratio decreases gradually with the increase of, when Effect of 
Conclusion
This paper reports the experimental study on the material tensile properties and flexural members of 6A13-T6 new high-strength aluminium alloy, as well as the finite element parameter analysis results. The test and simulation results are compared with the calculation results of the Chinese and American aluminium alloy structural design method. Its applicability to 6A13-T6 high-strength aluminium alloy square beams is discussed in depth. The principal discoveries are as follows: (1) The f0.2 of 6A13-T6 can reach 340 MPa, the ultimate strength can reach 352 MPa, and the average elongation after fracture is close to 14.5%, showing superior strength and ductility. The material constitutive model of 6A13-T6 can adopt Ramber-Osgood[16] model, and the strain strengthening index can adopt the method recommended by Steinhardt[17]. (2) The failure mode of the S1-L3000 member with a small section width-to-thickness ratio is an overall bending failure, which belongs to strength failure. For the S2-L3000 member with a large width-to-thickness ratio, the failure mode of the member is the coupling failure mode of the global bending and the local buckling. When S2-L3000 has significant local buckling deformation, the member material is still basically in an elastic state, but the disturbing deformation can be considered that the member has failed. (3) The bearing capacity predicted by the Chinese aluminium alloy design code for 6A13-T6 high-strength aluminium alloy flexural beams is conservative. The reason is that the Chinese code takes too much account of the influence of local buckling, the equivalent thickness is too small, and the impact of section plastic development is not considered. The bearing capacity predicted by the American code is also conservative, because the prediction of the degree of plastic development of the section is insufficient. (4) The numerical simulation results show that this paper’s finite element modeling technology is reasonable and feasible. When the section enters the plastic state, with the development of the plastic zone, the member will be able to bear a more significant load. Local buckling will affect the development of the plastic area and limit bearing capacity improvement. The stronger the section’s plate group effect is, the greater the bearing capacity of the member. (5) The average value of the bearing capacity ratio calculated by the finite element method to that calculated by the code is 1.283, only a few of which are less than 1.10. The author suggests that the section plastic development coefficient in the Chinese code should be increased to 1.15.
Footnotes
Acknowledgements
In addition, special thanks to Tongxi Group Co., Ltd. for providing the test components. The test work was carried out in the Civil Engineering Laboratory of Southeast University. Special thanks to the laboratory for providing test sites and test instruments.
Declaration of conflicting interests
The author(s) declared no potential conflicts of interest with respect to the research, authorship, and/or publication of this article.
Funding
The author(s) disclosed receipt of the following financial support for the research, authorship, and/or publication of this article: This work was supported by the China’s National Natural Science Foundation (Grant No. 51978151 and 51538002).