
Abstract
The research question revolves around accurately predicting the shear capacity of RC beams and enhancing the reliability of such prediction models. This study aims to refine the accuracy of the RC beam shear capacity model. To augment the safety margin, the enhanced model underwent further calibration through a reliability analysis. The shear strength models, rooted in Bayesian theory’s Markov Chain Monte Carlo (MCMC) method and the Modified Compressive Field Theory (MCFT), were introduced. A research database was curated from test data of 782 RC beams sets under shear stress. From this database, six mechanism models were juxtaposed with the MCMC models for comparison. To meet the desired reliability indexes (
Introduction
Research on the shear capacity of reinforced concrete beams has spanned over a century, with numerous scholars contributing to its understanding (Committee, 1962a, 1962b; Froehlich et al., 1909; Gamble and Ramirez, 1998; Hsu, 1988, 1996; Joint ASCE-ACI Task Committee 426, 1973; Kotsovos et al., 2015; Muttoni and Fernández Ruiz, 2008). Despite the myriad of semi-empirical shear capacity models proposed, grounded in both theoretical and experimental data, certain conservative design codes still raise potential safety concerns (Anderson, 1957; Rokugo et al., 2008).
In recent years, researchers have intensively focused on enhancing the predictive capabilities of models for determining the shear capacity of RC beams. Among various methodologies, Artificial Neural Networks (ANN), Genetic Algorithms (GA), Fuzzy Inference, Monte Carlo Markov Chain (MCMC) have emerged as prevalent tools for this purpose (Bashir and Ashour, 2012; Chabib et al., 2006; Fang et al., 2022; Kara, 2011; Nasrollahzadeh and Basiri, 2014; Nehdi et al., 2007). The MCMC method, distinct from typical machine learning approaches, grounds itself in deterministic, mechanistic, and theoretical foundations, allowing for a nuanced and interpretative model analysis. Several scholars have harnessed the MCMC approach to predict shear performance in reinforced concrete. For instance, Wang et al. (2023) integrated the MCMC method to analyze the finite element model of RC beams established by ABAQUS, comparing it against static test findings. Similarly, Liu (Liu et al. (2020) constructed a probabilistic shear capacity model, utilizing MCMC, and based their findings on a vast collection of 691 test data sets for deep beams. The probabilistic model using MCMC sampling procedure was proposed for estimating the value if strut efficiency factor in the strut-and-tie model (STM). Yu et al. (2018) further expanded upon this by devising a shear capacity model using the Modified Pressure Field Model (MCFT), which incorporated both objective and subjective uncertainties via the MCMC methodology. Although these developments provide innovative solutions to calculating the shear capacity of RC beams, challenges persist. Precisely identifying the contribution of each component, from the initial cracking to the onset of shear damage, remains elusive. This necessitates a comprehensive exploration into the shear contribution, imperative for model refinement and broader implementation. Wu’s work (2018), which implemented strain gauges in RC beams’ stirrups, and the evaluations of Yuan and Yi (2020) have offered valuable insights. Nevertheless, combining the regression probability model with shear contribution metrics is a pivotal progression for detailed mechanical scrutiny. A notable omission in these studies is the lack of consideration for model reliability.
Numerous academics have delved into the reliability of design models. Nathaly (Narváez et al., 2020) applied the Monte Carlo method alongside the first order second moment reliability method to evaluate the reliability of FRP beams. These were analyzed under codes ACI 440.2R (Soudki and Alkhrdaji, 2005) and CNR-DT200 (CNR-DT 200 R1/2013, 2013) across varying load scenarios. In addition, a sensitivity analysis was conducted focusing on various factors to achieve the target reliability, further aiding design optimization. Similarly, Shahnewaz (Nasrollahzadeh and Aghamohammadi, 2018) fine-tuned the four FRP shear capacity models using Genetic Algorithms, ensuring the resistance factors of the shear design equations met a standard of structural safety. Yuan (Yuan and Yi, 2017) fine-tuned the GB50010 by employing the first order second moment reliability method. This calibration utilized an RC beam shear test database sourced from both domestic and international literature.
Building on these studies and employing the MCFT theory and the MCMC method, shear capacity models of RC beams have been developed, with an emphasis on the contributions of shear components. These models underwent assessment using both the Monte Carlo method and the first order second moment reliability method across a spectrum of load combinations. From the reliability analysis, resistance factors tailored for these models were recommended to ensure structural safety in design. Additionally, the effects of individual variables on reliability were taken into account. Subsequent to these considerations, the reliability indexes for these models were calculated, with adjustments made to align with the target reliability indexes.
Research thought and methods
Research approach
To develop shear capacity models aligned with reliability design indexes and to ensure utmost precision, the primary research methodology is conceptualized as depicted in Figure 1. Initially, basic parameter indices were sourced from a comprehensive database of RC slender beams, facilitating the determination of prior parameter distributions. Using the probability distribution of these parameters and their specific values, an initial deterministic model was constructed rooted in the modified compression field theory (MCFT). This model was then adapted into the subsequent shear capacity model by MCMC method, taking into account uncertainties related to the principal tension strain and critical crack angle. For validation, this newly proposed model was juxtaposed against established academic models and national standards. An exploration was made on how the shear contribution of the model’s components varied depending on the characteristics of different stirrups. As a final step, resistance reduction factors of the RC beam shear capacity models were set in alignment with targeted reliability indices. These factors were derived through the Monte Carlo method and the first order second moment reliability method across diverse load combinations. Additionally, a sensitivity analysis was conducted to comprehend how various variables influence reliability. Overview of RC beams shear capacity modeling and its reliability analysis.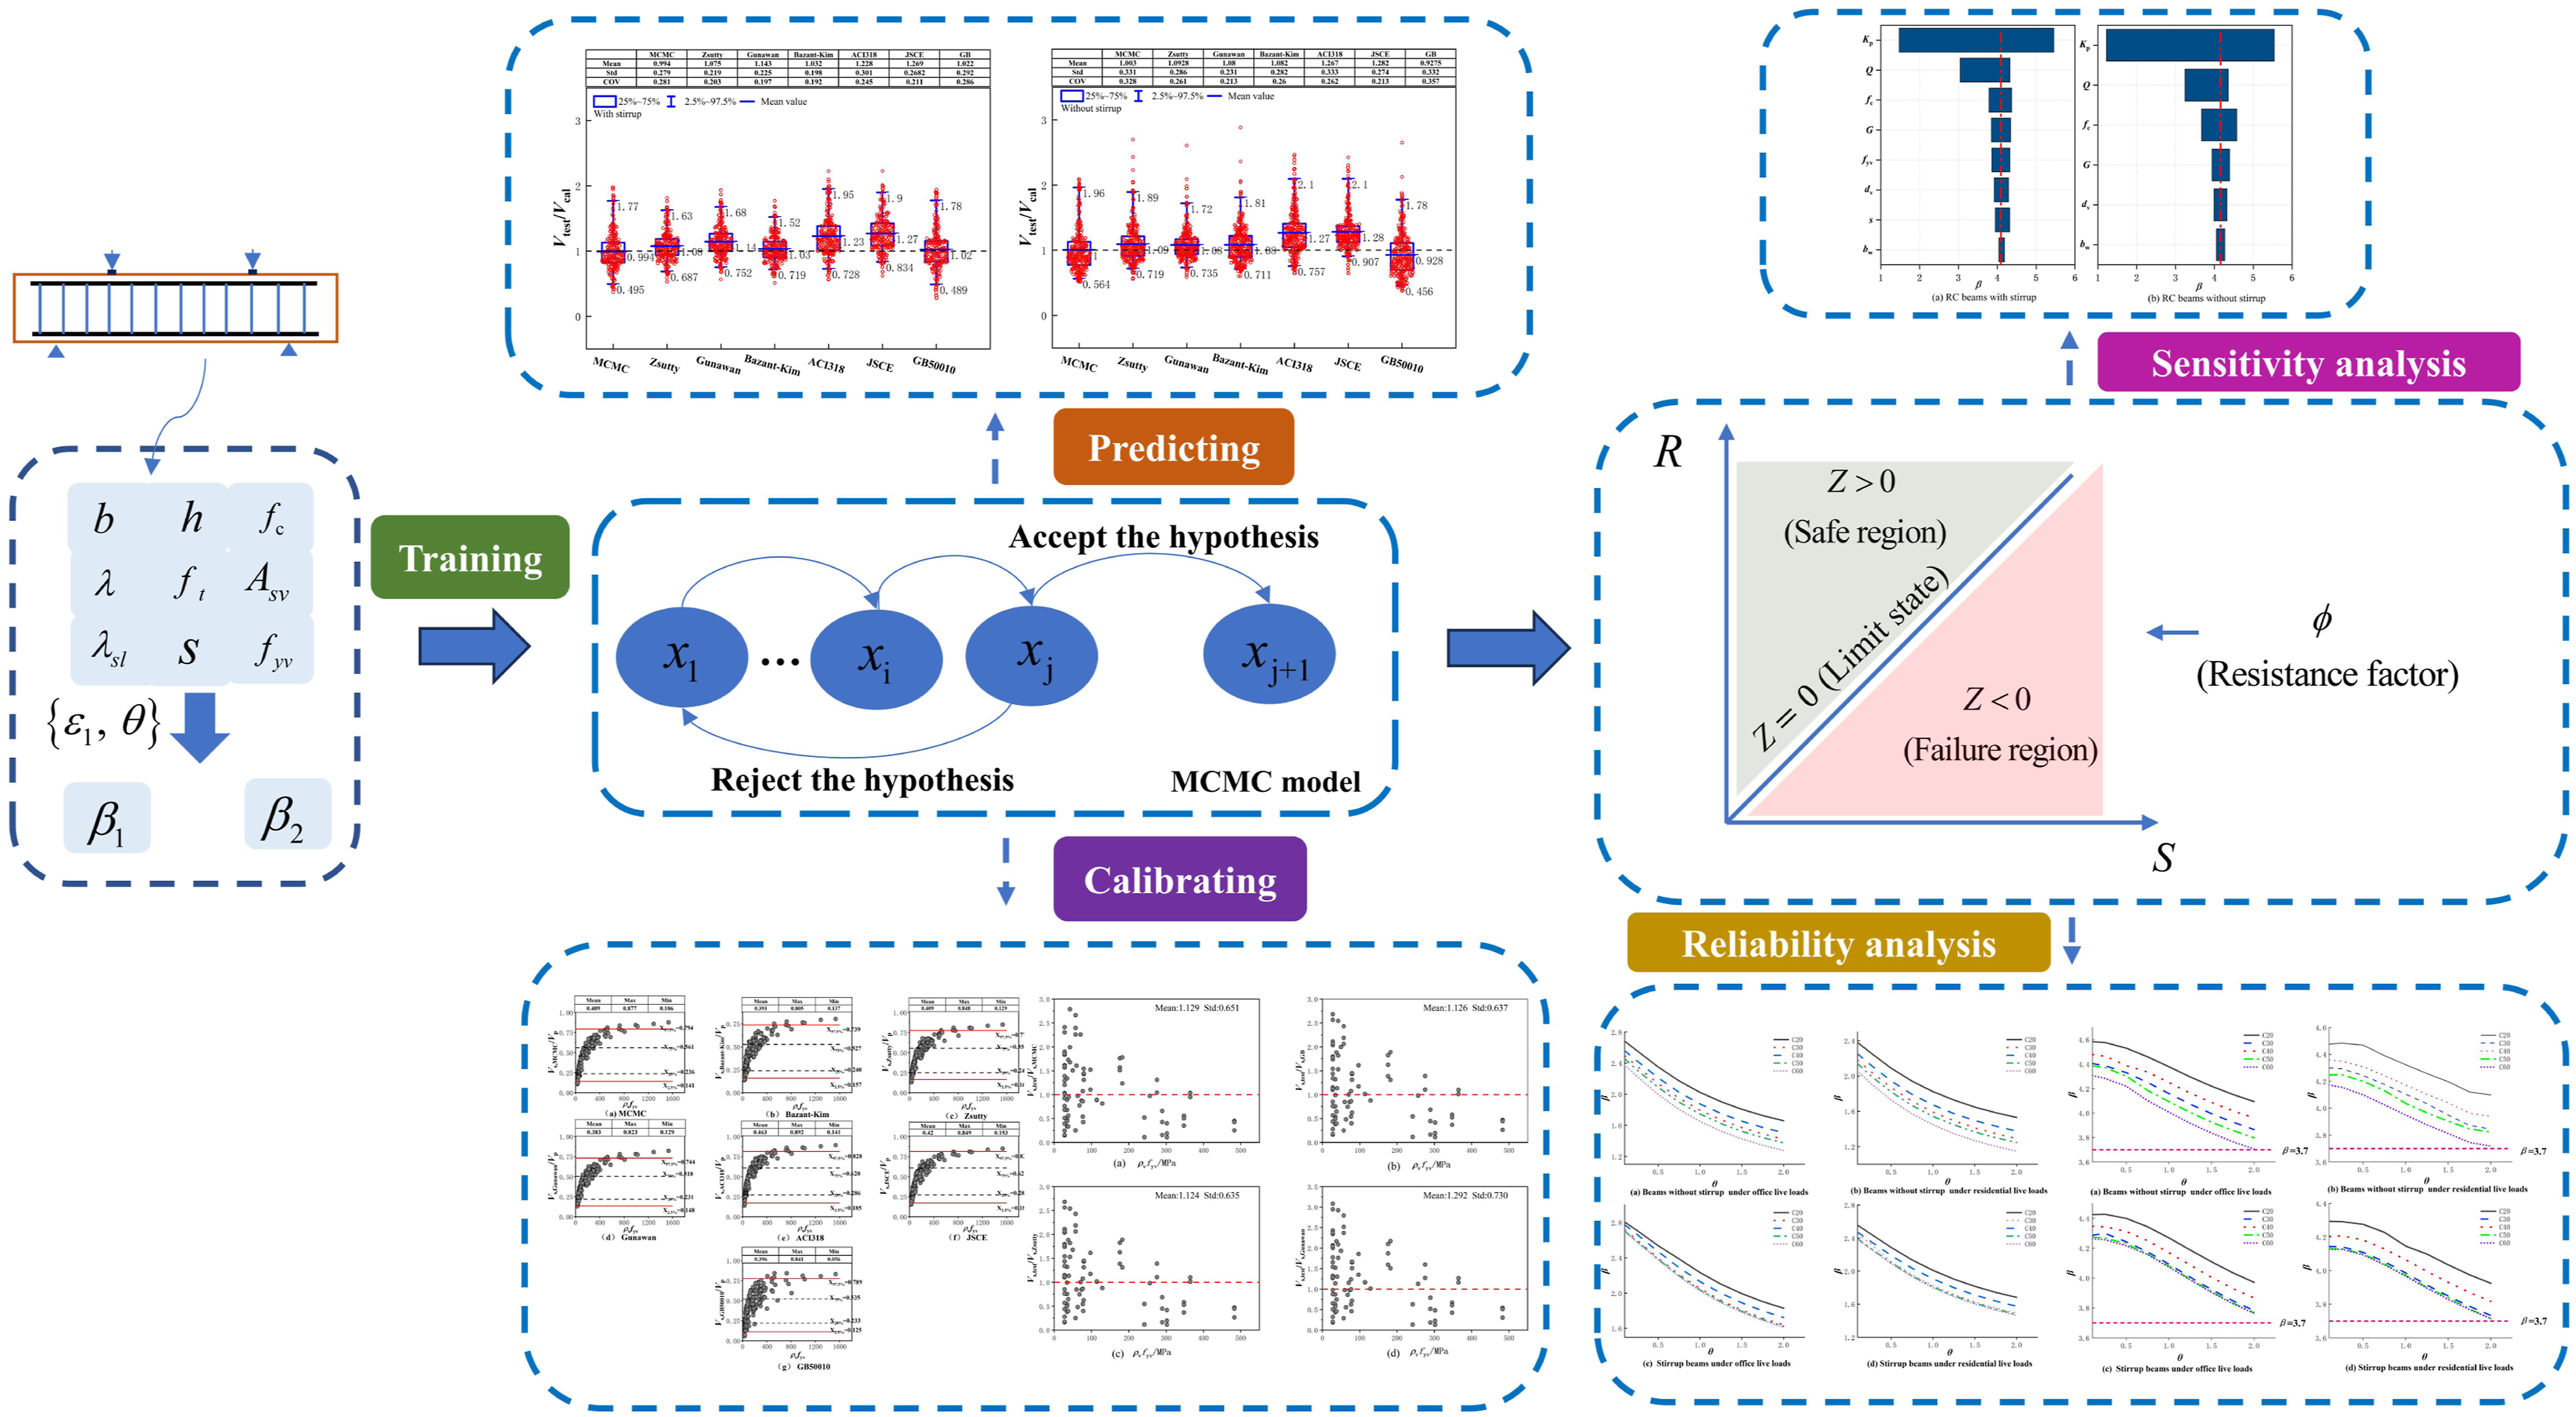
Experimental database of RC columns
For this research, 782 shear strength test results from RC slender beams were compiled form 66 published articles, as detailed in Appendix Table 2. These findings originated from diverse sources ranging from Ahmad et al., 1995; Alqarni et al., 2020; Arowojolu et al., 2021; Arslan and Polat, 2013; Bazant and Kazemmi, 2005; Bentz et al., 2010; Biolzi et al., 2014; Bukhari and Ahmad, 2008; Cao, 2001; Cladera and Mari, 2005; Deng et al., 2017; Dino et al., 2001; Ghannoum, 1998; Gunawan et al., 2020; Hassan et al., 2008; Hong and Han, 2005; Hu and Wu, 2017; Huber et al., 2019; Islam et al., 1998; Jain and Singh, 2013; Jeong et al., 2017; Kawamura et al., 2021; Rahal and Al-Shaleh, 2004; Kim et al., 2013, 2018; Knaack and Kurama, 2015; Lee et al., 2011, 2015, 2020; Lee and Hwang, 2010; Lee and Kim, 2008; Lim and Oh, 1999; Mahdi et al., 2015; Mawlood et al., 2021; Monserrat López et al., 2020; Morrow and Viest, 1957; Nawaz et al., 2019; Nouri et al., 2021; Papia, 2004; Perera and Mutsuyoshi, 2013; Placas and Regan, 1971; Pradhan et al., 2018; Rahal, 2006; Rahal and Elsayed, 2021; Regan and Reid, 2004; Roller and Russel, 1990; Rombach and Faron, 2019; Serna-Ros et al., 2002; Shabani Attar et al., 2020; Shah and Ahmad, 2009; Sherwood et al., 2007; Shin et al., 1999; Siew, 2011; Słowik, 2014; Sowik, 2012; Tan et al., 1997; Tavio, 2009; Thamrin et al., 2016; Vecchio and Shim, 2004; Wang et al., 2011; Yi and Liu, 2022; Yoshida, 2000; YU et al., 2013; Yun and Choi, 2016 to Zu, 2020.
The collected data includes 429 sets related to slender beams without stirrups and 353 sets concerning beams equipped with stirrups. Comprehensive parameters pertaining to these beams, such as section width, shear span-to-depth ratio, effective depth, concrete strength, and specifications regarding stirrups, were duly recorded in the database. To illustrate, stirrup ratios were observed to vary between 0.07% and 3.02%, concrete compressive strengths fluctuated between 19.7 and 197 MPa, effective depth ranges from 156 to 1925 mm, and the shear span-to-depth ratio is in the range of 2.5 to 10.4. A strict selection criteria ensured the accuracy and integrity of the dataset. The criteria prioritized RC slender beams that exhibited shear failures. In addition, only specimens that underwent one or two concentrated loads were considered, while those subjected to uniform or continuous axial loads were excluded. Moreover, the database deliberately omits beams that incorporated wastes, fibers, and FRP, apart from specific renewable coarse aggregates such as fly ash and bricks.
Modeling and calibration
Probabilistic prediction model of shear strength
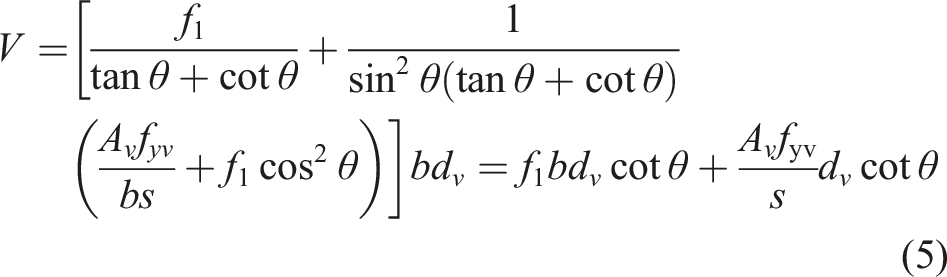
According to the modified compression field theory, the cross-section shear strength of beams is a combination of diagonal tensile stresses f1 and diagonal compressive stresses f2. When examining beams failing in shear, a micrometric body is chosen for stress equilibrium analysis. This results in the following equilibrium equation as derived from the stress Mohr circle (Bentz and Collins, 2006; Bentz et al., 2006; Wei, 2011):


In these equations, dv represents the minimum between the effective depth and the distance of crack-control bars. s is the stirrup spacing, and h and h0 represent the depth and effective depth of the beam section, respectively. The vertical unbalance force, carried by the stirrups, is defined by (Wei, 2011):

Incorporating equations (2) and (3) results in:
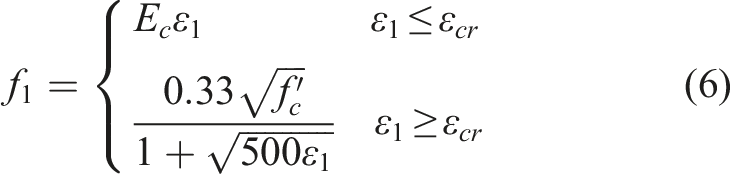
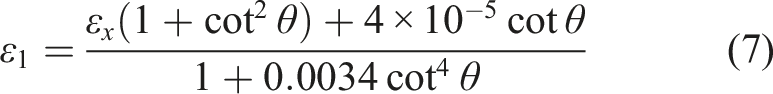
Further, the relationship linking average longitudinal strain with the principal tensile strain is (Wei, 2011):
Figure 2 illustrates the stress balance conditions and the Mohr circle for microelements in reinforced concrete. It’s evident that determining average principal tensile strain and the critical crack angle requires intricate iterative calculations. Stress balance condition and stress Mohr circle of microelement. (a) Concrete principal stresses (b) web tensile reinforcement (c) concrete stress Mohr circle of microelement.
Drawing from theoretical derivations and taking into account material properties, geometric dimensions, and uncertainties, a model was proposed to predict the principal tension strain and critical crack angle. This model is represented by:
According to Bayesian theory, and using available experimental data, it’s inferred that the prior 1) Choose the appropriate prior distribution 2) Generate random samples from the chosen prior distribution 3) Evaluate samples against specific criteria. If they meet the criteria, accept 4) Repeat the above steps until the desired sample size is achieved.
Statistical characteristics for posterior distribution of RC beams with stirrup.
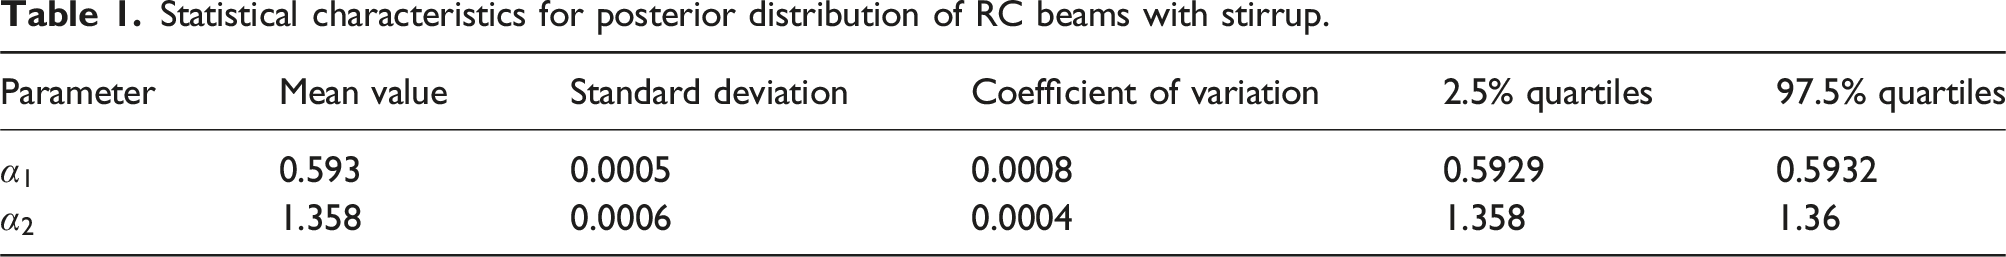
The results were presented in Table 1, were retained for further analysis. Using this data, the posterior model of RC beams equipped with stirrups can be deduced as: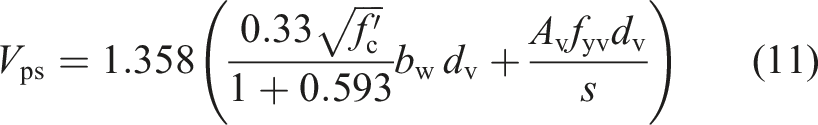
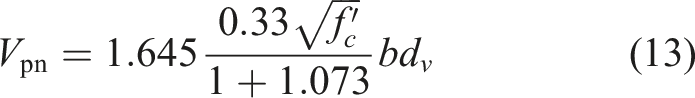
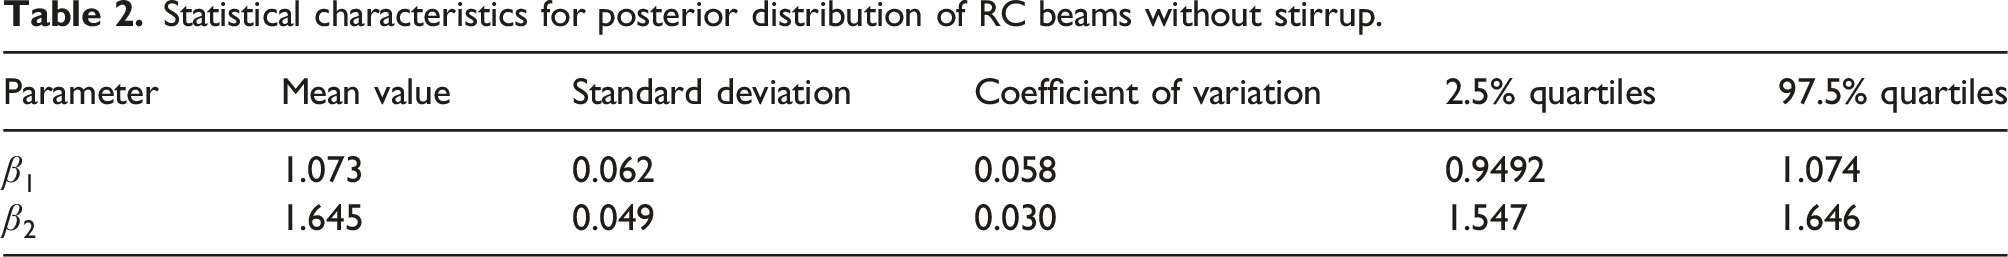
For beams without stirrups, a prior model to predict shear capacity is formulated: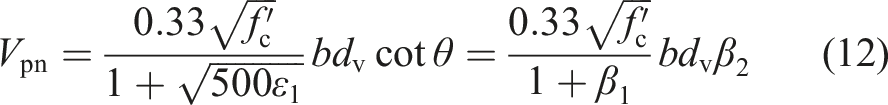
Statistical characteristics for posterior distribution of RC beams without stirrup.
Comparison
This section presents a comparative analysis using Figures 3–4, which illustrates the shear capacity results for beams with stirrup and without stirrup. Figures 3–4 depicts the x-axis as the sequence of model numbers and the y-axis as the normalized result—specifically, the ratio of the tested to the calculated shear strength ( Overall prediction results for beams with stirrup. Overall prediction results for beams without stirrup.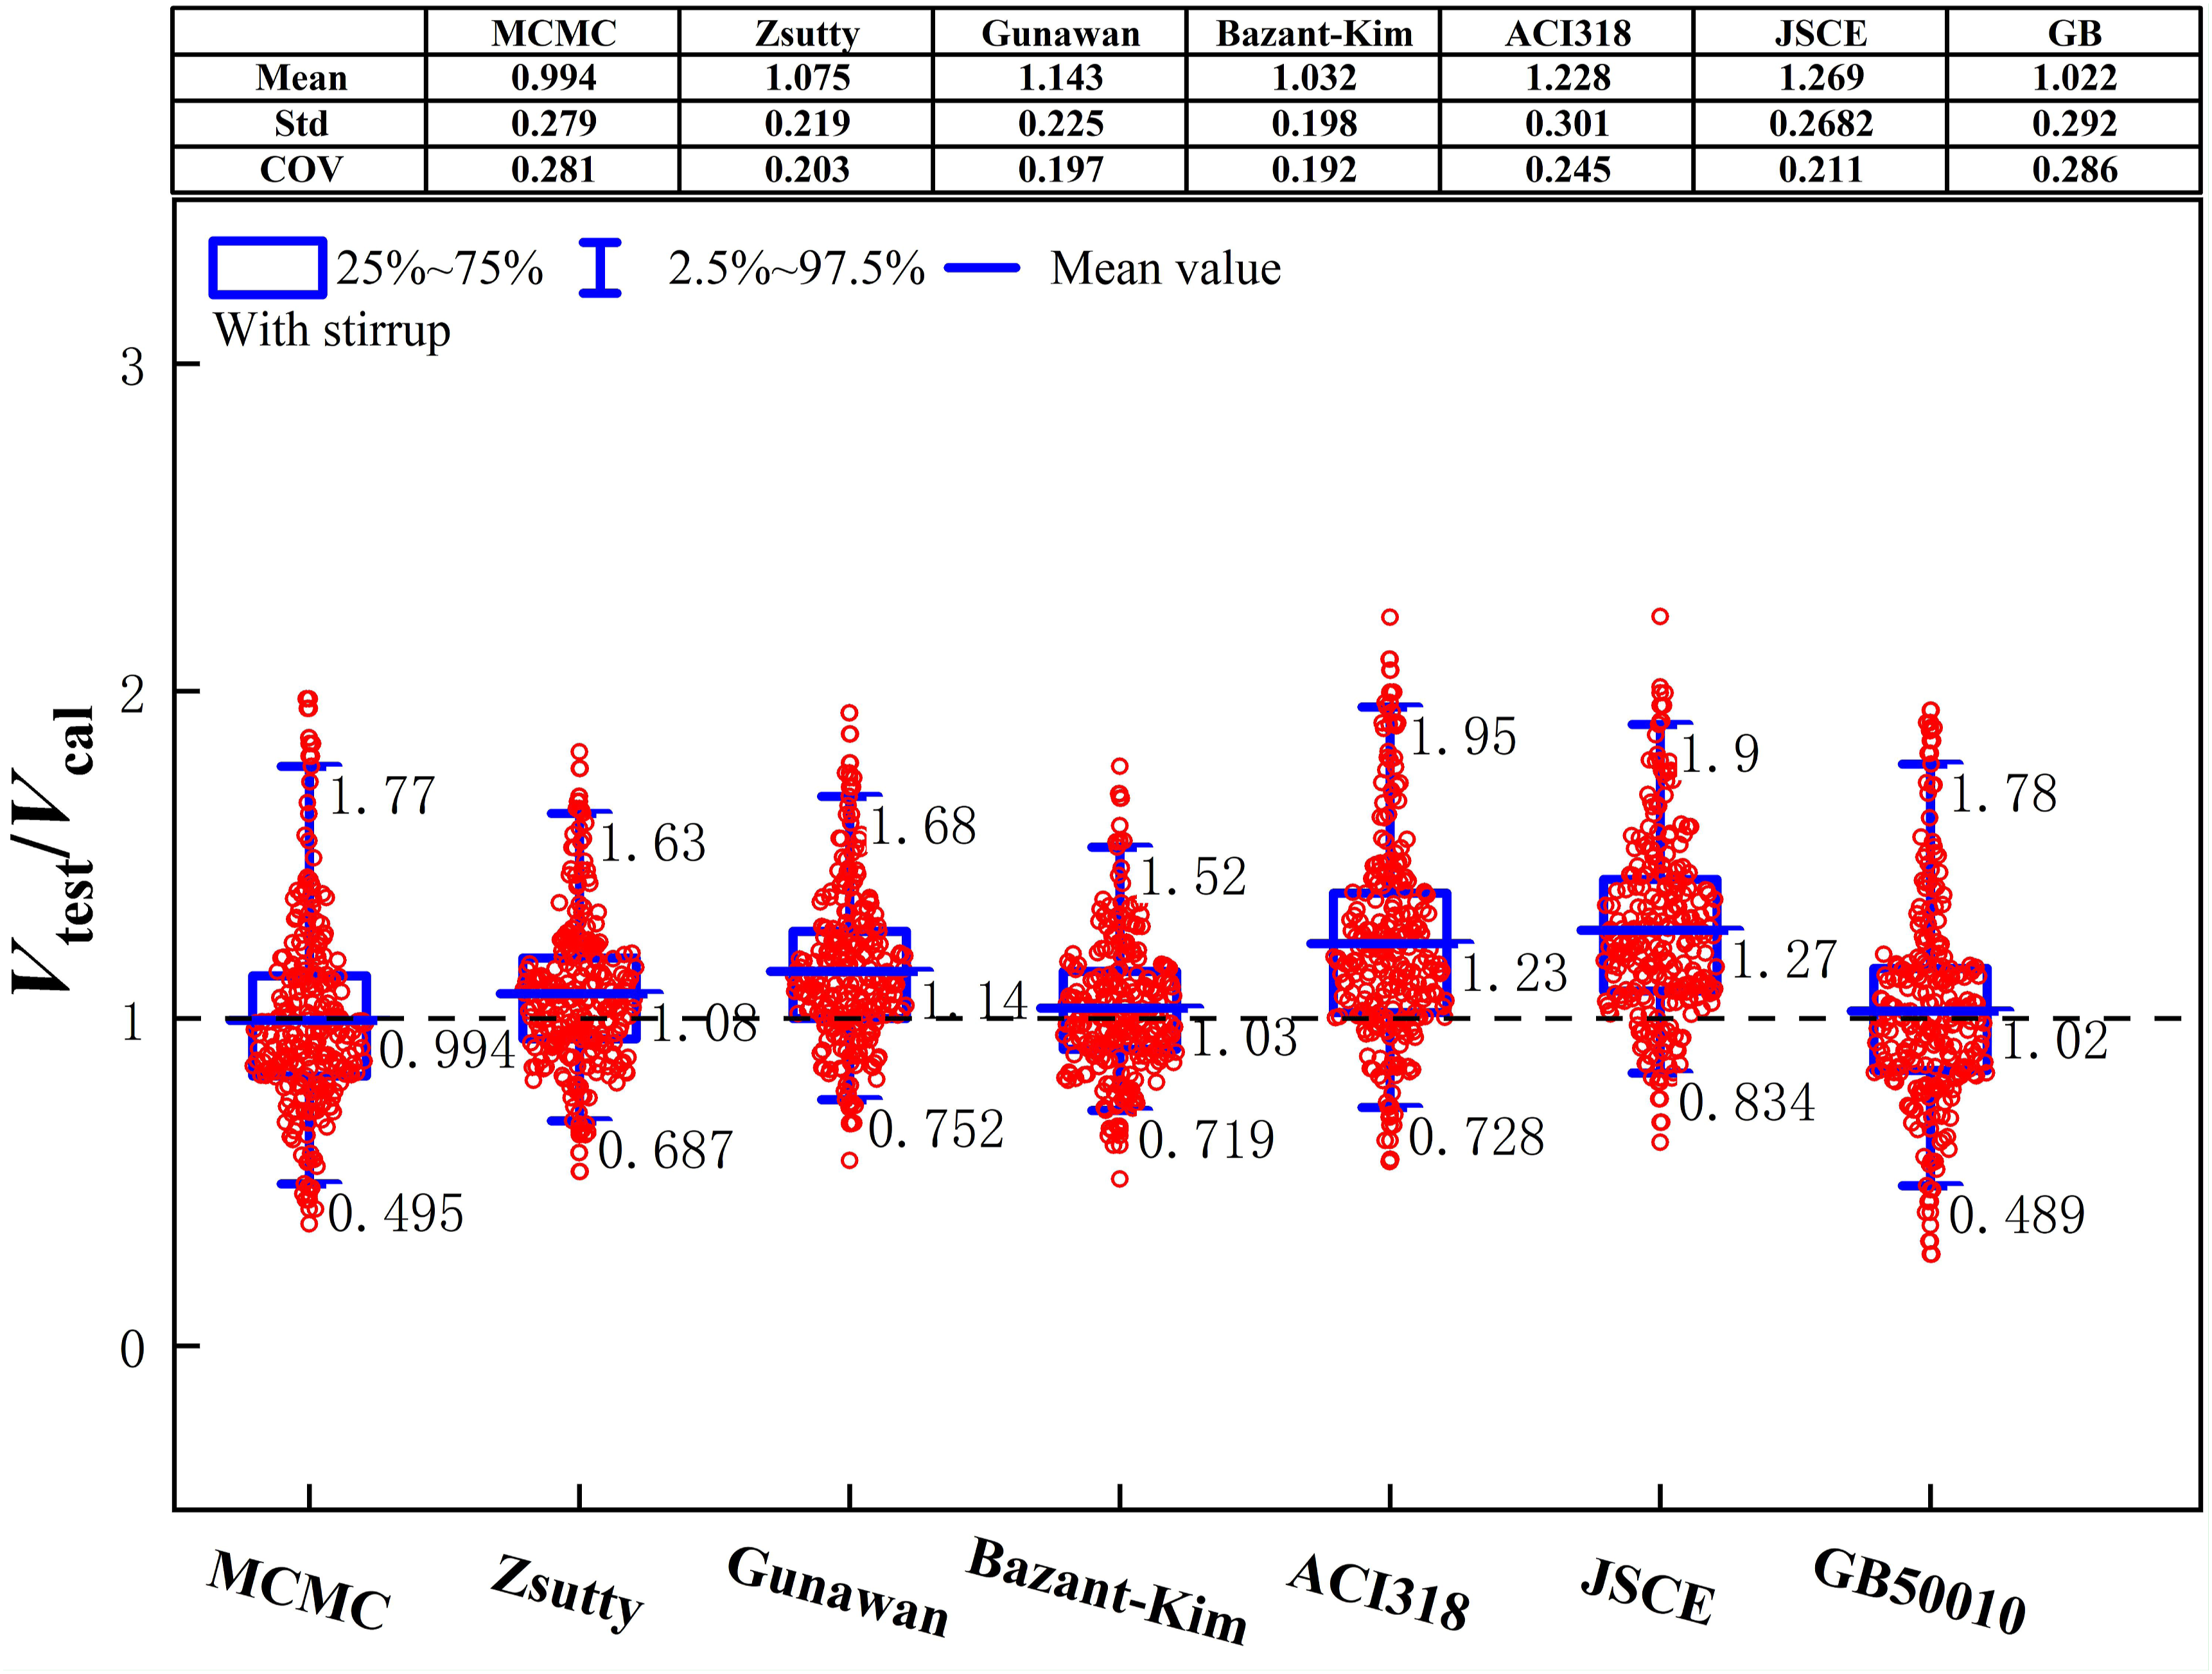
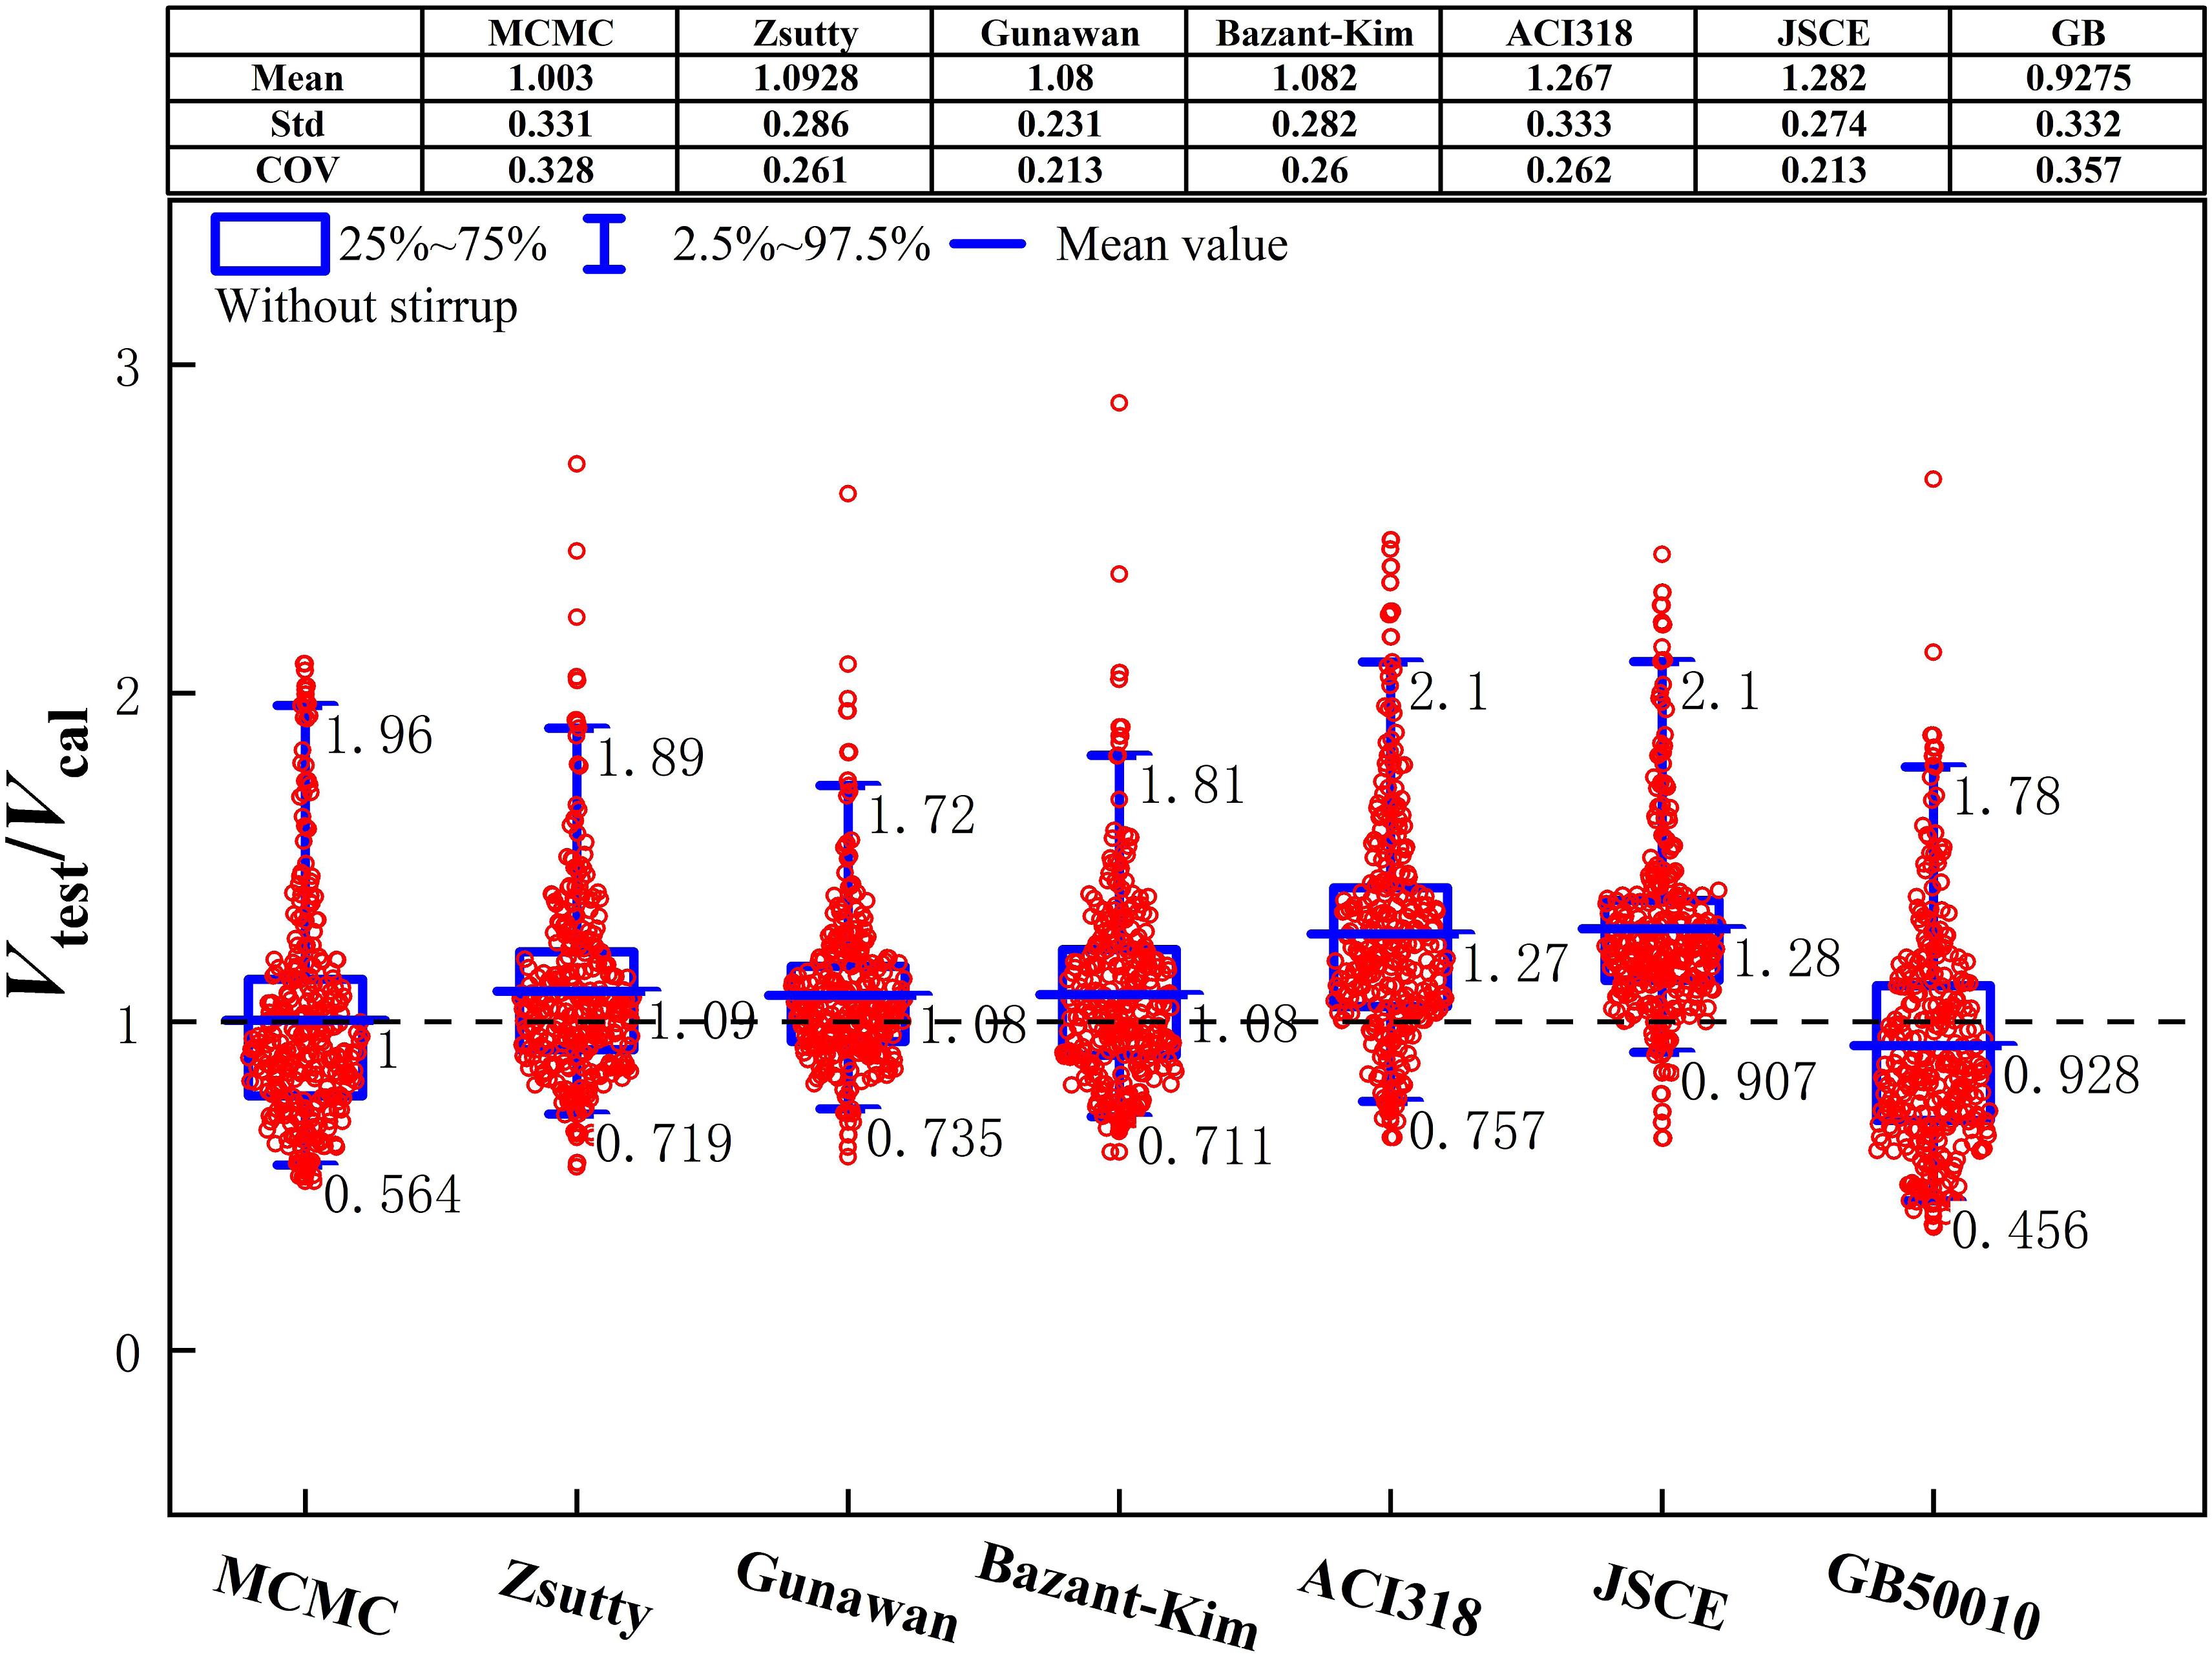
The analysis encompasses six mechanisms, including models from various design codes—ACI318 (ACI Committee 318-19, 2019), JSCE (JSCE Guidelines for Concrete No. 3. Structural Performance Verification, 2002), GB50010 (GB 50010-2010, 2010), and formulas by Zsutty (Zsutty, 1968), Gunawan (Gunawan et al., 2020), Bazant-Kim (Bazant and Kim, 1984), compared against the MCMC model with stirrups. According to Figure 3, the MCMC model’s mean value of 0.994 is remarkably close to experimental results. The models GB50010 (GB 50010-2010; 2010) and Bazant-Kim (Bazant and Kim, 1984) also demonstrate high prediction accuracy with their respective mean, standard deviation and coefficient of variation values variation values for the models are highly accurate, reflected by the ratios of 1.022, 0.292, and 0.286, respectively. Additionally, another set of models exhibits ratios of 1.032, 0.198, and 0.192, respectively. However, the ACI318 (ACI Committee 318-19, 2019) and JSCE (JSCE Guidelines for Concrete No. 3. Structural Performance Verification. 2002) models yield mean values of 1.228 and 1.269, respectively, leaning towards conservative estimates. When examining the data dispersion, the scholars’ models and national codes exhibit comparable levels, but Bazant-Kim’s (Bazant and Kim, 1984) model stands out for its minimal dispersion. It’s noteworthy that the MCMC model without stirrups outperforms the other models, as evidenced in Figure 4, with Gunawan’s model (Gunawan et al., 2020) showing commendable stability and robustness with a standard deviation around 0.23. This robustness might stem from the model accounting for the initiation and growth of diagonal cracks. The GB50010 model (GB 50010-2010, 2010) without stirrups tends to significantly overpredict shear capacity, as evidenced by its mean value of 0.9275. In contrast, this model gives a more balanced prediction when stirrups are included.
Figures 3–4 demonstrates that stirrups influence the predictive accuracy of various models to different extents. Nonetheless, the MCMC, Zsutty (Zsutty, 1968) and Bazant-Kim (Bazant and Kim, 1984) models maintain consistent ratios close to 1.0, irrespective of stirrup presence. In stark contrast, the ACI (ACI Committee 318-19, 2019) and JSCE (JSCE Guidelines for Concrete No. 3. Structural Performance Verification, 2002) models invariably predict conservatively for both beam types. For the GB50010 (GB 50010-2010; 2010) model, the prediction is overly optimistic for beams without stirrups but is well-aligned for those with stirrups. These variations are crucial for a comprehensive discussion on how well the MCMC model aligns with the underlying shear mechanism.
Shear contribution analysis
The above discussion underscores the prediction accuracy and dispersion of various models’ results, both with and without stirrups. To elucidate the rationality of these models, their shear contribution is assessed in accordance with the shear mechanism theory. The shear strength of RC beams is attributed to two main components: the concrete (Vc) and the stirrups (Vs). These substructures in the expressions from the cited models (Ma et al., 2023) represent distinct contributions to the shear section. The analysis proceeds in two stages. The first stage compares the results of the MCMC model with six other models to verify consistency with the shear mechanism. The second stage examines the decision-making basis of the MCMC model for strict adherence to shear mechanics principles.
Relative contribution
In RC beams with stirrups, the stirrup component (Vs) contributes increasingly to the predicted shear strength (Vcal) as the stirrup characteristic value Analysis of the relative variation of stirrup contribution with the stirrup characteristic. (a) MCMC (b) Bazant-Kim, (c) Zsutty, (d) Gunawan, (e) AC1318, (f) JSCE, (g) GB50010.
Analyzing the mean, maximum and minimum contribution of Vs, here is a consistent pattern where an increase in
The analysis of concrete component’s shear capacity, as formulated in equation (12), reveals a downward trend as the shear-to-span ratio escalates, paralleling the experimental outcomes reported by Wu (Hu and Wu, 2017, 2018). This trend confirms the varying performance of concrete under different loading conditions.
Absolute contribution
In the RC beams, the beam database, beams without stirrups serve as the baseline for comparison. Beams with stirrups, under identical conditions, are considered the control group. To gauge the shear capacity contributed by stirrups, the capacities of beams without stirrups are subtracted from those with stirrups under the same conditions. Same conditions implies consistent loading systems, material properties, and geometric dimensions across the groups, with the only variable being the stirrup ratio. A collective analysis involves 150 beam sets. Shear-span ratio
Figure 6 illustrates the findings, with the x-axis representing the stirrup characteristic value and the y-axis showing the ratio of experimental to theoretical shear strength. National codes and scholars’ equations are typically conservative in predicting stirrup shear capacity. This conservatism is pronounced at Analysis of the absolute variation of stirrup contribution with the stirrup characteristic.
Reliability analysis
Definition of the problem
Reliability analysis is utilized to ascertain the probability of structural failure by incorporating the influence of uncertainty. This section presents equations (10) and (12), which are formulated for reliability evaluation using the Monte Carlo and FOSM methods, in accordance with the engineering reliability design codes such as (ACI Committee 318-19, 2019; GB 50153-2008, 2009). The resistance factor (
The core challenge in structural reliability is ensuring that the structural strength exceeds the demands imposed by applied loads. The reliability function 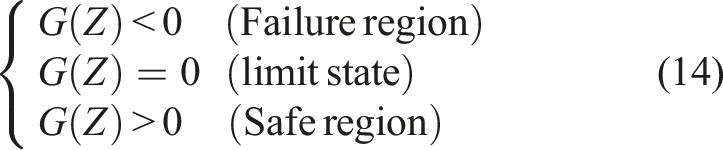
Z is a vector of all the random variables involved, defined by:
The resistance factor for individual shear equations is determined under various load combinations, based on the shear capacity models equations (10) and (12). The final expressions for shear strength V
p
of RC beams, with and without stirrups, are: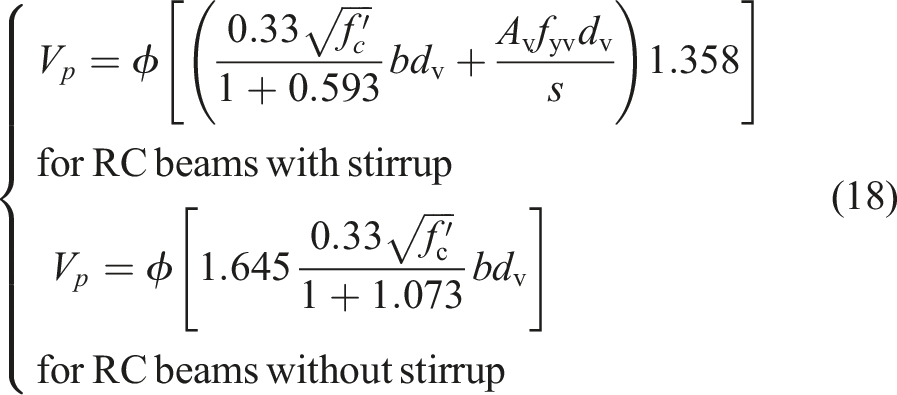
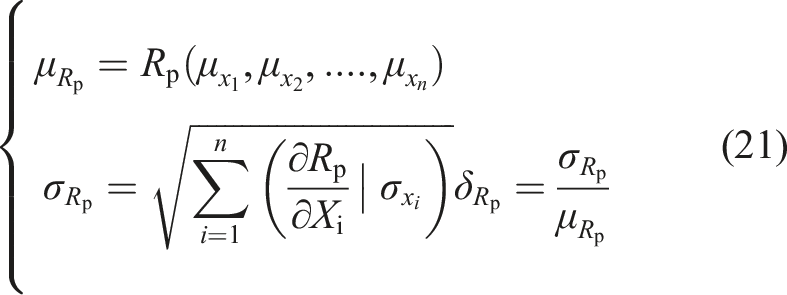
Calculation of relevant parameters
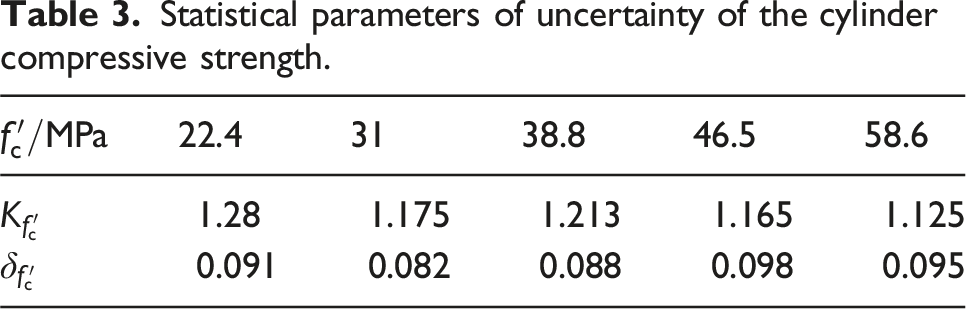
Material uncertainty
Statistical parameters of uncertainty of the cylinder compressive strength.
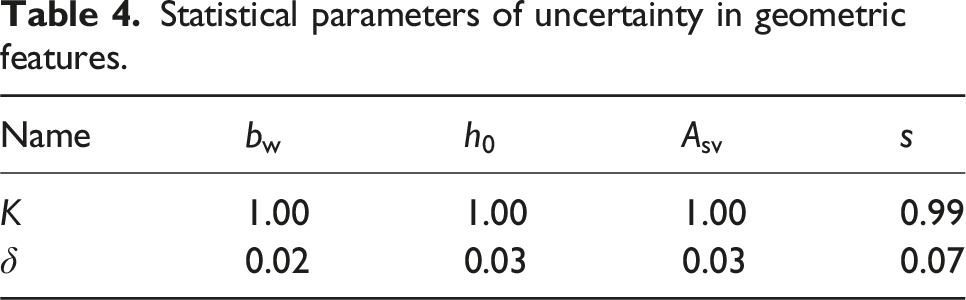
Uncertainty in geometric features
Statistical parameters of uncertainty in geometric features.
Uncertainty in computing models

Statistical parameters of uncertainty in computing mode.
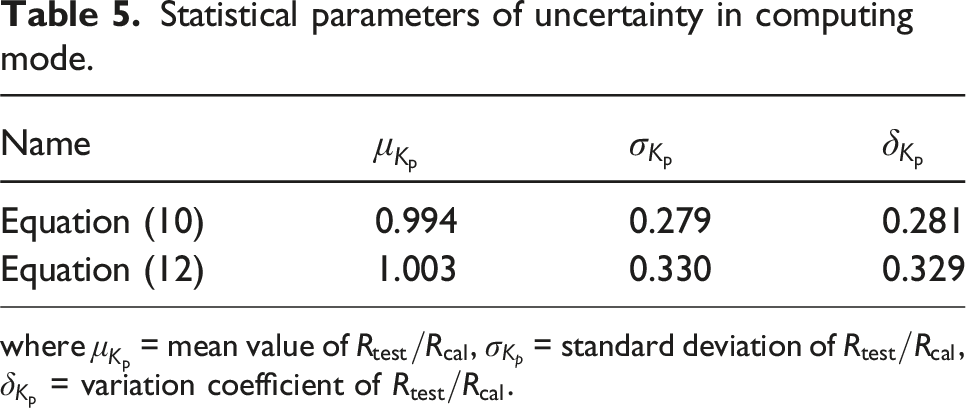
where
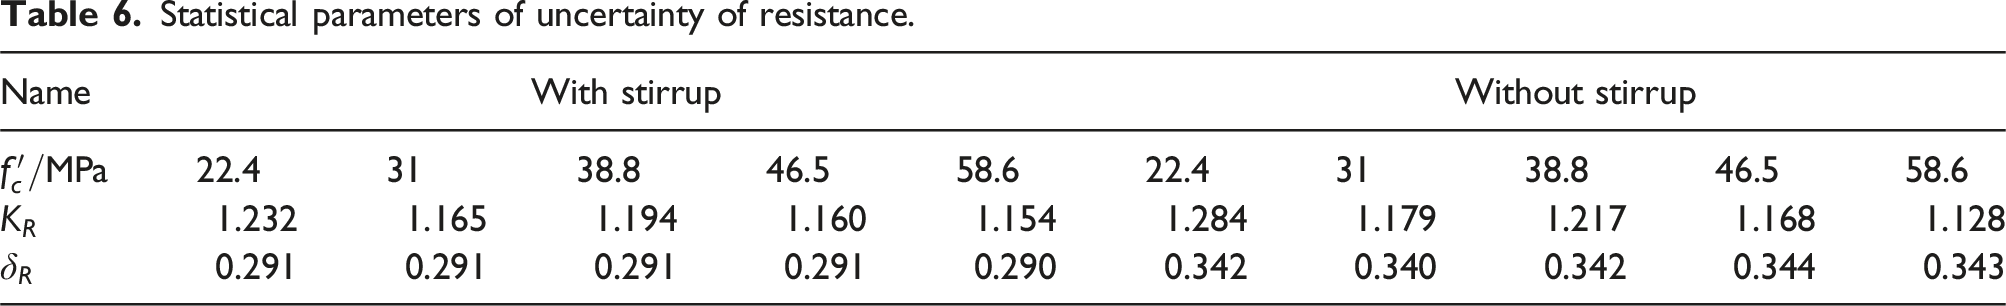
Uncertainty of resistance
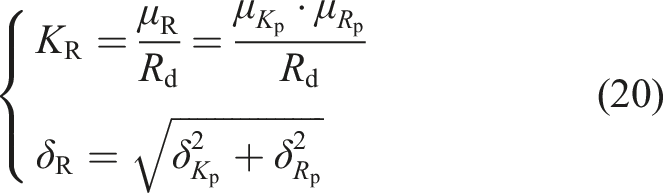
Statistical parameters of uncertainty of resistance.
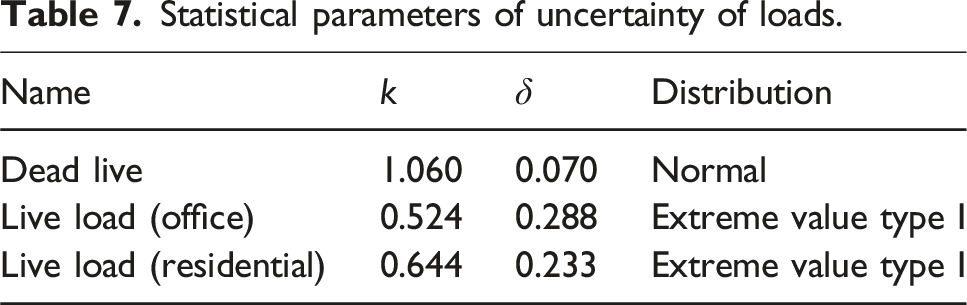
Uncertainty of load
Statistical parameters of uncertainty of loads.
Results from reliability analysis
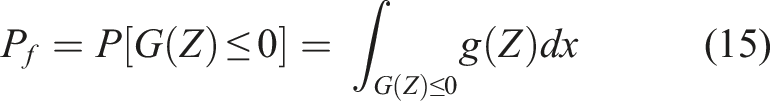
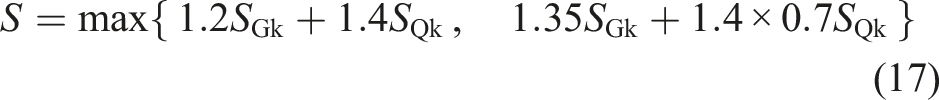
The load effect value is defined by selecting the larger value of the two calculated values from equation (16). It is assumed that the load effect on structural member S is equivalent to the shear capacity resistance R. The load effect ratio is defined as
The results for the reliability indexes from equations (10) and (12) are depicted in Figures 7–8, showing that the reliability index is inversely proportional to the load effect ratio under different conditions. As the concrete strength improves, the reliability index initially increases and then decreases. Nevertheless, equations (10) and (12) do not align with the reliability index recommended by GB50153 (GB 50153-2008, 2009). Introducing a resistance index is necessary to achieve an acceptable level of structural safety, as discussed by Szerszen and Nowak (2003). Table 8 displays the average values of the resistance index for various design requirements, and Figures 7–8 demonstrates the change in these indexes under different working conditions when targeting a reliability index Reliability index in RC beams versus varied load. (a) Beams without stirrup under office live loads (b) beams without stirrup under residential live loads (c) stirrup beams under office live loads (d) stirrup beams under residential live loads. Optimized reliability index in RC beams versus varied load. (a) Beams without stirrup under office live loads (b) beams without stirrup under residential live loads (c) stirrup beams under office live loads (d) stirrup beams under residential live loads. Average resistance factor for target reliability indexes.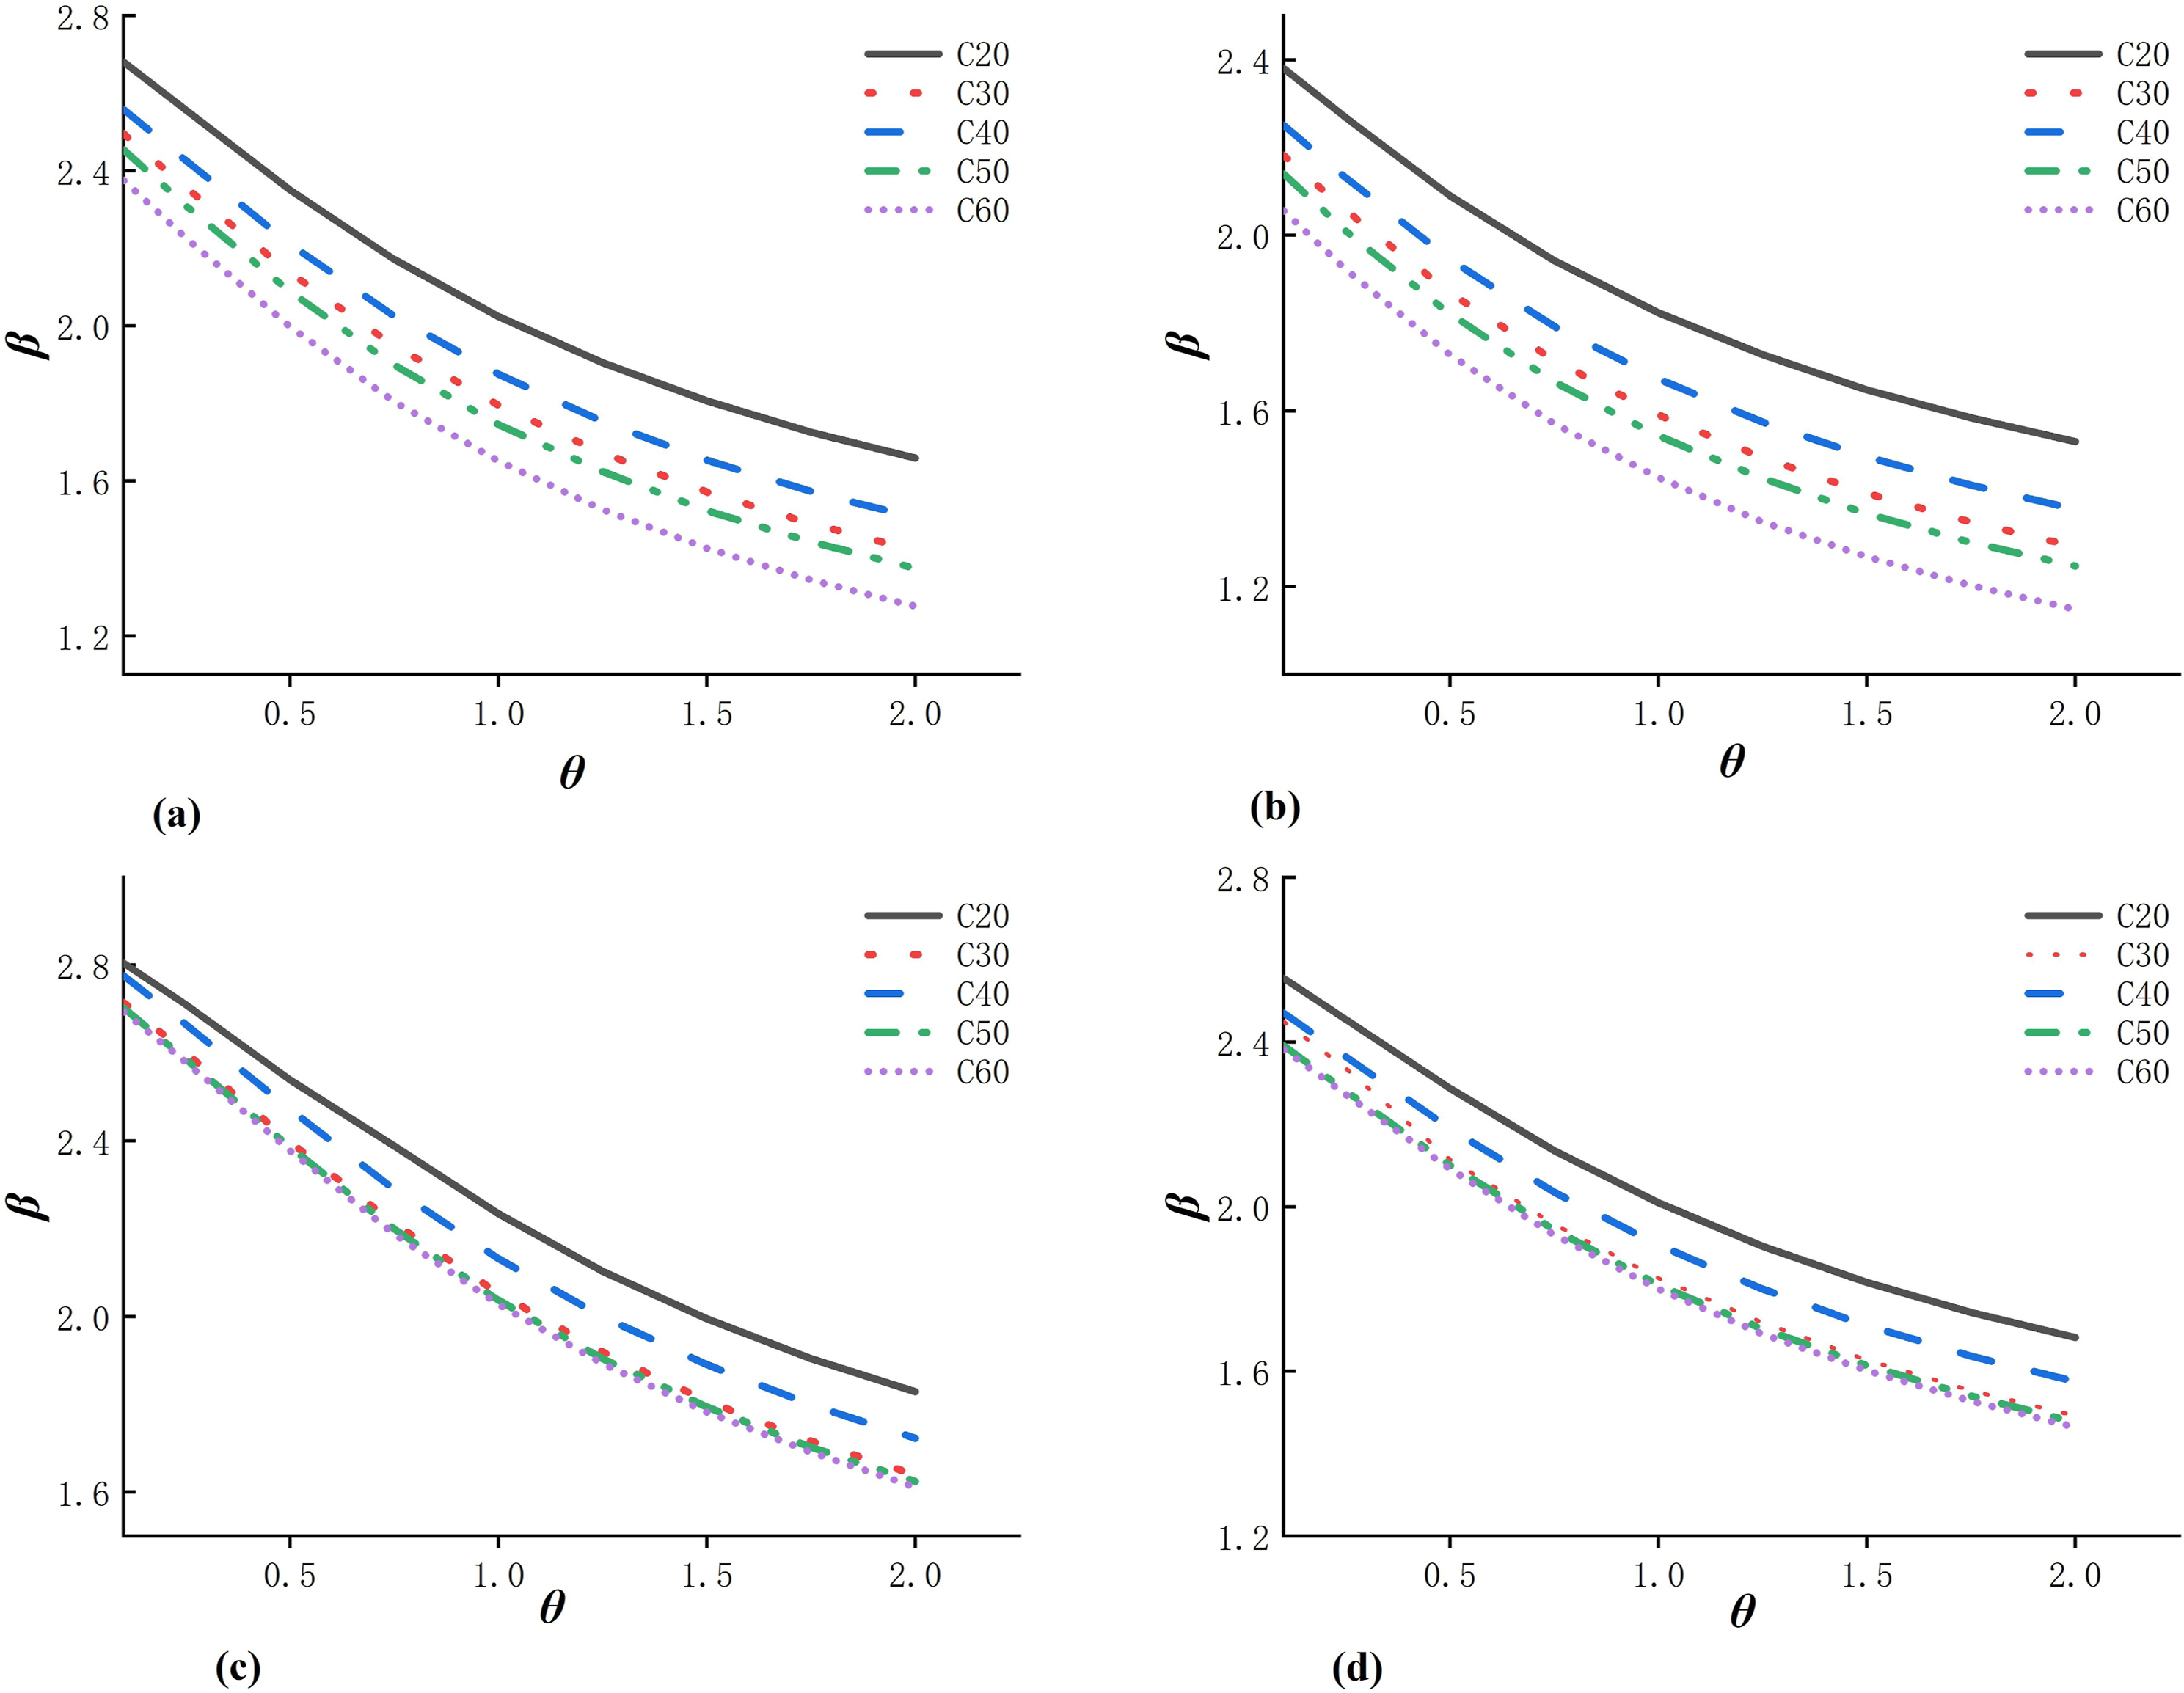
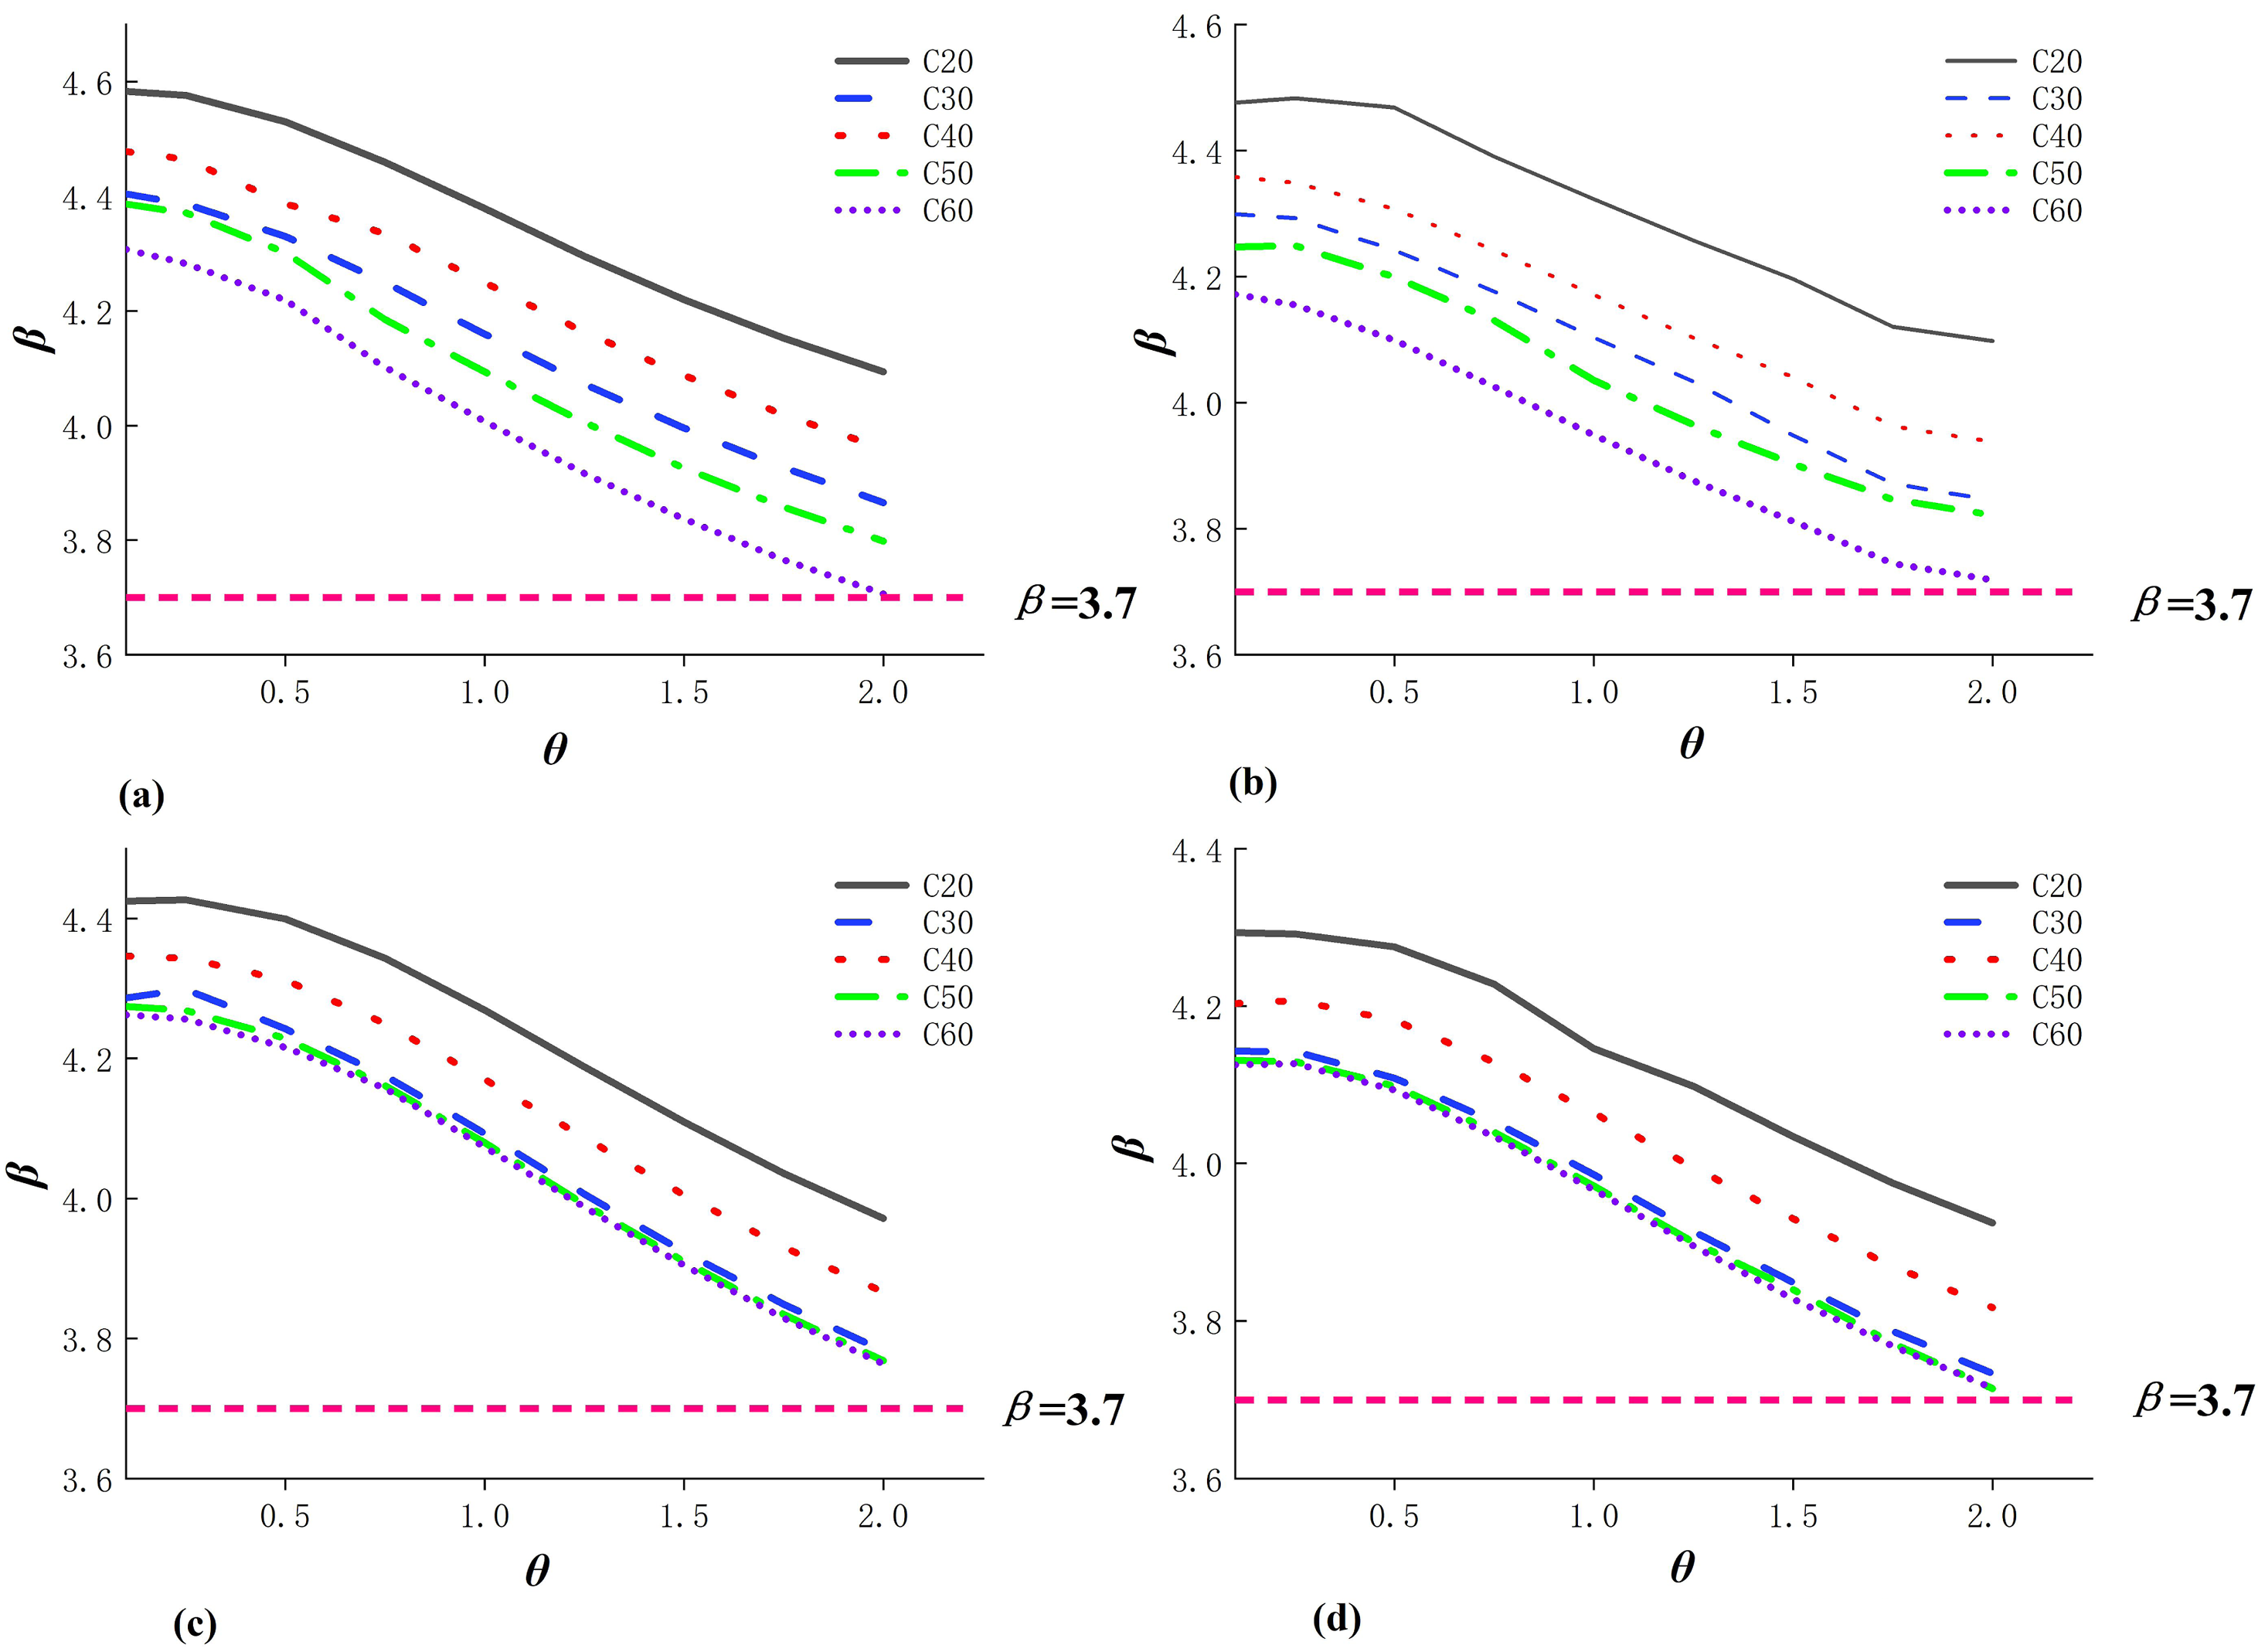
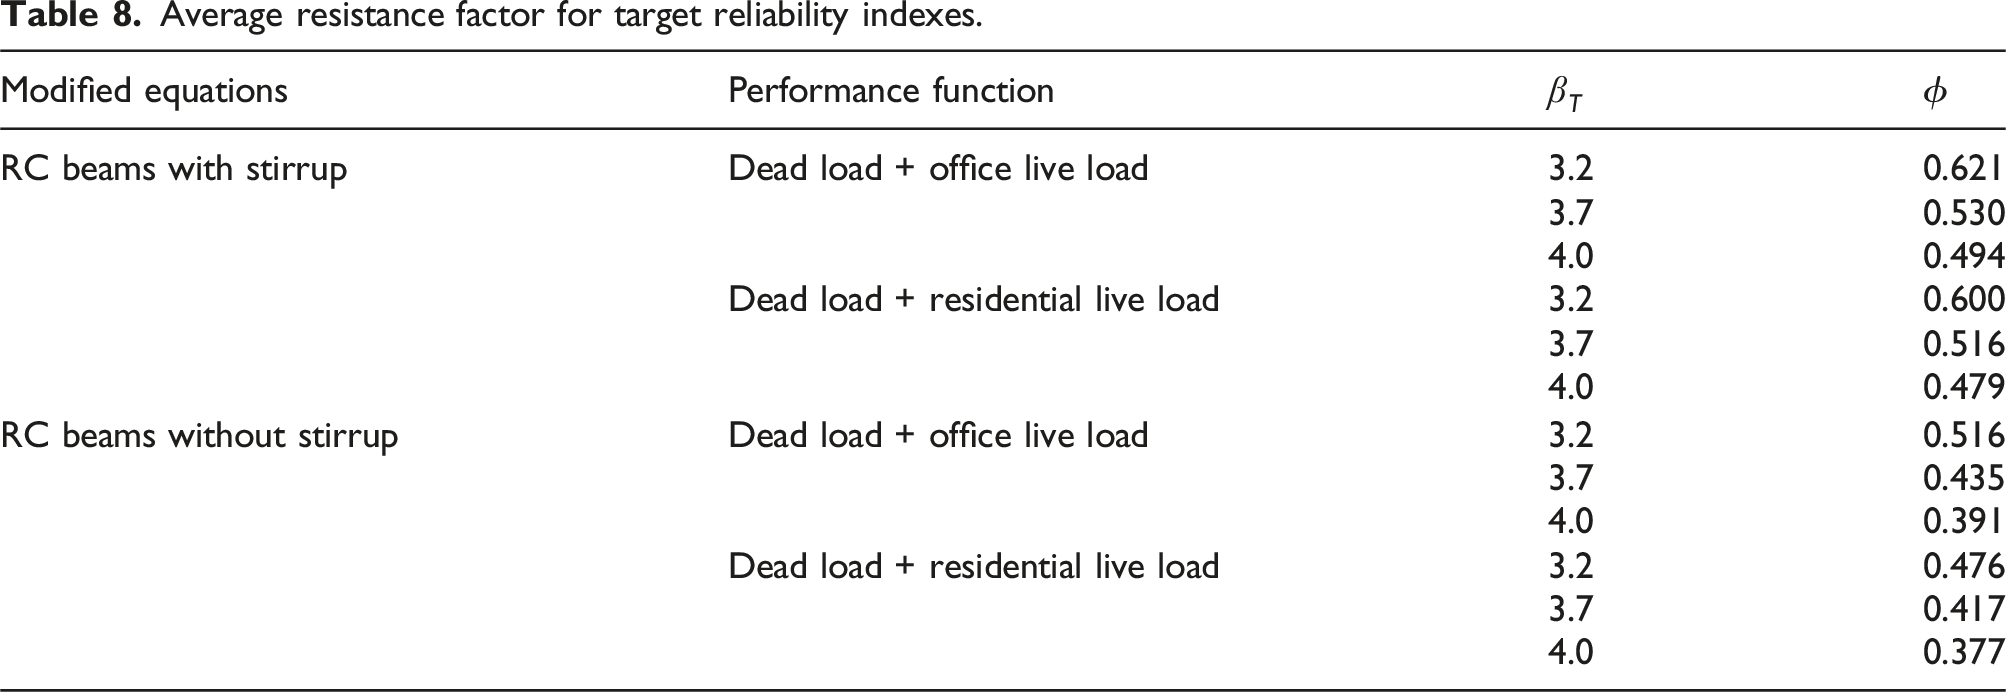
Table 8 compares the
Sensitivity analysis
Sensitivity analysis plays a crucial role in evaluating the influence of various variable on reliability, serving as an essential reference for structural reliability design. This analytical approach, extensively investigated by researchers focusing on uncertainty in seismic collapse fragility (Baker and Cornell, 2003; Eduardo and Hesameddin, 2003; Porter et al., 2002), has found its place in construction engineering due to the effective methodology it provides. The tornado diagram, for instance, is a widely applied tool that facilitates the analysis of sensitivity (Yin et al., 2012; Yu and Lu, 2012). It allows for one variable to randomly vary within a specific range while keeping other variables constant, enabling the quantification of sensitivity between the variable and the parametric model through comparative calculations.
Optimized reliability indexes for the different methods and performance function.

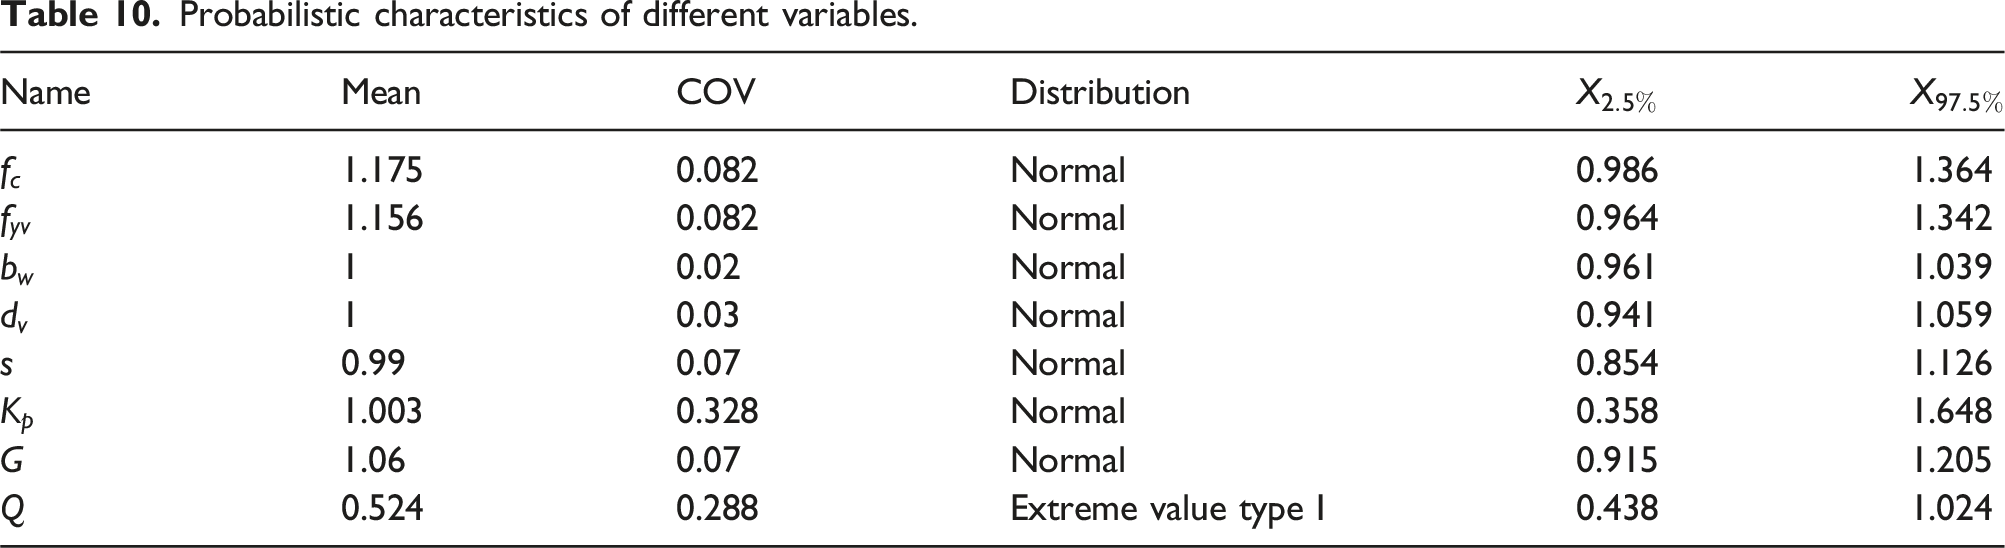
Probabilistic characteristics of different variables.
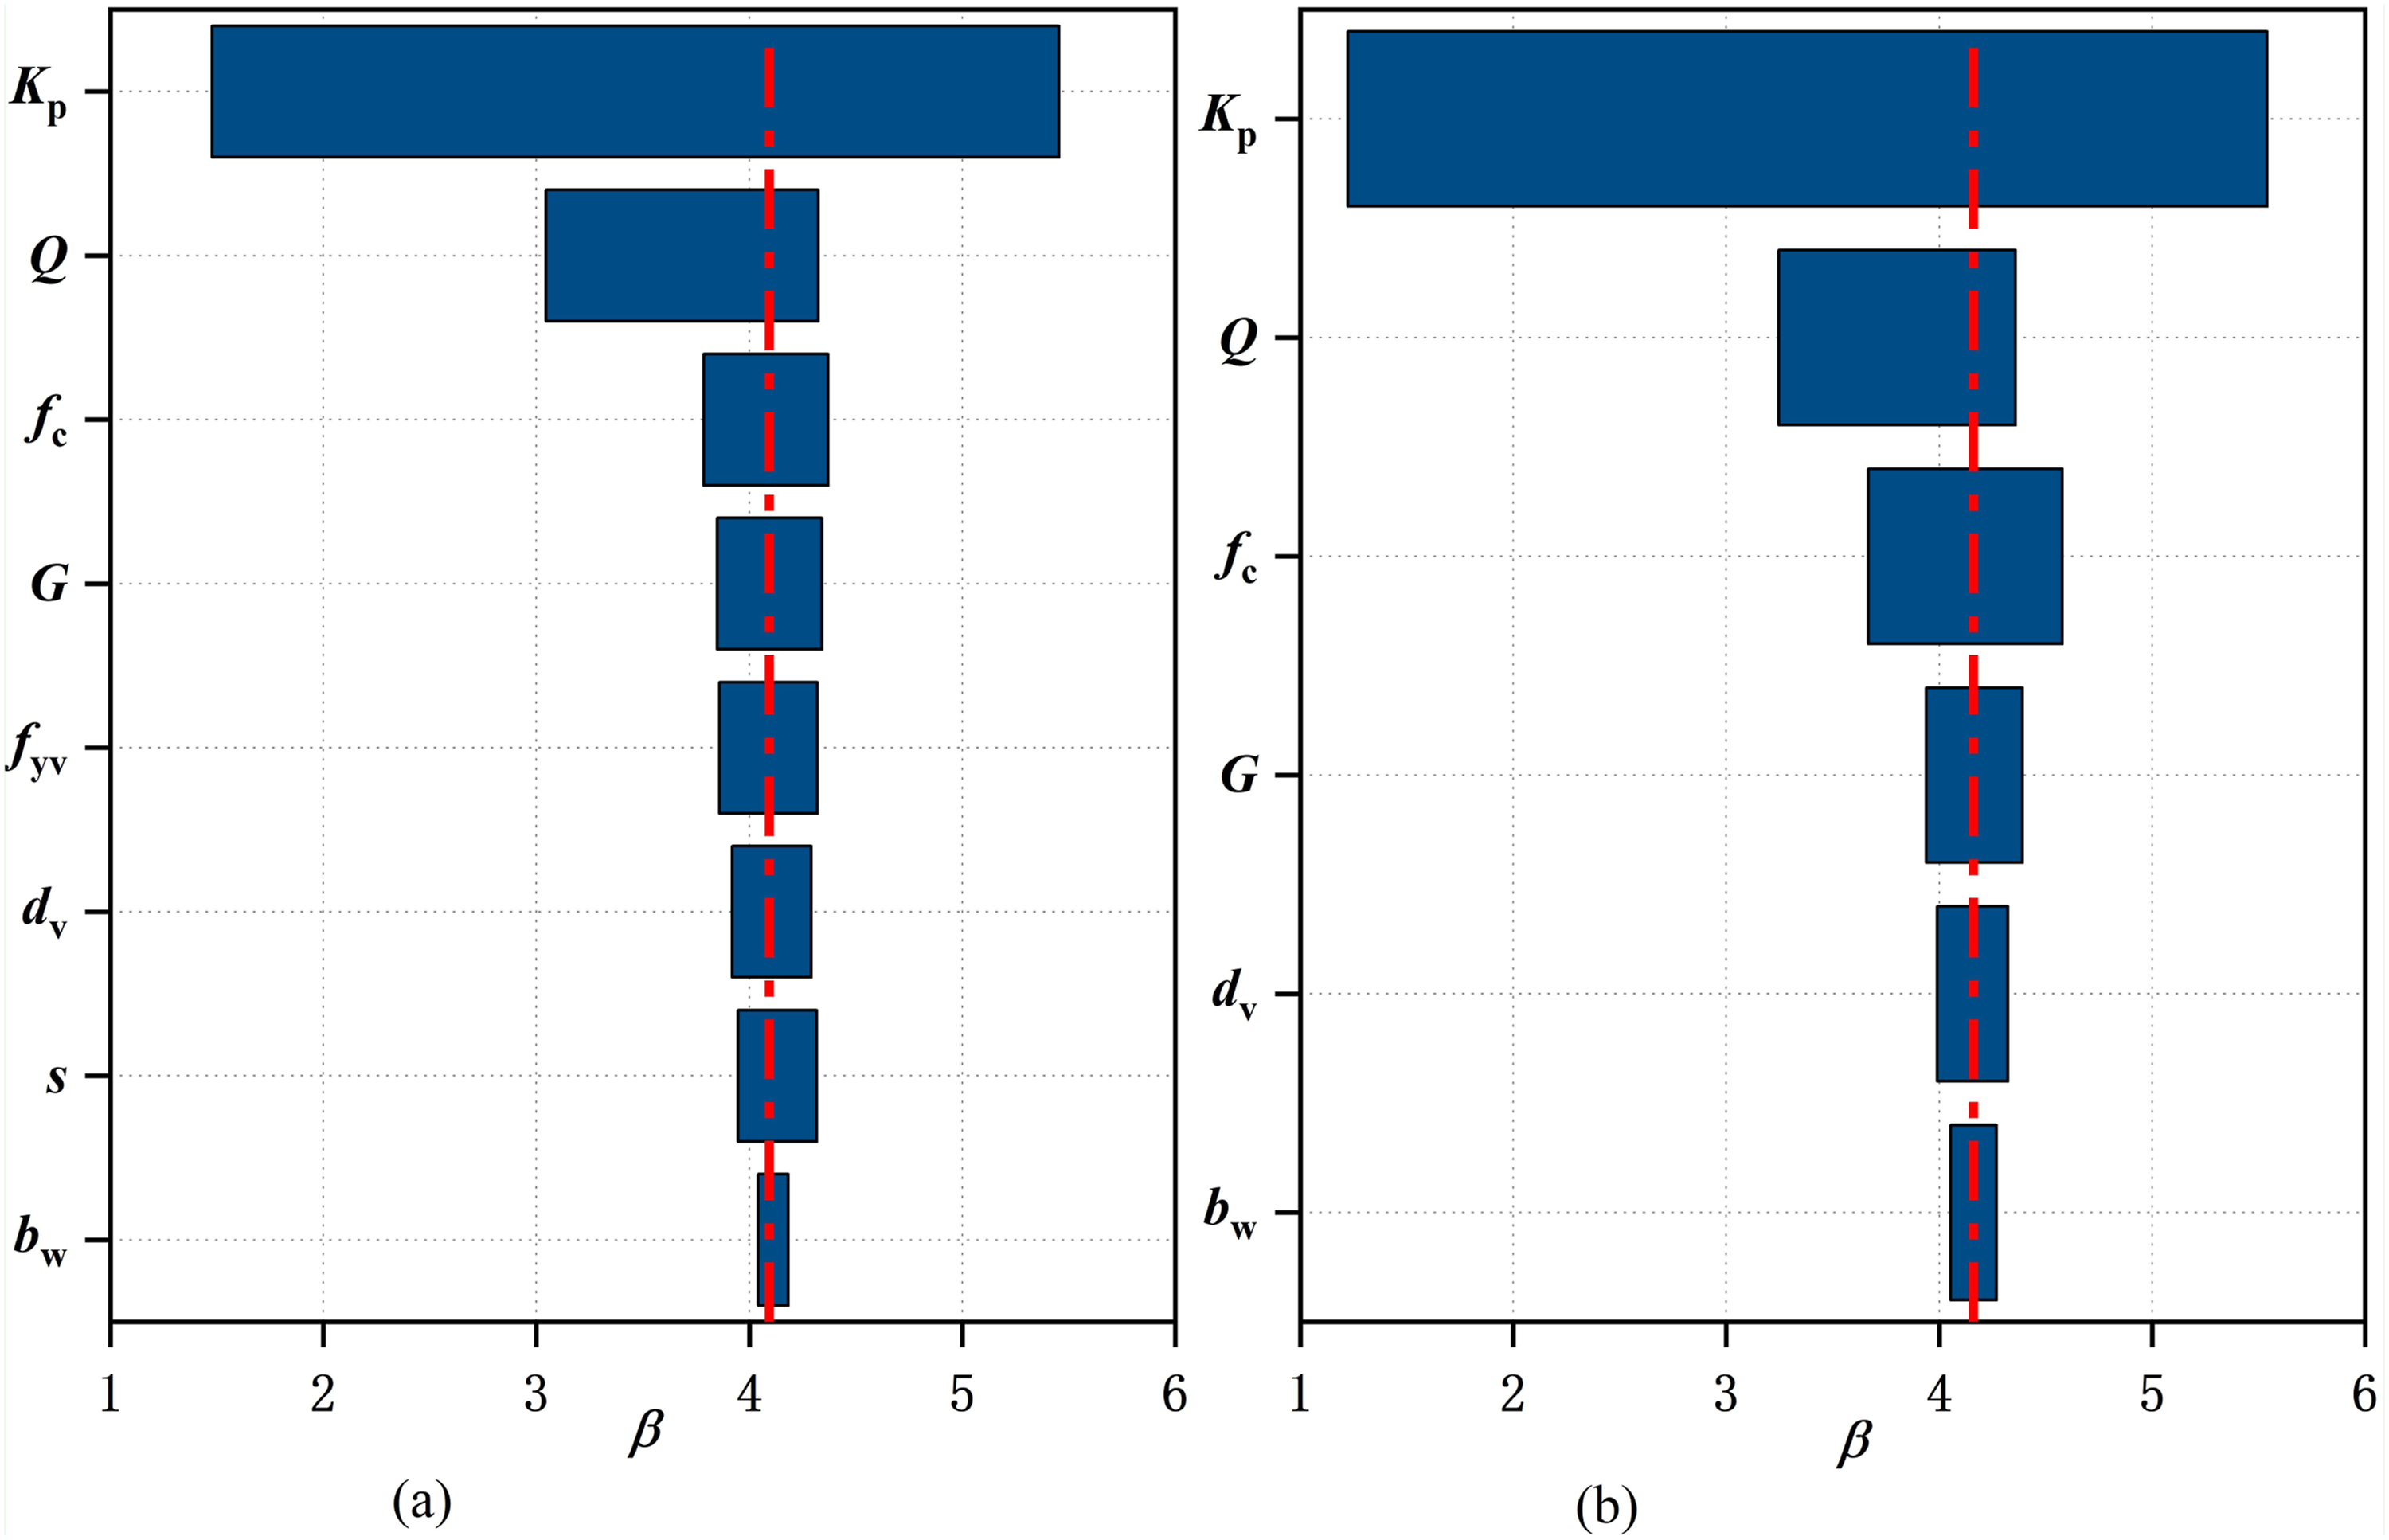
Sensitivity factors of the input variables. (a) RC beams with stirrup (b) RC beams without stirrup.
Conclusion
The shear capacity models for RC beams have been proposed based on the MCFT and MCMC method, supported by 782 sets of experimental data. The rationality of the proposed models was discussed through the contribution of each shear component. Additionally, in order to meet the target reliability indexes, resistance factors were introduced, and the models were analyzed for their reliability. Key conclusions include: (1) The mean values of (2) Evaluating the contribution of the concrete component and the stirrup component, highlights the soundness of the model’s rationale from relative and absolute contribution. In RC beams with stirrups under shear load, the concrete component is the primary shear component, contributing on average 59.1%. The stirrup component is essential, accounting for 40.9% of the shear capacity. The range of stirrup component contribution varies between 10.6% and 87.7%, which is conservative compared to experimental values. The trends between the proposed model and the other six models are consistent, while the interval ranges are also highly comparable. These results indicate a solid adherence to the established shear mechanism. (3) For the models to achieve the target reliability indices (4) The factors that significantly impact the reliability values are the uncertainty in the mode
Footnotes
Declaration of conflicting interests
The author(s) declared no potential conflicts of interest with respect to the research, authorship, and/or publication of this article.
Funding
The author(s) disclosed receipt of the following financial support for the research, authorship, and/or publication of this article: This study was financially supported by the Fundamental Research Funds for the Central Universities, CHD (Grant No. 300102282503), Tianshan Talent Training Program of Xinjiang Province (Grant No. 2023TSYCCX0110), National Natural Science Foundation of China (Grant No.52478215), and the NSF of Xinjiang Province (Grant No. 2022E02095).
Appendix
Appendix Table 1
Summary of shear capacity models for RC beams. Note. 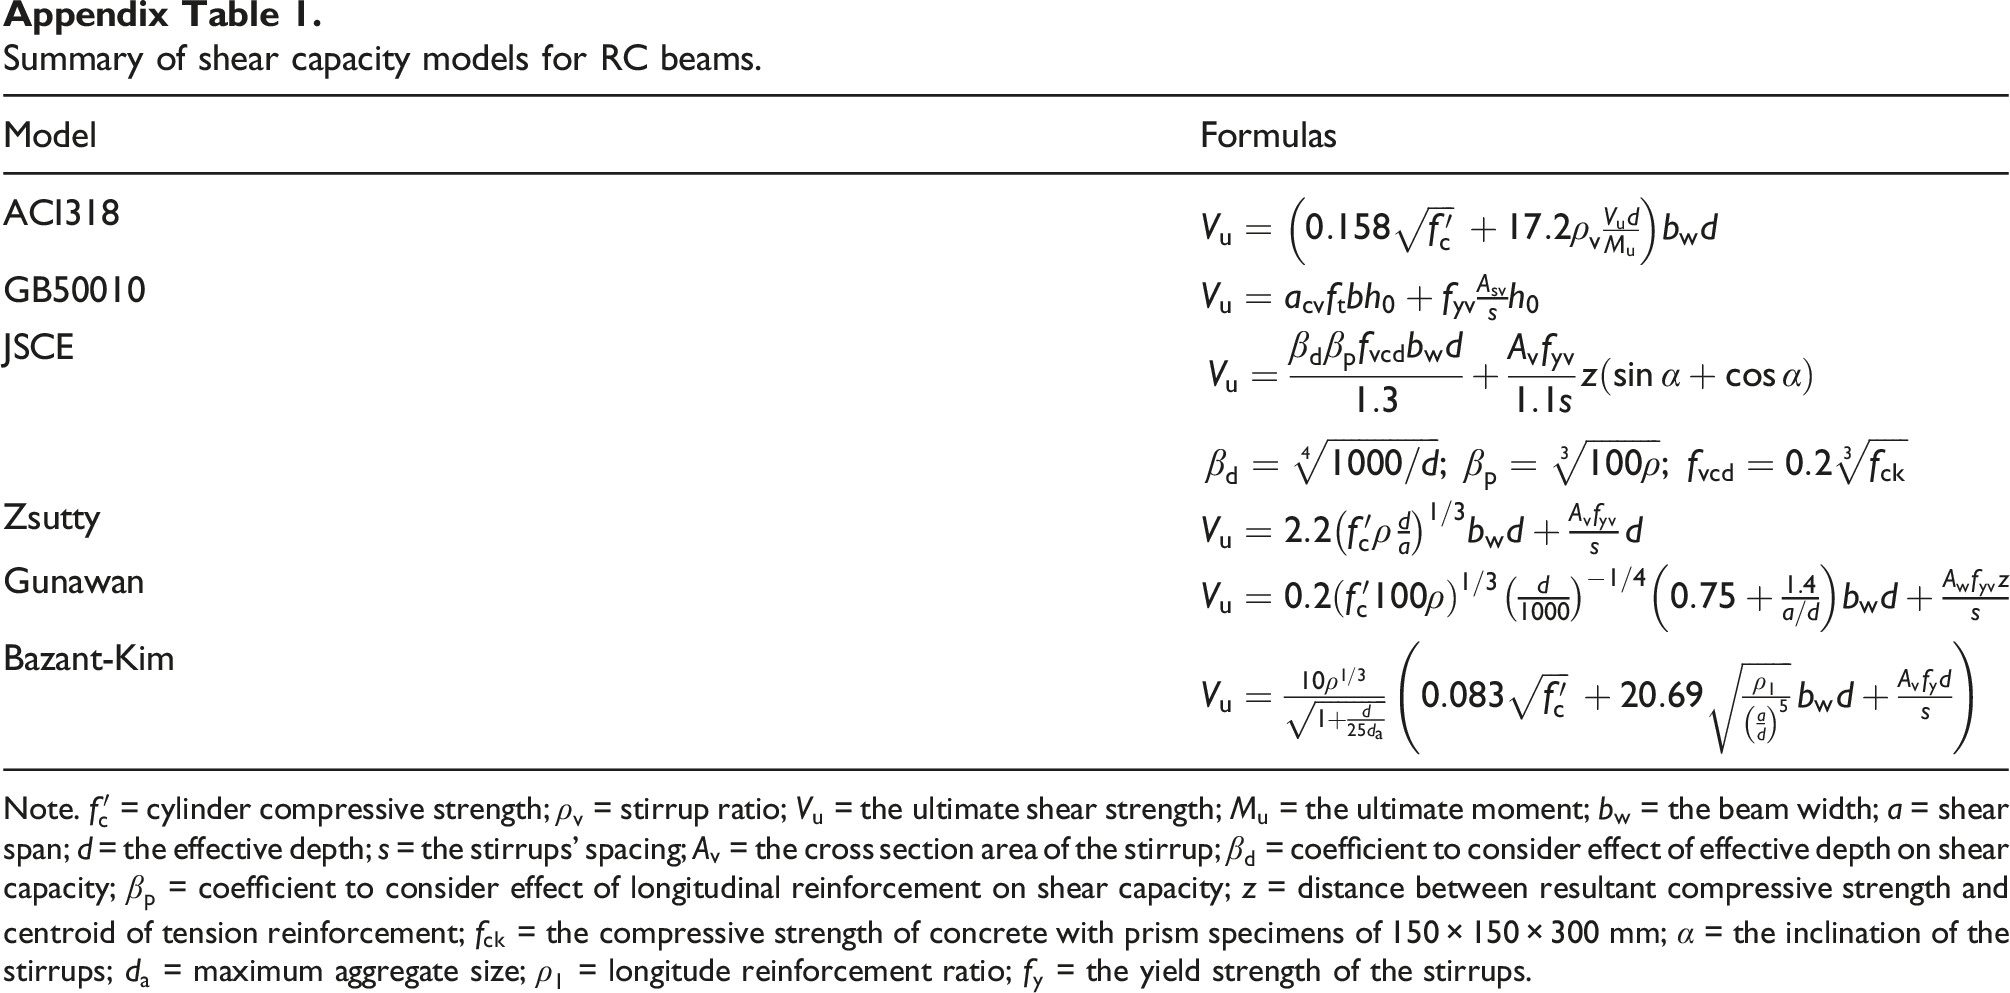
Model
Formulas
ACI318
GB50010
JSCE
Zsutty
Gunawan
Bazant-Kim
Experimental database of RC slender beams.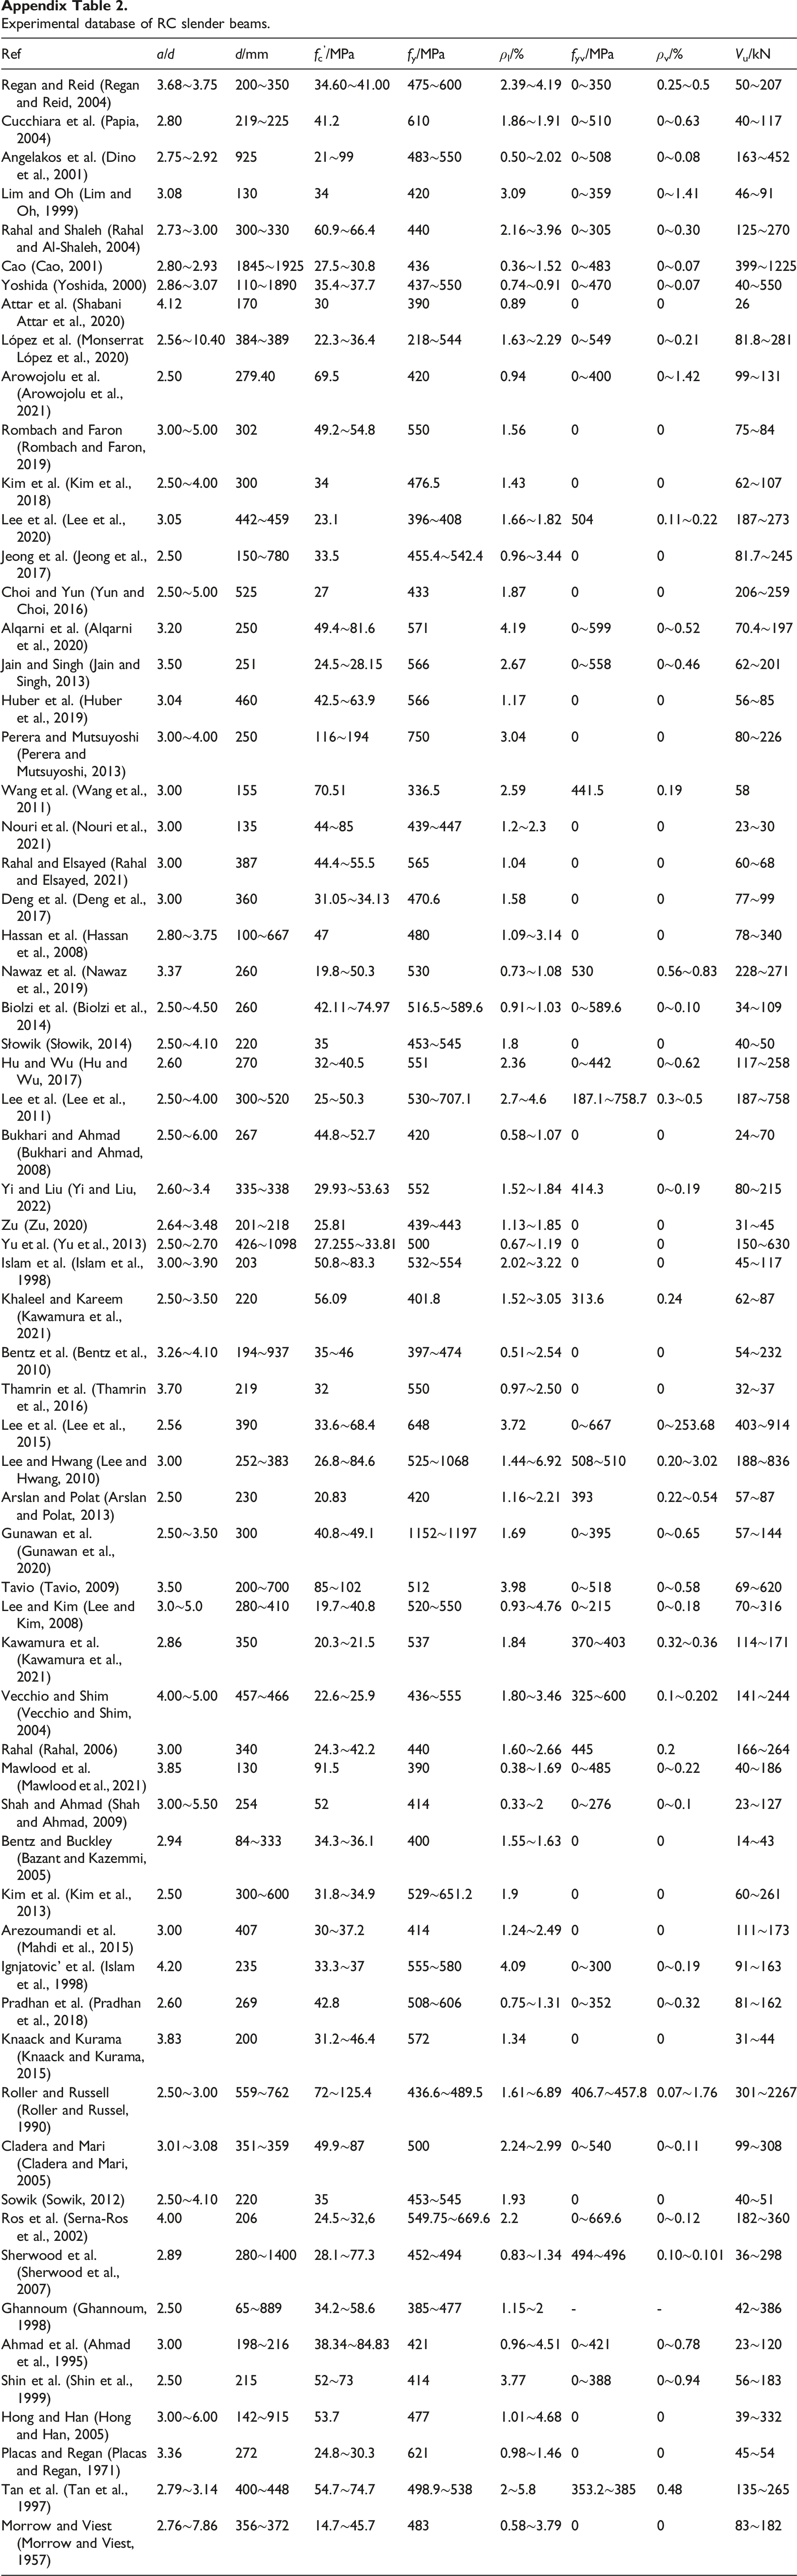
Ref
a/d
d/mm
fc’/MPa
fy/MPa
ρl/%
fyv/MPa
ρv/%
Vu/kN
Regan and Reid (Regan and Reid, 2004)
3.68∼3.75
200∼350
34.60∼41.00
475∼600
2.39∼4.19
0∼350
0.25∼0.5
50∼207
Cucchiara et al. (Papia, 2004)
2.80
219∼225
41.2
610
1.86∼1.91
0∼510
0∼0.63
40∼117
Angelakos et al. (Dino et al., 2001)
2.75∼2.92
925
21∼99
483∼550
0.50∼2.02
0∼508
0∼0.08
163∼452
Lim and Oh (Lim and Oh, 1999)
3.08
130
34
420
3.09
0∼359
0∼1.41
46∼91
Rahal and Shaleh (Rahal and Al-Shaleh, 2004)
2.73∼3.00
300∼330
60.9∼66.4
440
2.16∼3.96
0∼305
0∼0.30
125∼270
Cao (Cao, 2001)
2.80∼2.93
1845∼1925
27.5∼30.8
436
0.36∼1.52
0∼483
0∼0.07
399∼1225
Yoshida (Yoshida, 2000)
2.86∼3.07
110∼1890
35.4∼37.7
437∼550
0.74∼0.91
0∼470
0∼0.07
40∼550
Attar et al. (Shabani Attar et al., 2020)
4.12
170
30
390
0.89
0
0
26
López et al. (Monserrat López et al., 2020)
2.56∼10.40
384∼389
22.3∼36.4
218∼544
1.63∼2.29
0∼549
0∼0.21
81.8∼281
Arowojolu et al. (Arowojolu et al., 2021)
2.50
279.40
69.5
420
0.94
0∼400
0∼1.42
99∼131
Rombach and Faron (Rombach and Faron, 2019)
3.00∼5.00
302
49.2∼54.8
550
1.56
0
0
75∼84
Kim et al. (Kim et al., 2018)
2.50∼4.00
300
34
476.5
1.43
0
0
62∼107
Lee et al. (Lee et al., 2020)
3.05
442∼459
23.1
396∼408
1.66∼1.82
504
0.11∼0.22
187∼273
Jeong et al. (Jeong et al., 2017)
2.50
150∼780
33.5
455.4∼542.4
0.96∼3.44
0
0
81.7∼245
Choi and Yun (Yun and Choi, 2016)
2.50∼5.00
525
27
433
1.87
0
0
206∼259
Alqarni et al. (Alqarni et al., 2020)
3.20
250
49.4∼81.6
571
4.19
0∼599
0∼0.52
70.4∼197
Jain and Singh (Jain and Singh, 2013)
3.50
251
24.5∼28.15
566
2.67
0∼558
0∼0.46
62∼201
Huber et al. (Huber et al., 2019)
3.04
460
42.5∼63.9
566
1.17
0
0
56∼85
Perera and Mutsuyoshi (Perera and Mutsuyoshi, 2013)
3.00∼4.00
250
116∼194
750
3.04
0
0
80∼226
Wang et al. (Wang et al., 2011)
3.00
155
70.51
336.5
2.59
441.5
0.19
58
Nouri et al. (Nouri et al., 2021)
3.00
135
44∼85
439∼447
1.2∼2.3
0
0
23∼30
Rahal and Elsayed (Rahal and Elsayed, 2021)
3.00
387
44.4∼55.5
565
1.04
0
0
60∼68
Deng et al. (Deng et al., 2017)
3.00
360
31.05∼34.13
470.6
1.58
0
0
77∼99
Hassan et al. (Hassan et al., 2008)
2.80∼3.75
100∼667
47
480
1.09∼3.14
0
0
78∼340
Nawaz et al. (Nawaz et al., 2019)
3.37
260
19.8∼50.3
530
0.73∼1.08
530
0.56∼0.83
228∼271
Biolzi et al. (Biolzi et al., 2014)
2.50∼4.50
260
42.11∼74.97
516.5∼589.6
0.91∼1.03
0∼589.6
0∼0.10
34∼109
Słowik (Słowik, 2014)
2.50∼4.10
220
35
453∼545
1.8
0
0
40∼50
Hu and Wu (Hu and Wu, 2017)
2.60
270
32∼40.5
551
2.36
0∼442
0∼0.62
117∼258
Lee et al. (Lee et al., 2011)
2.50∼4.00
300∼520
25∼50.3
530∼707.1
2.7∼4.6
187.1∼758.7
0.3∼0.5
187∼758
Bukhari and Ahmad (Bukhari and Ahmad, 2008)
2.50∼6.00
267
44.8∼52.7
420
0.58∼1.07
0
0
24∼70
Yi and Liu (Yi and Liu, 2022)
2.60∼3.4
335∼338
29.93∼53.63
552
1.52∼1.84
414.3
0∼0.19
80∼215
Zu (Zu, 2020)
2.64∼3.48
201∼218
25.81
439∼443
1.13∼1.85
0
0
31∼45
Yu et al. (Yu et al., 2013)
2.50∼2.70
426∼1098
27.255∼33.81
500
0.67∼1.19
0
0
150∼630
Islam et al. (Islam et al., 1998)
3.00∼3.90
203
50.8∼83.3
532∼554
2.02∼3.22
0
0
45∼117
Khaleel and Kareem (Kawamura et al., 2021)
2.50∼3.50
220
56.09
401.8
1.52∼3.05
313.6
0.24
62∼87
Bentz et al. (Bentz et al., 2010)
3.26∼4.10
194∼937
35∼46
397∼474
0.51∼2.54
0
0
54∼232
Thamrin et al. (Thamrin et al., 2016)
3.70
219
32
550
0.97∼2.50
0
0
32∼37
Lee et al. (Lee et al., 2015)
2.56
390
33.6∼68.4
648
3.72
0∼667
0∼253.68
403∼914
Lee and Hwang (Lee and Hwang, 2010)
3.00
252∼383
26.8∼84.6
525∼1068
1.44∼6.92
508∼510
0.20∼3.02
188∼836
Arslan and Polat (Arslan and Polat, 2013)
2.50
230
20.83
420
1.16∼2.21
393
0.22∼0.54
57∼87
Gunawan et al. (Gunawan et al., 2020)
2.50∼3.50
300
40.8∼49.1
1152∼1197
1.69
0∼395
0∼0.65
57∼144
Tavio (Tavio, 2009)
3.50
200∼700
85∼102
512
3.98
0∼518
0∼0.58
69∼620
Lee and Kim (Lee and Kim, 2008)
3.0∼5.0
280∼410
19.7∼40.8
520∼550
0.93∼4.76
0∼215
0∼0.18
70∼316
Kawamura et al. (Kawamura et al., 2021)
2.86
350
20.3∼21.5
537
1.84
370∼403
0.32∼0.36
114∼171
Vecchio and Shim (Vecchio and Shim, 2004)
4.00∼5.00
457∼466
22.6∼25.9
436∼555
1.80∼3.46
325∼600
0.1∼0.202
141∼244
Rahal (Rahal, 2006)
3.00
340
24.3∼42.2
440
1.60∼2.66
445
0.2
166∼264
Mawlood et al. (Mawlood et al., 2021)
3.85
130
91.5
390
0.38∼1.69
0∼485
0∼0.22
40∼186
Shah and Ahmad (Shah and Ahmad, 2009)
3.00∼5.50
254
52
414
0.33∼2
0∼276
0∼0.1
23∼127
Bentz and Buckley (Bazant and Kazemmi, 2005)
2.94
84∼333
34.3∼36.1
400
1.55∼1.63
0
0
14∼43
Kim et al. (Kim et al., 2013)
2.50
300∼600
31.8∼34.9
529∼651.2
1.9
0
0
60∼261
Arezoumandi et al. (Mahdi et al., 2015)
3.00
407
30∼37.2
414
1.24∼2.49
0
0
111∼173
Ignjatovic’ et al. (Islam et al., 1998)
4.20
235
33.3∼37
555∼580
4.09
0∼300
0∼0.19
91∼163
Pradhan et al. (Pradhan et al., 2018)
2.60
269
42.8
508∼606
0.75∼1.31
0∼352
0∼0.32
81∼162
Knaack and Kurama (Knaack and Kurama, 2015)
3.83
200
31.2∼46.4
572
1.34
0
0
31∼44
Roller and Russell (Roller and Russel, 1990)
2.50∼3.00
559∼762
72∼125.4
436.6∼489.5
1.61∼6.89
406.7∼457.8
0.07∼1.76
301∼2267
Cladera and Mari (Cladera and Mari, 2005)
3.01∼3.08
351∼359
49.9∼87
500
2.24∼2.99
0∼540
0∼0.11
99∼308
Sowik (Sowik, 2012)
2.50∼4.10
220
35
453∼545
1.93
0
0
40∼51
Ros et al. (Serna-Ros et al., 2002)
4.00
206
24.5∼32,6
549.75∼669.6
2.2
0∼669.6
0∼0.12
182∼360
Sherwood et al. (Sherwood et al., 2007)
2.89
280∼1400
28.1∼77.3
452∼494
0.83∼1.34
494∼496
0.10∼0.101
36∼298
Ghannoum (Ghannoum, 1998)
2.50
65∼889
34.2∼58.6
385∼477
1.15∼2
-
-
42∼386
Ahmad et al. (Ahmad et al., 1995)
3.00
198∼216
38.34∼84.83
421
0.96∼4.51
0∼421
0∼0.78
23∼120
Shin et al. (Shin et al., 1999)
2.50
215
52∼73
414
3.77
0∼388
0∼0.94
56∼183
Hong and Han (Hong and Han, 2005)
3.00∼6.00
142∼915
53.7
477
1.01∼4.68
0
0
39∼332
Placas and Regan (Placas and Regan, 1971)
3.36
272
24.8∼30.3
621
0.98∼1.46
0
0
45∼54
Tan et al. (Tan et al., 1997)
2.79∼3.14
400∼448
54.7∼74.7
498.9∼538
2∼5.8
353.2∼385
0.48
135∼265
Morrow and Viest (Morrow and Viest, 1957)
2.76∼7.86
356∼372
14.7∼45.7
483
0.58∼3.79
0
0
83∼182