



Abstract
This investigation examines the efficiency of five distinct strengthening schemes employed to improve the flexural capacity of reinforced concrete (RC) beams. The adoption of strengthening schemes were near-surface mounted (NSM) using Glass fiber reinforced polymer (NSM-GFRP) and Basalt fiber reinforced polymer (NSM-BFRP) specimens, carbon fiber polymer (NSM-CFRP plate), welded wire mesh (NSM-WWM) and ultra-high performance fiber reinforced concrete (UHPFRC (layer. Seven RC beams with 1800 mm length, 150 mm wide, and 250 mm deep RC beam composed of self-compacting concrete (SCC) were tested under four-point bending. One RC beam with adequate flexural reinforcement functioned as the control, while the remaining six had insufficient reinforcement. One beam without strengthening represented the flexure-deficient control, while the other five were strengthened using NSM-GFRP rebars, NSM-BFRP, NSM-CFRP plate, NSM-WWM, and UHPFRC layer. The peak load, failure mode, load-deflection curve, cracking patterns, strain distribution, and ductility of each beam were thoroughly examined and compared. The findings of this investigation revealed that all adopted strengthening techniques led to an enhancement in the flexural capacity of the RC beams, ranging from approximately 18% to 118% in comparison to bare specimens. Beams reinforced with NSM CFRP plates exhibited a notable improvement in short-term deflection and crack width compared to the control beam, while beams strengthened with NSM FRP rebars demonstrated significant enhancements in load carrying capacity and ductility behavior. The enhancement in the flexural capacity of RC beams using small thickness of 20 mm UHPFRC layer and WWM layer was acceptable to the other strengthening schemes. The application of a UHPFRC layer also enhanced the beams’ capacity to control crack width. The UHPFRC layer stands out as a promising approach that can be employed for the restoration and recovery of flexure deficient RC beams. Analytical modeling was utilized to calculate the flexural capacity of the tested RC beams, producing outcomes closely consistent with experimental results.
Keywords
Introduction
Self-compacting concrete (SCC) is an auspicious and novel material that flows on its weight in highly tight steel beams, columns etc. (ACI 237R-07, 2007). When SCC is discharged to any concrete member, the requirement for an external vibrator or need for compaction is reduced significantly (Brouwers and Radix, 2005; Okamura and Ouchi, 2003). SCC was first developed in Japan in the 80’s, and its excellent resistance against segregation is one of its unique properties (Altun, 2004; Chen et al., 2012; Naik et al., 2012). Concrete structures get degraded because of ageing, extreme atmospheric conditions and unforeseen situations, for instance, fire outbreak, seismic activity, modifications in the structural designing code or impacts due to vehicles (Ceroni et al., 2012; Lee and Cheng, 2013; Lu et al., 2005). Rehabilitating degraded structures to satisfy their functional requirements is a cost-efficient, practical answer compared to demolishing and reconstructing the concrete structure (Brühwiler and Denarié, 2013; Kuntal et al., 2017; Sayed et al., 2014). Different techniques have conventionally been employed to rehabilitate and strengthen concrete buildings, for instance, column jacketing (Albidah et al., 2019; Rizzo and De Lorenzis, 2009), post-tensioning, bonding of steel plate with the epoxy and applying carbon fiber reinforced polymer (Altun, 2004; Chen et al., 2012).
Though, the utilization of self-compacting concrete has become popular in the last few years for reinforcing and rehabilitating reinforced concrete members. There are still some methods that still need attention from the researchers (Barros and Dias, 2006). The special perquisites of fiber-reinforced polymer (FRP) materials (Dias and Barros, 2012), for instance, resistance against corrosion (Tetta et al., 2015), convenience in handling, and the high strength-to-weight ratio, classify these materials as appropriate for utilization in concrete structures under situations where using traditional steel rebars have led to unfavorable results. FRP materials are also used to repair and rehabilitate reinforced concrete structures (Tetta et al., 2016). Using fiber-reinforced polymer for reinforcing masonry structures and pre-stressed and reinforced concrete structures has emerged as a highly auspicious material in civil engineering. Among different techniques for rehabilitating different types of structures, using fiber reinforced polymer as a near-surface mounted (NSM) strengthening technique is an encouraging method for improving the shear and flexural strength of reinforced concrete columns, beams etc. (Awani et al., 2016). However, using steel rebars in the near-surface mounted technique has led to different drawbacks, such as corrosion of rebars at the steel interface of bonding material and effort in handling the material in the construction field. To prevent these issues, glass fiber-reinforced polymer (GFRP) is a possible substitute material to strengthen and rehabilitate concrete structures (Gonzalez-Libreros et al., 2017). Tetta and Bournas (2016) tested 10 beams made of near-surface mounted GFRP to improve the beam’s flexural performance. The authors noted that the concrete beams with near-surface mounted glass fiber-reinforced polymer rebars depicted a decrease in the ultimate deflection and enhancement in flexural behavior. The moment capacity increased from 22 to 52% (Tetta and Bournas, 2016). The authors revealed that the equation for the ultimate moment of the concrete beam with glass-fiber-reinforced polymer rebar could be projected from the equations in the American Concrete Institute code 318. Al-Salloum et al. (2012) employed carbon fiber-reinforced polymer (CFRP) to avert a strength and stiffness decrease in concrete beams with drilled openings. The authors revealed that the beam strength was rehabilitated by 23%, and the beam stiffness was recovered by 16%. Azam and Soudki (2014) used an innovative strengthening schemes, such as the use of a hybrid device for anchoring FRP sheets and the enhancement of the performance of reinforced concrete wall-like columns subjected to concentric loading using a combination of NSM/CFRP system, the axial capacity, energy dissipation, and stiffness of reinforced concrete elements were assessed in this research in relation to novel strengthening schemes, offering important insights into the possibilities of cutting-edge reinforcing methods. Hassan et al. Elsanadedy et al. (2013) studied the impact of using CFRP in self-compacting concrete beams; 10 beams were cast and tested with different percentages of CFRP. The authors revealed that both the ultimate moment and stiffness capacity were improved. Various authors have studied the use of steel wire mesh as an outer strengthening material to establish that using steel wire mesh is a suitable method for strengthen and rehabilitating the reinforced concrete members (Bournas et al., 2007; Brückner et al., 2007). Steel wire mesh could replace traditional steel rebars to improve the concrete’s confinement and ductility. Moreover, it has different advantages; for example, it is easy to place and handle, is time-saving, has high strength attributes, offers better resistance against cracks, and has a low cost.
Carbon-FRP rod (CRP) panels, which are produced by attaching small diameter rods to a fiberglass mesh, are increasingly being considered a feasible choice for retrofitting. The spaces between the rods allow for complete adhesive coverage, which improves the adhesion to the existing concrete members. Jawdhari et al. (2020) conducted experimental tests on 44 beams with notch to examine the efficacy of cementitious mortar in adhering CRP to concrete with servel parameters. The results indicated that the mortar was capable of attaining an ultimate load that was 86% of that achieved by epoxy. Additionally, the mortar exhibited a significantly more ductile failure mechanism, characterized by gradual rod slippage. Jawdhari et al. (2019) conducted experimental tests on notched concrete beams to evaluate the flexural bond characteristics of CRP. They used CRPs with a rod diameter of 2 mm. The rod spacing-to-diameter ratio was adjusted within the range of 3–6. The bond length was adjusted on one side of the notch between 25 and 200 mm. It was reported that the stress in each rod individually reached 33–53% of their maximum tensile strength as the ratio of spacing-to-diameter increased from 3 to 6.
Jawdhari et al. (2018) developed finite element (FE) models to analyze the performance of a new retrofitting system. The system consists of small-diameter CRP that are spaced apart at a distance greater than the diameter of the rods. The study examines various important factors. They found that reducing the diameter of the rod or increasing the ratio of rod spacing to diameter enhances the ultimate strength. A CRP panel’s debonding load is 51% greater than that of a conventional CFRP plate that is externally bonded and has the same FRP area.
Regardless of their efficacy enhancing the durability and strength of concrete members, these techniques have some drawbacks (Al-Salloum et al., 2011). For instance, utilizing jacketing technique raises the size and weight of the concrete member, whereas employing a steel plate raises the possibility of rust, fire outbreak and de-bond. Also, when bond material gets old at the concrete’s interface, it lowers the member’s resistance against fire, which is also a problem when employing the fiber-reinforced polymer reinforcing method (Awani et al., 2016; Brückner et al., 2007; Pincheira et al., 1989). Ultra-high-performance concrete (UHPC) is a new type of binding material with excellent compressive and suitable tensile strength (Ibrahim, 2011), incredible durability and low permeability (Alexander and Ramakrishnan, 2016), making it a proper candidate for rehabilitating reinforced concrete members (Gayathri and Kirthiga, 2018; Mansuri et al., 2017). Ultra-high-performance concrete has outstanding strength characteristics, including a compressive strength of higher than 125 MPa (Shaaban et al., 2018), indirect tensile strength of at least 6 MPa, low permeability and increased capability of absorbing external energy (Altin et al., 2005; Li, 2004). Rehabilitation of RC members with UHPC was first done in Switzerland. Currently, further research has been performed to improve the flexural strength of RC beams by applying a coating of UHPC. Paschalis and Lampropoulos (2021) studied the advantages of using 2-inch-thick UHPC material on the surface of a reinforced concrete beam subject to flexural loading. The study revealed a significant enhancement in the stiffness of the beam. Also, the ultimate moment capacity of reinforced concrete beams can be rehabilitated with UHPC (Al-Osta et al., 2017; Alaee and Karihaloo, 2003). Moreover, the thickness of ultra-high-performance concrete, the aspect ratio of fibers, and fibers’ orientation also significantly improve the toughness, ductility, stiffness, and shear strength of the reinforced concrete beams (Farhat et al., 2007; Martinola et al., 2010; Noshiravani and Brühwiler, 2013).
The objective of this study is to compare four different methods of strengthening reinforced self-compacting concrete beams to enhance their flexural capacity. These methods include the use of BFRP rebars, GFRP rebars, WWM, and CFRP plates. As a fifth approach, small thick layer made of UHPFRC were utilized for strengthening. Various parameters such as the load-deflection curve, stresses in concrete and FRP materials and failure mode, were measured and analyzed. The research proposes the use of NSM technology with FRP rebars as a viable option for strengthening RC beams. Furthermore, an analytical analysis was carried out to predict the flexural strength of the tested RC beams.
Experimental program
Materials
Proportions of components in the SCC mixture.

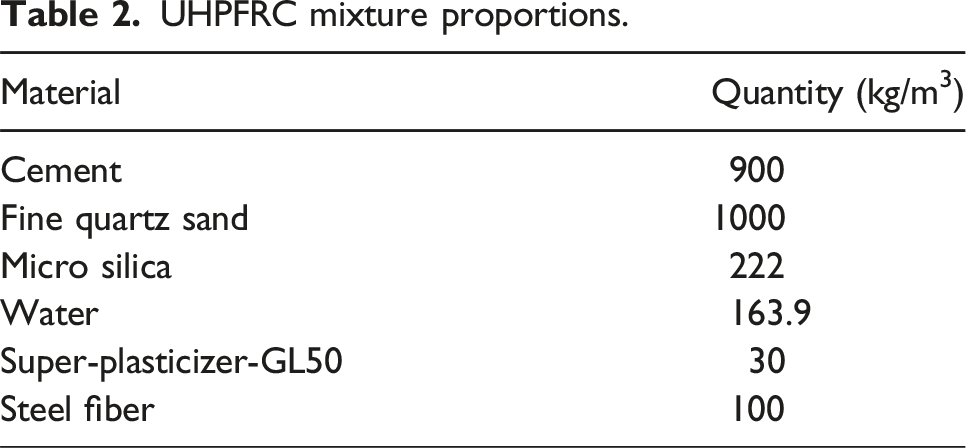
UHPFRC mixture proportions.
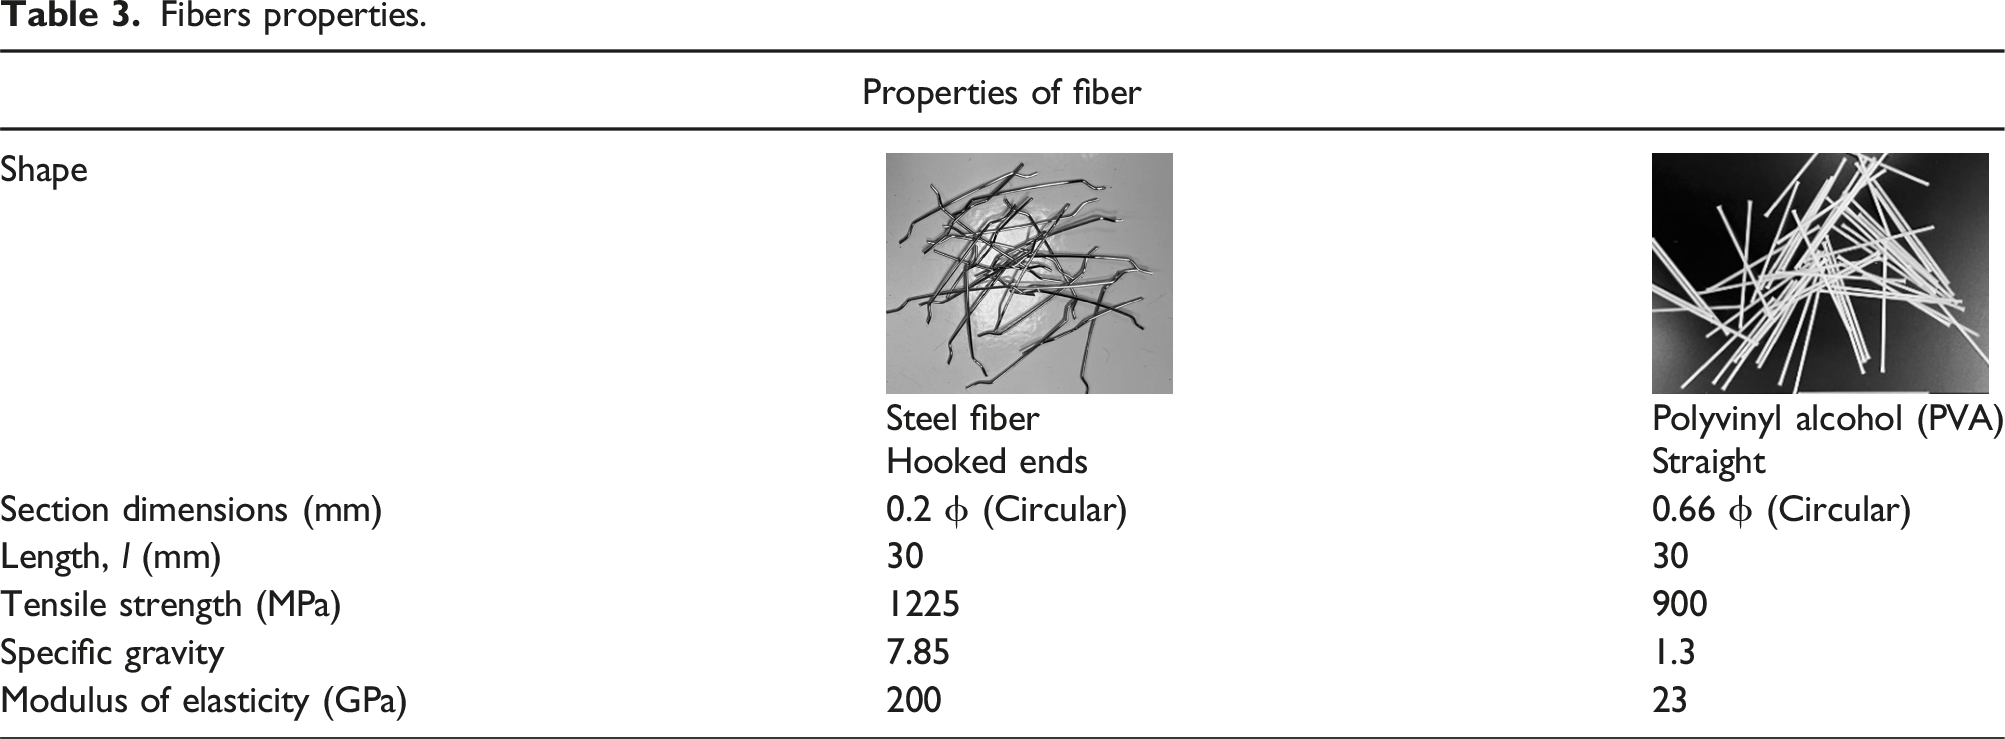
Fibers properties.
FRP and steel reinforcement mechanical characterization.

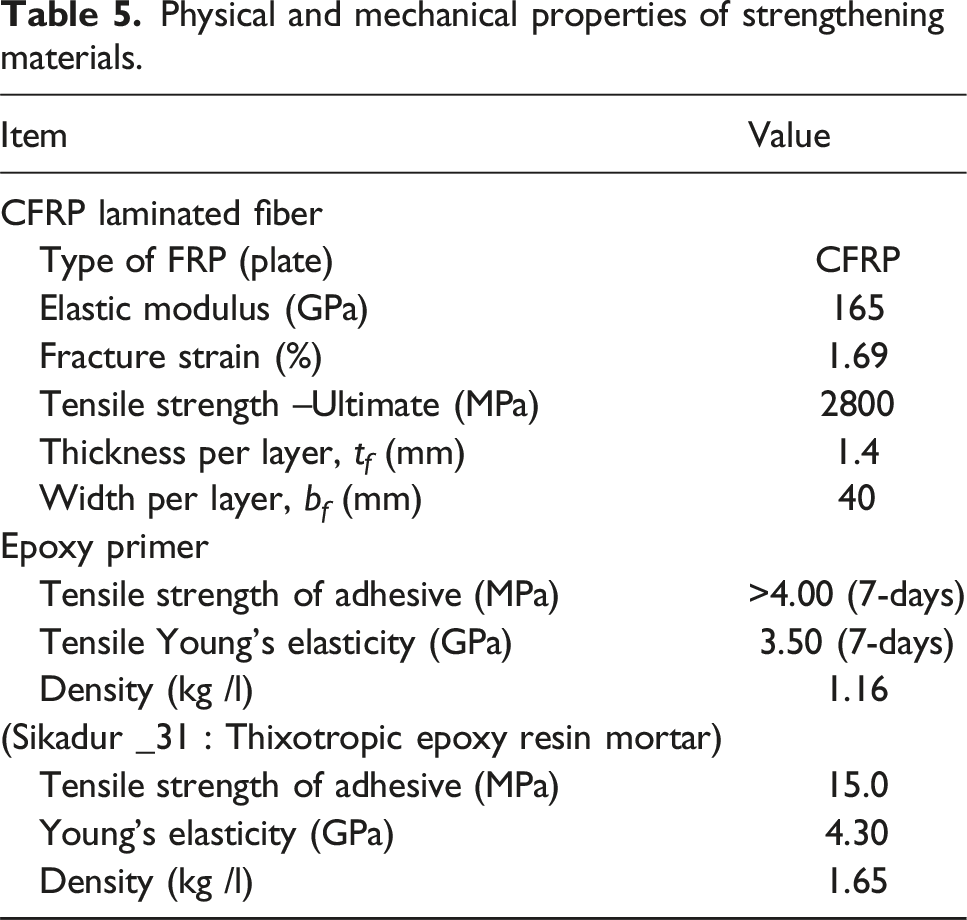
Physical and mechanical properties of strengthening materials.
Test matrix
In the present investigation, a total of seven RC beams were produced and tested under four-point loading. These beams were part of an RC structure that was designed by ACI 318M-14 (2014) and ASCE (2017) to meet the specifications of Seismic Design Category “A”. Each beam had a width of 100 mm, depth of 250 mm, and length of 1800 mm. The beams were supported on two 75 mm steel rollers and had Ø8 mm vertical stirrups with spacing 150 mm. RC beams had a 20 mm thick concrete cover and were reinforced with stirrups of Ø8 mm placed at spacing of 150 mm. The longitudinal steel rebars were bent at 90°C at the ends and supported by Ø8 mm stirrups as shown in Figures 1 and 2. Table 6 summarizes the specifications of the tested beams. This study used five strengthening methods to provide a representative and informative comparison. The selection was made based on the following criteria: (i) a wide range of real-world applications; (ii) the effectiveness and efficiency of the materials used; (iii) different material properties; and (iv) various installation methods. The control beam (B-CON-1) was reinforced with steel bars (2Ø12) placed in one layer, equivalent to 0.6% of flexural reinforcement, while the flexure deficient control beam (B-CON-2) had steel bars (1Ø12). Beams BF-GFRP bars and BS-BFRP bars were flexure deficient beams reinforced with NSM rebar of GFRP and BFRP respectively, respectively. Similarly, beams BF-CFRP plates and BF-WWM were flexure deficient beams reinforced with NSM CFRP plates and NSM Welded Wire Mesh (WWM), respectively. Finally, the flexural deficient beam (BF-UHPFRC) was strengthened with a 20 mm of UHPFRC layer. Control beam specimens’ details: (a) strain gauges (b) Cross section for B-CON-1 and B-CON-2 (Note: All dimensions are in mm). Cross-section details of the strengthened beams: (a) BF-GFRP; (b) BF-BFRP (c) BF-CFRP plate; (d); BF-WWM; and (e) BF-UHPFRC. (Note: All dimensions are in mm). Test matrix of the tested RC beams.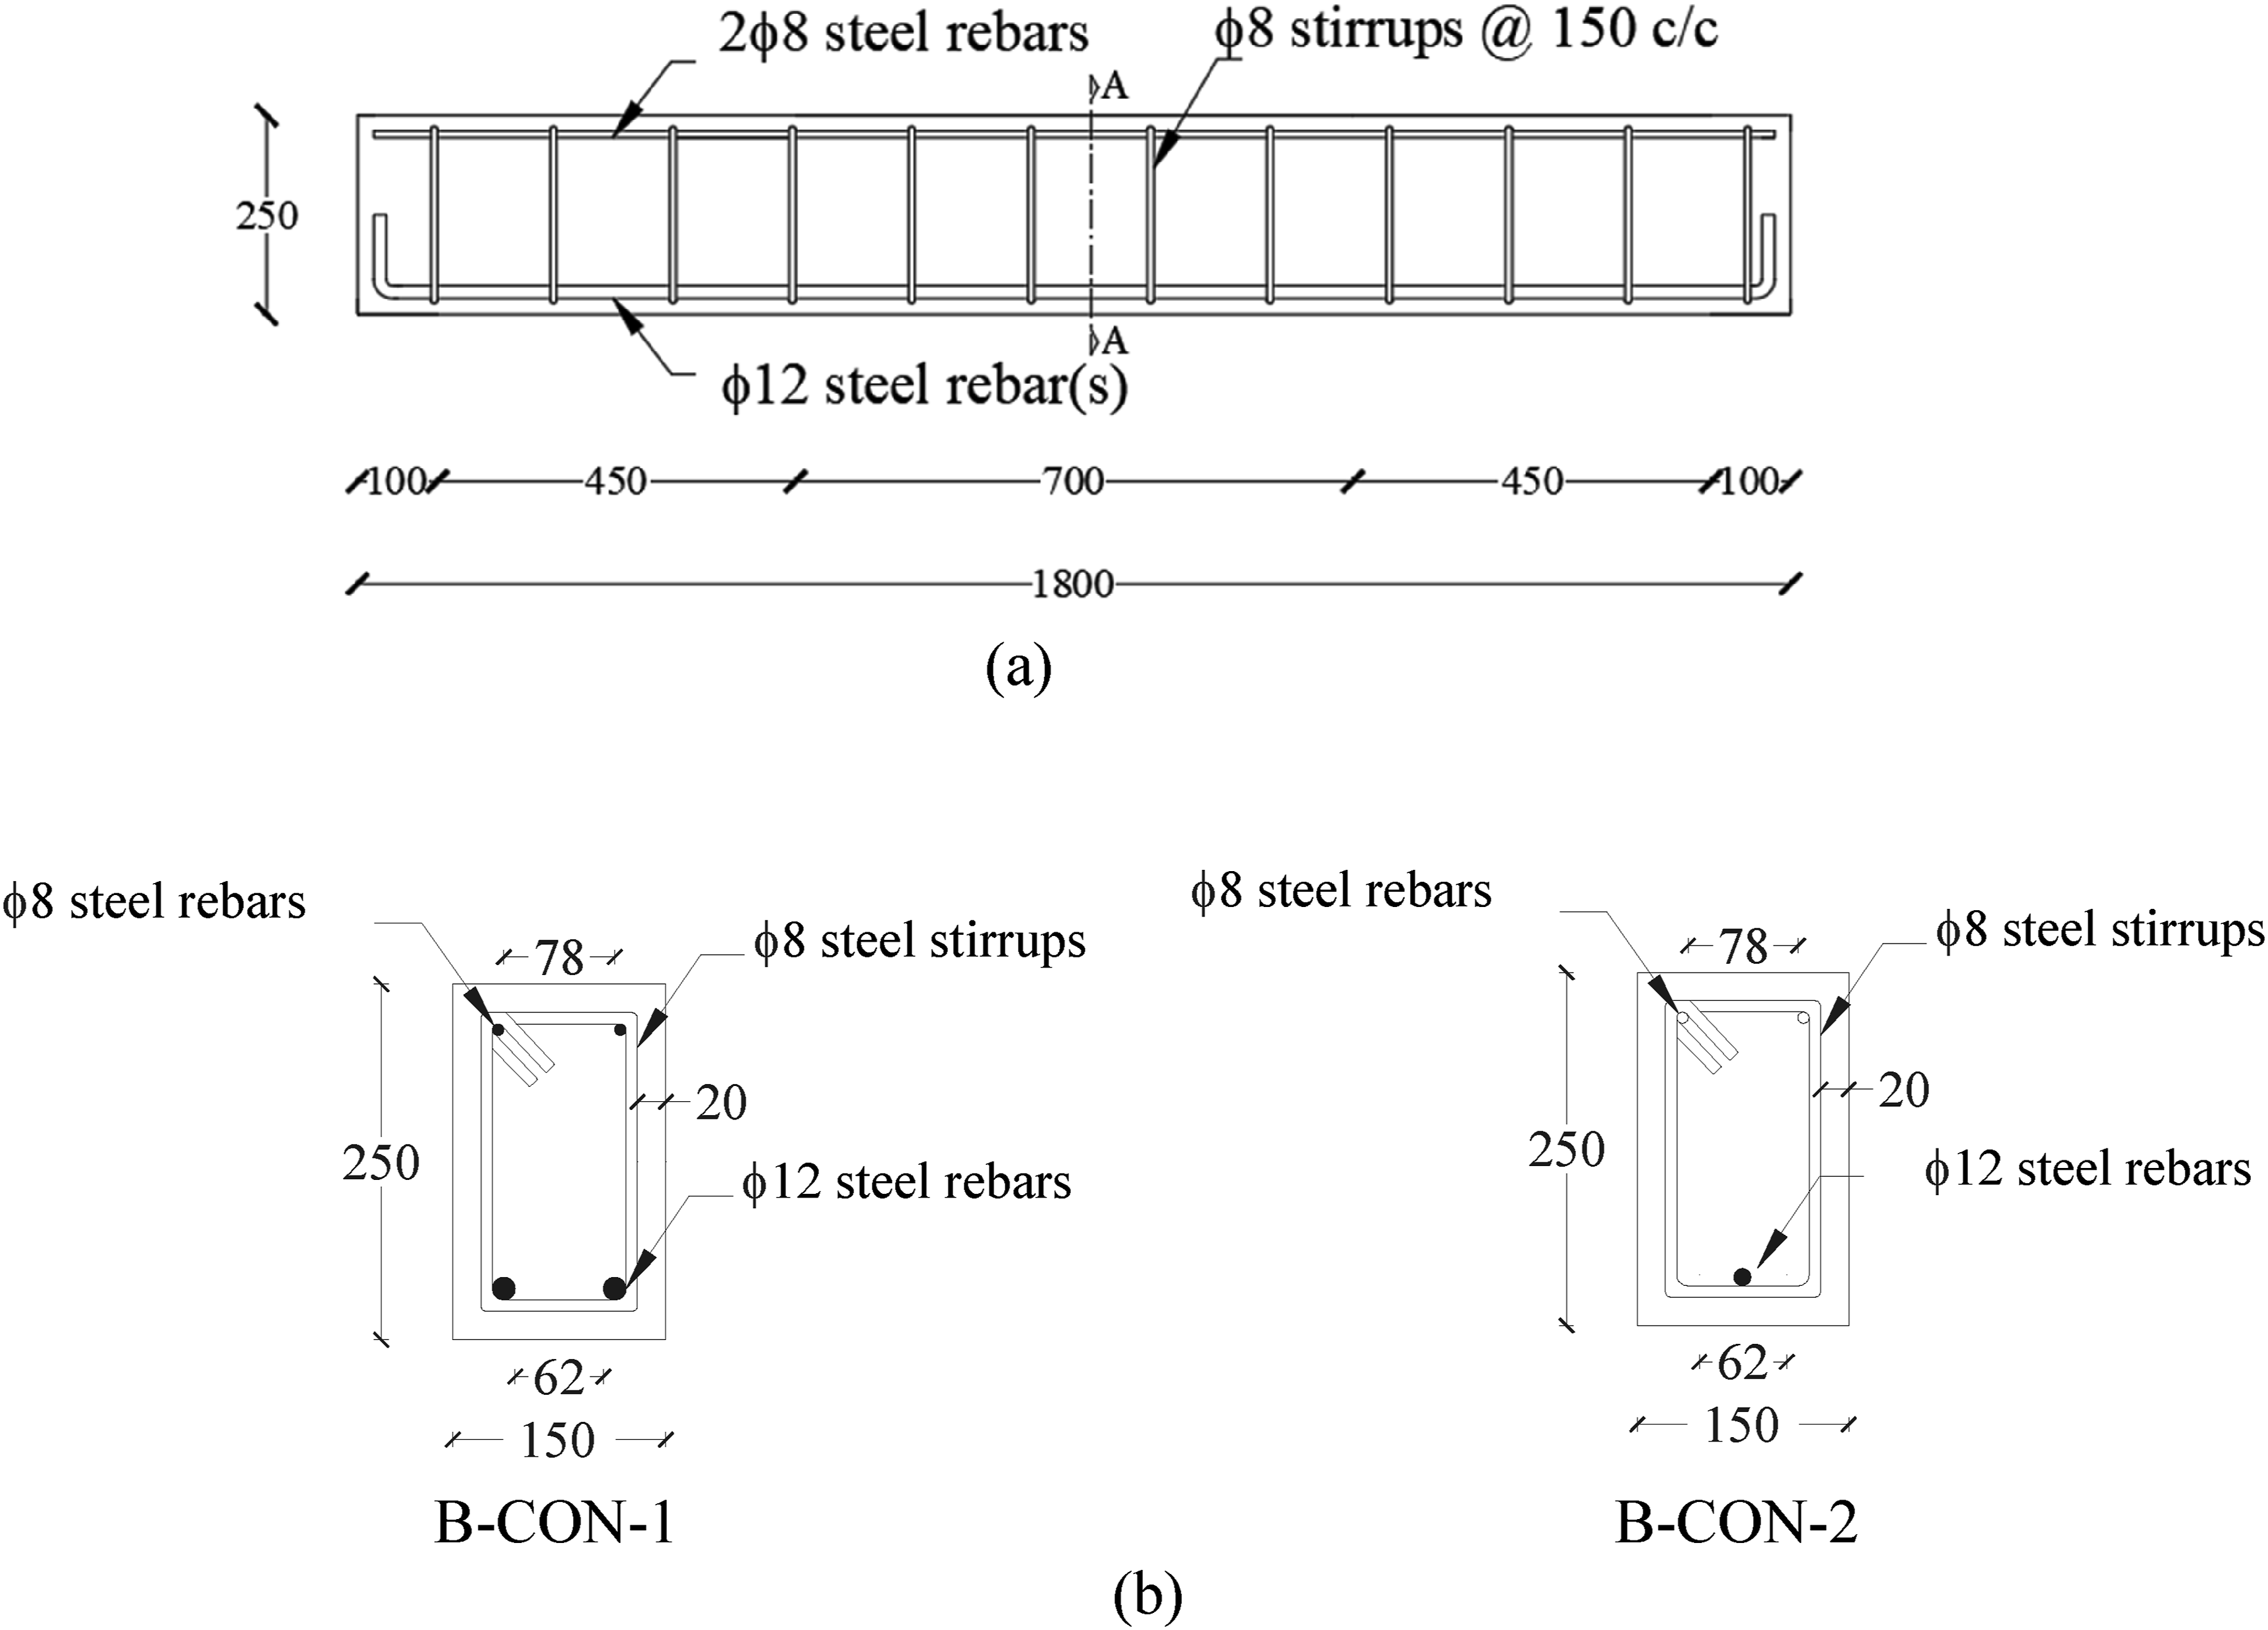

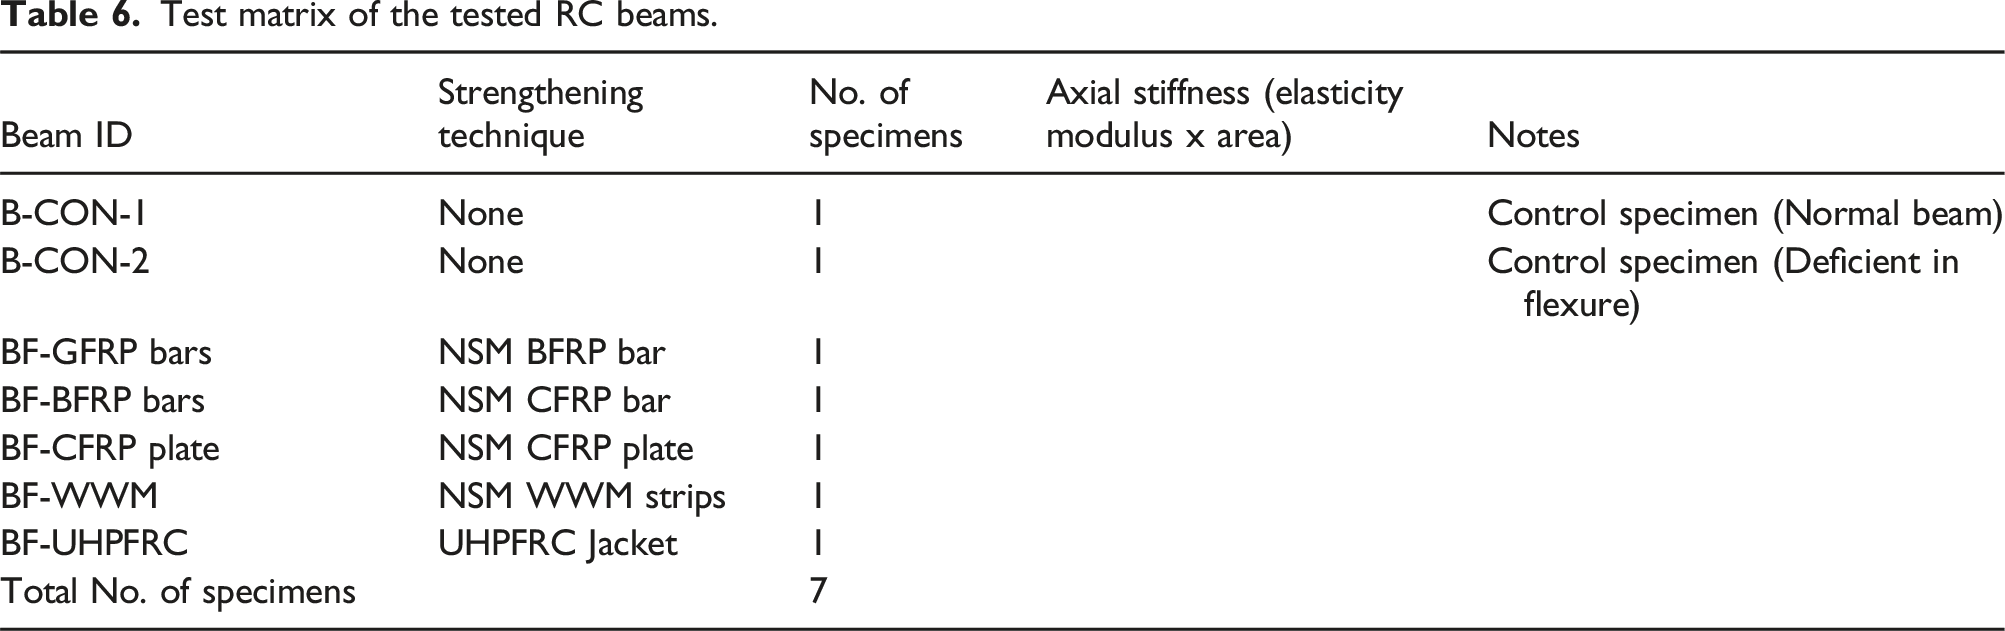
This study designed the dimensions of the NSM grooves for rebars and plates based on ACI 440.2R-17 (2017). For FRP rebars, the width was 20 mm, more than 1.5 times the rebar diameter (12 mm); for plates, the width and length were 20 mm and 60 mm, more than 3.5 times the plate thickness (1.4 mm) and 1.5 times the plate length (40 mm).
Flexural strengthening techniques
In this study, the suggested strengthening methods were chosen after analyzing the failure modes exhibited by the control beams. The purpose was to assess the capability of different strengthening configuration of traditional and innovative strengthening approaches to upgrade the flexure response of deficient RC beams. The used different strengthening scheme are shown in Figure 2 through 4. Details of instrumentation and test setup. Wooden formwork and casting for RC beams: (a) Specimens during preparation; (b) Specimens after casting.

NSM FRP rebar
In this technique, the experiment involved testing two types of beams: one with GFRP bars (BF-GFRP bar) and the other with BFRP bars (BF-BFRP bar). In both cases, a groove with a width of 25 mm and a depth of 20 mm was made at the bottom of the beam, as illustrated in Figure 2(a). The BF-GFRP bar was inserted into the groove for one beam, while the BF-BFRP bar was used for the other. A mortar was then used to fill the grooves. The used mortar type is a thixotropic-epoxy resin mortar (Sikadur-31 CF Slow). The same procedure was followed for both beams, as depicted in Figure 2(b) and Figure 5(a) and (b). Beams after strengthened applied. (a) BFRP rebar, (b) GFRP rebar, (c) CFRP plate, (d) WWM, (e) UHPFRC.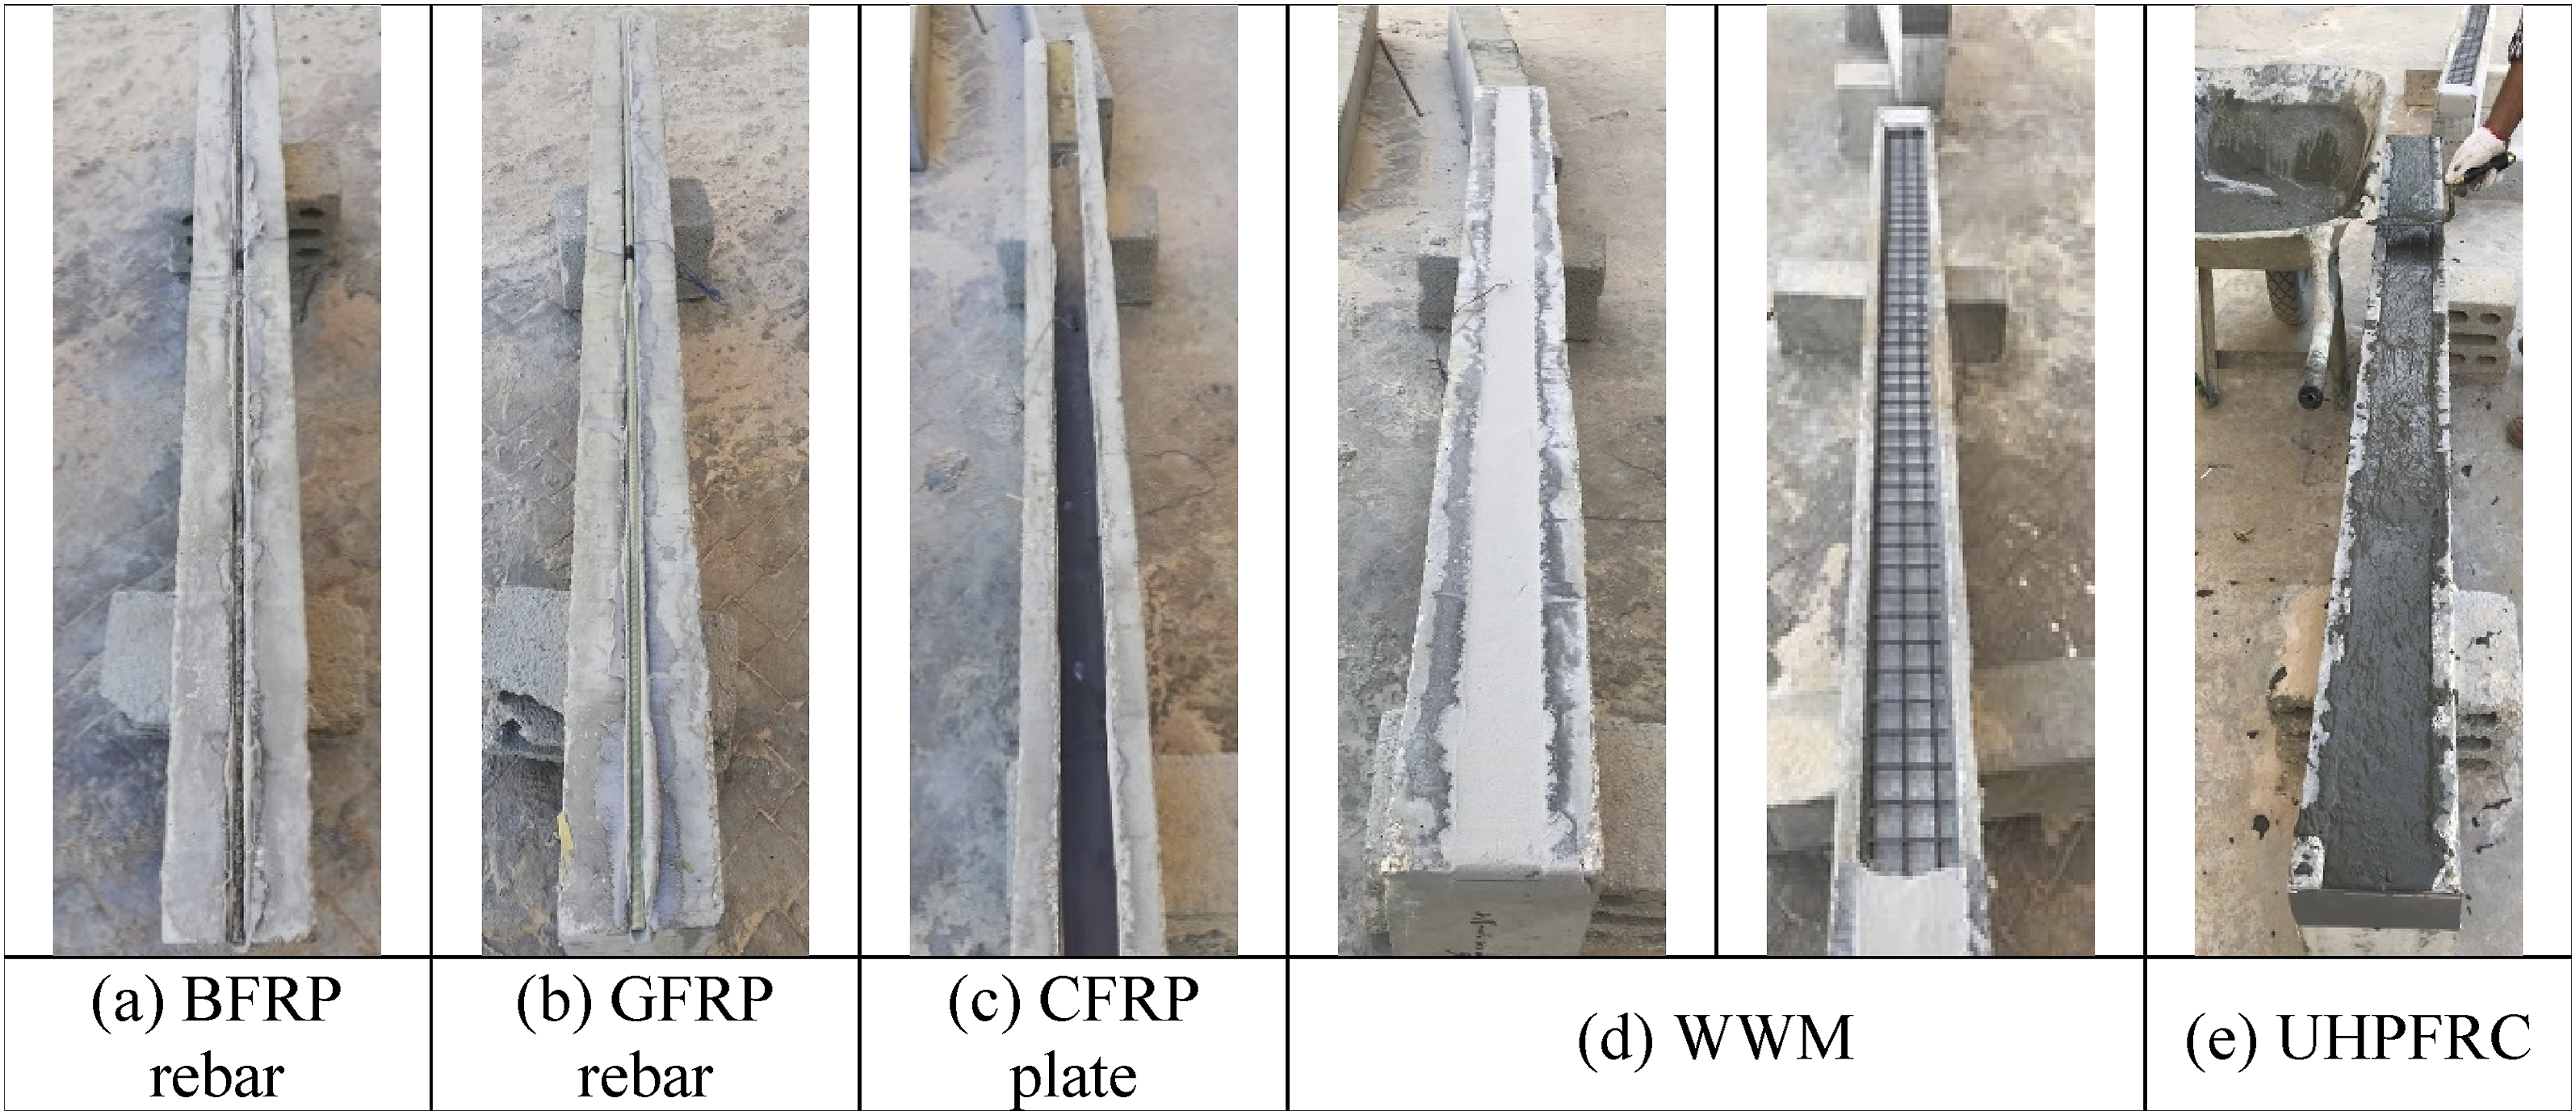
NSM CFRP plate
In this strengthening scheme, one beam was tested after strengthened with CFRP plate (i.e., BF-CFRP plate). The CFRP plate was installed in groove of 20 mm depth and 60 mm in width. The groove was prepared for the CFRP installation by cleaning and filling it with resin mortar (Sikadur-31 CF Slow) before the plate was placed and enclosed within the groove. The epoxy mortar was allowed to fully cure prior to conducting the testing, as shown in Figure 2(c) and Figure 5(c).
Welded-wire mesh (WWM)
The beam (BF-WWM) was subjected to testing in this particular scheme, where it was reinforced using welded wire mesh (BF-WWM). The mesh used had a diameter of Ø4 mm and was spaced at 50 mm in spacing. To create a groove in the bottom of the beam (BS-WWM), a width of 120 mm and a depth of 20 mm were employed, as depicted in Figure 2(c). A welded wire mesh was then installed into the groove and covered with an epoxy resin mortar, as displayed in Figure 2(c) and Figure 5(e).
UHPFRC layer
The UHPFRC mixture was designed to attain compressive and tensile strengths of 138 MPa and 12.8 MPa, respectively, in cylindrical specimens following a 28-day curing period, based on ASTM C39 (2017) and ASTM C496 (2011). In this scheme, a flexural deficient beam was strengthened using a 20 mm thick layer made of UHPFRC, referred to as BF-UHPFRC, as depicted in Figure 2(e) and Figure 5(e), and Figure 4 to 6. After installation, the UHPFRC layer was kept moist cured with wet burlap for a duration of 28 days before conducting tests. Comparison of load versus mid-span displacement for all RC control and strengthened beams.
Testing setup
All the beams underwent testing using a setup of four-point bending using a 2000 kN universal testing machine. The testing was done in a displacement-controlled manner with a loading rate of 0.5 mm/mm. In an approachable and clear way, strain gauges were employed for the purpose of measuring strain in the steel reinforcements and strengthening schemes. The deflection at beam mid span was determined employing a linear variable displacement transducer (LVDT), as depicted in Figure 3. In addition, Figure 1(b) depicts the positioning of strain gauges (TML-Type: FLAB-5-11-1LJC-F): two gauges on the transverse (stirrups) and one on the longitudinal bars to measure the strains in the bars. Those gauges were put in at the expected dominant shear and flexural zones.
Findings and discussion
Load-displacement characterization
Results of experiments on the flexure strength of all tested beams.
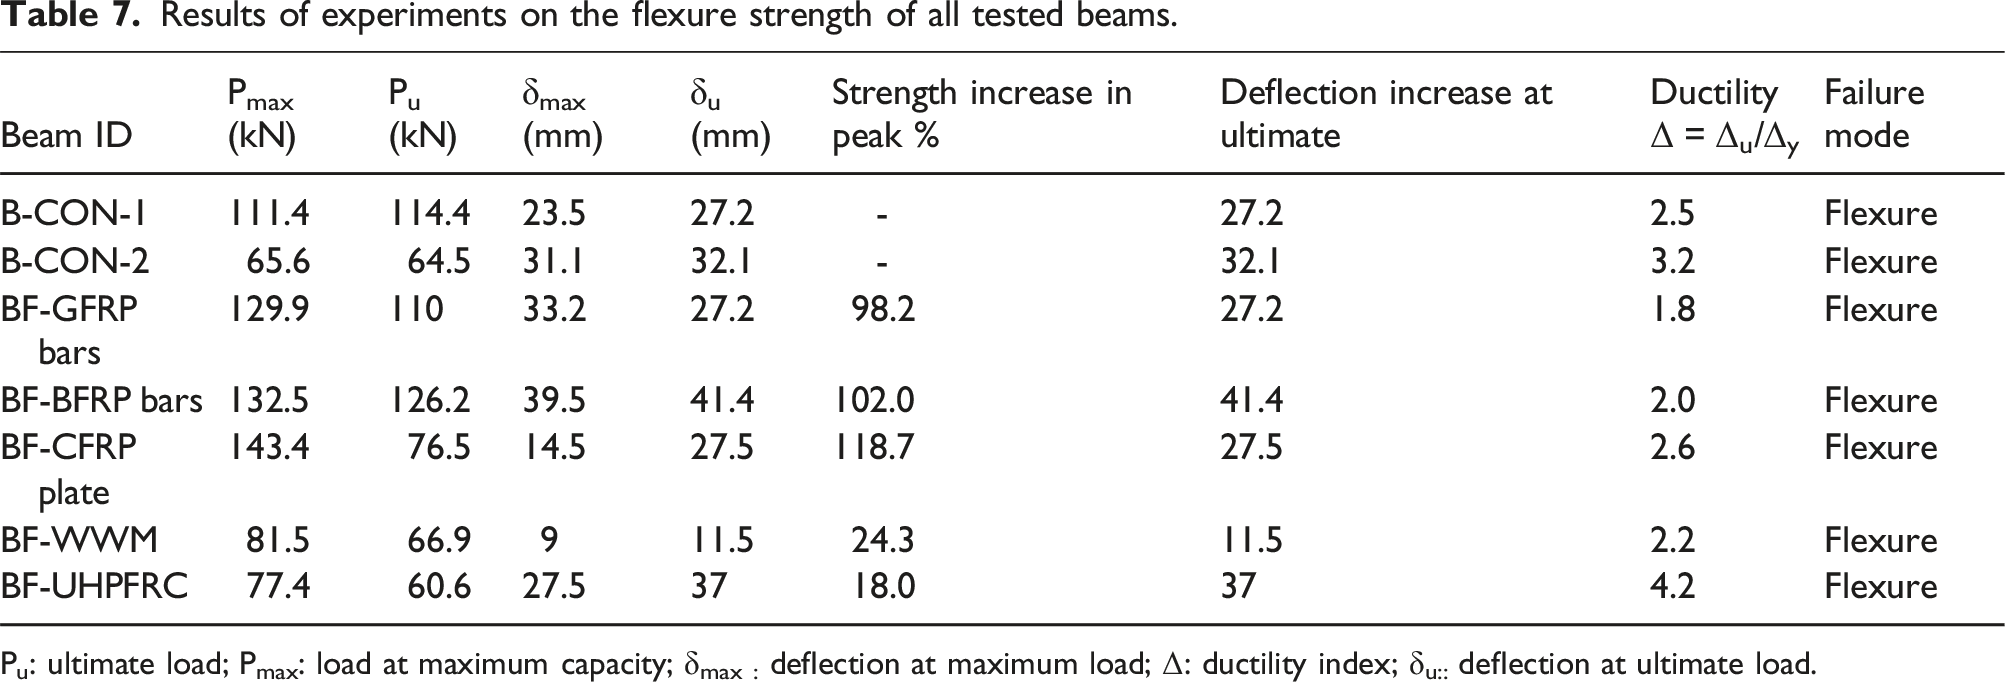
Pu: ultimate load; Pmax: load at maximum capacity; δmax : deflection at maximum load; Δ: ductility index; δu:: deflection at ultimate load.
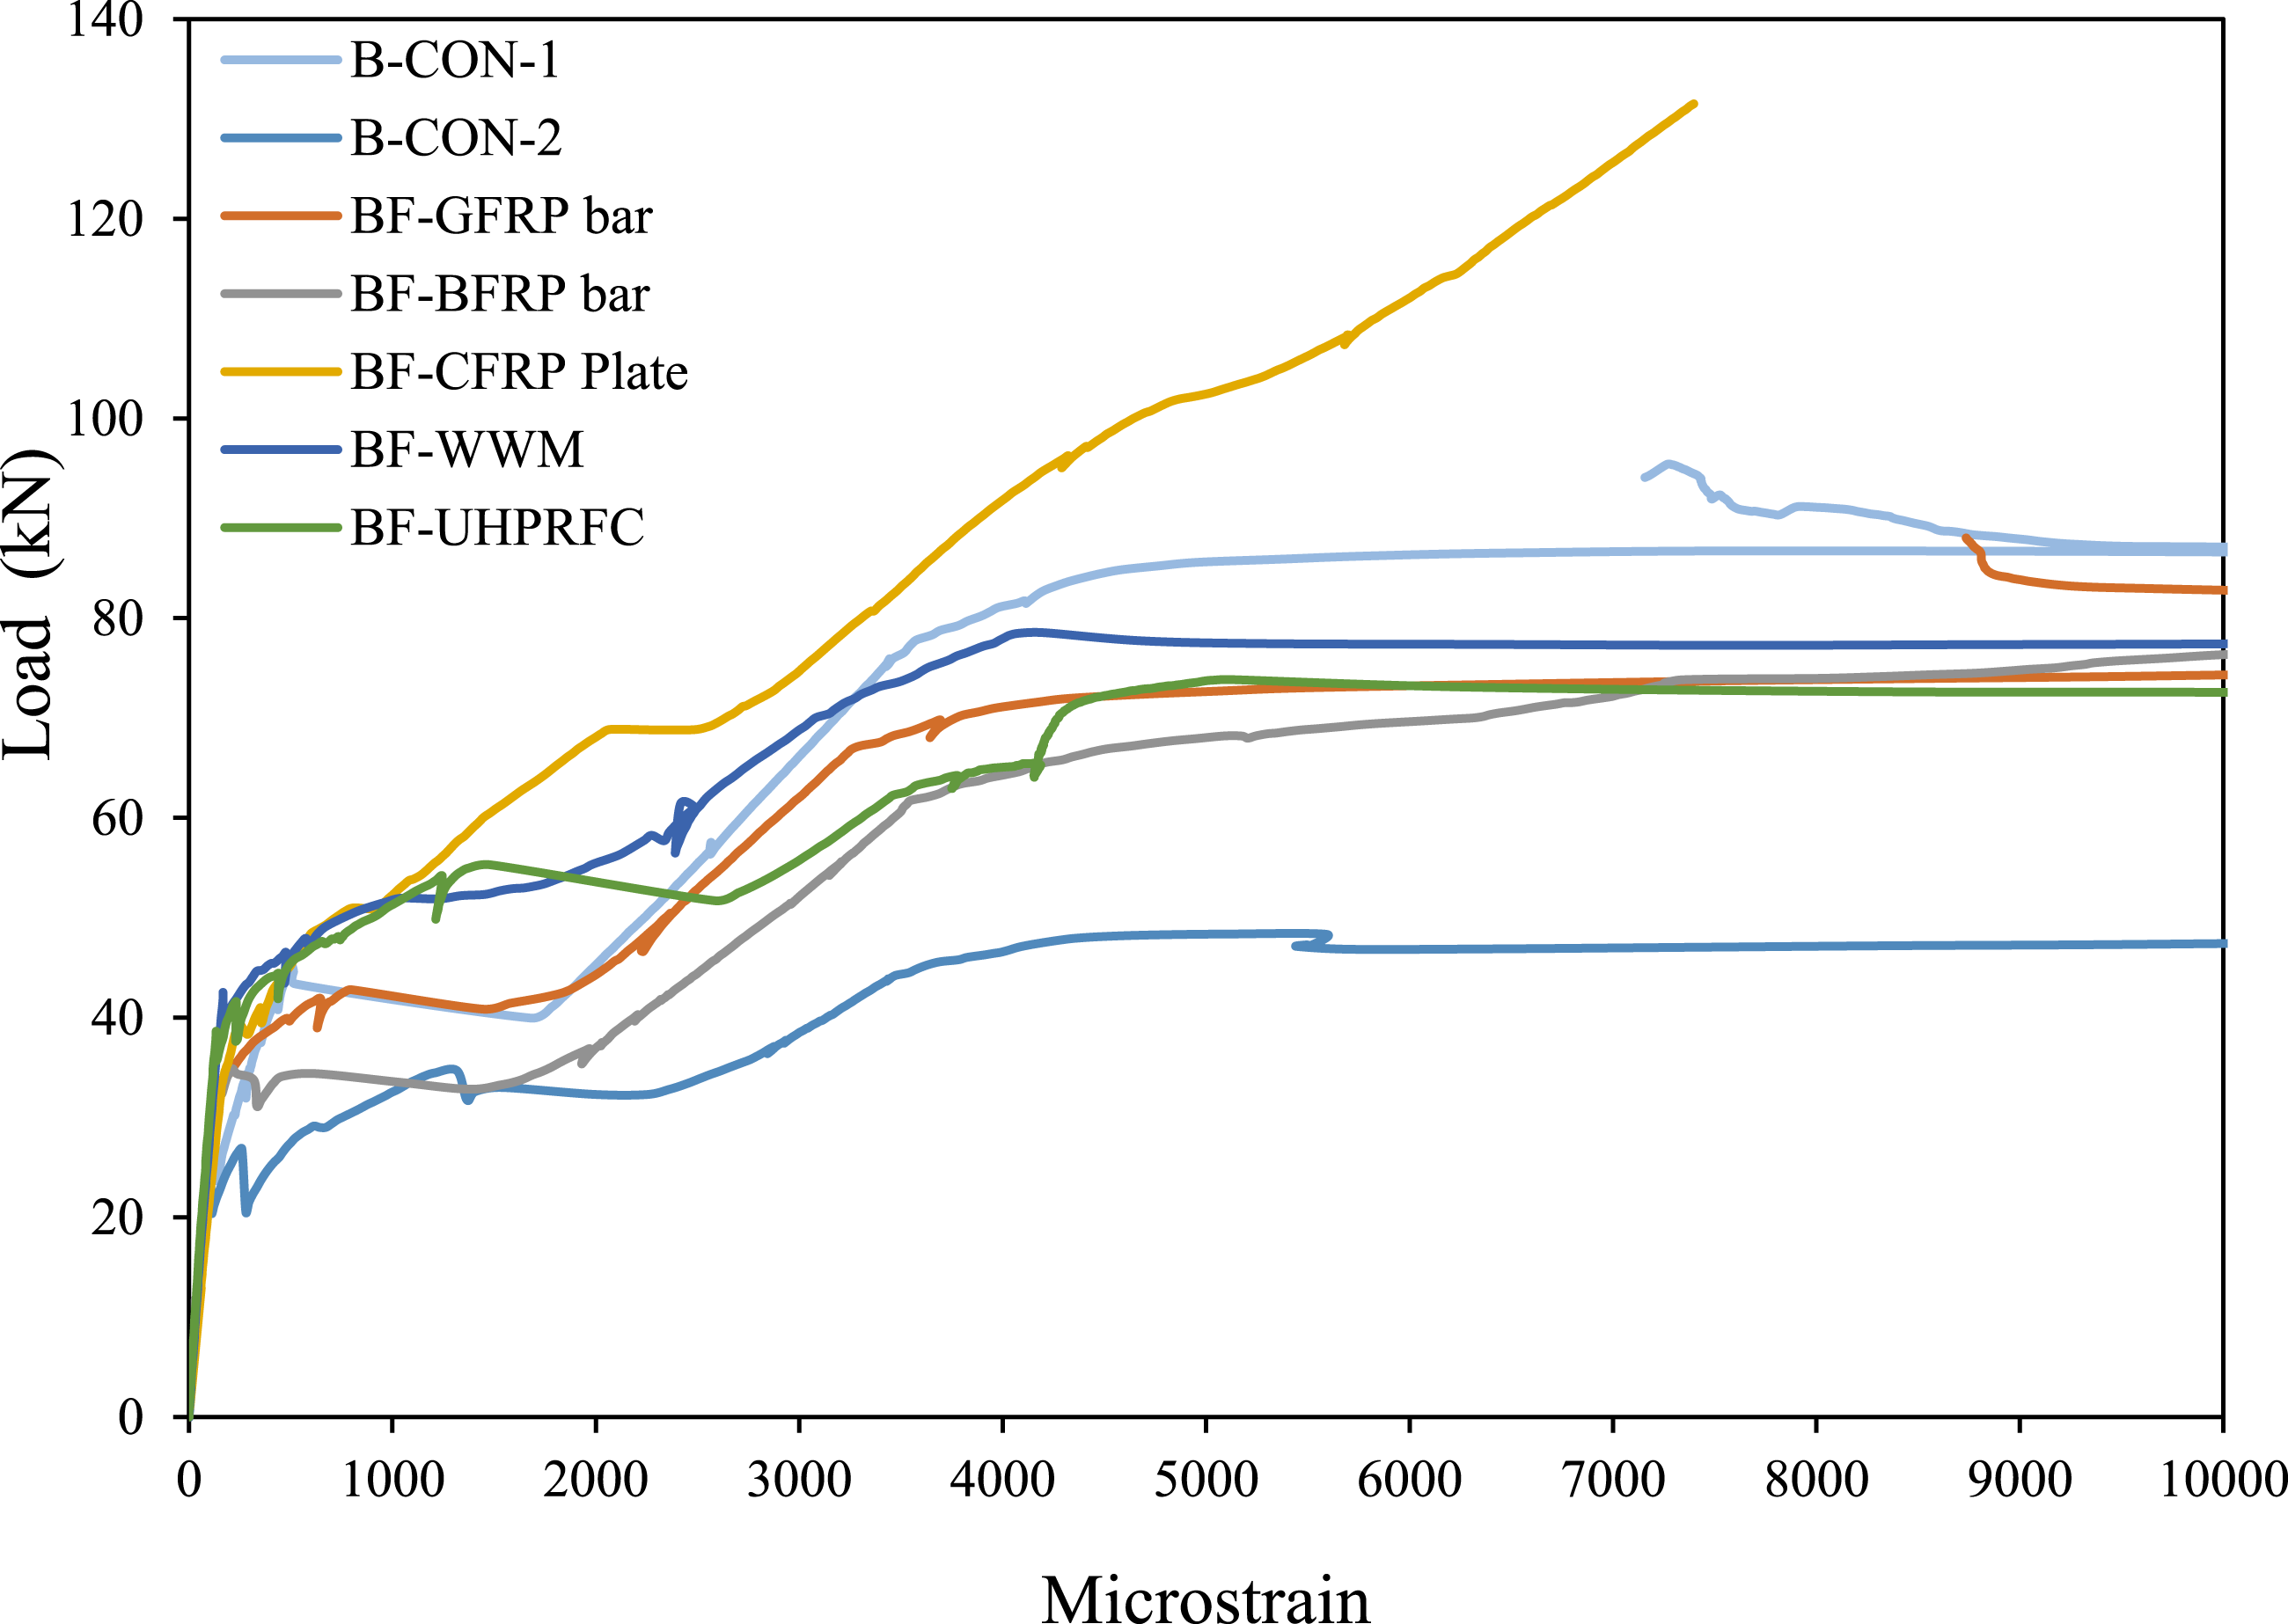
Variation of strains in longitudinal rebars.

Strains variation in stirrups rebars.
All strengthening schemes achieved full tensile strength, as the failure of the strengthening layer led to the failure of the strengthened beams (as will be discussed in the next section). The analysis revealed that the increase in load-carrying capacity for different schemes is proportional to the tensile strength of the strengthening layer added in each scheme. Figure 9 clearly indicates that the minimum enhancement in load carrying capacity is for Scheme S5 (BF-UHPFRC), which has the lowest tensile strength. Scheme S3 (BF-CFRP plate) exhibits the highest peak load enhancement. The relationship between the tensile strength of the strengthening layer and load-carrying capacity.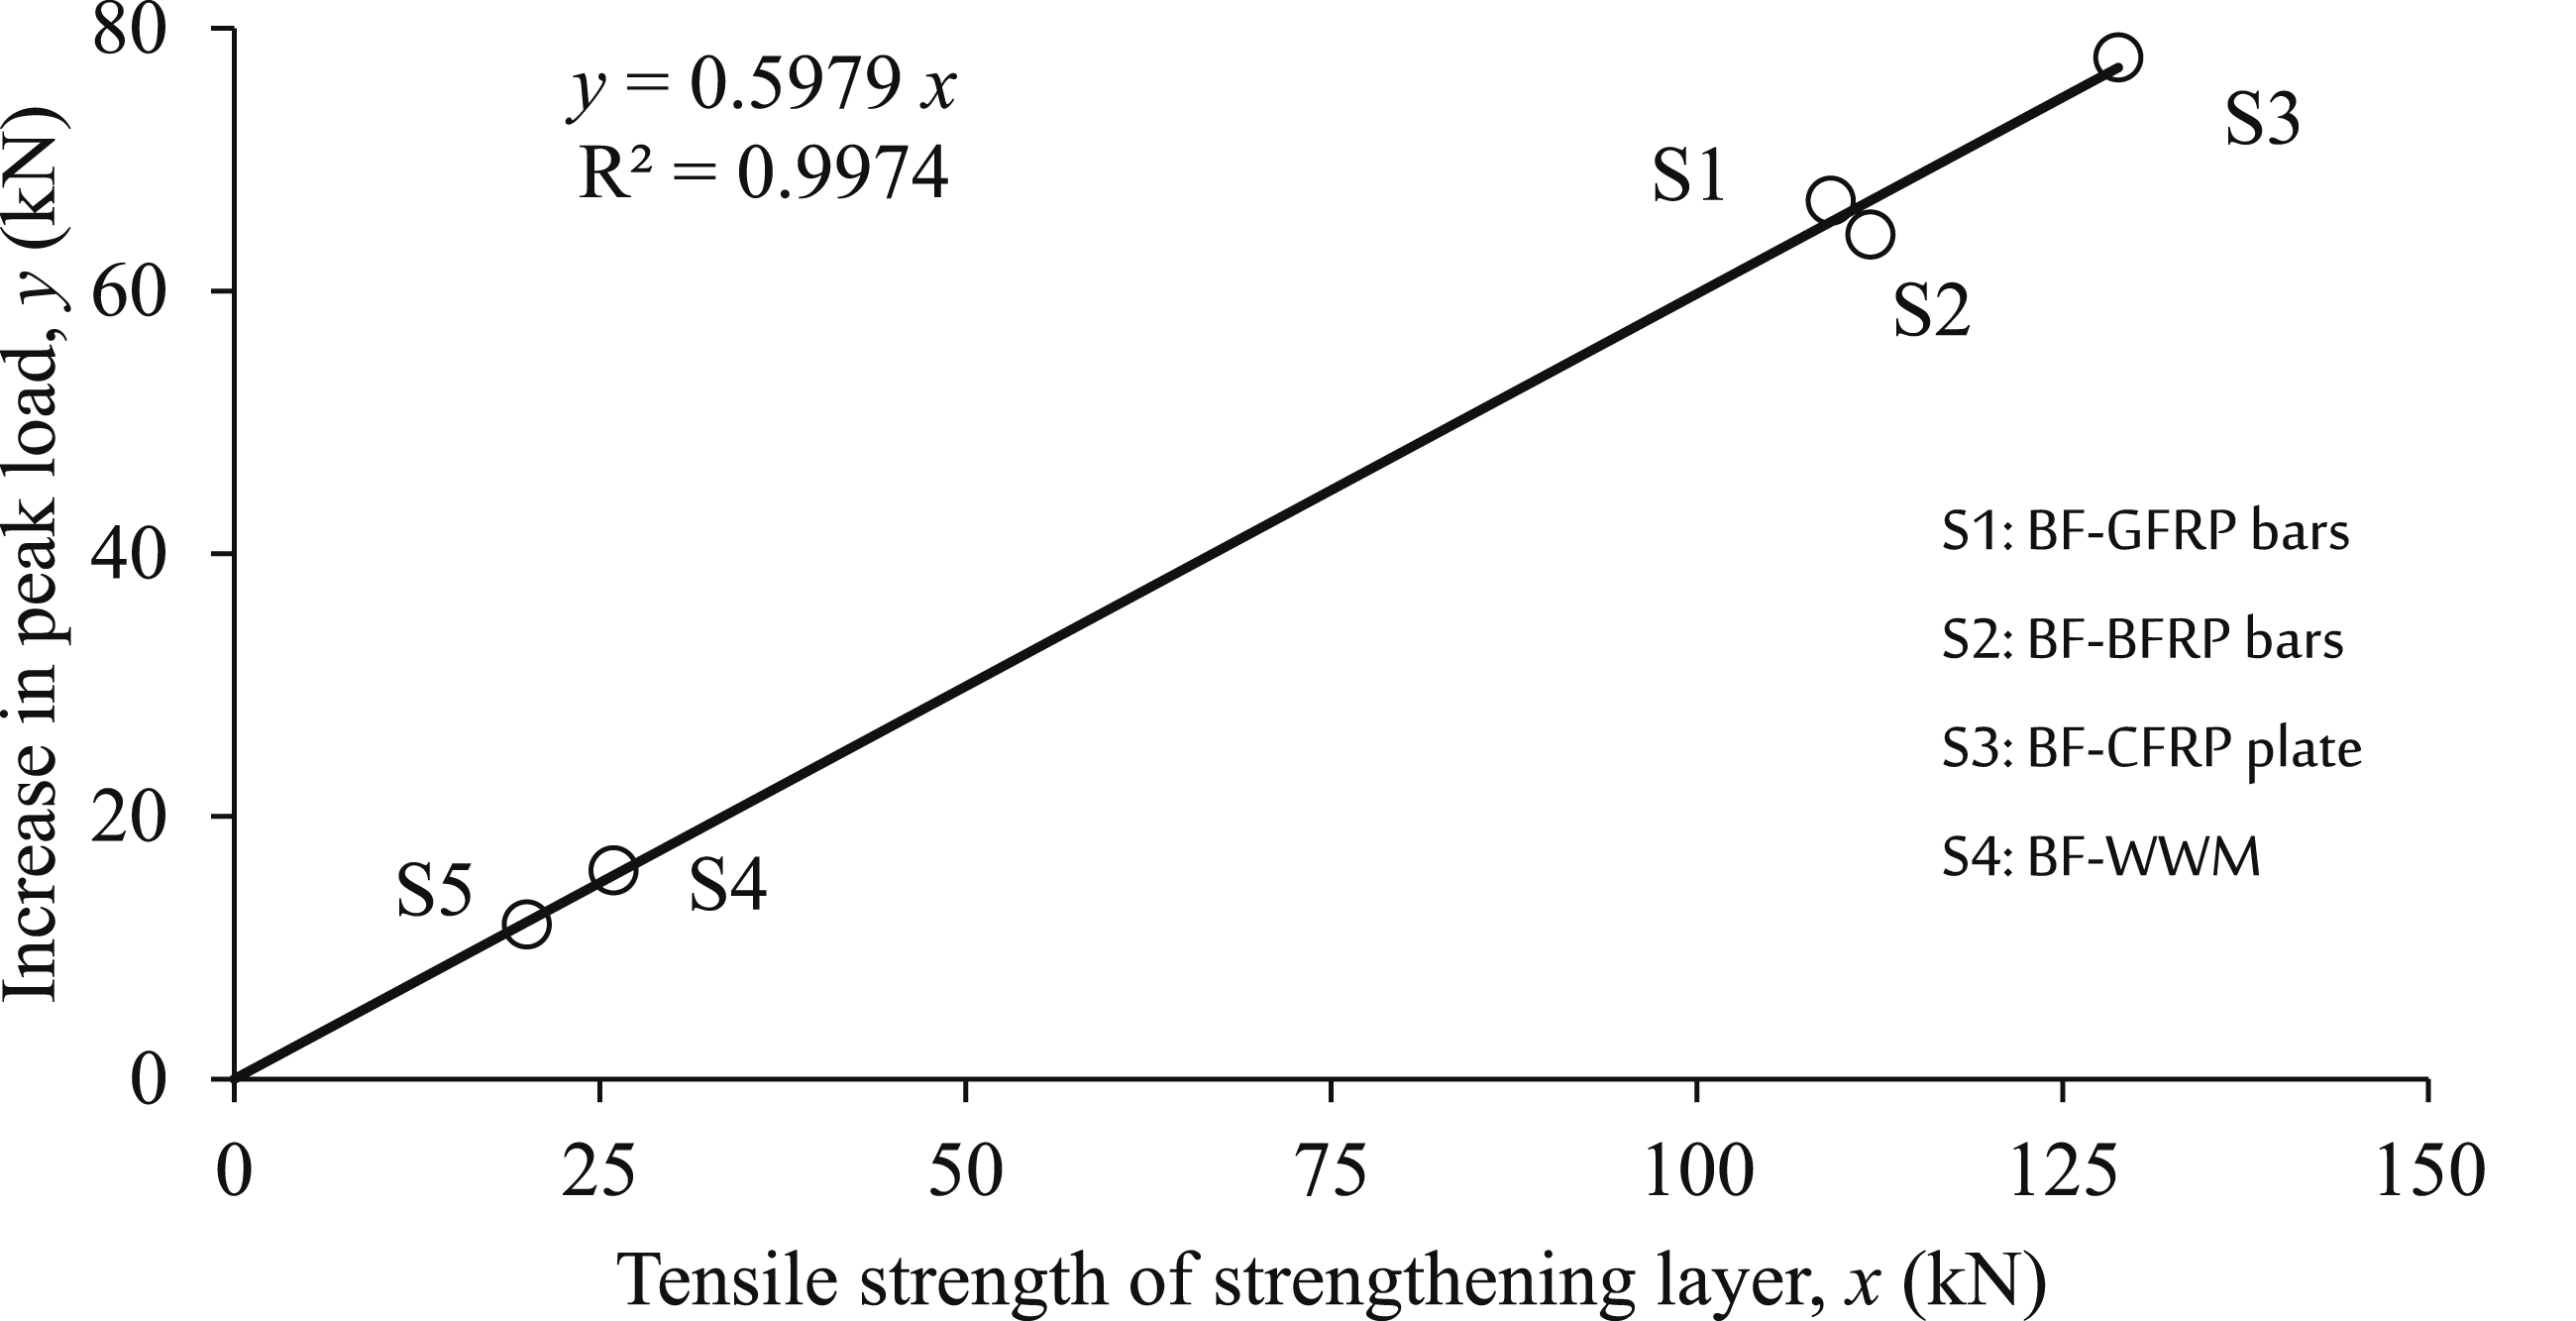
Control specimens
Figure 6 indicates that both beams had similar initial stiffness. However, the load capacity of beam (B-CON-1) was higher at 111.4 kN in comparison to the beam that were designed to be deficient in shear (B-CON-2) which had a capacity of 65.6 kN. Beam B-CON-1 also had a mid-span deflection of 23.5 mm, while B-CON-2 had a deflection of 31.1 mm. The longitudinal reinforcements of both beams had passed the yielding point at the maximum load. As displayed in Figure 8, the strain in the longitudinal reinforcement of all control beams exceeded the yielded strain of 2000 microstrain.
NSM FRP rebars specimens
In Figure 6, it is evident that the strength of the beams reinforced with GFRP rebars (BF-NSM-GFRP bar) and BFRP (BF-NSM-BFRP bar) was significantly higher than the control beam (BF-CON-1). This is likely due to the strong bonding and high tensile strength of the GFRP bars in a thixotropic epoxy resin mortar. The load carrying capacity of BF-NSM-GFRP bar was 129.9 kN and 132.5 kN for BF-NSM-BFRP bar, which represents an increase of 98.2% and 102%, respectively, in comparison to the flexure deficient bare beam (B-CON-2). In contrast to the reference beam (B-CON-1), the load capacity increased by 49.5% and 50.4% in beams BF-GFRP bars and BF-BFRP bars, respectively. Both RC beams displayed a linear behavior until load of 65 kN, after which stiffness decreased until failure. In the nonlinear phase, there was a significant increase in deflection. The major cracks occurred at the bottom of the loading points in NSM BFRP specimen, and the failure was due to the loss of bond between the FRP bars and the adjoining adhesive, along with cracking and peeling of the adhesive at the surface. Both FRP material showed higher stiffness than control specimens. The reason behind this could be that the NSM reinforcement in the beam that was fully strengthened with bonding behaved like a beam action (Thermou et al., 2014). The failure of the BFRP was concentrated along the groove, pointing to the existence of an effective failure zone in close proximity to the installed NSM bar. In NSM-GFRP specimens, the longitudinal GFRP bars and BFRP bars strains in the tension region was 0.696% and 1%, respectively, at the ultimate load. After reaching the maximum load, there was a progressive decline in strength. Flexural cracks dominated beam failure, but Figure 8 shows a notable contribution to flexural capacity post the peak load. The NSM-GFRP and NSM-BFRP had minimal impact on the cracks that formed at the midspan of the beam.
BF-CFRP plate specimen
Figure 6 presents the characteristics of SSC beams strengthened with bonded CFRP plates (BF-CFRP plates) in terms of load and displacement. The strengthened beams demonstrated an average ultimate load of approximately 132.5 kN, accompanied by a deflection of 39.5 mm. Comparing the strengthened beams to their respective control beams, it can be observed that they exhibited greater stiffness, particularly in the post-cracking part of the load-displacement curves. The figure also indicates a significant increase in the ultimate failure load for the beams strengthened with bonded CFRP plates, with the load capacity of the beam (BF-CFRP plates) demonstrating a remarkable 118.7% increase in comparison to the flexure deficient reference beam (B-CON-2). The condition of the bond between the concrete and CFRP plates was observed to be satisfactory. At the point of failure, there was a sudden drop in the load applied to the beam, as depicted in Figure 6.
BF-WWM specimen
In the case of WWM specimen, the behavior of load displacement of the beam might be divided into three different regions, namely the elastic region, the region with reduced stiffness is the linear region, followed by the post-yield region, as depicted in Figure 6. When compared to the BF-CON-2 beam, the welded wire mesh-strengthened beams exhibited considerably higher strength gain, with a slightly increased stiffness. The reinforcement in the tension region attained yielding at 85% of the maximum load, resulting in a strain of 0.41% at the ultimate load of 81.5 kN. At a load of 68 kN and a displacement of 13 mm, the mesh wire reached the yield strain. Upon reaching the maximum load, there was a sharp decline in load, followed by a constant load until a deflection of 38 mm. This rise in strain may be owing to the expansion of existing flexural cracks. Since the specimen failed due to flexural, the strain gauge readings installed in the stirrups should be small. As shown in Figure 8, the significant deviation from other specimens can be attributed to the manufacturing imperfections of strain gauges. The beam’s load capacity (BF-WWM) shows a remarkable 24.2% increase compared to the flexure-deficient reference beam (B-CON-2).
BF-UHPFRC specimen
The BF-UHPFRC beam displayed a greater initial stiffness compared to the deficient control beam. The incorporation of UHPFRC resulted in an improvement in both the load at ultimate and post peak deformation, as indicated in Figure 6. The beam’s load capacity was enhanced by 18%, reaching 77.4 kN with a mid-span deflection of 27.5 mm, when strengthened with a UHPFRC jacket. The UHPFRC fibers were effective in preventing crack widening by transferring stresses across the cracks, thereby increasing the beam’s load carrying capacity. The beam exhibited an elastic response up to a load of 45 kN, and thereafter showed reduced stiffness until the maximum load. Although other cracks gradually closed, one located in the middle of the beam widened until the ultimate load of 77 kN was reached. The main reinforcement exhibited a strain of 0.47% at the maximum load. Due to the strain hardening characterization of steel, there was a rise in the beam’s load-bearing capacity, which persisted until the midspan deflection reached approximately 16 mm. At this point, loading was discontinued and unloading occurred until the ultimate load was reached. The beam displayed a highly ductile failure and can be classified as a typical flexural failure. The beam’s load capacity (BF-UHPFRC) shows a remarkable 18.0% increase compared to the flexure-deficient reference beam (B-CON-2).
Failure modes
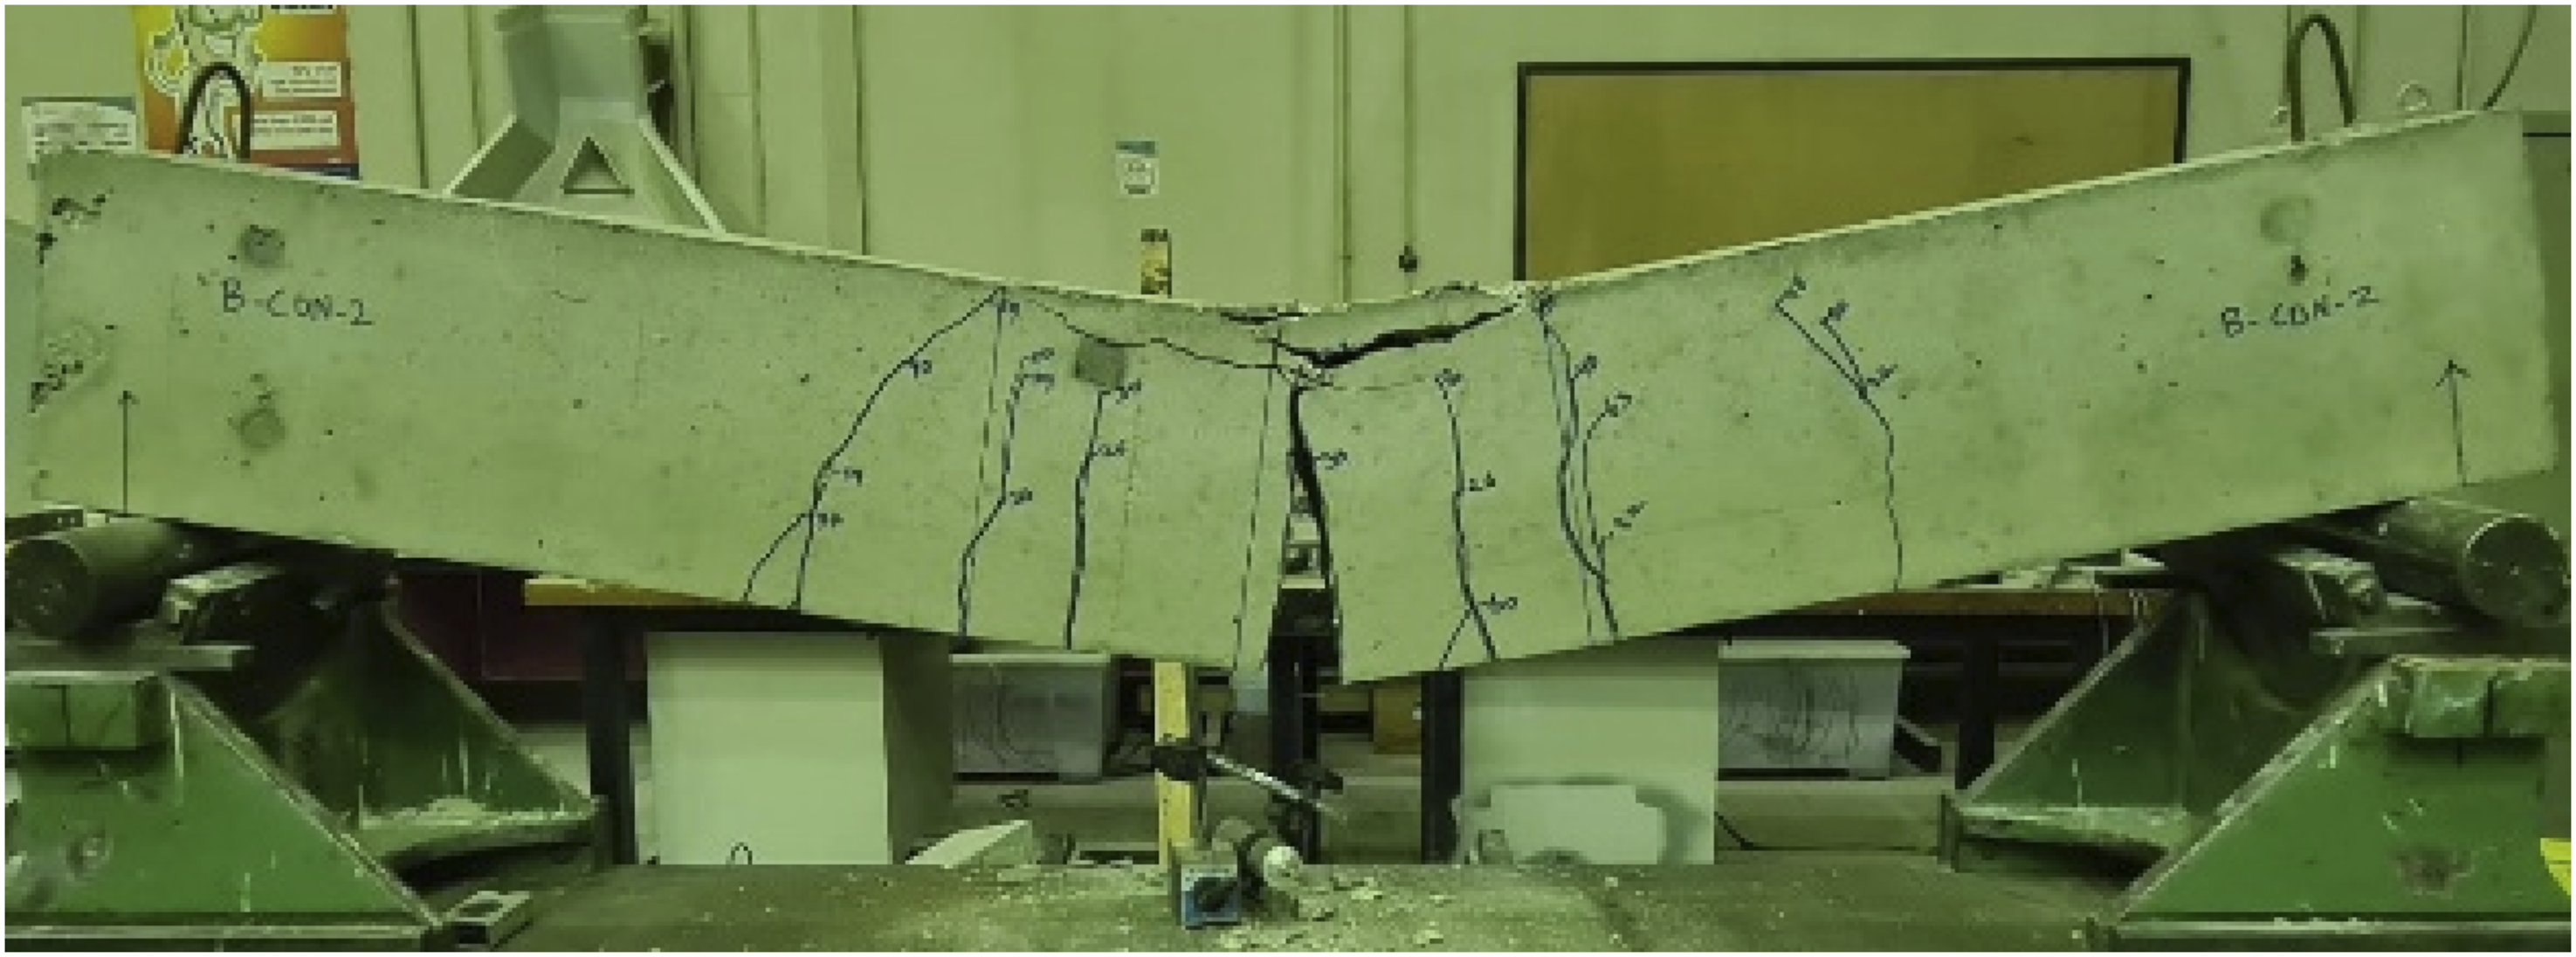
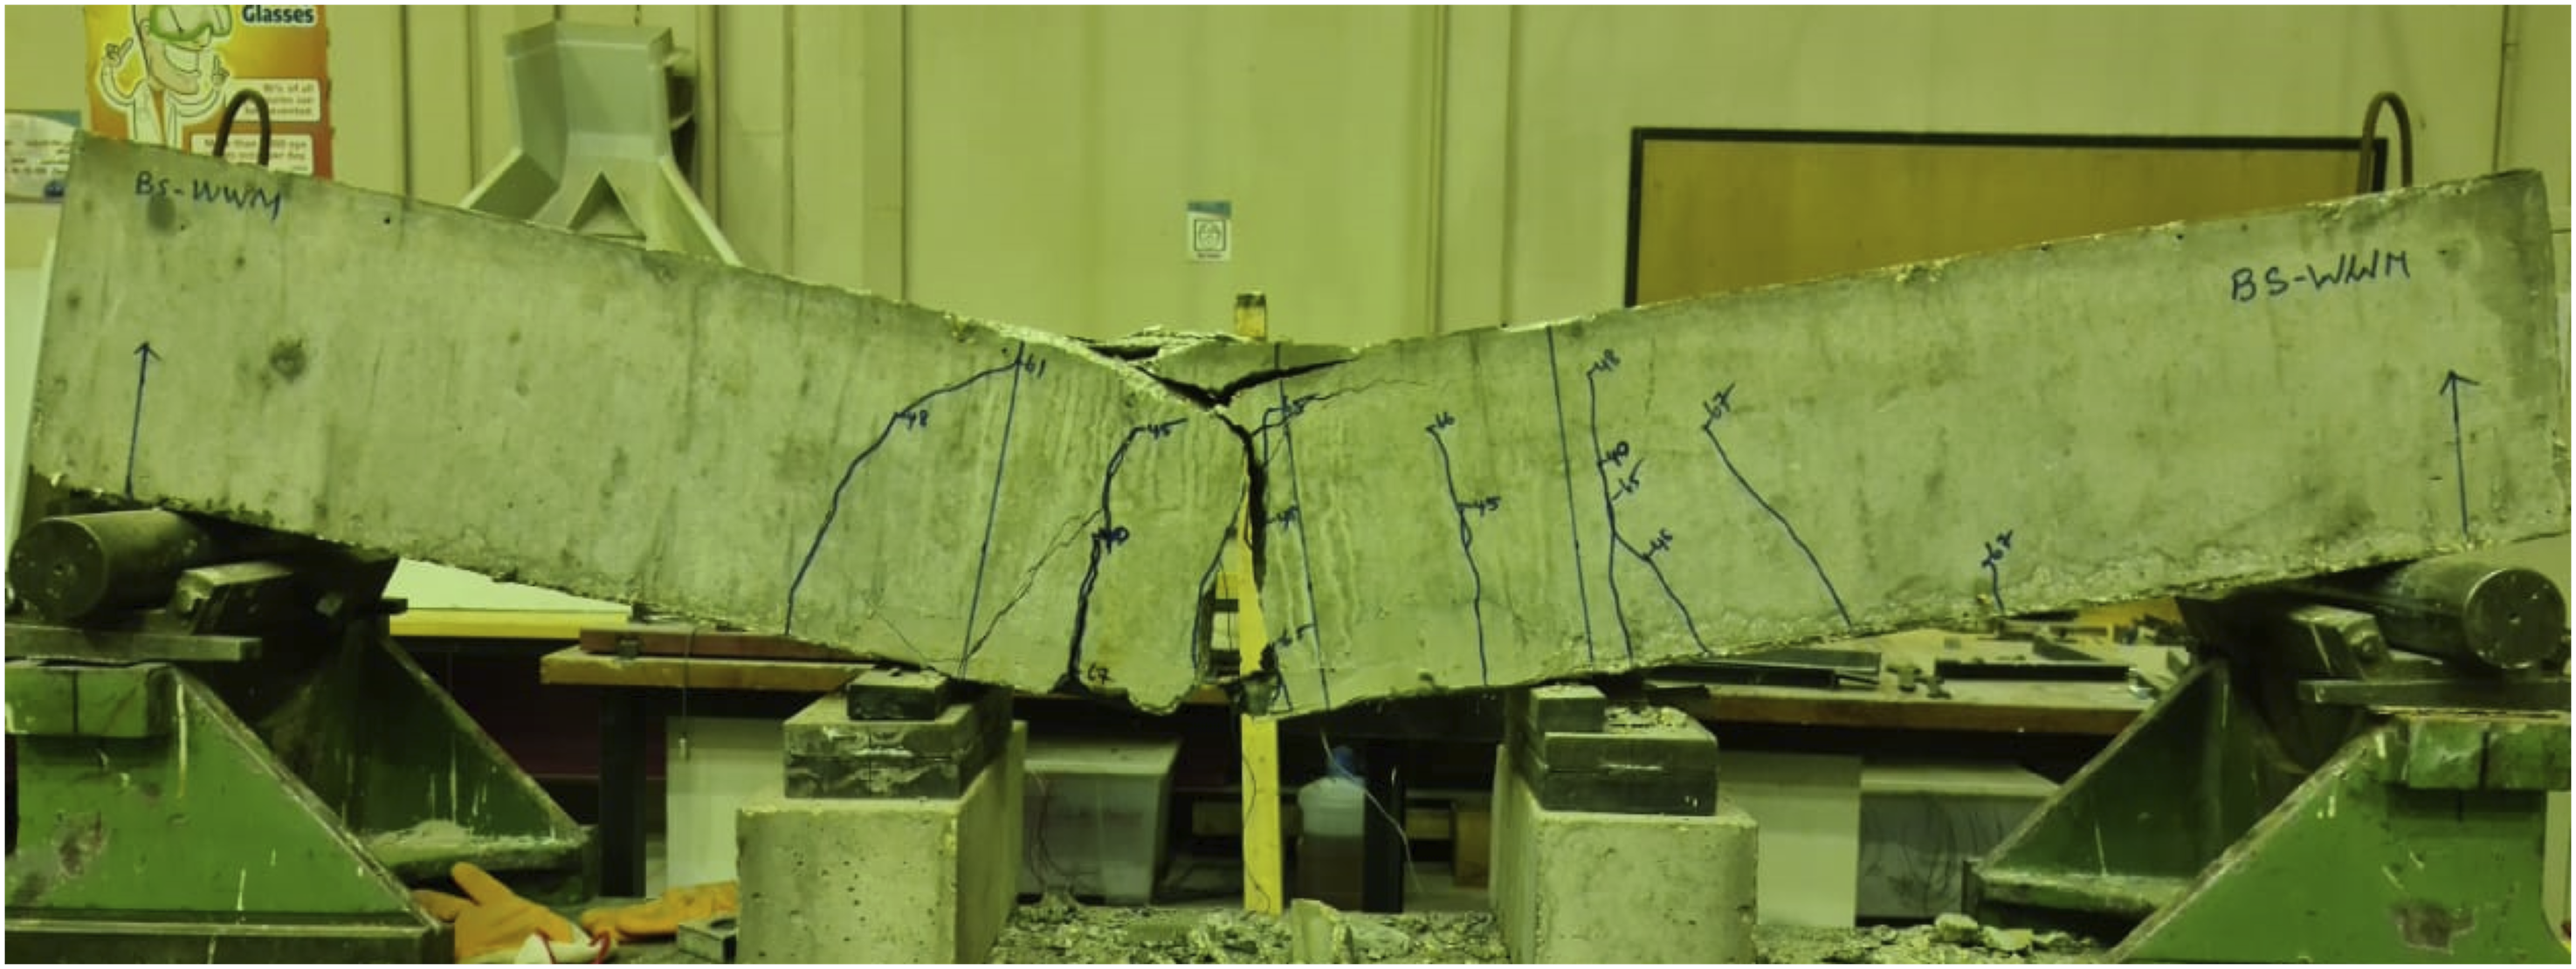
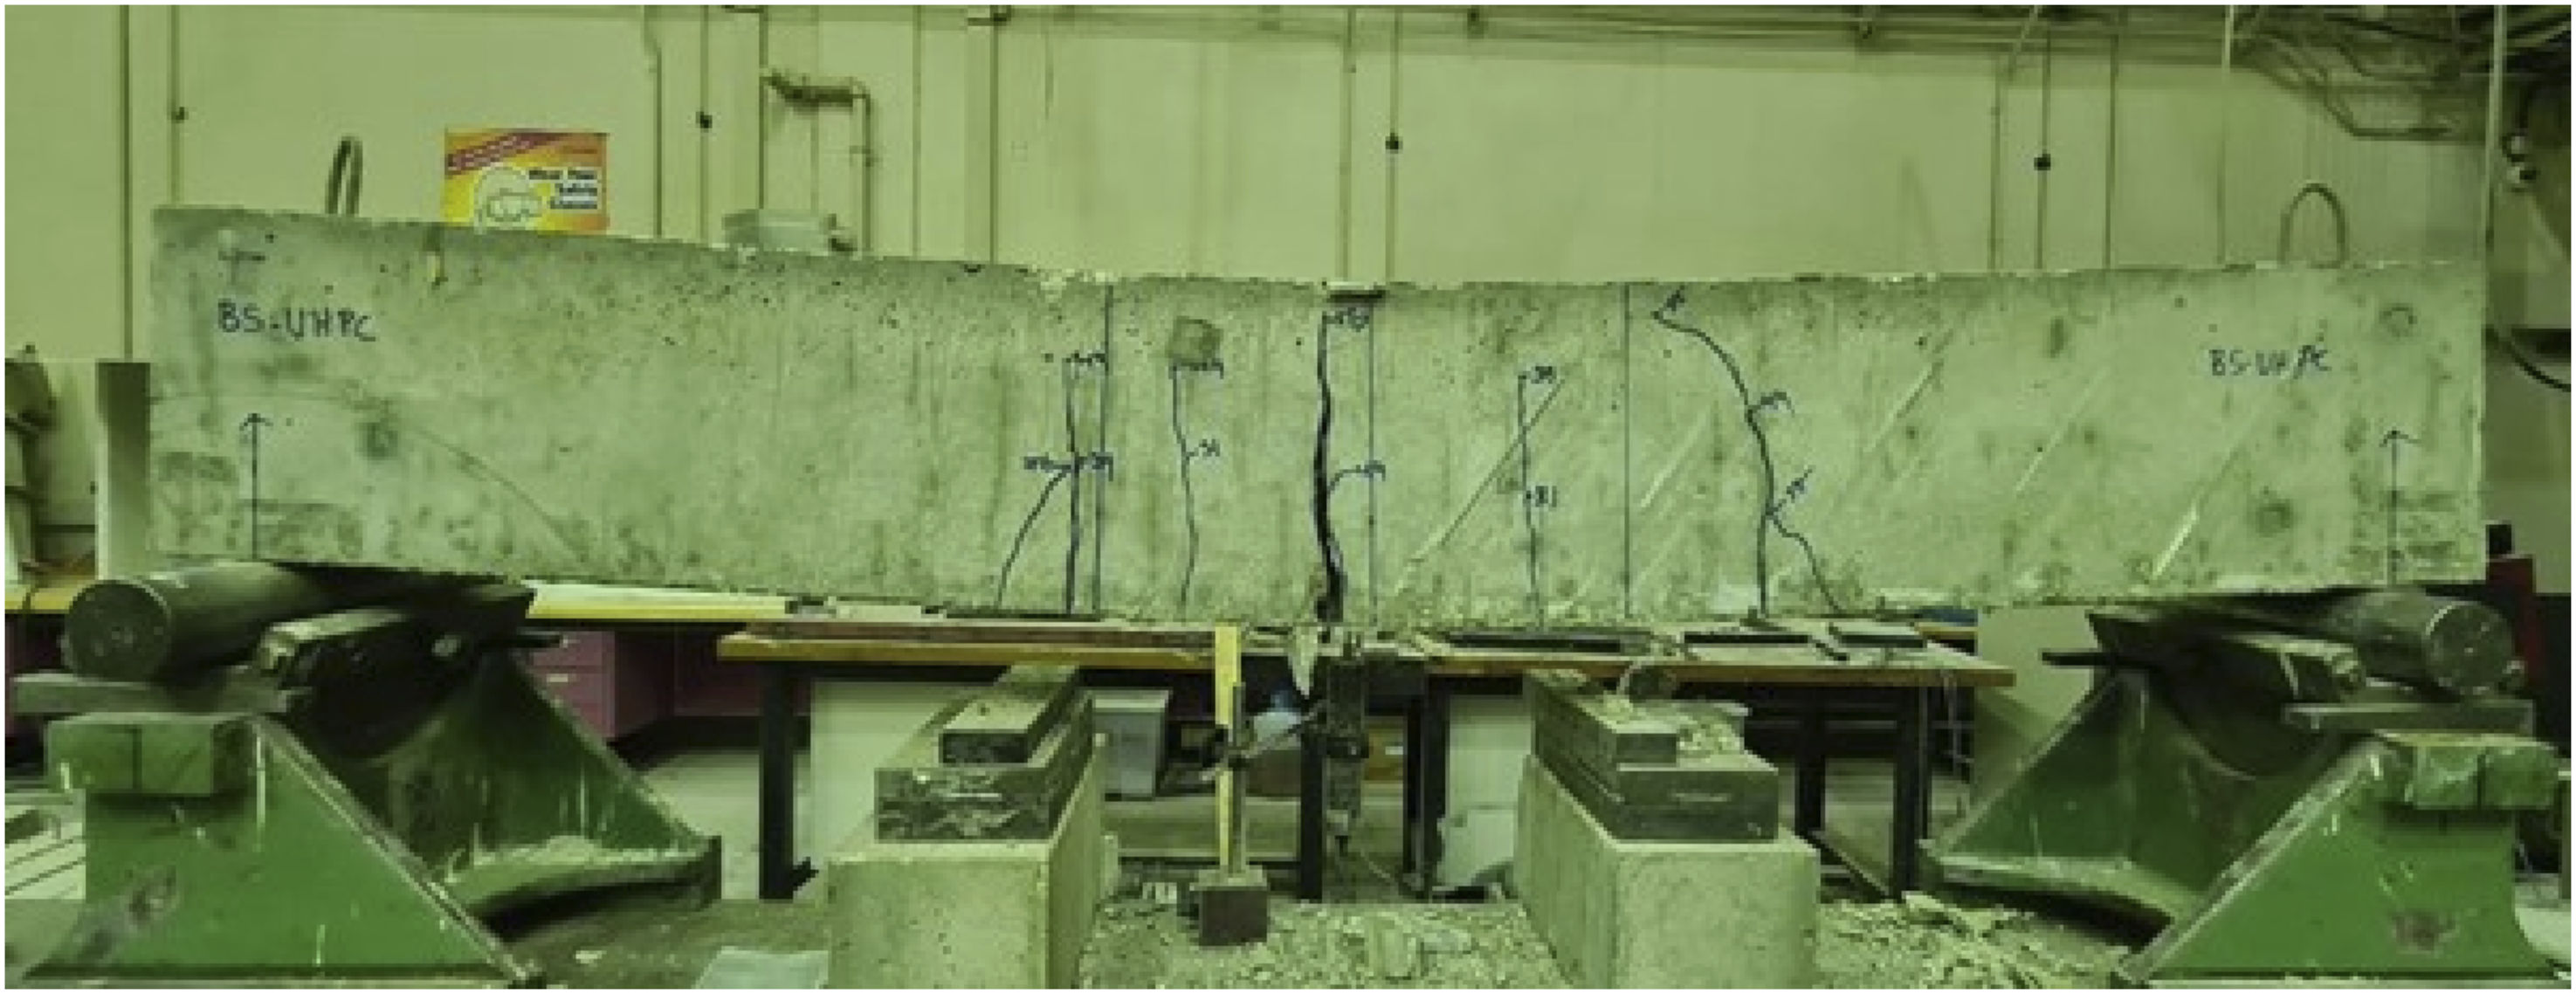
Figure 10 through 16 display the various cracking patterns and photos of the RC beam featuring distinct strengthening materials. Failure mode of control sample (BF-CON-1). Failure mode of the deficient control beam sample (BF-CON-2). Failure mode of the NSM-GFRP-strengthened sample (BF-NSM-GFRP) of RC beam. Failure mode of the NSM-BFRP -strengthened sample (BF-NSM-BFRP) of RC beam. Failure mode of the NSM-CFRP plate strengthened sample (BF-NSM-CFRP plate) of RC beam. Failure mode of the NSM-WWM strengthened sample of RC beam. Failure mode of UHPFRC strengthened sample of RC beam.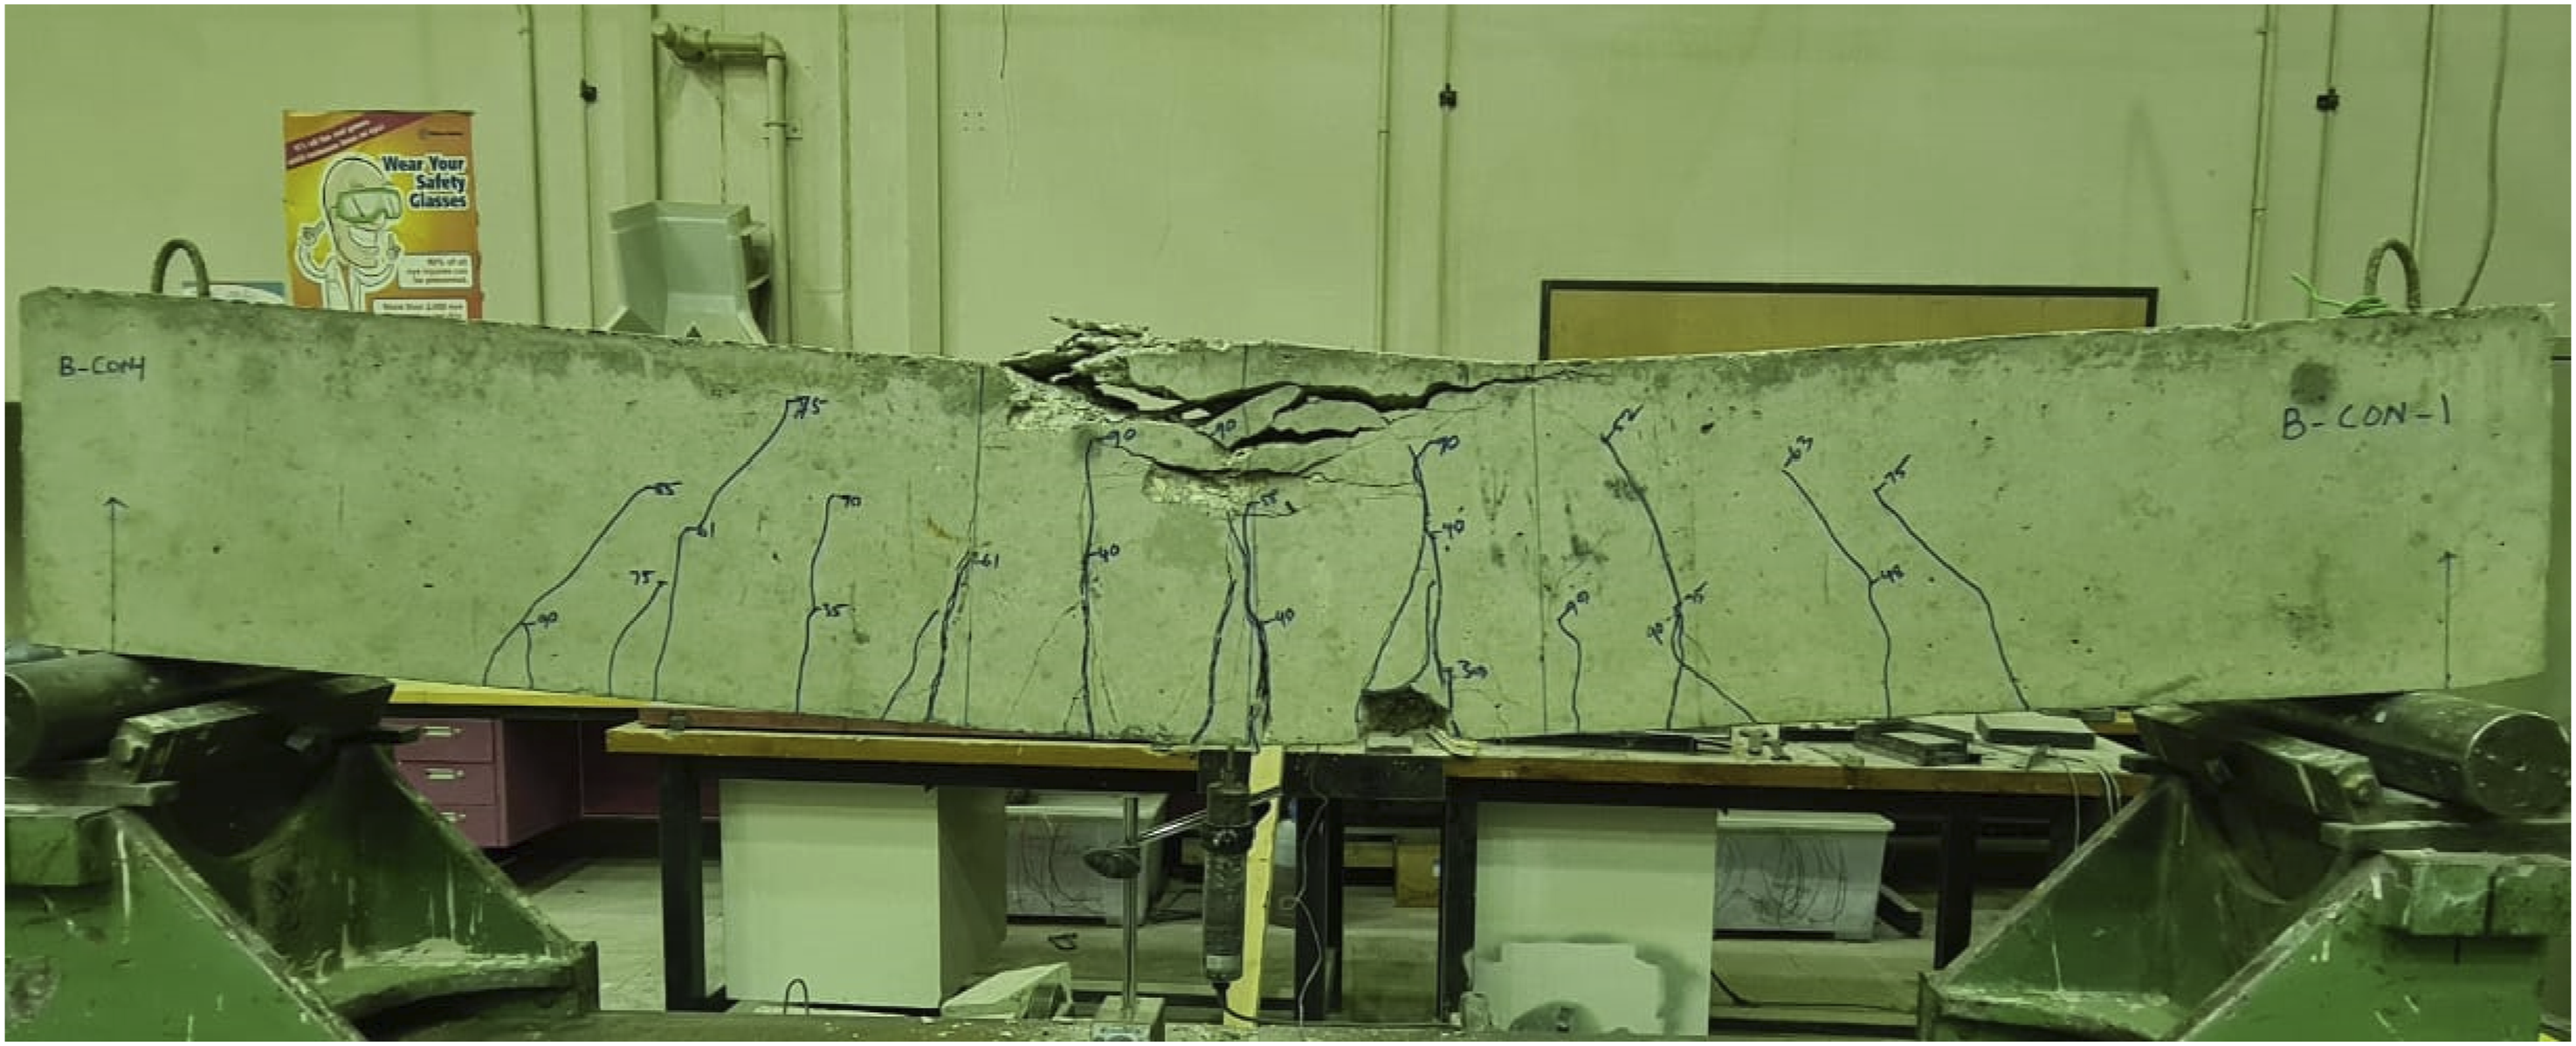


Control beam specimens
When a force of approximately 45 kN was applied to the control (B-CON-1) beam, first signs of cracks were noted evenly distributed throughout the mid span of the beam. In the bottom of the beam, the cracks appearing primarily in the vertical direction at the center of the beam, and some at a 45-degree angle towards the center. The width of the crack was about 0.5 mm. As the load increased, the cracks progressed upwards, and main diagonal tension cracks were seen between the load and the support, as illustrated in Figure 10. The concrete at compression fiber of the beam crashed under a load of 111 kN, and the crack at the mid-span widened with an average width of 1.5 mm. A crack width ruler was used to manually measure the width of the cracks on the concrete surfaces. Generally, the B-CON-1 beams exhibited ductile behavior with typical flexural failure (tensile steel reinforcement yielding, followed by crushing of concrete).
Cracks were first noticed at the center of beam B-CON-2 when it was loaded with 24 kN, as depicted in Figure 11. At a load of 33 kN, small flexural hairline cracks were visible, which progressed into larger flexural cracks when the load reached 45 kN. Since this beam was intended to fail purely by flexure, it was not surprising when a failure in flexure occurred at 65 kN owning to the progress of significant flexural crack at midspan and the concrete crushing in the compression region of the beam.
BF-NSM-GFRP and BF-NSM-BFRP specimens
The maximum loading capacity of the BS-NSM-GFRP beam was 130 kN, while the BF-NSM-BFRP beam was 132 kN. As illustrated in Figure 12, the beams primarily failed due to flexural failure, involving concrete crushing in the compression region and yielding of steel bars in the tension zone. As illustrated in Figure 13, the first flexural crack in beams BF-NSM-GFRP and BF-NSM-BFRP was noticed at 36 kN and 33 kN, respectively. Minor inclined cracks were noticed at 46 kN in BF-NSM-GFRP and 48 kN in BF-NSM-BFRP as the loading increased. This failure resembled the mode of failure noticed in the reference beam (B-CON-1). There was no evidence of debonding at the boundary between the concrete surface and the FRP bar. The BF-NSM-BFRP broke owing to concrete cover separation (peeling failure) at ultimate load, but the NSM GFRP bar cut at a load of 130 kN for the beam (BF-NSM-GFRP).
BF-CFRP plate specimen
In Figure 14, the failure mode of beam BF-CFRP is depicted. Initially, recorded at a load of 76.5 kN, and as the load was raised to 132.5 kN, more flexural cracks appeared at the mid span of the beam. Pure flexure failure was the ultimate mode of failure for this beam, which is clearly indicated in Figure 14. Although the use of CFRP plate did not result in the transformation of the failure mode from flexure to shear, it significantly increased the flexure strength of the beam in comparison to the reference beams (B-CON-1 and B-CON-2). However, the BF-CFRP plate specimen failed due to the yielding of steel followed by the separation of the CFRP plate and crushing of concrete at mid span. The intermediate flexural shear cracking failure mode has been observed in this test. This type of failure, initiates at the mid span of the beam with slight separation of concrete parts immediately below the steel reinforcement, is commonly observed in many tests (Al-Rousan and Shannag, 2018; Taleb Obaidat et al., 2020; Yang et al., 2021).
BF-WWM specimen
Figure 15 depicts the BF-WWM beam following the test, revealing that the cracks majority were concentrated near the center of the beam. As depicted in Figure 15, a small flexural crack initially appeared at a load of 30 kN and progressively widened until it eventually failed at 81.5 kN. There were no instances of delamination noted in the WWM. The flexural failure mode was observed. The welded wire mesh cut in mid span of the beam at the ultimate capacity of the beam. The bond effectiveness of WWM in along with epoxy was perfect.
BF-UHPFRC specimen
The first hairline crack became visible at a load of 29 kN on the tension face with a deflection of 2 mm during the testing. The failure pattern of the beam reinforced with a UHPFRC layer is illustrated in Figure 16. Initially, at midspan of the beam vertical cracks were detected, which were subsequent to the formation of diagonal cracks, as depicted in Figure 16. The beam ultimately failed in flexure within the constant-moment zone at a maximum load of 77.4 kN, accompanied by a corresponding midpoint displacement of 27.5 mm. The use of the UHPFRC layer proved successful in increasing the flexural capacity of the beam. However, at the point of failure, the splitting of the UHPFRC jacket was observed at the mid-span, as shown in Figure 16. This splitting can be attributed to the limited thickness of the UHPFRC layer, emphasizing the need for additional thickness and anchorage when using UHPFRC layer. Additionally, the bond between the substrate and UHPFRC layers remained intact at the point of failure, indicating that the UHPFRC developed its complete flexure strength until the longitudinal reinforcement yielded. Such types of failure, a similar outcome has been reported in the literature, by previous studies (Ahmad et al., 2023; Al-Huri et al., 2023). Moreover, the failure of the BF-UHPFRC specimen is not only attributed to the thickness of the layer but rather to the absence of reinforcement in the layer. Kadhim et al. (2022, 2023) proposed a hybrid retrofit system, which includes a UHPFRC layer reinforced with CFRP bars. Compared to UHPFRC plain layers, the system led to a substantial enhancement in both the ultimate load capacity and ductility.
Flexure strength prediction of RC beam
The combined nominal flexural resistance (
Two concentrated loads, positioned 350 mm from the mid-span, load the RC beam with a shear span (
Flexural strength prediction for all tested beams.

Flexure strength offered by CFRP plate
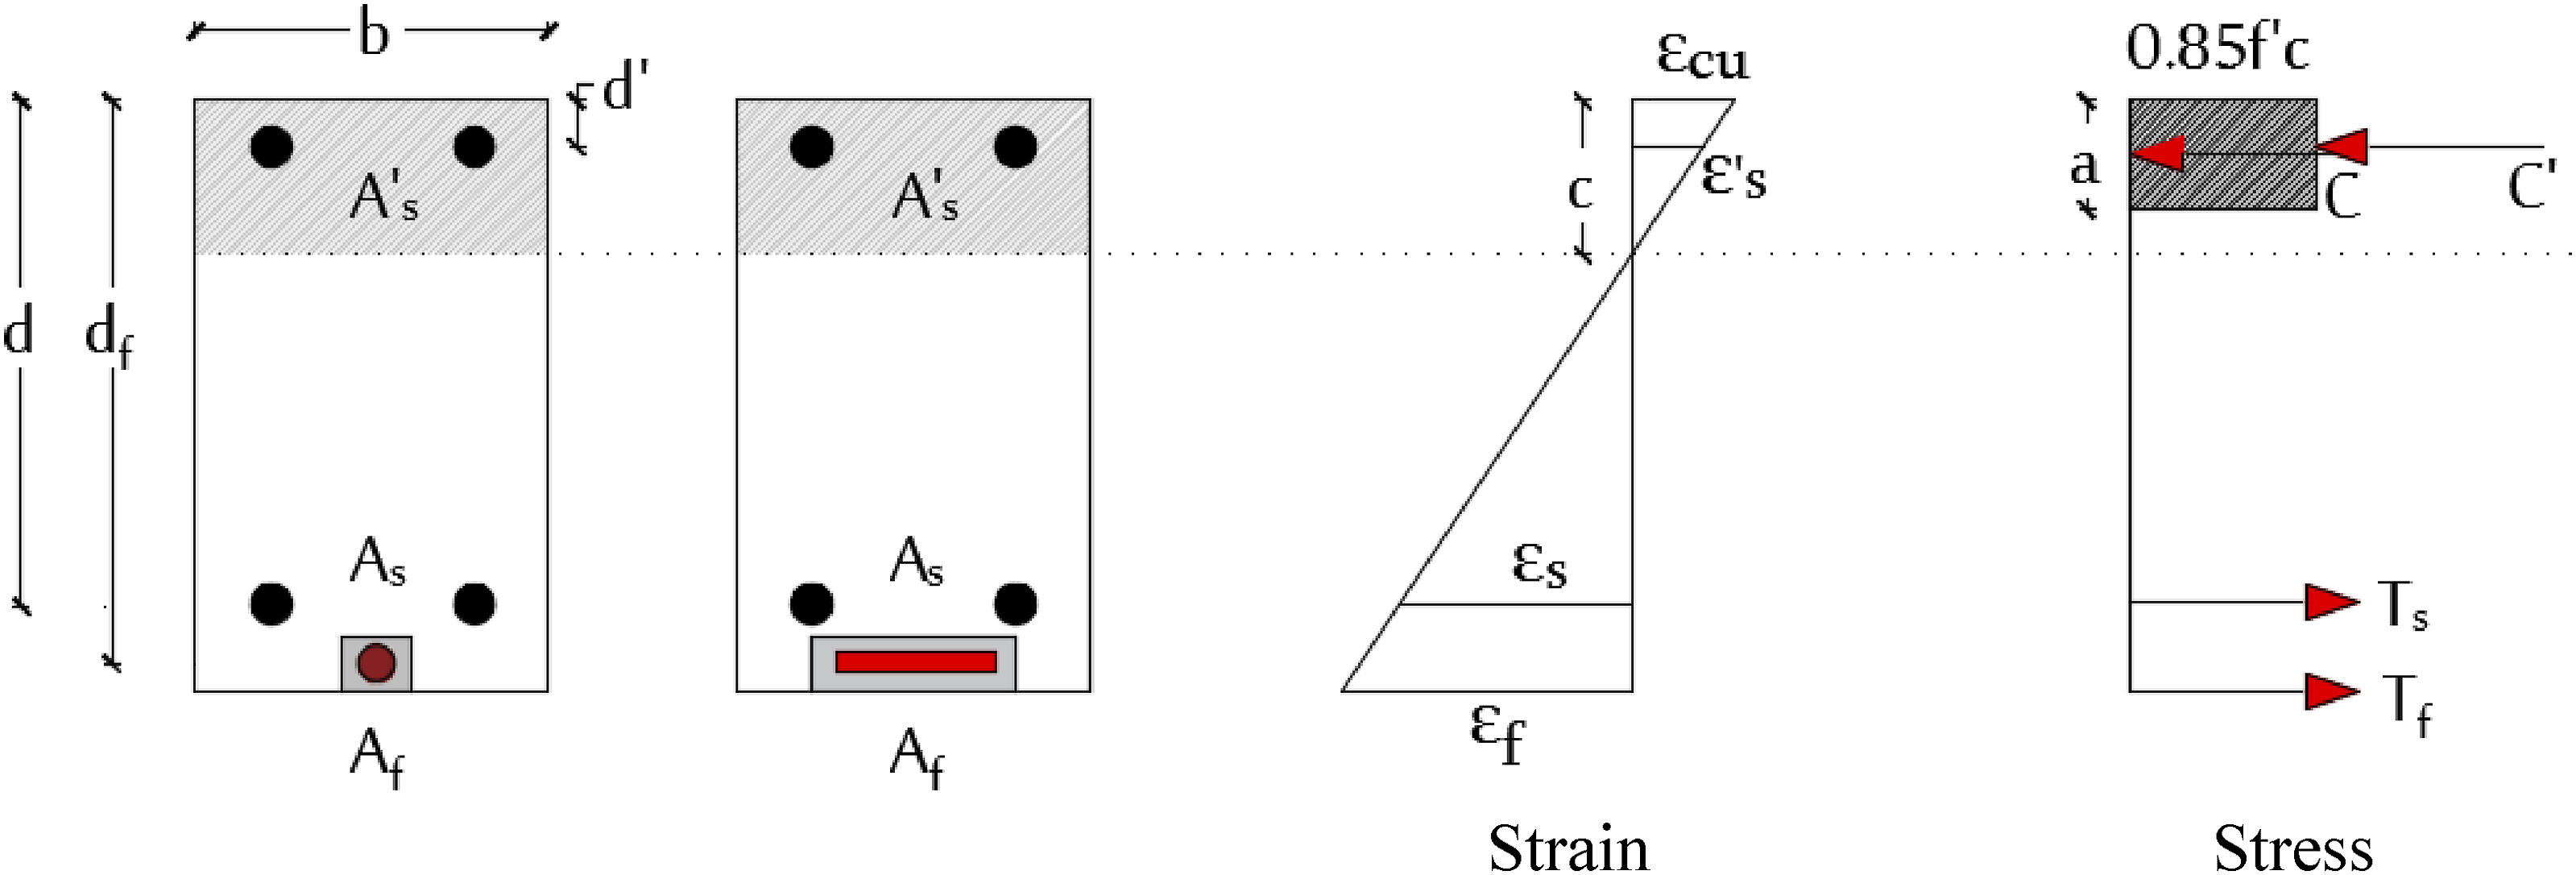
The maximum strength of strengthened RC beams using CFRP plate (BF-CFRP plate), can to be estimated based on the ACI 440.2R-17 (2017) recommendation. Figure 17 shows the sketch of the cross-sectional forces and strains. The flexural moment capacity can be calculated as: Sketch of the cross-sectional forces and strains.

Flexure strength offered by NSM FRP bars
The involvement of the NSM-FRP bars (



Flexure strength offered by WWM
The moment capacity of specimens strengthened with WWM can be computed using the following equation:
Flexure strength offered by UHPFRC layer
The ACI 544.4-88 R09 (2009) design guideline for fiber reinforced concrete structures proposes that the moment capacity be computed using stress and strain compatibility simplified assumptions, was determined to be a dependable predictor, as validated by (Nadir et al., 2023, 2024).


Finite element modeling
The performance of strengthened RC beams was simulated utilizing nonlinear three-dimensional finite element (FE) software ABAQUS (2019). The accuracy of the produced FE models was validated by comparing them against the experimental test results of this research.
Constitutive material models
The concrete damaged plasticity model (CDPM), which is commonly employed in FE analysis (e.g., Alshaikh et al., 2021, 2022; Altheeb et al., 2022), was employed to simulate the behavior of concrete and Sikadur mortar materials. The CDPM incorporates isotropic damaged elasticity as well as compressive and tensile plasticity to accurately simulate the plastic behavior of brittle materials (ABAQUS, 2019). Hognestad (1951) introduced a uniaxial compressive concrete model for the non-linear FE analyses. Furthermore, Stoner (2015) made alterations to the curve in order to incorporate the effects of ultimate concrete strain and concrete confinement through the use of stirrups. This study utilized this model to simulate the stress-strain curve of the concrete under compression. In relation to the modeling of tension behavior in concrete, it can be observed that up until the point of cracking stress, the behavior is characterized by linearity and elasticity, with a gradual increase in stress. Subsequently, a linear decline of the stress-strain curve is observed, indicating a reduction in concrete strength. This study utilized Wang and Hsu (2001) model to simulate the stress-strain curve of the concrete under tension. In addition, this investigation used the Russell et al. (2013) model to describe the UHPFRC compressive stress-strain curve. The model incorporates linear behavior in the initial segment of the curve, including up to 50% of ultimate compressive stress ( Stress-strain curve for concrete. CDPM parameters of concrete, UHPFRC, and Sikadur mortar.

FE model set-up
The concrete and Sikadur mortar elements were modeled using the eight-node element (C3D8R), as illustrated in Figure 19(a). As shown in Figure 19(a), a two-node and linear truss element (T3D2) was used to represent the steel reinforcement (longitudinal and stirrups). As shown in Figure 19(b), the simulation of the supports was done by putting in the boundary condition at both reference points that are connected to the lower supporting cylinders. The load was gradually applied utilizing displacement control, which is via the two reference points that were assigned to the top cylinders (see Figure 19(b)). The researchers utilized the perfect bond and interface element techniques in order to model the interfaces of the NSM (Alharthi et al., 2021; Banjara and Ramanjaneyulu, 2019; Chellapandian et al., 2018, 2020; Khalil et al., 2016; Sharaky et al., 2018). No separation or debonding occurred at the interfaces between the concrete-epoxy and epoxy-NSM parts in the experimental tests. Therefore, the presence of a perfect bond was assumed during the FE modeling process (Abdo et al., 2023; Alharthi et al., 2021; Banjara and Ramanjaneyulu, 2019; Khalil et al., 2016; Sharaky et al., 2018). As indicated by Banjara and Ramanjaneyulu (2019), it was shown that, compared to the experimental results, the use of the perfect bond provided more precise FE results compared to the interface element. The interaction between the concrete-epoxy and epoxy-NSM parts is modeled as a tie contact (i.e., without debonding). The embedded option of ABAQUS software was utilized to model the interactions between the concrete and steel reinforcement, or the NSM materials (i.e., CFRP, GFRP, and BFRP) and epoxy. The adhesive properties of epoxy result in a strong bond with concrete, where the failure of either the concrete or the epoxy determines the overall failure of the system. Ultimately, a mesh size of 10 mm was selected, as it generated acceptable results in comparison to the experimental data as illustrated in Figure 19(c). FE model set-up: (a) Elements types; (b) Loading and boundary conditions; (c) Mesh size.
Numerical results and verifications
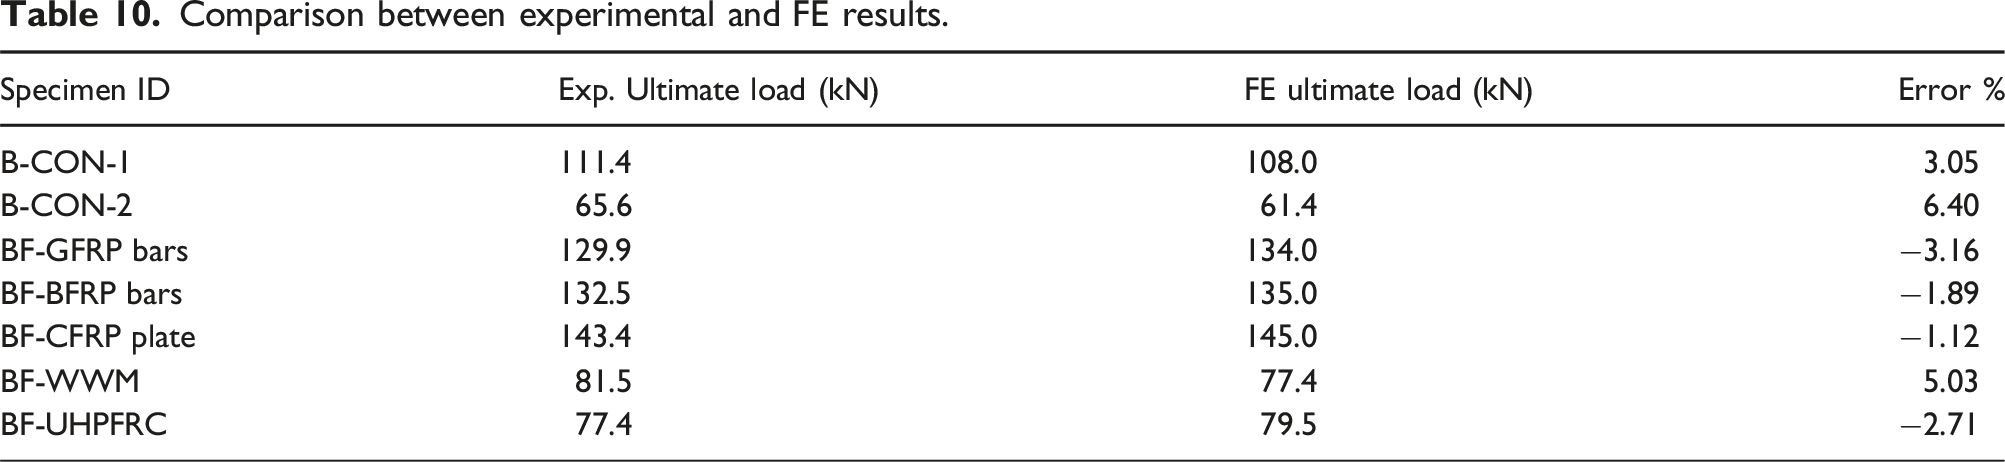
Comparison between experimental and FE results.
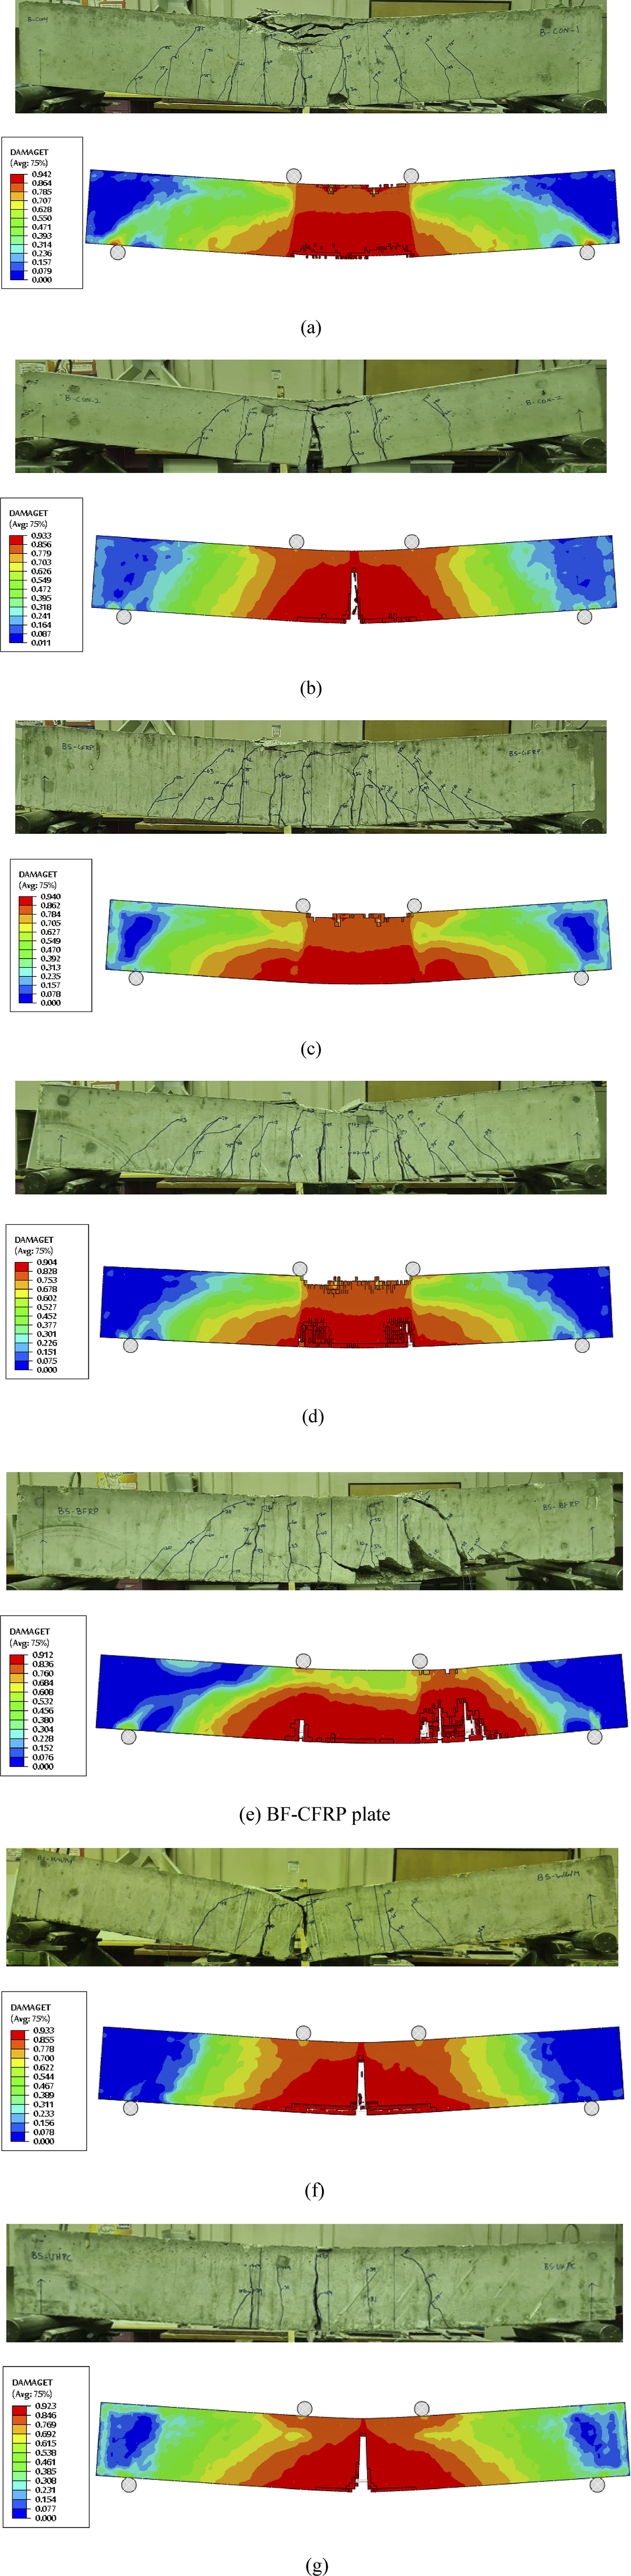
FE versus experimental failure modes for all specimens: (a) B-CON-1; (b) B-CON-2; (c) BF-GFRP bars; (d) BF-BFRP bars (e) BF-CFRP plate; (f) BF-WWM; (g) BF-UHPFRC.

Beam specimens’ FE and experimental load vs displacement curves.
Conclusions
This investigation examines experimentally and numerically the effectiveness of five distinct strengthening schemes for enhancing the flexural capacity of RC beams, including NSM-GFRP, NSM-BFRP, NSM-CFRP plate, NSM-WWM, and UHPFRC layer. Seven RC beams made with the SCC mixture were tested under four-point bending. By analyzing the findings in this study, the following conclusions can be derived: (i) The load-carrying capacity and stiffness of the reinforced concrete beam proved to be significantly influenced by the strengthening scheme. The beams reinforced with NSM GFRP experienced failure characterized by bar cutoff, while those reinforced with BFRP showed concrete cover separation starting from the cutoff point. Notably, beams featuring CFRP plates failed at the plate-epoxy interface. (ii) All types of NSM FRP bars exhibited good bond behavior; no tested beams showed signs of debonding or bond failure. This is explained by the epoxy adhesive’s strong bonding, which was employed in this investigation. (iii) When the strengthening schemes are implemented, the ultimate load of the RC beams increases by 98%, 100.5%, 118.6%, 24.2%, and 18% for the BF-GFRP bars, BF-BFRP bars, BF-CFRP plate, BF-WWM, and BF-UHPFRC beams, compared to the deficient control beam. (iv) The bond between UHPFRC and SCC proved to be highly effective, with no significant slip detected at the interface. It is advisable to incorporate reinforcement rebars within the UHPFRC layer rather than using an unreinforced layer when reinforcing a beam subjected to flexural loading. (v) The beam capacity was analytically predicted using code equations for flexural bending moments and the ultimate load of all strengthening schemes. The ultimate load (Pu) of the predicted values to the experimental results ratio falls within the range of 0.83–1.11. (vi) The simulated 3D FE model successfully predicted the load-deflection behavior, as well as the failure pattern and crack locations. The maximum disparity between the FE and experimental measurements amounted to around 6% in the ultimate loads.
Footnotes
Declaration of conflicting interests
The author(s) declared no potential conflicts of interest with respect to the research, authorship, and/or publication of this article.
Funding
The author(s) disclosed receipt of the following financial support for the research, authorship, and/or publication of this article: The author extends his appreciation to Researchers Supporting Project number (RSP2025R343), King Saud University, Riyadh, Saudi Arabia.
