
Abstract
The progressive collapse behavior of reinforced concrete curved beam–column substructures was investigated through experimental tests, finite element simulations, and theoretical analysis. The structural response was characterized by three stages: flexural action (FA), compressive arch action (CAA), and incomplete catenary action (ICA). A theoretical resistance calculation method considering bending–torsion interaction was developed for the CAA stage, and parametric analyses were conducted to investigate the effects of central angle, reinforcement ratio, and strength ratio. The results indicate that (1) A theoretical bearing capacity model for curved beam–column substructures under compressive arch action is proposed, accounting for bending–torsion coupling effects. Good agreement with numerical results confirms its reliability in predicting progressive collapse resistance. (2) Significant differences in progressive collapse behavior between straight and curved beam–column substructures are identified. Curved members exhibit pronounced bending–torsion interaction, leading to non-uniform internal force distribution and asymmetric reinforcement stresses. (3) The bending–torsion effect inhibits full development of catenary action, resulting in an incomplete tensile mechanism in curved structures, whereas straight beams can form a more complete catenary response. (4) Compared with straight beam–column systems, curved structures show reduced load-carrying capacity and ductility due to less efficient load-transfer mechanisms under torsional effects. (5) Increasing central angle enhances bending–torsion coupling and reduces structural resistance, while higher reinforcement ratio and material strength improve capacity but remain limited by torsional effects.
Keywords
Introduction
Concrete frame structures are widely used in construction due to their aesthetic flexibility and structural adaptability. Due to materials, load and geometric uncertainties, the number of structural collapses has been increased due to accidental events such as explosions and impacts in recent years, and reliability-based design has become more and more important in engineering practices (Jiang et al.,2024, 2025). Consequently, the resistance to progressive collapse has attracted growing interest from researchers. The progressive collapse of such structures under accidental effects often result in significant fatalities and property losses. Thus, sufficient progressive collapse resistance is critical to mitigate catastrophic failures.
To study the progressive collapse mechanism of concrete frame structures, researchers worldwide have conducted numerous experiments and investigations focusing on beam-column substructures and integral frame structures. At the beam-column substructure level, (Yu and Tan, 2013a; 2013b, 2014) investigated the effects of reinforcement ratio and shear span ratio on the force mechanism of beam-column substructures against progressive collapse, taking into account the constraint boundary conditions of members and frame beams. Dynamic tests on RC beams subjected to column removal verified compression arch action as the dominant strength-enhancing mechanism for boundary-restrained members (Tian and Su, 2011). Wang and Kang (2019) further examined constrained RC beams in the catenary action phase, proposing a design method to quantify tensile capacity. Simulated middle column demolition tests revealed catenary action as the dominant collapse-resistance mechanism in beam-column substructures (Gan et al., 2024; Kamal et al., 2016; Yi et al., 2024). Lu et al. (2016, 2018) analysed the contribution of floors to the collapse resistance of structures through progressive collapse tests of five reinforced concrete frame substructures, proposing different calculation methods for compression arch carrying capacity. Yang and Tan (2013) tested two half-span substructures with a central column removal, investigating five joint configurations in 2/3-scaled H-shaped steel beam-column assemblies. The results demonstrate that connection types significantly influence progressive collapse resistance. Xi et al. (2022) proposed a reverse-curved compressive arch mechanical model to accurately evaluate the peak capacity of compressive arch action, the theoretical predictions of which showed good agreement with experimental results. Liu et al. (2016) investigated the dynamic response of flush end-plate connected beam-column substructures following instantaneous center column removal. Using two half-span specimens under varying uniformly distributed load (UDL), they revealed asymmetric collapse mechanisms when lateral stiffness differed across the removed column. Full-scale composite beam-column assembly tests investigated progressive collapse resistance under seismic boundary conditions (Kang et al., 2017). Experimental investigations have shown that reinforced concrete frames subjected to column removal exhibit significant load redistribution and a transition in load-resisting mechanisms. The contribution of catenary action can markedly improve the progressive collapse resistance beyond predictions based on plastic limit analysis (Yi et al., 2008).
Recent years have witnessed a surge in large-scale experimental and numerical studies on frame structures’ progressive collapse behavior. Zhou et al. (2025) tested concrete slab-column joints to evaluate punching shear resistance. Wang et al. (2022) demonstrated through experimental and numerical studies that the transverse restraint from beams and slabs can enhance the progressive collapse resistance of RC frames by as much as 340%, an effect critical for accurate structural analysis. Through numerical analysis, (Wang et al., 2025) revealed that the presence of infill walls and slabs can alter the failure mode of self-centering frames, depending on the span aspect ratio. They also proposed a simplified method to quantify the resistance contribution of these non-structural members during the compressive arch action stage. Su et al. (2009) investigated RC frame beams’ collapse resistance, highlighting the compression arch effect’s role. Yang et al. (2016) conducted collapse tests on half-scale steel beam-column substructures with double-angle and flush end-plate connections under a middle column removal scenario. The results demonstrate that such substructures can utilize catenary action to resist progressive collapse. Qian et al. (2021), Qian and Li (2012, 2013) demonstrated that corner column loss poses the highest collapse risk in cast-in-place RC frames. Complementing this, Infilled walls enhance progressive collapse resistance of frame structures by providing alternative load paths, yet induce significant ductility degradation—a critical trade-off validated through comparative analysis of infilled versus pure frame systems (Shan et al., 2016). Experimental and numerical studies have shown that reinforced concrete beam–slab substructures subjected to column removal exhibit complex stress redistribution mechanisms and distinct deformation failure modes (Du et al., 2019; Qian et al., 2022). Numerical simulations confirm that bottom column removal poses the highest progressive collapse vulnerability due to disrupted vertical load redistribution-a critical risk factor quantified through column position sensitivity analysis (Li et al., 2016), and biaxial eccentricity significantly reduces both resistance and reliability of RC column under complex loading (Jiang et al., 2023). Mehrdad and Jesse (2008) experimentally investigated the behavior of a 3/8-scale reinforced concrete (RC) continuous beam-frame system following sudden column removal, and numerically analyzed the structure’s progressive collapse resistance and dynamic load redistribution using finite element analysis.
With advancing research, studies on the progressive collapse resistance of irregular frame structures have significantly increased. Zhou et al. (2021) developed two optimized design methods with improved load-resistance factors, demonstrating superior progressive collapse resistance in braced steel structures (BSS) under cable failure scenarios when designed via modified method 2—featuring fixed partial loads and scenario-tuned resistance coefficients. Curved beam-column structures are increasingly utilized in modern construction, particularly in high-rise buildings and long-span structures. Recently, 3D printing concrete technology has promoted the constructions of curved beam-column structures (Jiang et al., 2025a; 2025b). He et al. (2019) noted higher progressive collapse susceptibility in irregular structures versus regular frames, developing a structural irregularity index validated through nonlinear pushdown analyses of unequal-span, stepped, and large-space frames. Tower-to-podium story ratio and span ratio are identified as dominant factors controlling dynamic collapse resistance of vertically irregular RC frames (Du et al., 2015).
Compared to the extensive research on straight beam-column structures, studies on curved beam-column structures remain limited, particularly in the context of progressive collapse scenarios. Most existing studies on curved beams are concentrated on curved bridge structures, while relatively few focus on building structural systems. Recent domestic research has examined the progressive collapse behavior of curved beam-column structures, revealing a three-stage resistance mechanism. The study found that bending-torsion interaction reduces structural resistance and hinders the full development of the catenary effect, while parameters such as the central angle have a significant impact on collapse performance (Jiang et al., 2026). In contrast, existing international research has largely focused on the resistance to progressive collapse of straight-beam frames, and systematic studies on curved-beam-column structures remain scarce, with no comprehensive theoretical or analytical framework yet established.
As a typical spatial curved system, arched structures exhibit distinct stress characteristics compared to traditional straight members and often experience bending and torsional effects under loading. The mechanical behavior of curved members, typified by arched beams, has long been a key focus in structural engineering. As early as the studies by Timoshenko (1930) and Vlasov (1961), the theory of curved beams was systematically expounded, providing a foundation for subsequent elastic analyses. Subsequently, scholars such as Bradford et al. (2006) and Sun (1995) conducted further research on their geometric relationships and methods for calculating internal forces. Regarding the coupled action of bending and torsion, Chen et al. (2024) concluded, based on bending-torsion tests, that the bending-to-torsion ratio has a significant impact on the load-carrying capacity and ductility of members, and also alters the crack propagation path and the ultimate failure mode. Liu et al. (2021) analyzed the full-process stress-strain behavior of curved steel-concrete composite beams with different center angles through static loading tests. The study indicated that curved beams exhibit significant bending-torsion coupling characteristics under loading, and their mechanical response differs markedly from that of straight beam structures. Furthermore, Jiang et al., 2023 conducted experimental and finite element analysis studies on the torsional behavior of curved concrete box girders with small radii of curvature. The results indicated that under eccentric loading, curved beam structures develop significant warping stresses, reflecting complex torsional and bending coupling effects. This study revealed the fundamental mechanisms of flexural-torsional coupling and warping effects in curved beam structures from both experimental and numerical perspectives. Wang et al. (2020) developed a finite element model of a curved steel–concrete composite box girder that accounts for time-dependent effects. The study indicated that, in addition to flexural-torsional coupling, curved beam structures exhibit complex mechanical behaviors such as constrained torsion, distortion, interface slippage, and shear lag. Parametric analysis results further indicate that the center angle and the stiffness of shear connections are key factors influencing the structural performance. Additionally, Patuelli et al. (2023) proposed a finite element model of a beam element that accounts for flexural-torsional coupling. By establishing a coupling relationship between the degrees of freedom of bending and torsion, they achieved a unified analysis of the structural response under both static and dynamic loads. The research results indicate that this model exhibits high consistency with experimental and numerical results in terms of deformation and natural frequency predictions, thereby validating the effectiveness of the flexural-torsional coupled finite element method in the analysis of complex structures.
Overall, existing research has provided a relatively systematic examination of the bending-torsion coupling behavior of curved beams from theoretical, experimental, and numerical simulation perspectives; however, such studies have primarily focused on the analysis of mechanical responses under conventional loading conditions. Under extreme conditions such as progressive collapse, research on curved beam-column structures still suffers from several critical shortcomings: First, the lack of experimental data under column-removal scenarios has resulted in an incomplete understanding and verification of the mechanisms underlying structural collapse resistance; Second, although bending-torsion coupling is a core characteristic of curved-beam structures, this effect has not yet been effectively incorporated into mechanical models for progressive collapse analysis, and there is a lack of a unified method for calculating load-carrying capacity; furthermore, the influence of key parameters such as the center angle and reinforcement characteristics on the structure’s collapse resistance has not yet been systematically and quantitatively evaluated.
To address the aforementioned research gaps, this study adopts a comprehensive research framework that integrates experimental testing, theoretical analysis, and numerical simulation. The motivation for selecting this approach stems from the complex stress mechanisms exhibited by curved structures during progressive collapse. Previous studies have shown that experimental methods can intuitively reflect structural failure modes and load–displacement response characteristics, making them a crucial tool for elucidating progressive collapse behavior (Choi and Kim, 2011); however, they still have certain limitations in terms of parameter extension and mechanism analysis. Therefore, establishing a mechanical model that accounts for the interaction of bending and torsion through theoretical analysis not only helps explain experimental phenomena but can also be used to develop structural load-carrying capacity calculation methods (Zhou et al., 2016). At the same time, numerical simulation can overcome the limitations of experimental conditions, enabling systematic analysis of the influence of multiple parameters and quantitative evaluation of structural response (Wang et al., 2022). These three methods complement one another: experimental results provide validation for theoretical models and numerical simulations; theoretical analysis provides the mechanical foundation for model development; and numerical simulation expands the breadth and depth of the research. Based on this, this paper conducts a systematic study on the progressive resistance to continuous collapse of curved beam-column structures using an integrated research approach.
Therefore, this study conducted a comparative analysis of the progressive collapse behavior of straight-beam and curved-beam reinforced concrete beam-column structures. By designing and testing scaled specimens under conditions where the central column was removed, the study elucidated the mechanisms of structural collapse. A mechanical analysis method that accounts for torsional-bending coupling effects was developed to evaluate load-carrying capacity, and a parametric study was conducted to quantify the effects of the central angle and reinforcement characteristics on structural performance. The results of this study are expected to deepen the understanding of the progressive collapse mechanisms of flexural concrete structures and provide a theoretical basis for engineering design and practical applications. The main conclusions are summarized at the end of the paper.
Internal force and carrying capacity analysis of straight and curved concrete beams
Basic assumptions
This study is conducted based on the following fundamental assumptions: (1) The surrounding structure provides rigid constraints at the boundaries of the beam-column substructure. And failure is confined to the beams, while the columns remain elastic and do not fail. (2) A moderate reinforcement ratio was adopted in the design of all members. This key assumption underpins the analytical framework by ensuring that the failure is governed by yielding of the reinforcement, thereby facilitating the full development of plastic hinges as anticipated in the analysis.
Internal force analysis of beams
Internal force analysis of straight beam
Previous studies (Afnani et al., 2017; Gerasimidis et al., 2015; Huang et al., 2022; Kim et al., 2006) have investigated the theoretical behavior of curved beams, proposing various analytical approaches based on different kinematic assumptions. The present analysis employs the force method. As illustrated in Figure 1, for a straight beam with fixed supports (points A and C) under symmetric loading, the rotation at the midspan (point B) is zero due to symmetry. The deformation is antisymmetric about the midspan. Under these conditions, the beam develops equal bending moments at the supports and midspan at yield, given by: Internal force distribution of the straight beam.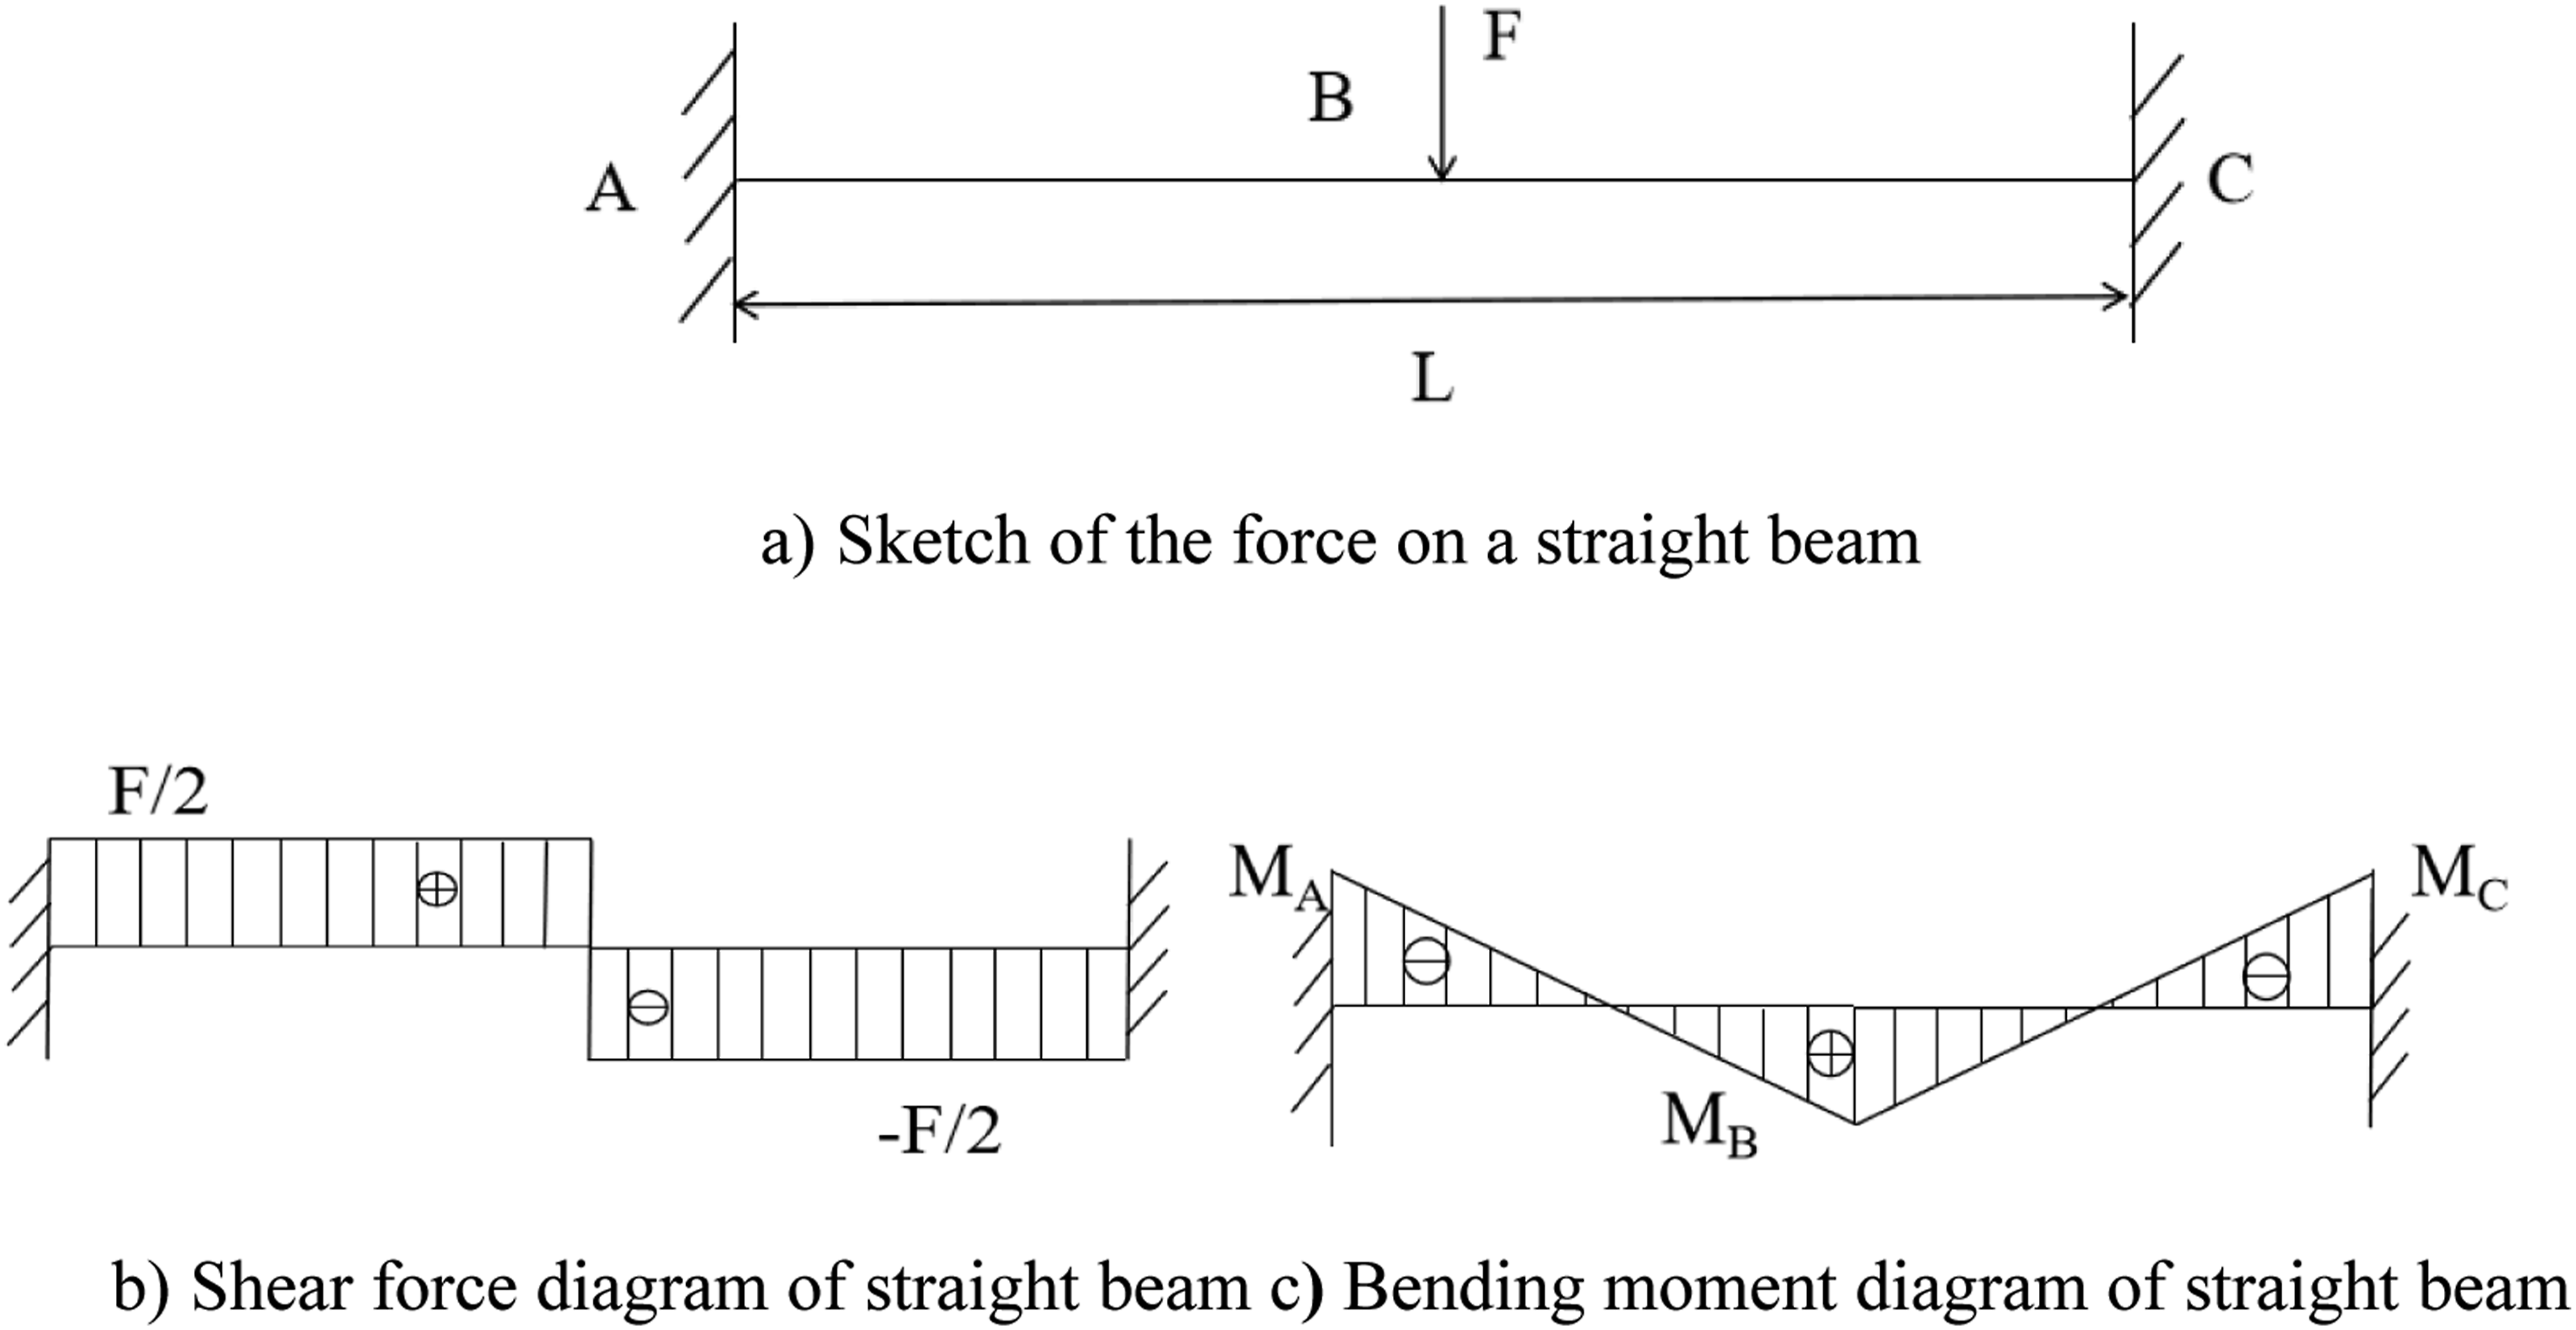

Using the force method to derive the resulting shear force and bending moment distributions (Figure 1).
Internal force analysis of curved beam
The semi-circular beam-column substructure possesses six redundant constraints at each half-span. A statically determinate system is established by releasing the column constraints at point B of the curved beam and substituting them with equivalent internal force components. The z-direction bending moment (Mz) and shear forces in x-y plane (Vx, Vy) are neglected based on small deformation theory. The retained reaction components are represented by shear force X1 in the z direction, bending moment X2 in the y direction, and torque X3 in the x direction. As illustrated in Figure 2, the position of any point on sections A and B of the curved beam is denoted by θ (0 ≤ θ ≤ α). The variable F represents the concentrated load. The key steps of the force method for calculating the internal forces of a section are as follows: Fundamental system for force method analysis of curved beam.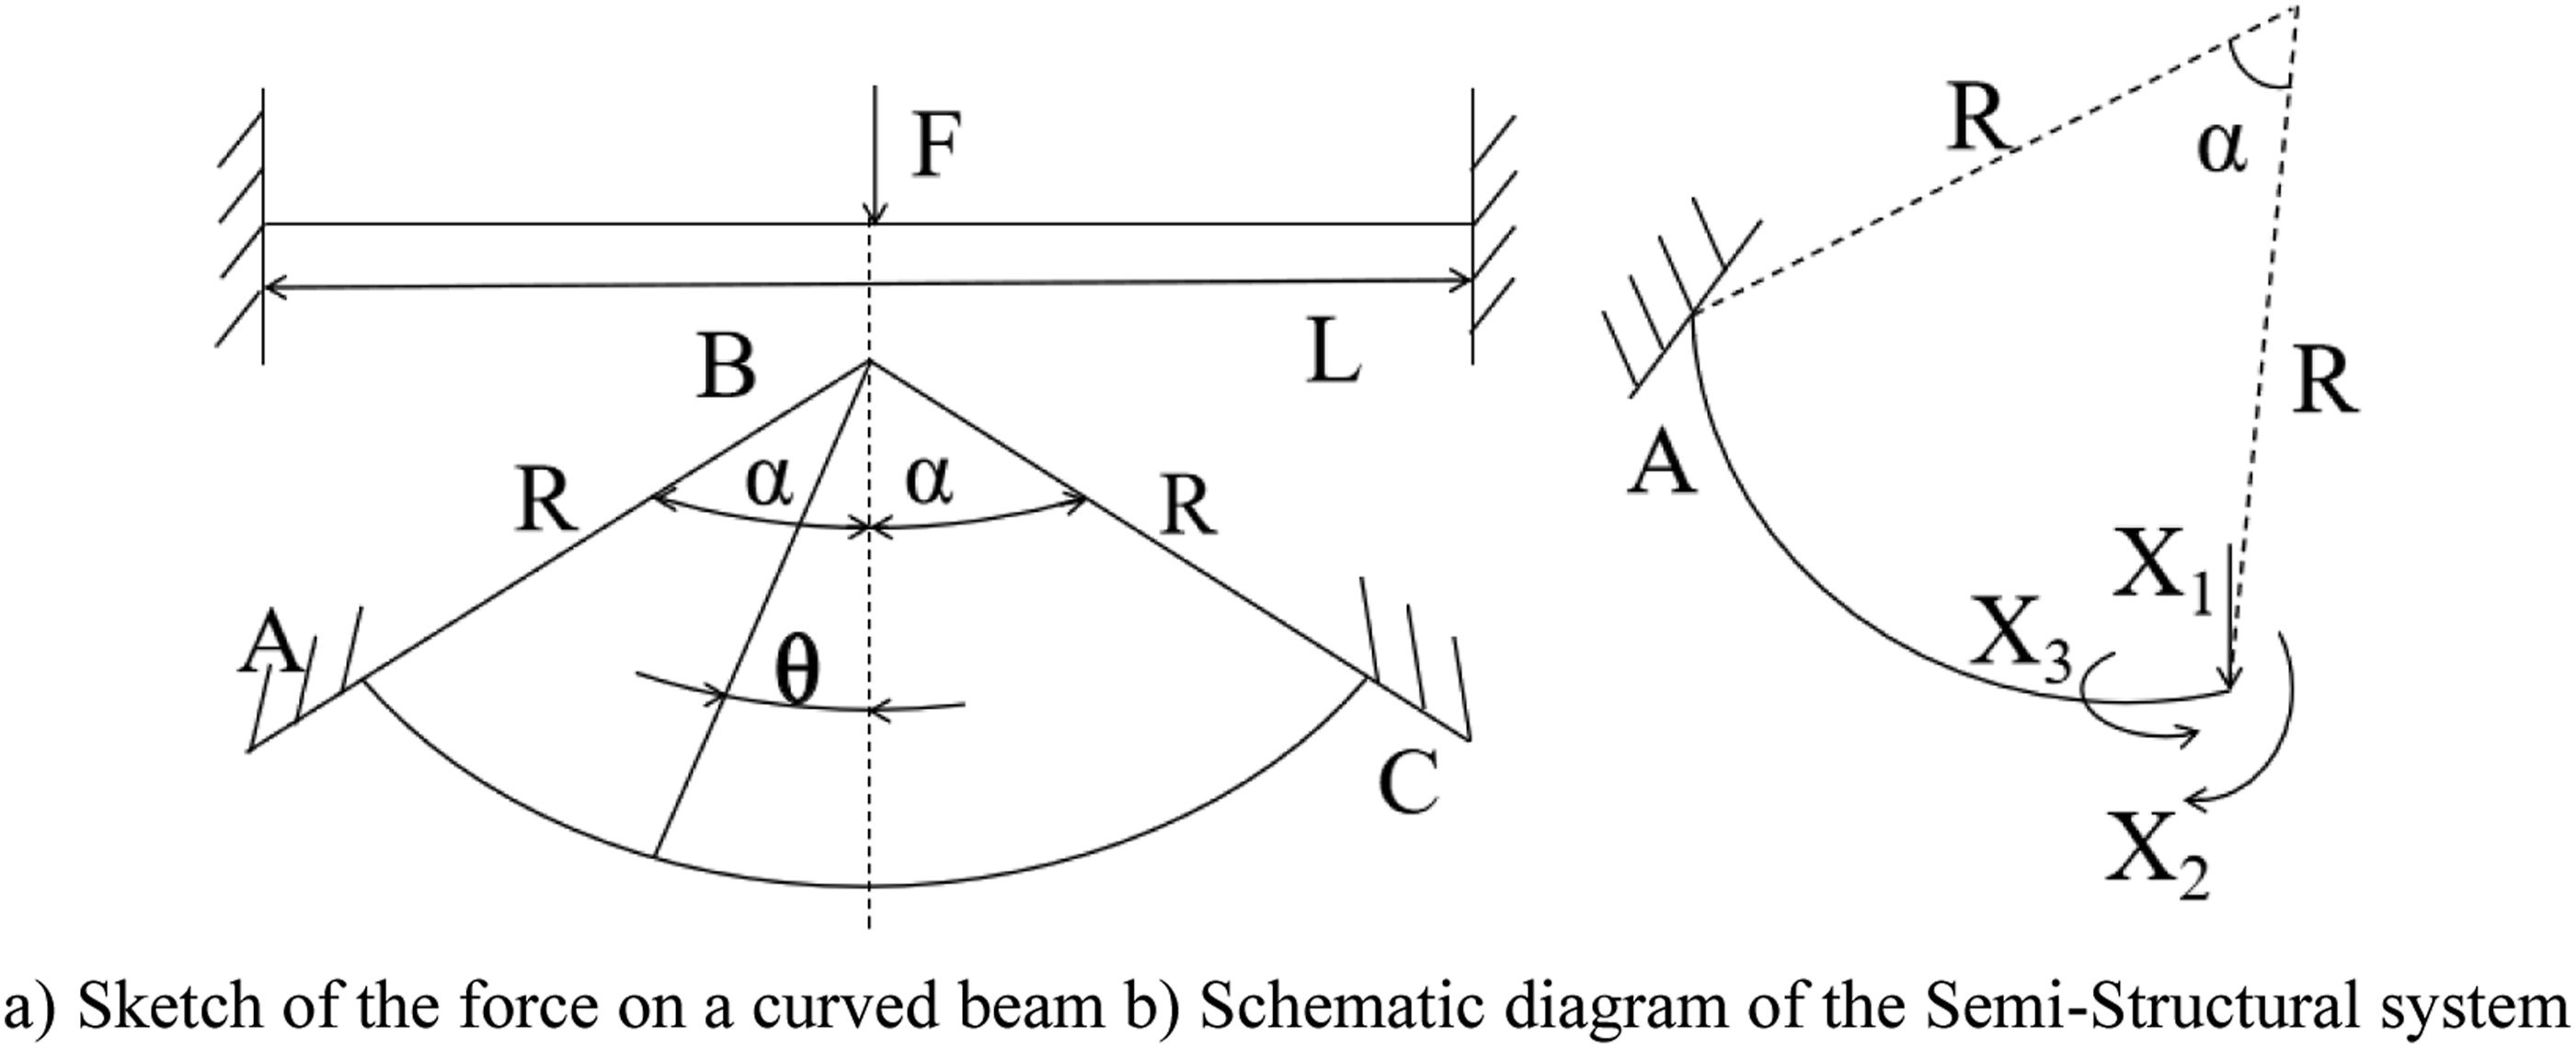
The compatibility equations for the force method are established as follows:
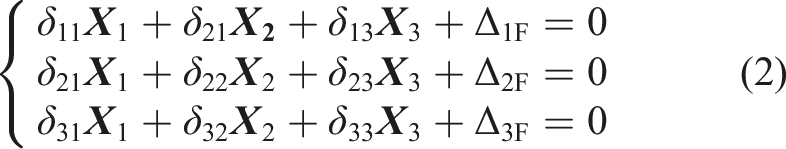
The above formulation is based on a Cartesian coordinate system.
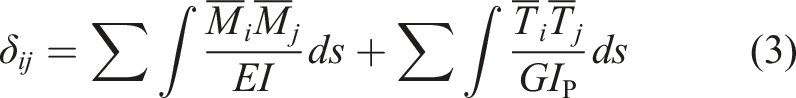
The flexibility coefficients and free terms are computed as:
Internal force components of the curved beam under unit load actions.
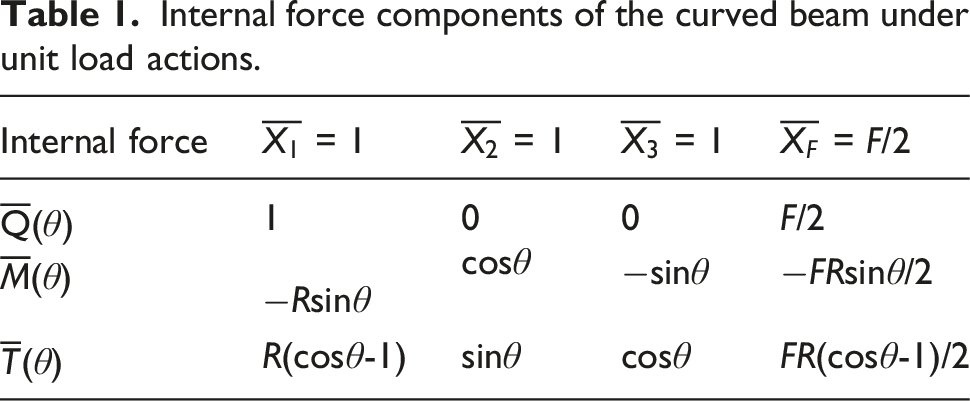
Owing to the structural symmetry about Section B, the transverse shear force Q and axial moment M
x
vanish at this cross-section. Therefore, the unknown internal force at Section B can be determined:

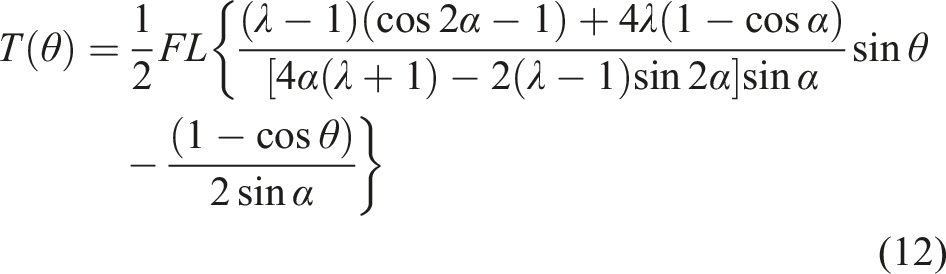
The resultant internal forces at angular position θ are obtained by superposition of the unknown force components X1, X2, X3 and external load F, the sectional forces (bending moment M
θ
, torsional moment T
θ
, and shear force Q
θ
) are expressed as:


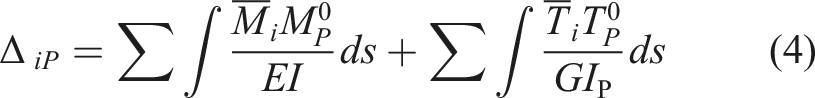
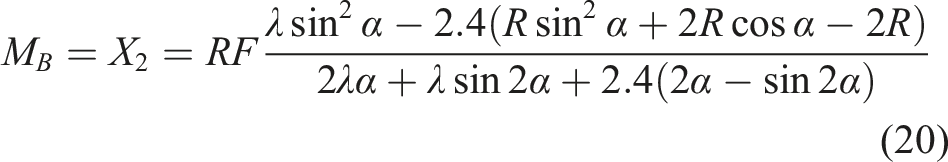
Thus, the internal forces of curved beam can be obtained. Figure 3 shows the internal force distributions. Internal force distribution of curved beam under mid-span concentrated load.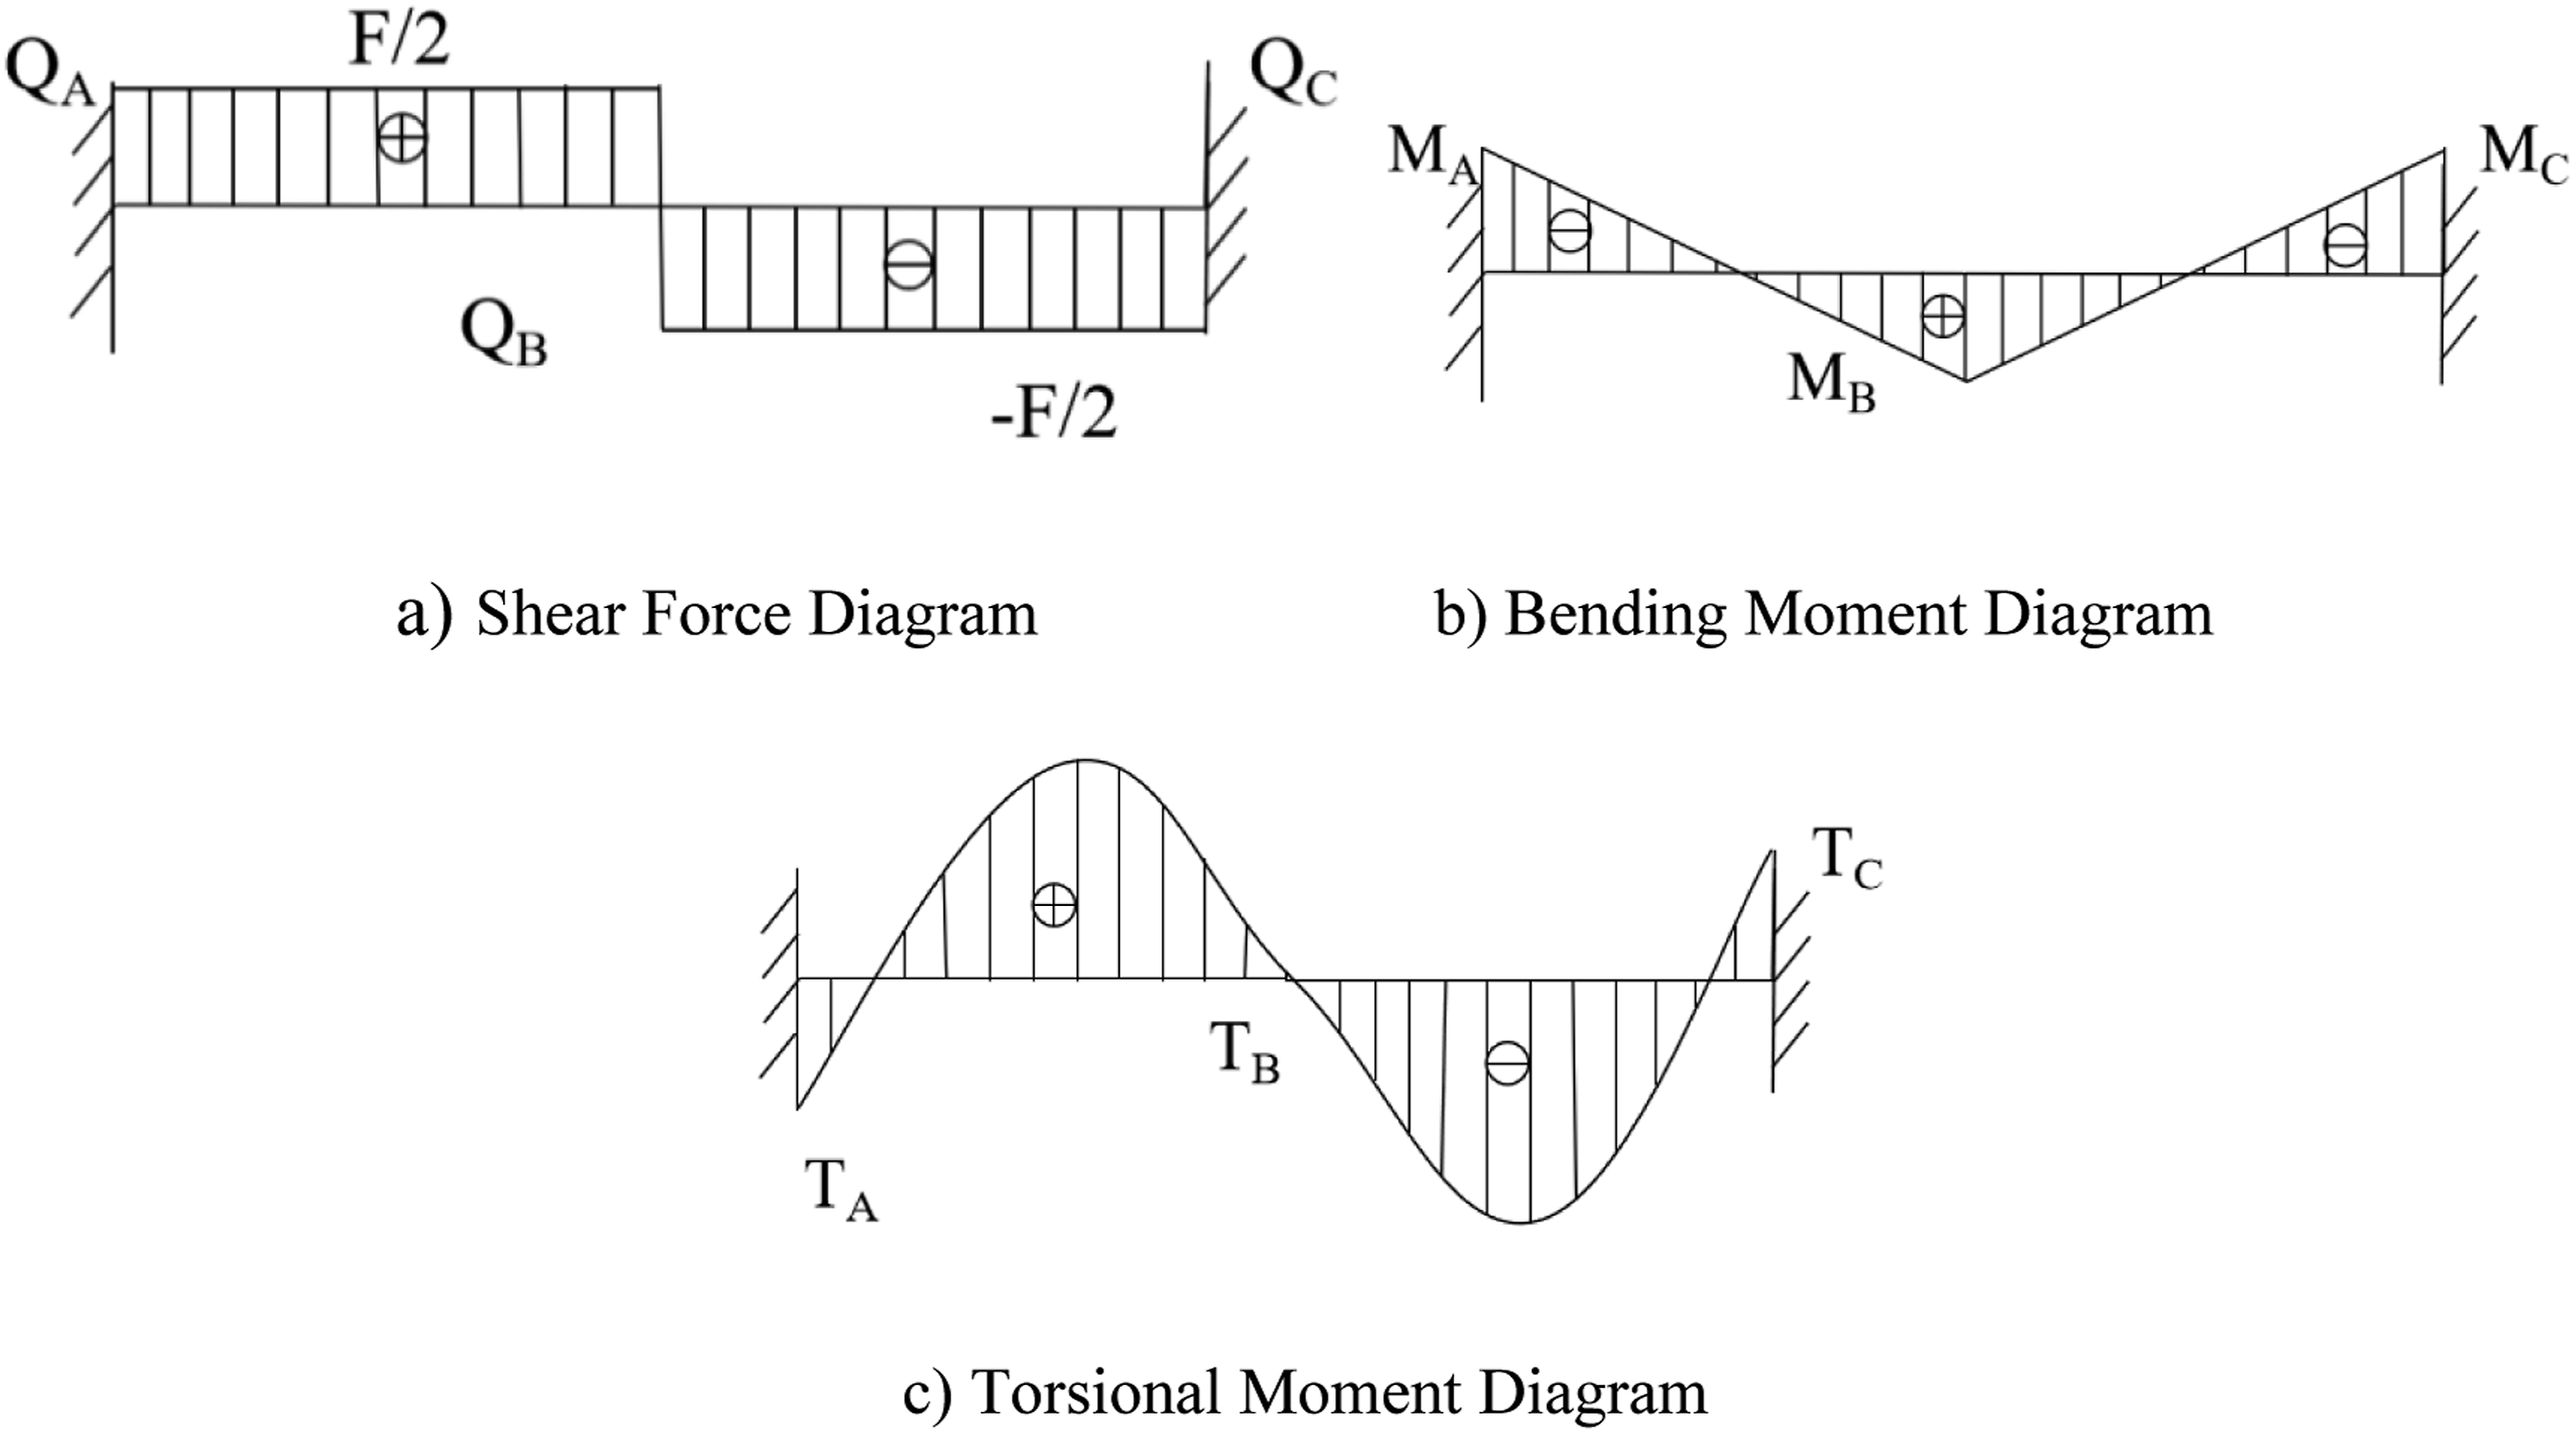
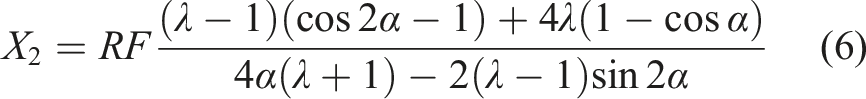
By substituting X
2
and replacing the radius R with span length L, the expression can be simplified to: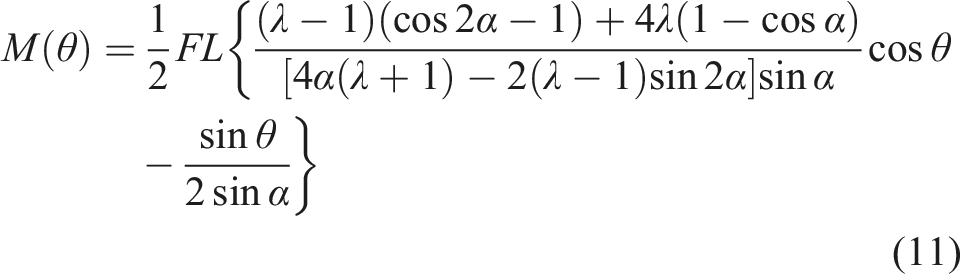
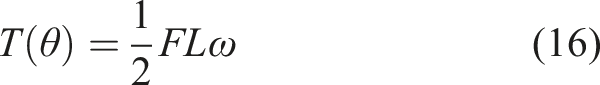
Herein, dimensionless influence coefficients τ (bending) and ω (torsion) are defined to simplify the formulations and they are given by: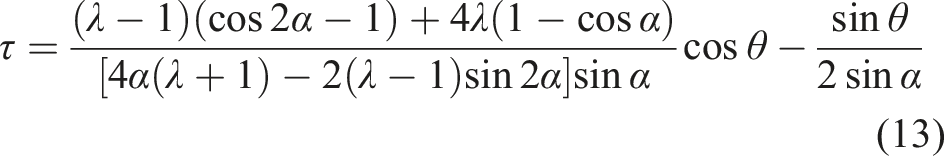
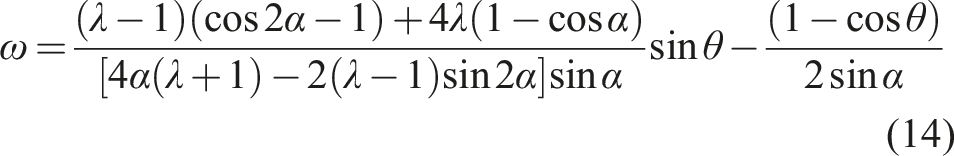
Figure 4 presents the variation of influence coefficients τ(α) and ω(α) with subtended angle α, calculated using equation (15) and (16). The detailed numerical values are listed in Table 2. Due to the symmetry of the distribution, only the data in the positive domain are presented to reduce redundancy. Then Variation of influence coefficients τ and ω with α. Variation of τ and ω with α.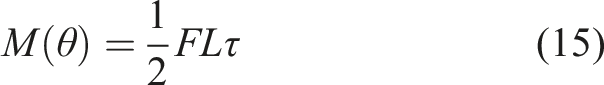
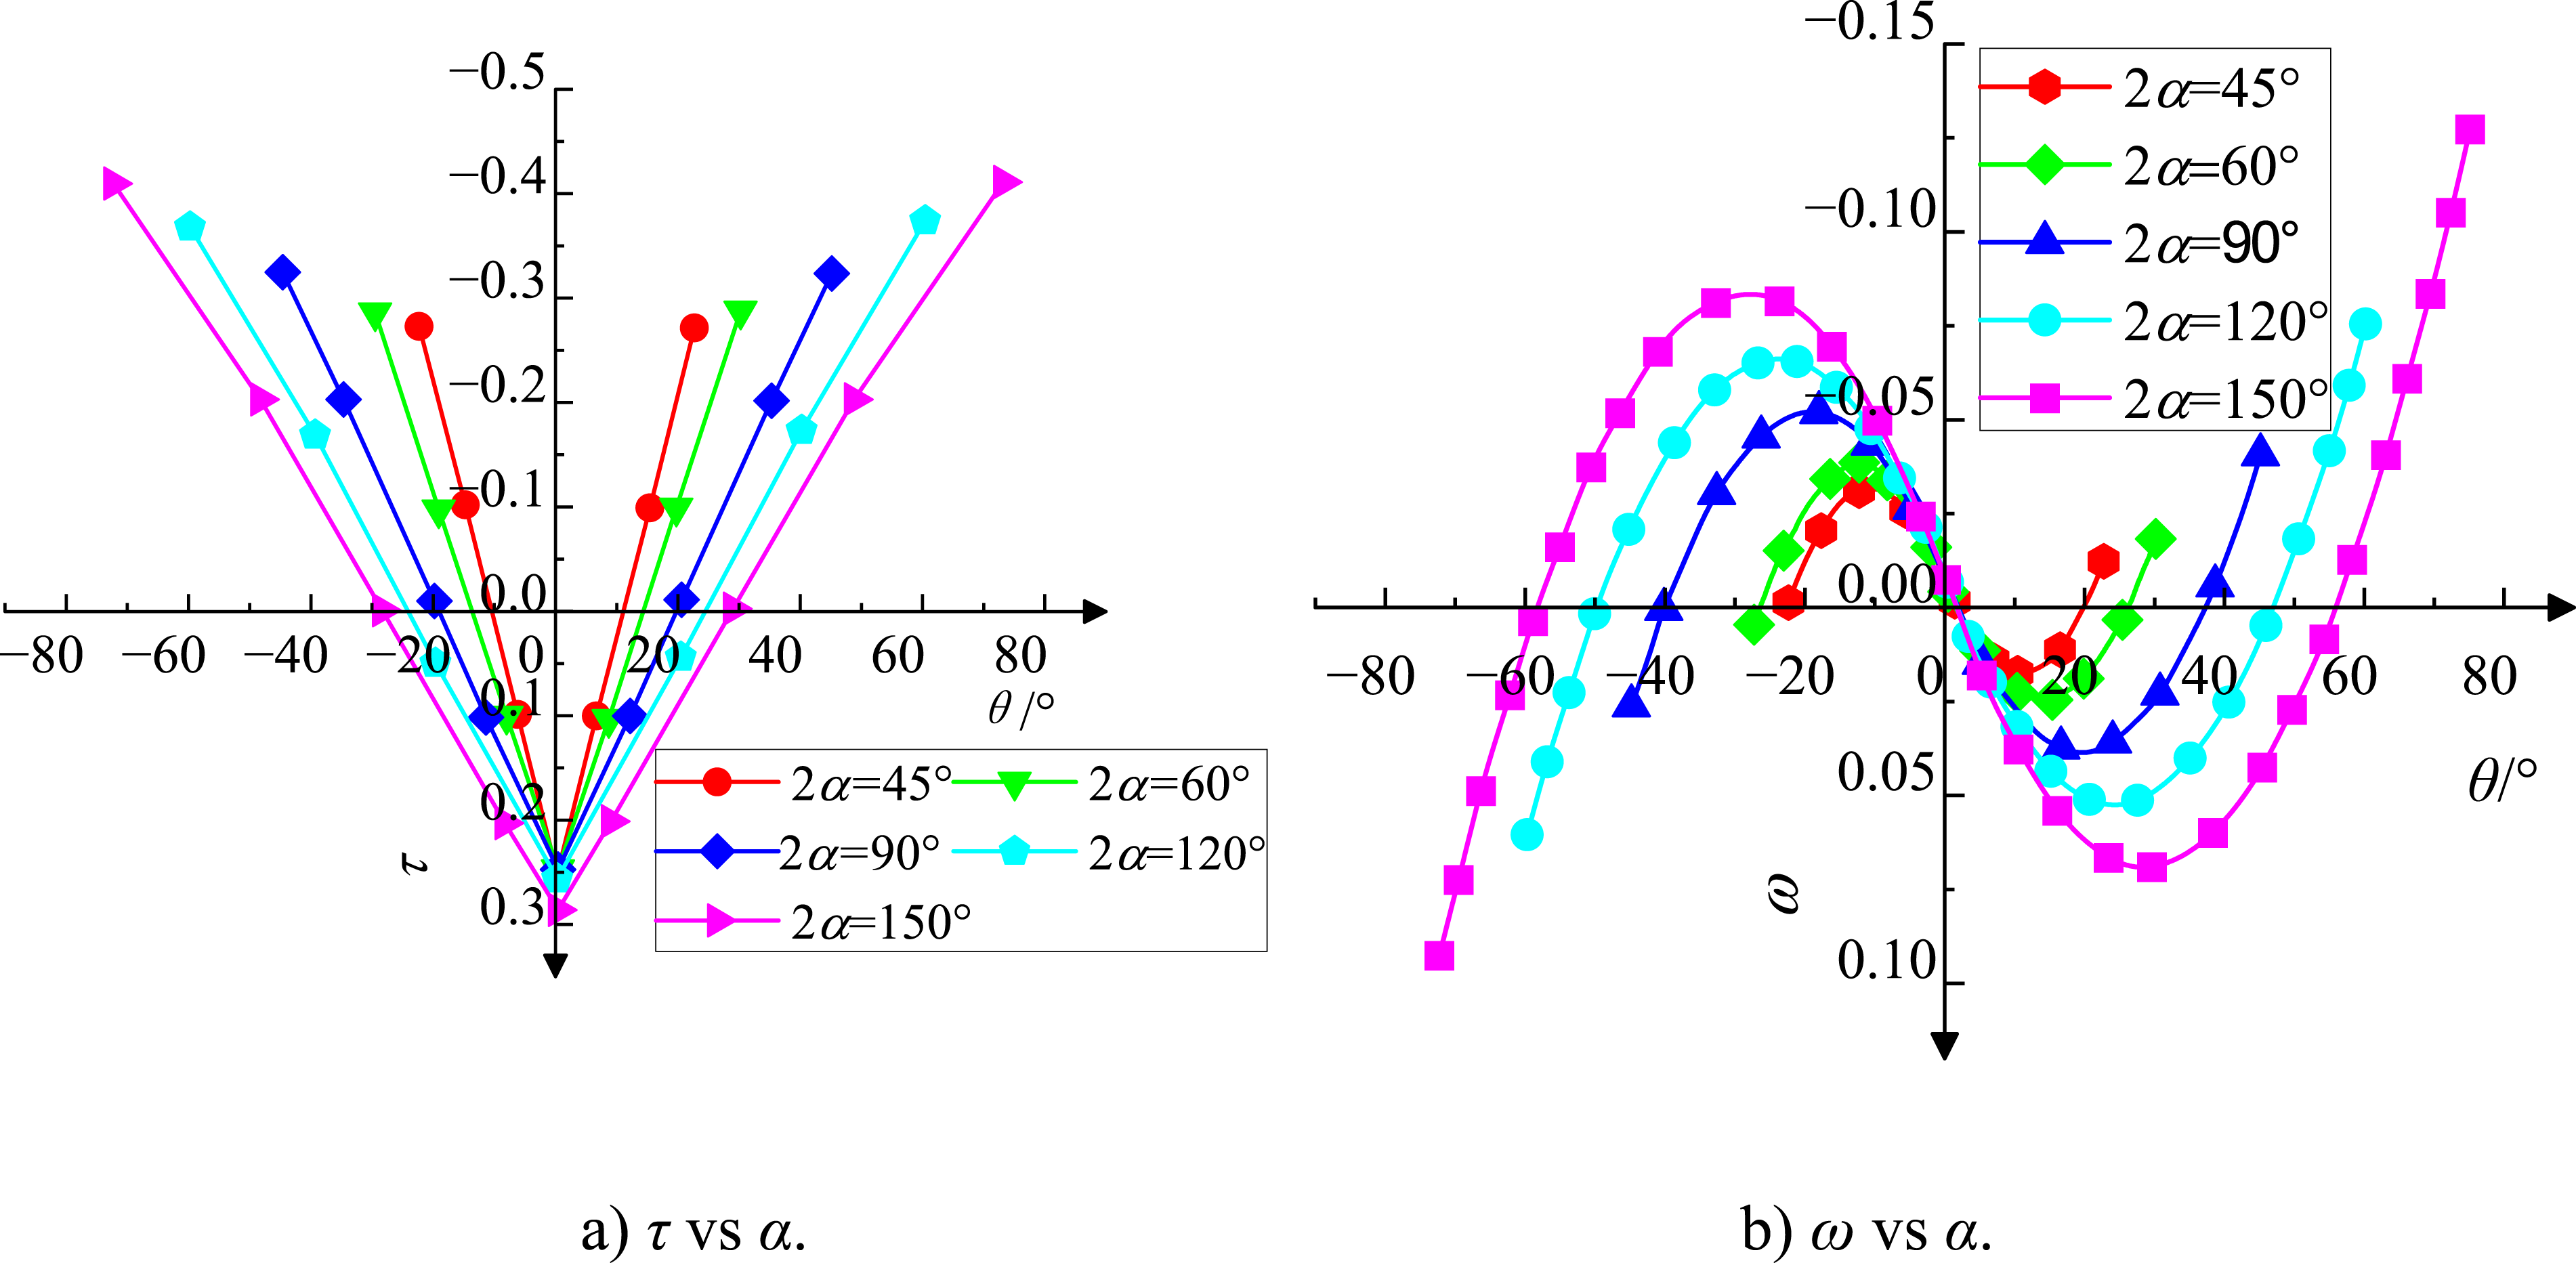
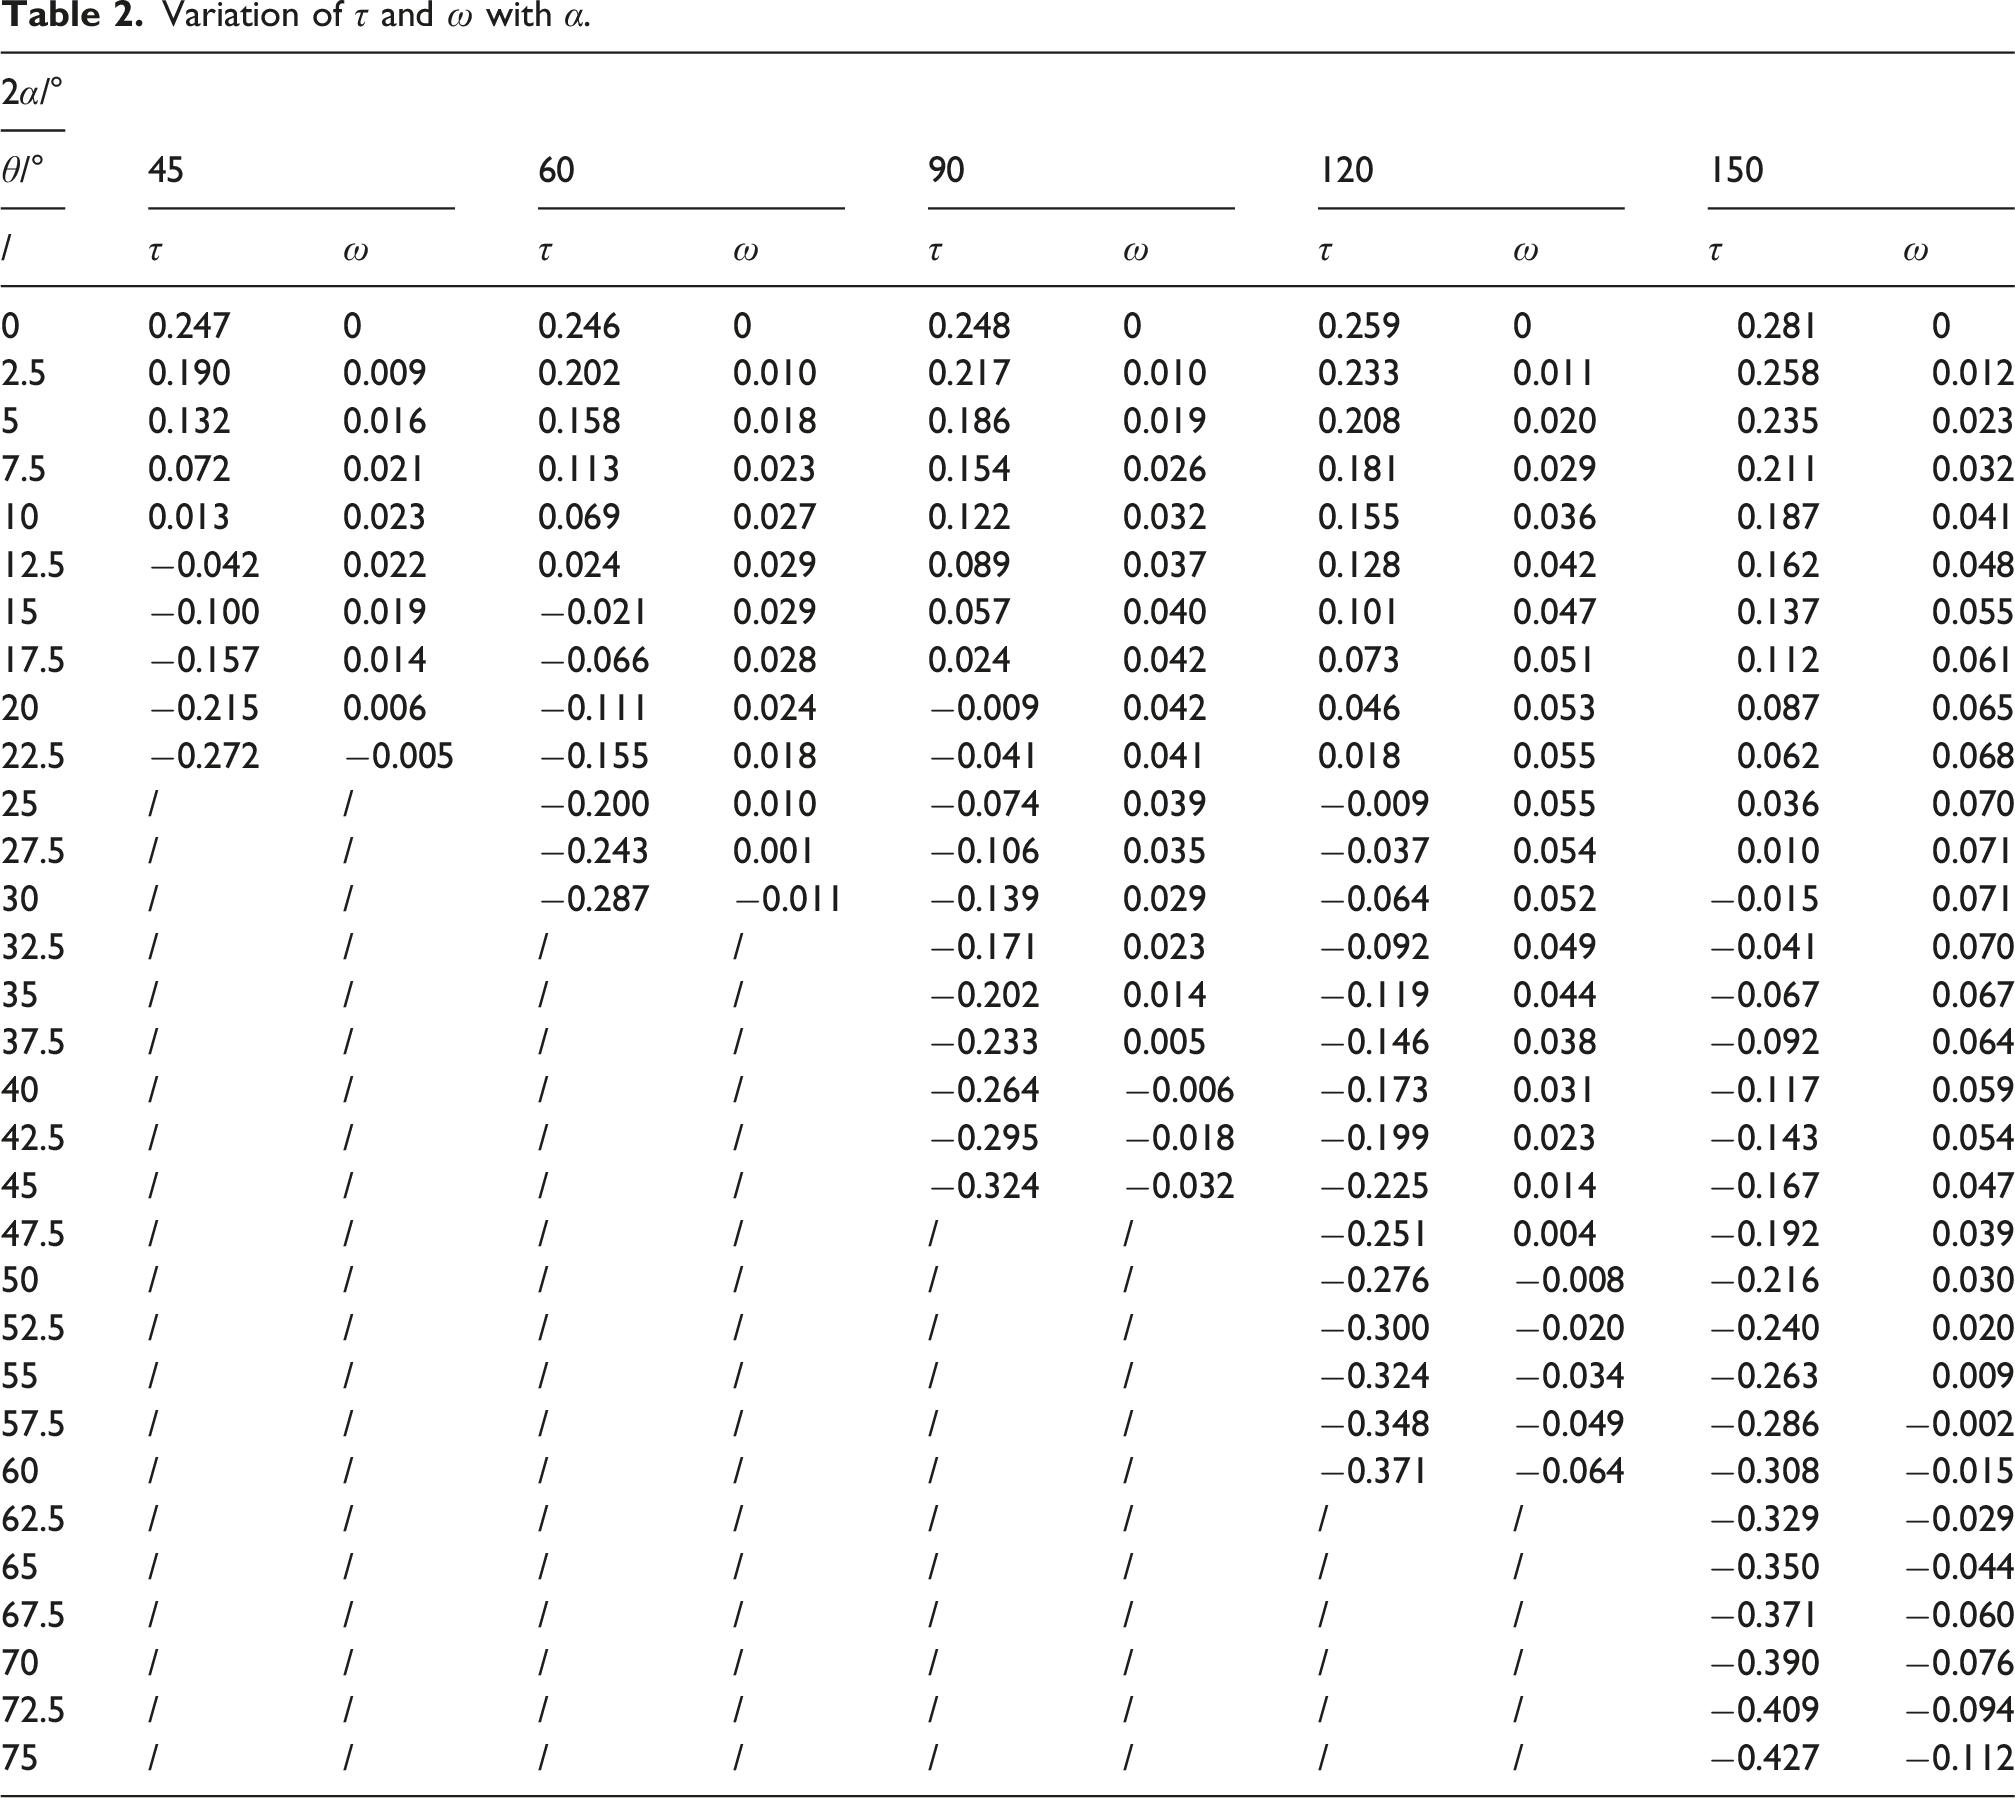
From Figure 4, it can be observed that under a concentrated load, the torque distribution along the curved beam follows an antisymmetric pattern, varying sinusoidally. This behavior agrees with the torsional moment diagram in Figure 3. At the midspan (loading point), the torque is zero due to symmetry, while the absolute value of torque reaches its maximum at the supports, with opposite directions. As the central angle increases, the negative bending moment at the supports, the positive bending moment at midspan, and the peak torsional moment increase linearly (with the torsional moment at 150° being three times than at 45°). This behavior is governed by the geometric characteristics of the curved beam and the coupling mechanism of internal forces. Specifically, as the central angle increases, the bending-torsion coupling effect becomes more pronounced.
Structural design follows the maximum principle which is adopting peak internal forces for safety verification o ensure reliability and cost-effectiveness. From Figure 5, it compares the peak internal force ratios (κ) between curved and straight beams versus subtended angle α. The peak bending moment ratio κ reflects the influence of curvature on the distribution of structural stiffness. κ of straight and curved beams for different α.
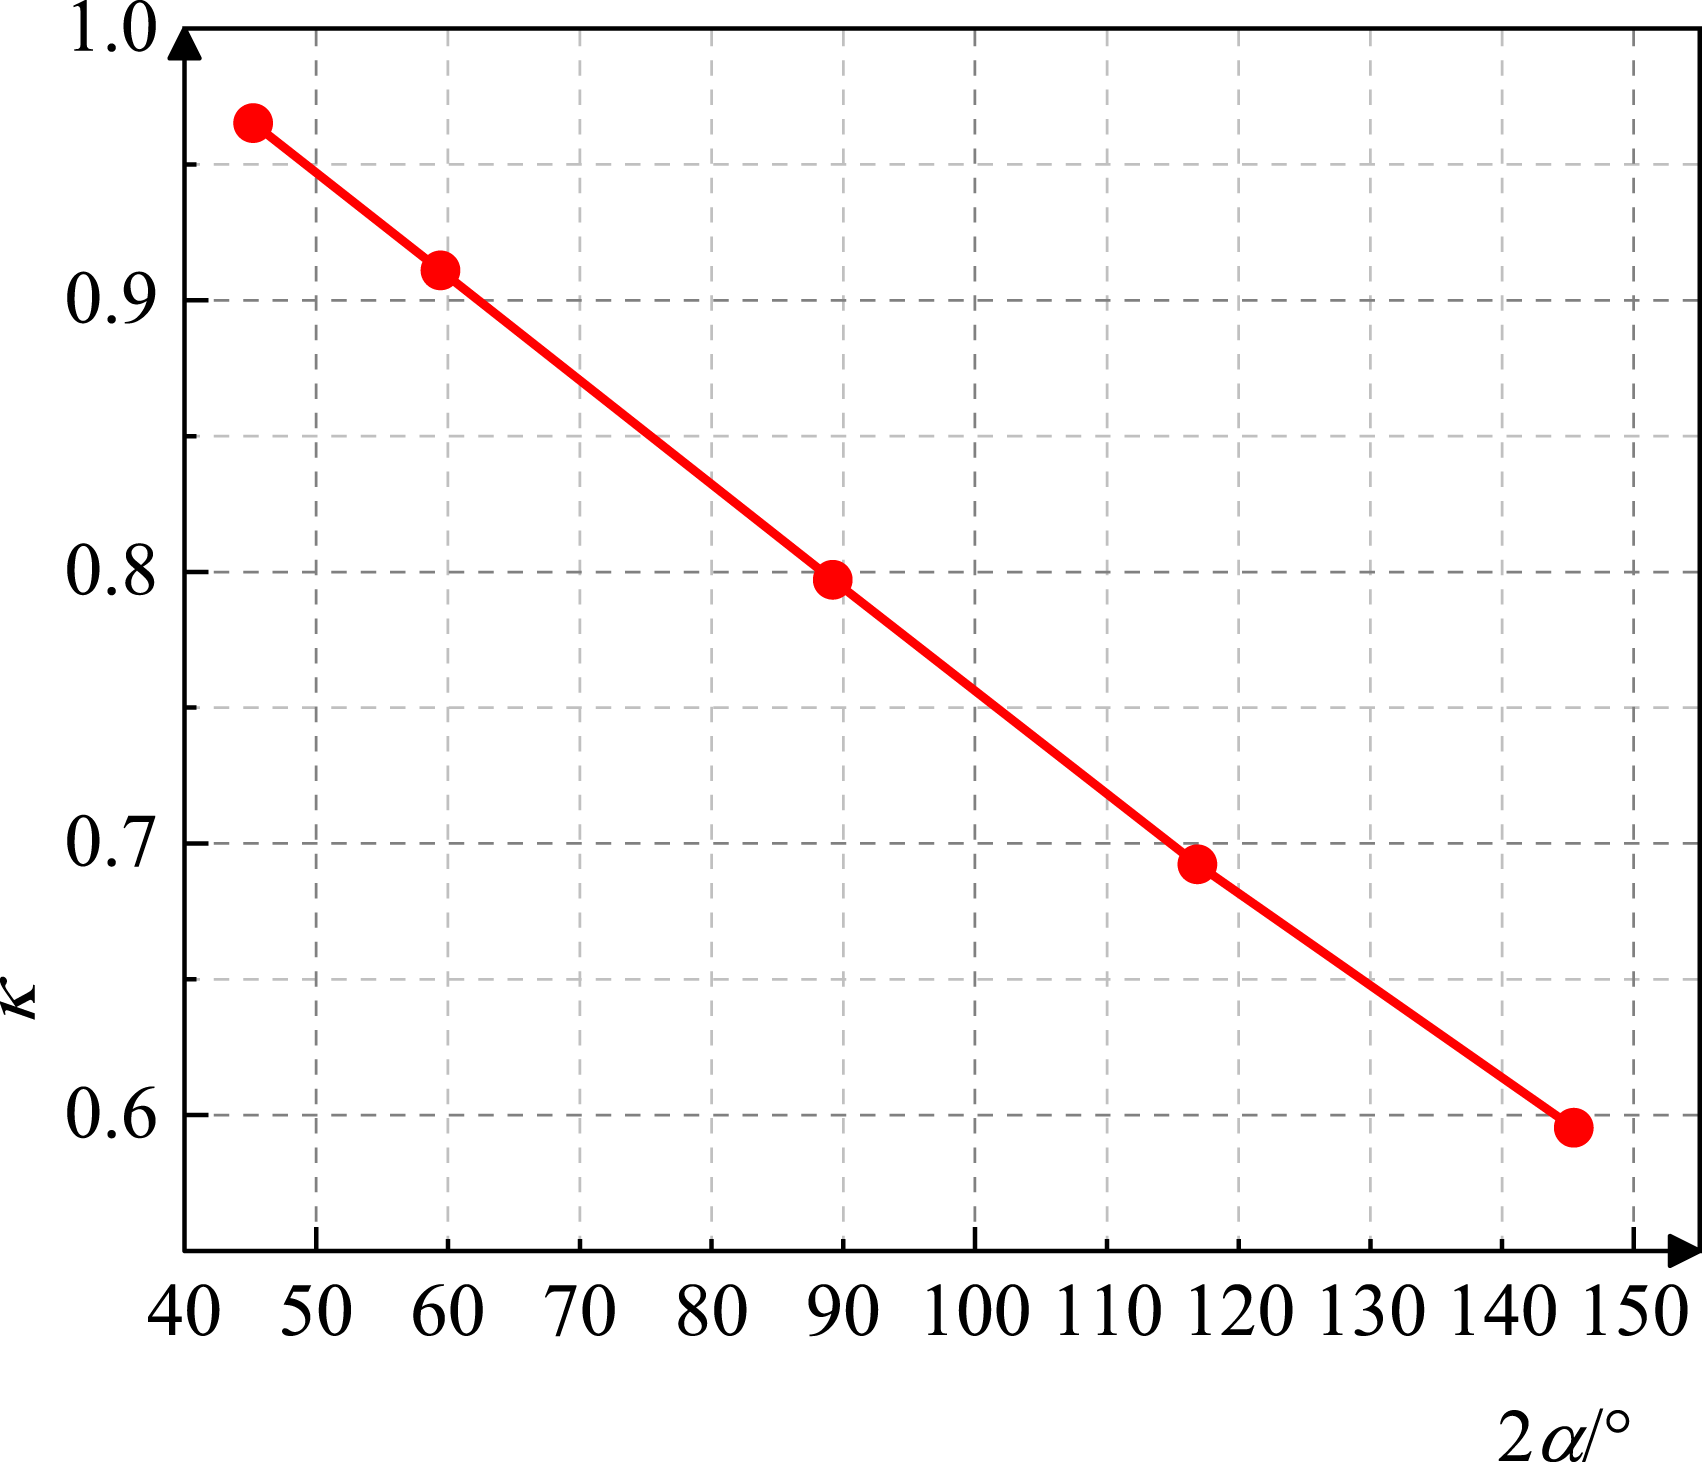
As shown in Figure 5, the curved beam exhibits consistently higher peak bending moments than straight beam under identical span, loading, and boundary conditions. This results from bending-torsion coupling, which induces additional torsion-induced bending moments in curved beams. Furthermore, the ratio decreases monotonically with increasing central angle. This trend demonstrates a direct intensification of bending-torsion coupling effects with greater curvature.
Equations (15) and (16) calculate the bending moment MA and torsional moment TA at the beam end of the edge column, as well as the bending moment MB at the beam end of the center column:

Carrying capacity analysis method with bend-torsion interaction
The calculations are performed using the test structure specimen developed in this study. According to specifications, the calculation of the carrying capacity for curved beams must consider the bending-torsion coupling effect. A method of partial correlation and partial superposition is employed for the carrying capacity of the composite torsion member. Specifically, the concrete resistance component accounts for the correlation, while the resistance component of the steel reinforcement uses the superposition method.
Consistent with the model specimen design, Chinese code (GB 50010-2010) were also employed for bending-torsion calculations. The ultimate pure bending capacity M
u
is calculated as:
The ultimate pure torsion capacity T
u
is given by: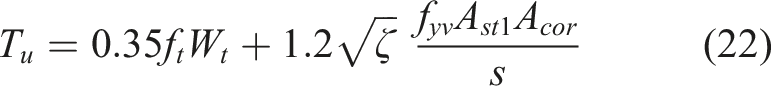
The torsional capacity depends on the reinforcement strength ratio (ζ), defined as: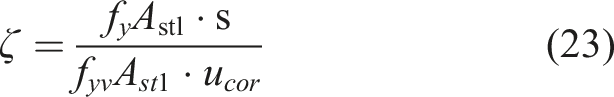
Experimental evidence confirms significant bend-torsion interaction in curved concrete members (Salim et al., 2023), with the interaction surface exhibiting convexity. Following quarter-circle interaction model reported by (Elfren et al., 1974), the normalized capacity relationship is: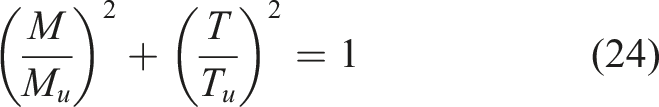
Based on the internal force analysis results from Section 2.2, the peak values of the calculated bending moment (M) and torque (T) at each subtended angle were taken as the governing internal forces. These values were then substituted into the resistance formulas (equations 21–24) to compute the ultimate loads for the curved beam and the straight beam.
The proposed method is applicable for RC curved beams with moderate curvature under quasi-static loading, and its accuracy may decrease for highly curved beams or beams with non-standard reinforcement arrangements.
Influence of central angle and sectional reinforcement on the carry capacity of curved beams
To investigate the influence of curvature and sectional reinforcement on the progressive collapse resistance of curved beams, this section presents four typical reinforcement configurations with distinct flexural-torsional characteristics, based on common engineering practices for rectangular reinforced concrete (RC) beams.
Reinforcement details of cross-sections.
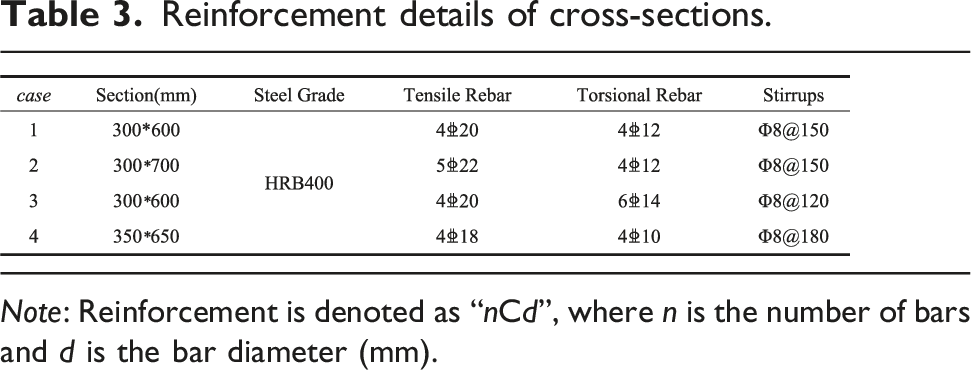
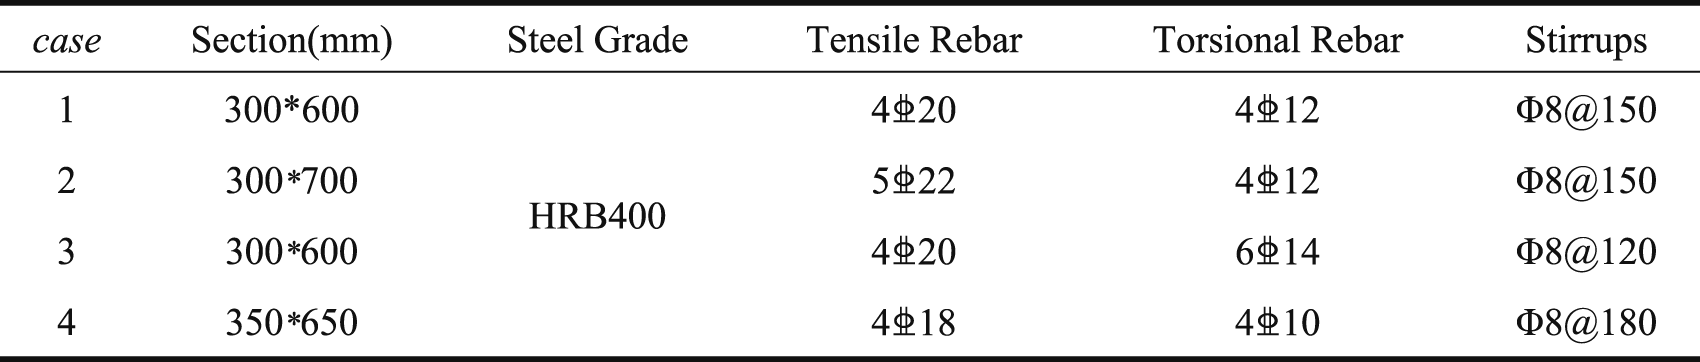
Note: Reinforcement is denoted as “nCd”, where n is the number of bars and d is the bar diameter (mm).
Let k denote the moment-to-torsion ratio, i.e., k = T/M; β denote the bending-to-torsional capacity ratio. Based on equation (24), the dimensionless ultimate carrying capacity P* is derived as follows: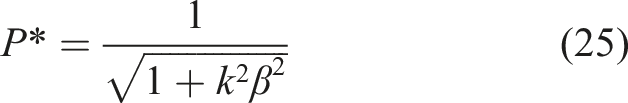
Values of k, β and P* for different central angles.
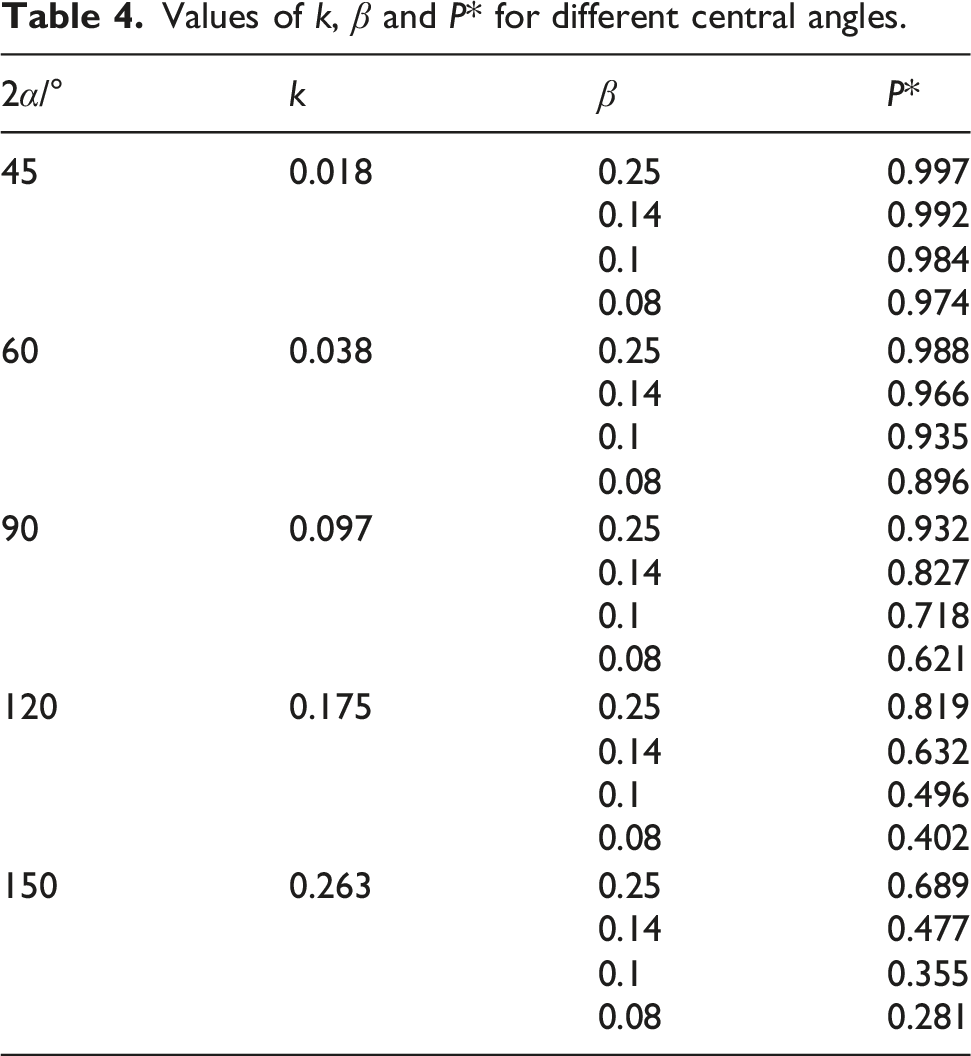
To better visualize the observed trends, the data from Table 3 are plotted in Figure 6, which illustrates the variation of the dimensionless capacity P* with the sectional property ratio α, using β as a parameter. P* of curved beam for different β and α.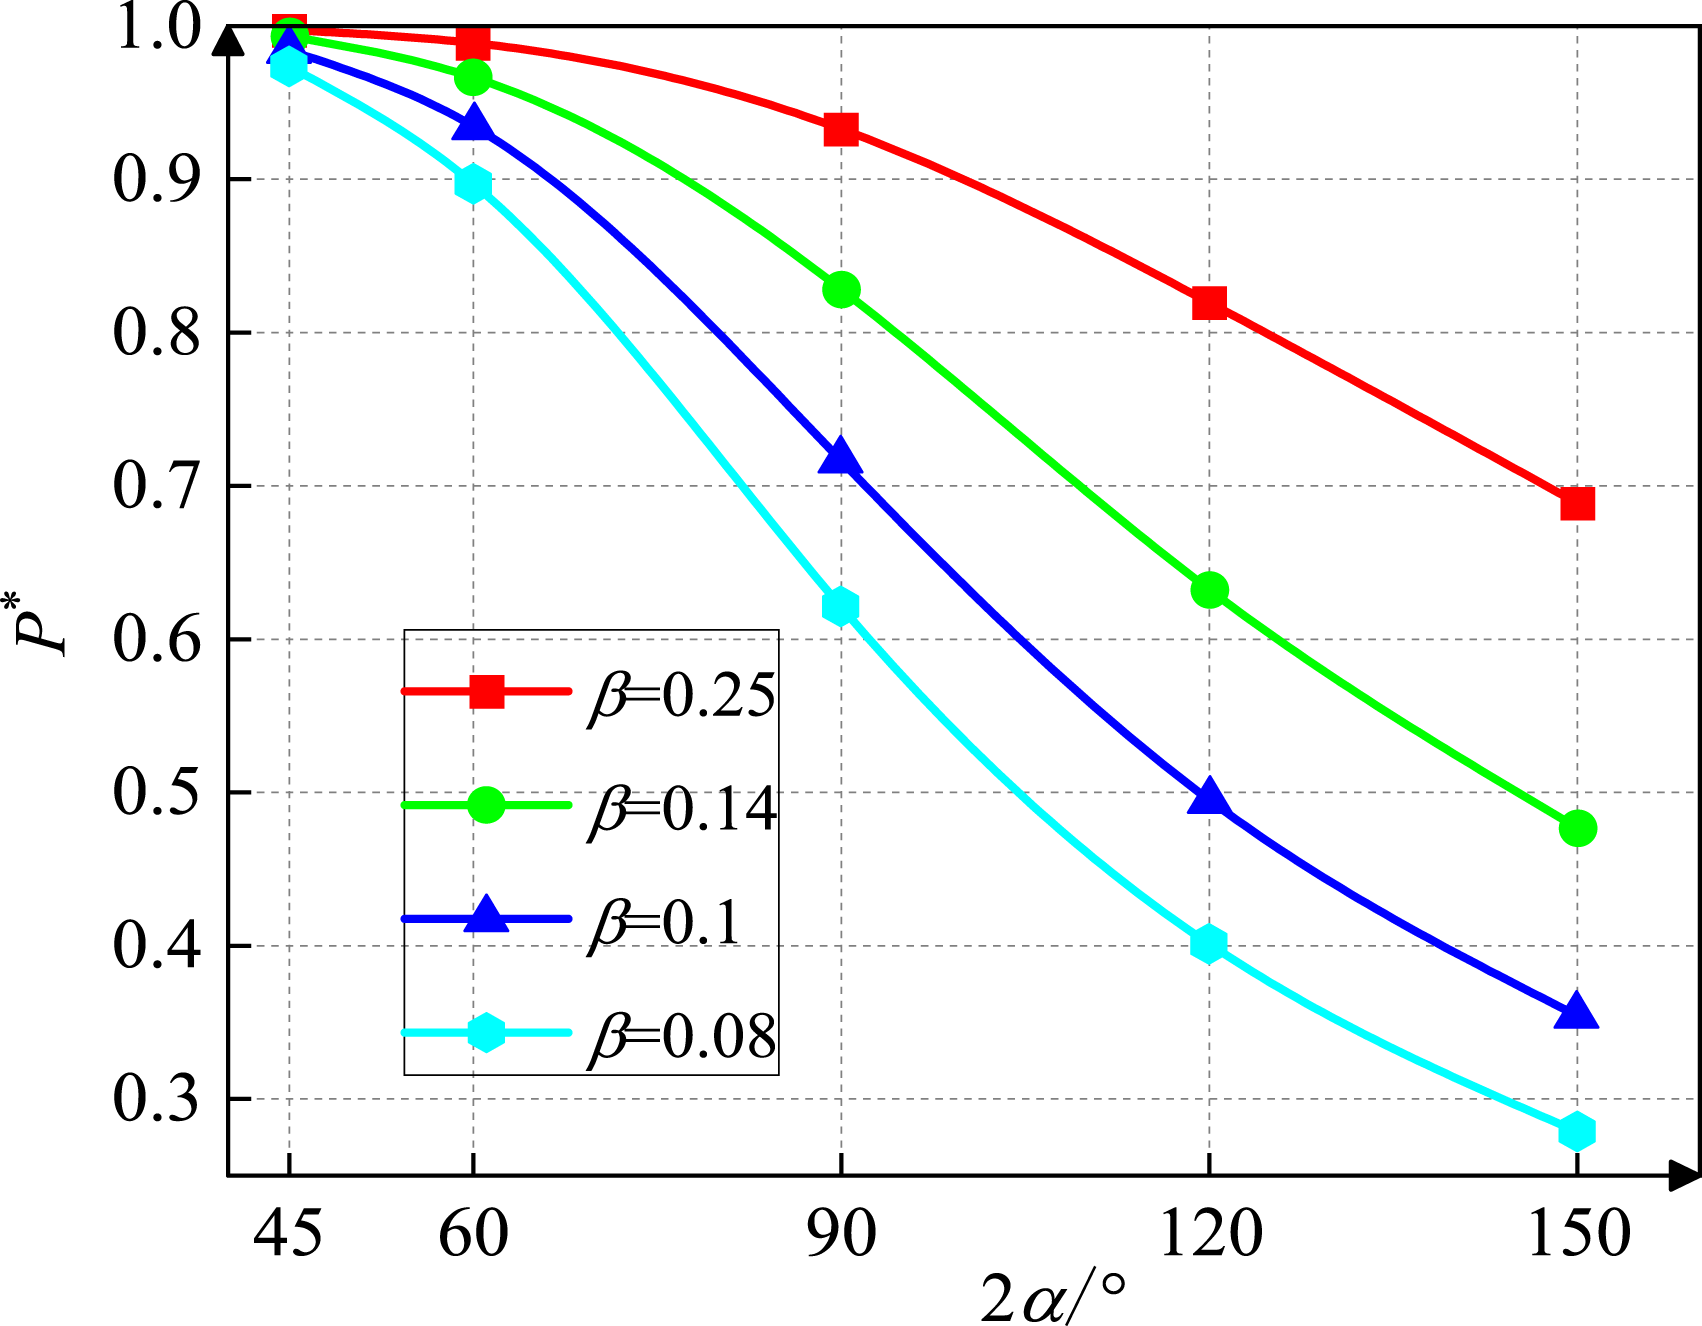
As illustrated in Figure 6, observations of the curve morphology indicate that the decay of carrying capacity under all working conditions exhibits significant nonlinear characteristics. For any given value of β, the P* shows a monotonically decreasing trend as α increases, indicating that an increase in beam curvature leads to a significant degradation of its ultimate carrying capacity. This phenomenon stems from the bending-torsion coupling effect, as α increases, the proportion of torque in the sectional internal forces rises, while the proportion of bending moment relatively decreases. According to the bending-torsion interaction equation, the strength reserve of a section under torsion is generally lower than that under pure bending. Thus, an increase in the torsional component exacerbates the reduction in carrying capacity.
Meanwhile, the parameter β has a decisive influence on the shape of the P*-α curve. The higher the value of β, the more gradual the decline of the curve, indicating that enhancing the sectional torsional capacity can effectively mitigate the loss of carrying capacity induced by increased curvature. For instance, when β decreases from 0.25 to 0.08, the reduction in P* corresponding to an increase in α from 90° to 150° expands from 26% to 55%, demonstrating that sections with low β are more sensitive to geometric variations within the range of high curvature.
In summary, the carrying capacity of a curved beam is inherently governed by the combined effects of its geometric curvature (α) and sectional bending-torsion characteristics (β). By quantifying the coupling relationship among P*, α, and β, this study reveals that matching the sectional torsional capacity with the beam’s curvature conditions is a key pathway to optimizing the carrying capacity of curved beams.
Test on progressive collapse of straight and curved concrete beam-column structures
Specimen design and fabrication
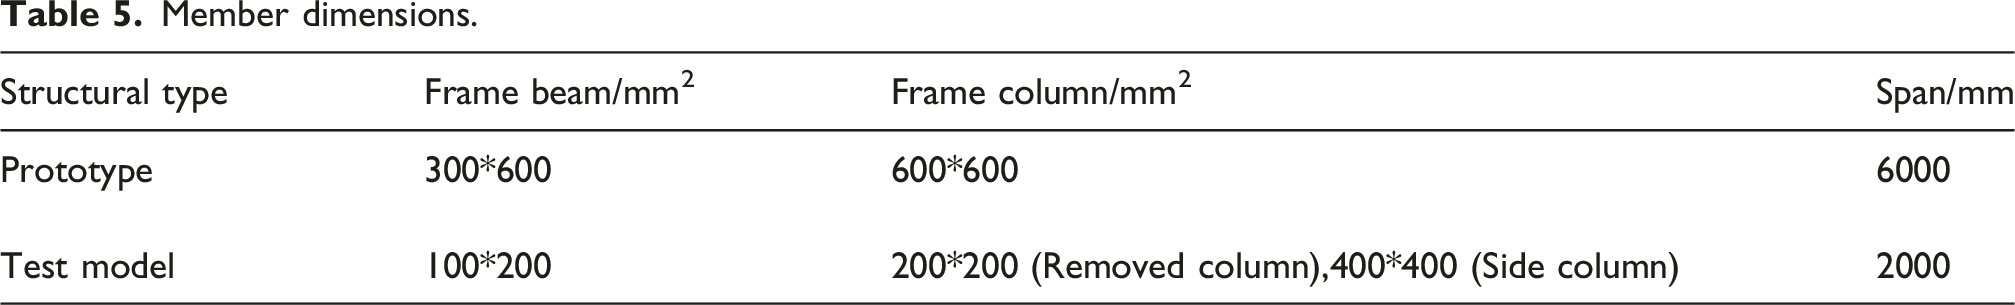
In accordance with the codes (National Standard of the People’s Republic of China, 2010a, National Standard of the People’s Republic of China, 2010b), this study utilized PKPM software to design a six-storeys reinforced concrete frame structure. The prototype structure contains curved beam with 60° central angle, a first-story height of 3.3 m, and typical story height of 3.0 m. The central angle of 60° was selected as a representative intermediate configuration for curved beam–column structures. This choice avoids the extreme geometric characteristics associated with very small or very large central angles, while still capturing the essential flexural–torsional coupling behavior of curved members under progressive collapse scenarios. Two middle spans of the first layer are selected as the research object, ensuring that accidental eccentricity could be neglected in load capacity calculations (Jiang et al., 2016). And two 1:3 scaled reinforced concrete curved beam specimen and a straight beam specimen are designed.
Member dimensions.
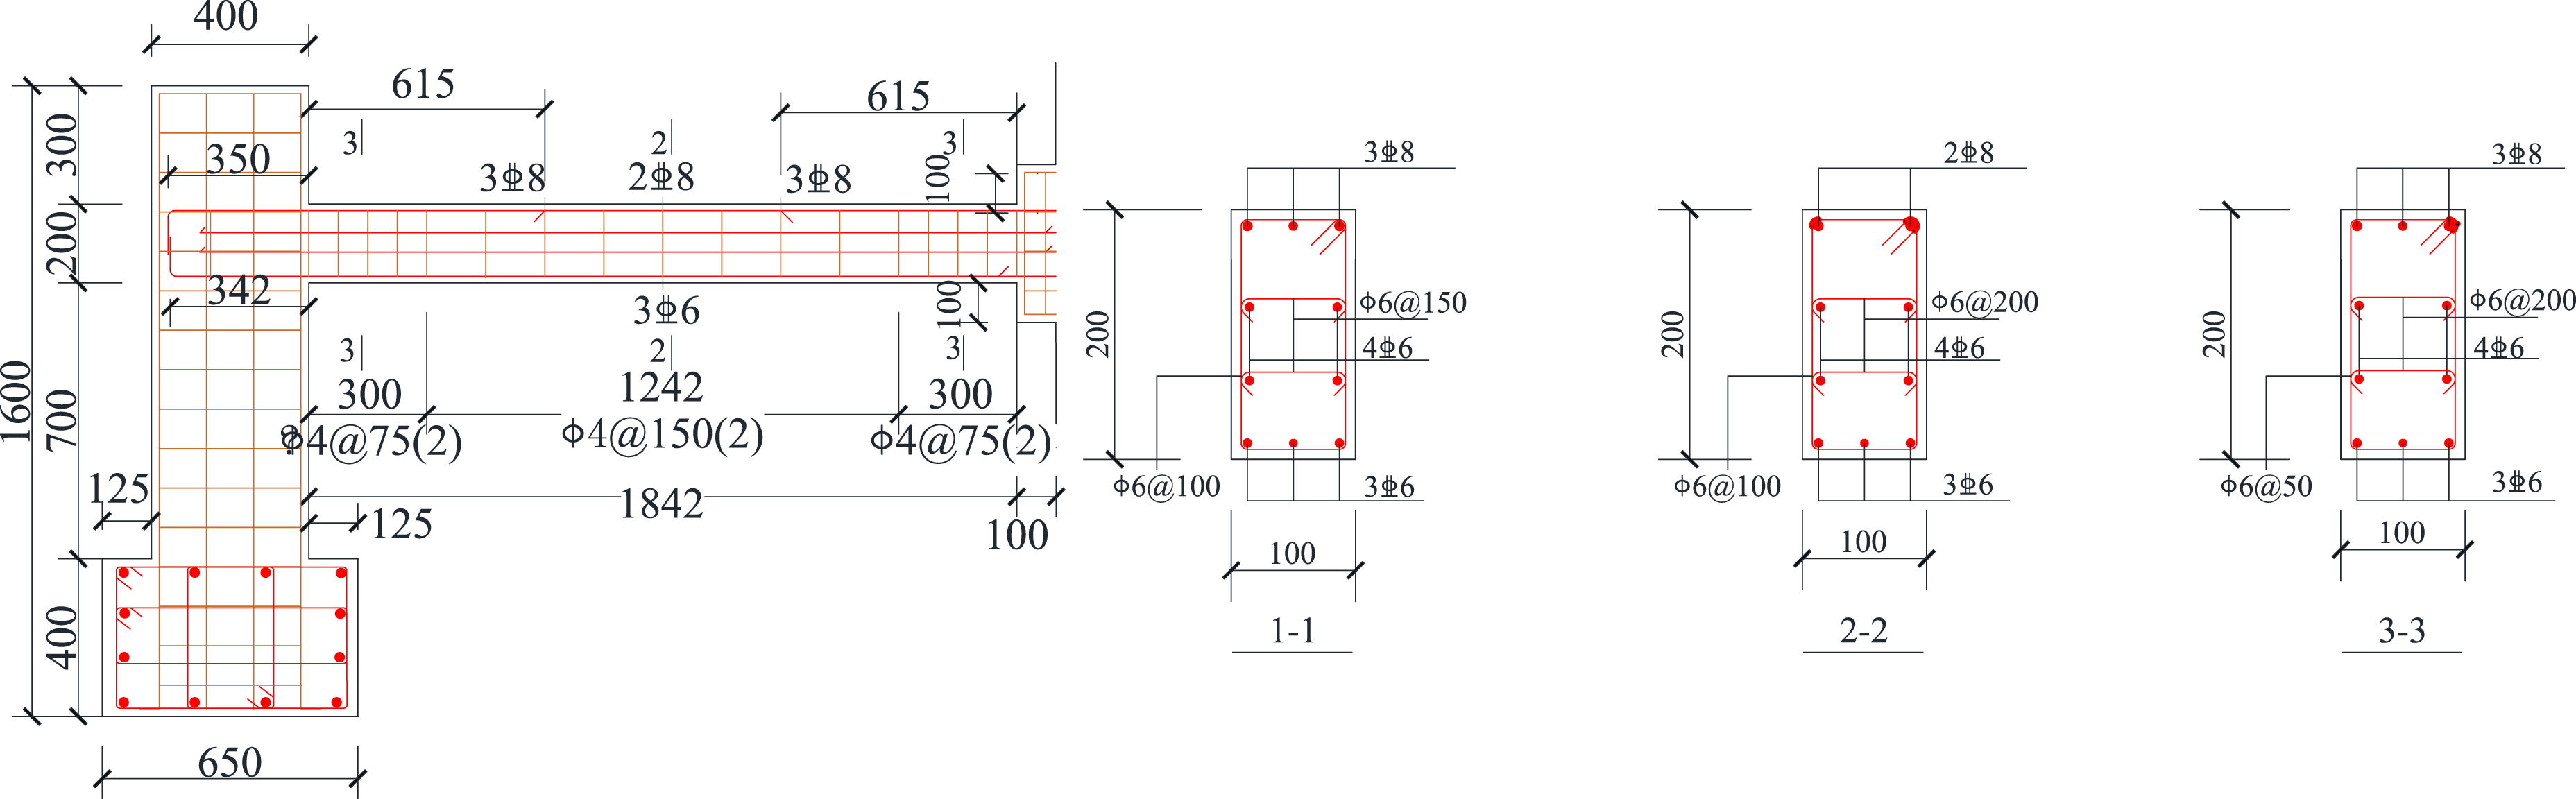
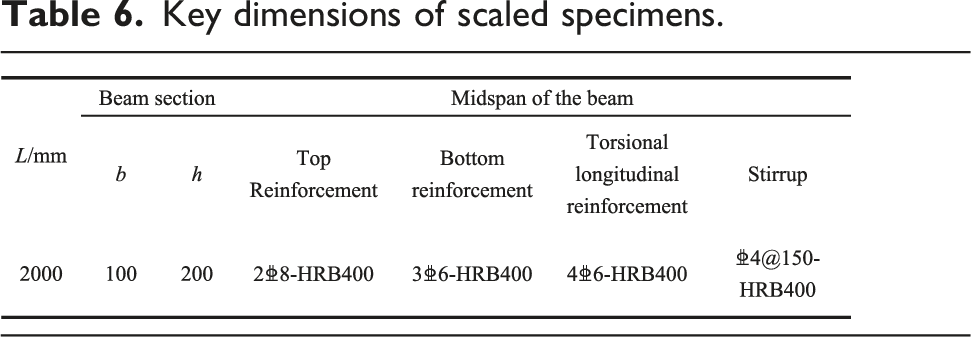
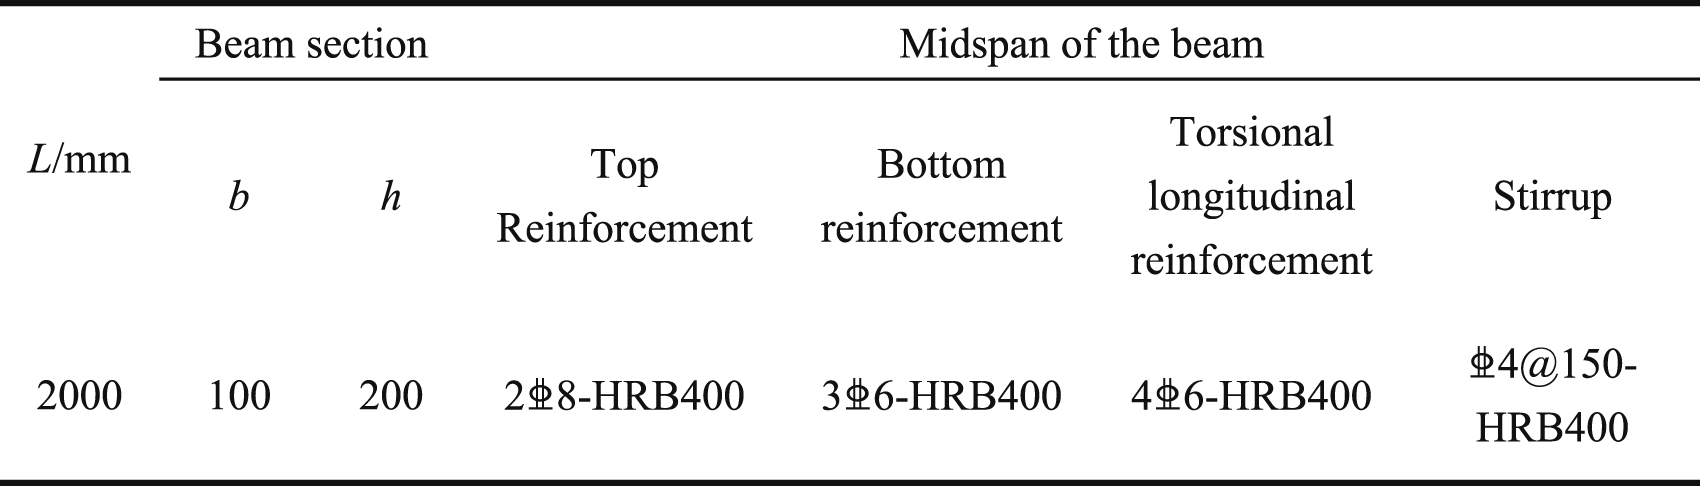
The specimen geometry and reinforcement details are illustrated in Figures 7 and 8 and Table 6 (reinforcement diagrams). Both specimens feature a short column in the middle of the span to simulate the failing columns, along with a side column on each side to represent the unfailed columns. The side columns were intentionally designed with enlarged section dimensions and stiffness to account for the restraining effect provided by the surrounding structure on the scaled curved beam substructure. Scaled test specimens. Reinforcement arrangement of the curved beam specimen. Note: “nCd” denotes n reinforcing bars with diameter d (mm). Key dimensions of scaled specimens.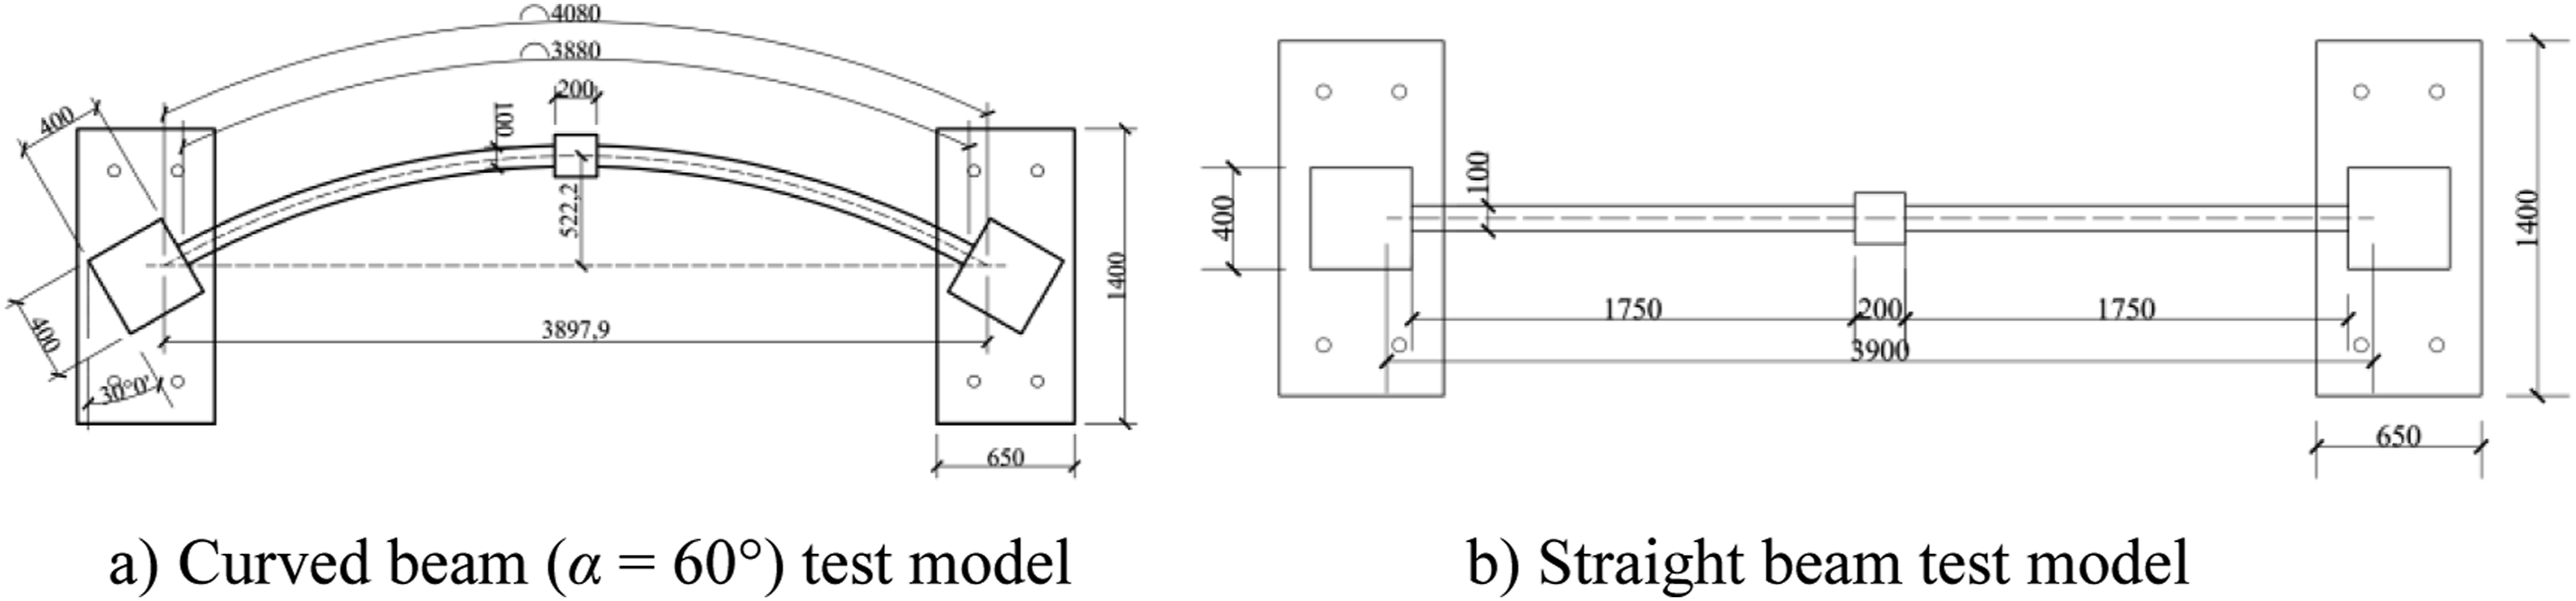
Loading programs and data measuring
Displacement-controlled loading was applied at the center column position using a hydraulic jack. To accommodate the larger base plate of the jack (300*300 mm) compared to the column cross-section (200*200 mm), a steel transfer column was installed. Four dowel pin holes were machined in the transfer plate to ensure concentric loading, with an eccentricity maintained below 1% of the column width.
It should be noted that without lateral restraints, the curved beams exhibited significant out-of-plane displacement and rotation during the collapse process. This behavior caused the head of the failed column to tilt, thereby restricting its vertical downward movement. In practical engineering structures, the failure location of columns may vary, and the surrounding upper structure provides restraint to the column head, confining its movement primarily to vertical displacement.
To simulate this boundary condition, a specialized loading device was designed for the curved beam–column substructure, as shown in Figure 9. In this study, an idealized boundary condition was adopted, in which the column head was restrained against rotation and horizontal displacement, allowing only vertical movement. Loading device for curved beam-column substructure.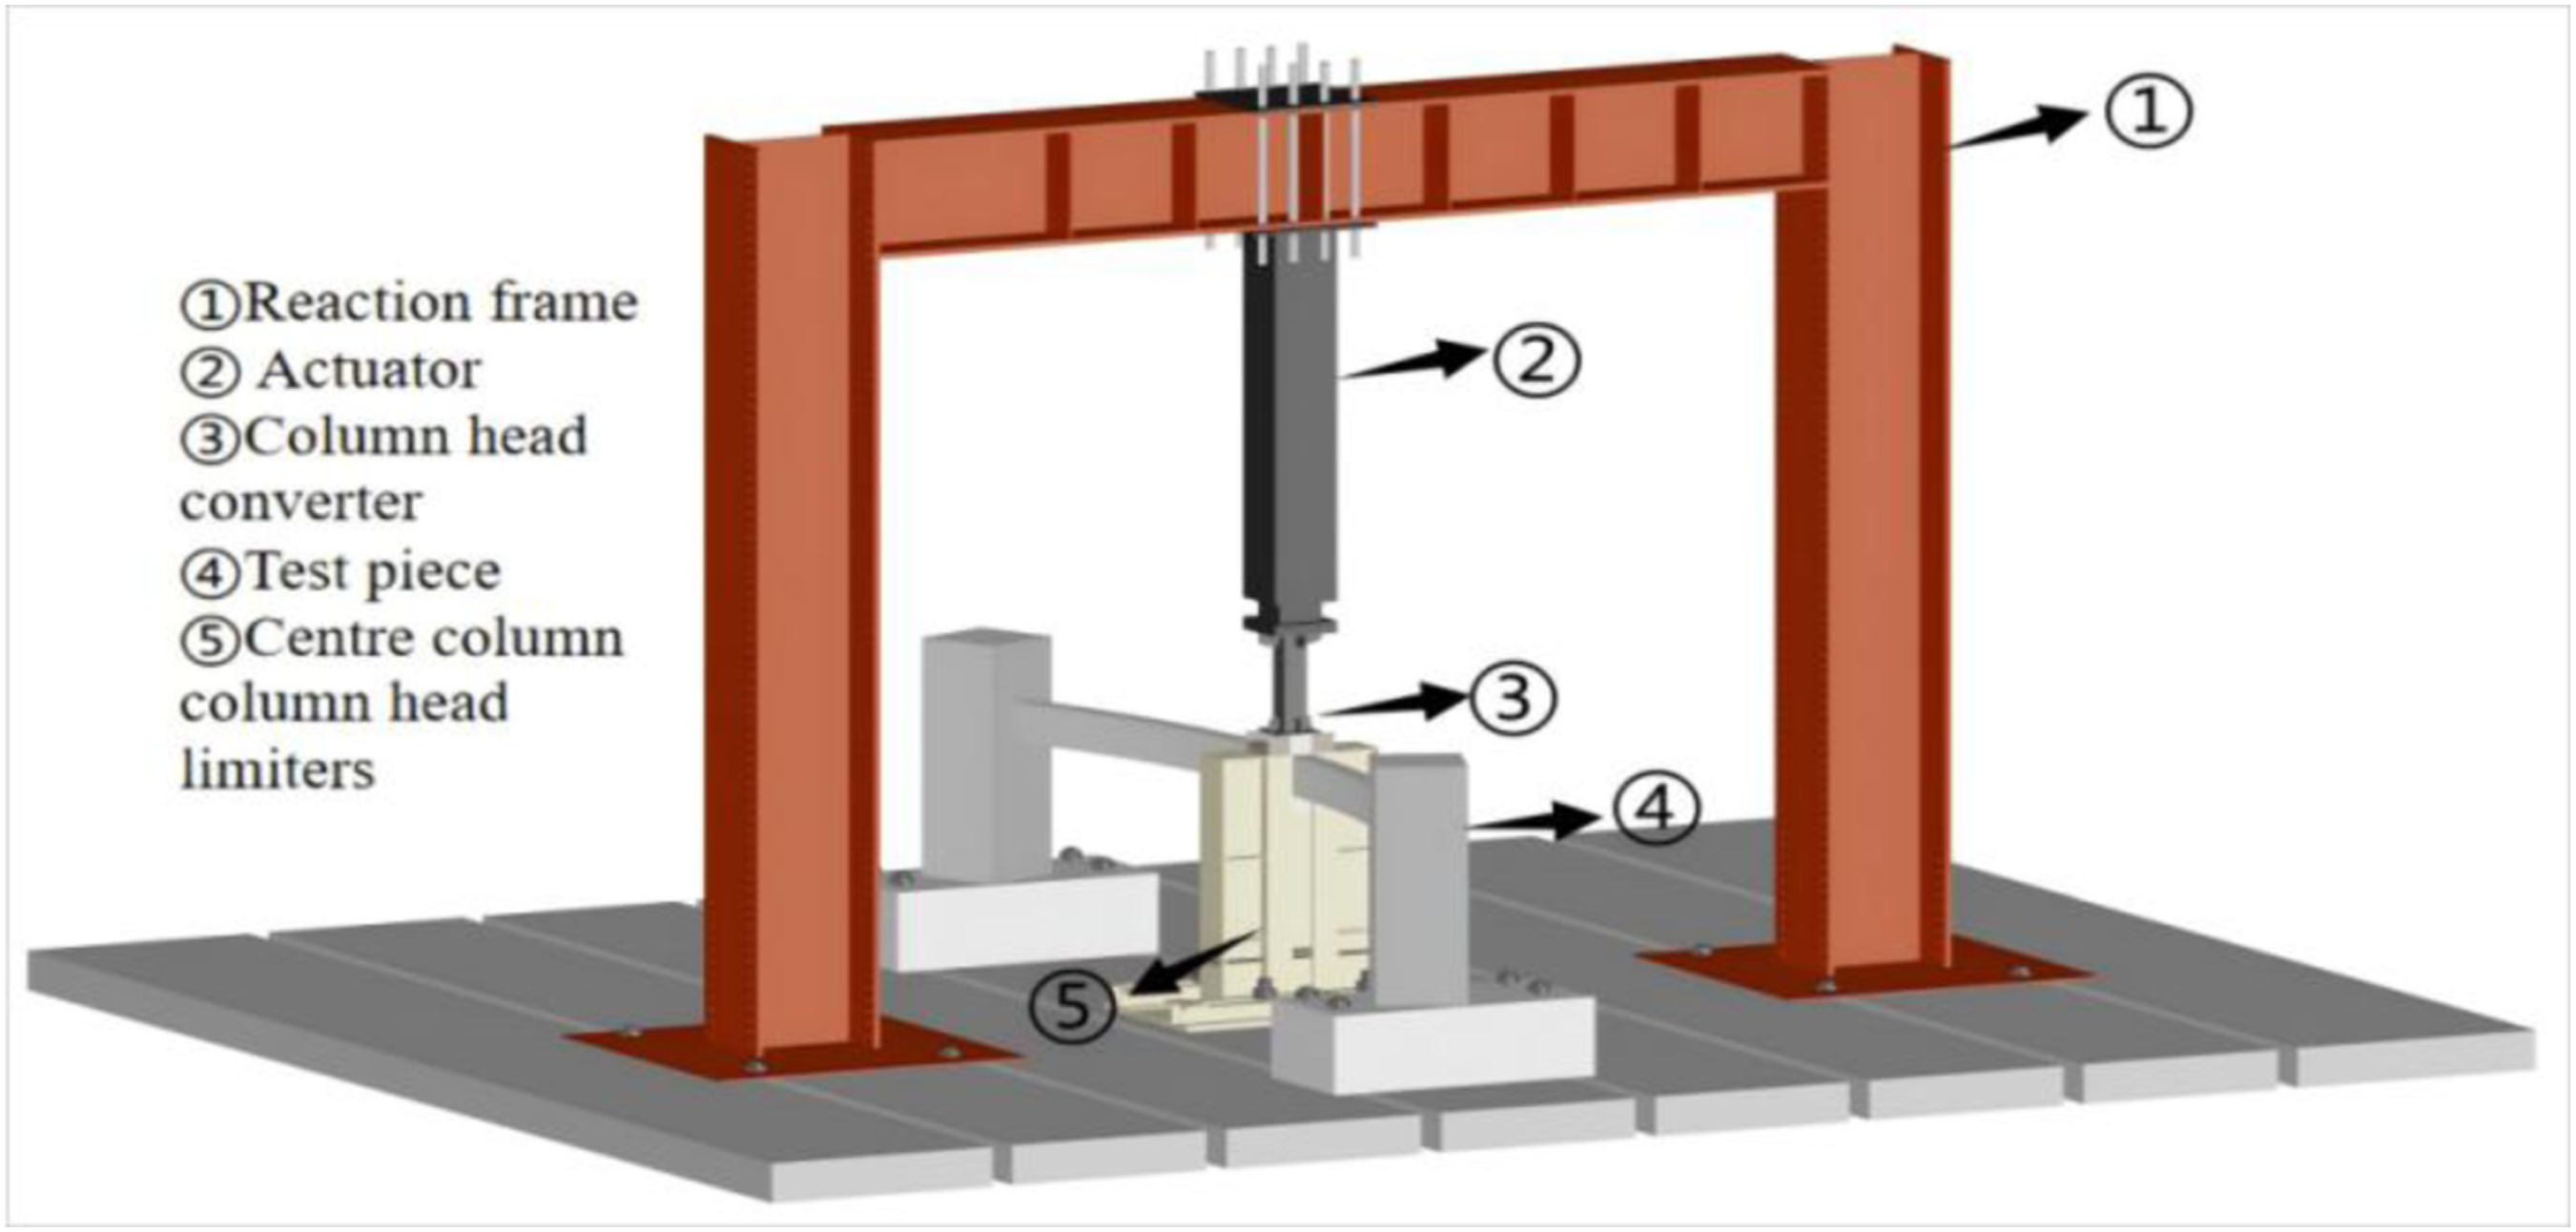
To evaluate the validity of this assumption, strain gauges (D7-W and D7-N) were installed on the outer and inner sides of the central column head (see Figure 10) to monitor the deformation of the restraint device during testing. The measured maximum deformations were 0.28 mm and 0.17 mm, respectively. These values are very small compared to the overall structural displacement, indicating that the boundary condition can be reasonably approximated as a rigid constraint, and the experimental setup can effectively simulate the restraint effect of the superstructure in actual engineering. Layout of the specimen displacement gauge.
To further quantify the stiffness of the restraint device, the structure was simplified as a cantilever system, and the equivalent flexural stiffness was evaluated based on Euler–Bernoulli beam theory and composite section theory. The restraint device consists of two symmetrically arranged welded I-shaped steel members acting compositely. Based on the sectional dimensions (220 × 110 × 12.3 × 7.5 mm), the equivalent second moment of area was calculated as 6.36e8. Accordingly, the lateral stiffness and rotational stiffness were obtained as approximately 230 kN/mm and 9.9e7kN·mm/rad, respectively. These results further confirm that the restraint device provides sufficiently high stiffness to effectively restrict both horizontal displacement and rotation of the column head.
The test setup restrained the rotation and horizontal deformation of the center column head while permitting only vertical movement, thus realistically simulating the collapse process of the curved beam. Friction was minimized by introducing a PTFE plate at the column–restraint interface, which reduced additional vertical resistance and prevented interference with the experimental results. Lateral supports were also installed to prevent unintended horizontal movement of the hydraulic jack, ensuring a stable vertical loading path.
Prior to formal loading, a preloading process was conducted to ensure proper functioning of the loading system and supports. The preloading level was kept within the elastic range to avoid inducing cracks or residual deformation.
An incremental loading protocol, combining force and displacement control in accordance with GB/T 50152-2012 (Standard for Test Methods of Concrete Structures), was adopted to simulate superstructure loads. The test began with force-controlled loading applied in 2 kN increments (approximately 10% of the estimated yield load) until reaching 90% of the theoretical peak load. After system equilibration, the protocol switched to displacement control at a rate of 10 mm per stage. Testing continued until the fracture of longitudinal reinforcement at the column top or until other specimen failure criteria were met. Data from all instruments were recorded following each loading step.
To monitor the structural response, load cells were installed behind the hydraulic jacks on the reaction frame. Linear Variable Differential Transformers (LVDTs) were positioned along the beam span to measure deformation. Inclinometers were mounted on both beam spans to capture vertical displacements and rotations. Additional LVDTs were placed at the column tops and bases to record horizontal displacements at the tops and vertical settlements at the bases. Rotation sensors were attached near critical joints on beams and columns to monitor torsional deformations. The layout of all displacement and strain measurement points is illustrated in Figure 10.
To identify critical sections, 74 strain gauges (including bonded reinforcement gauges and embedded concrete gauges) were installed on each specimen (Figure 11) to monitor strains in both steel and concrete. Configuration of strain gauges on reinforcing bars (x: section number).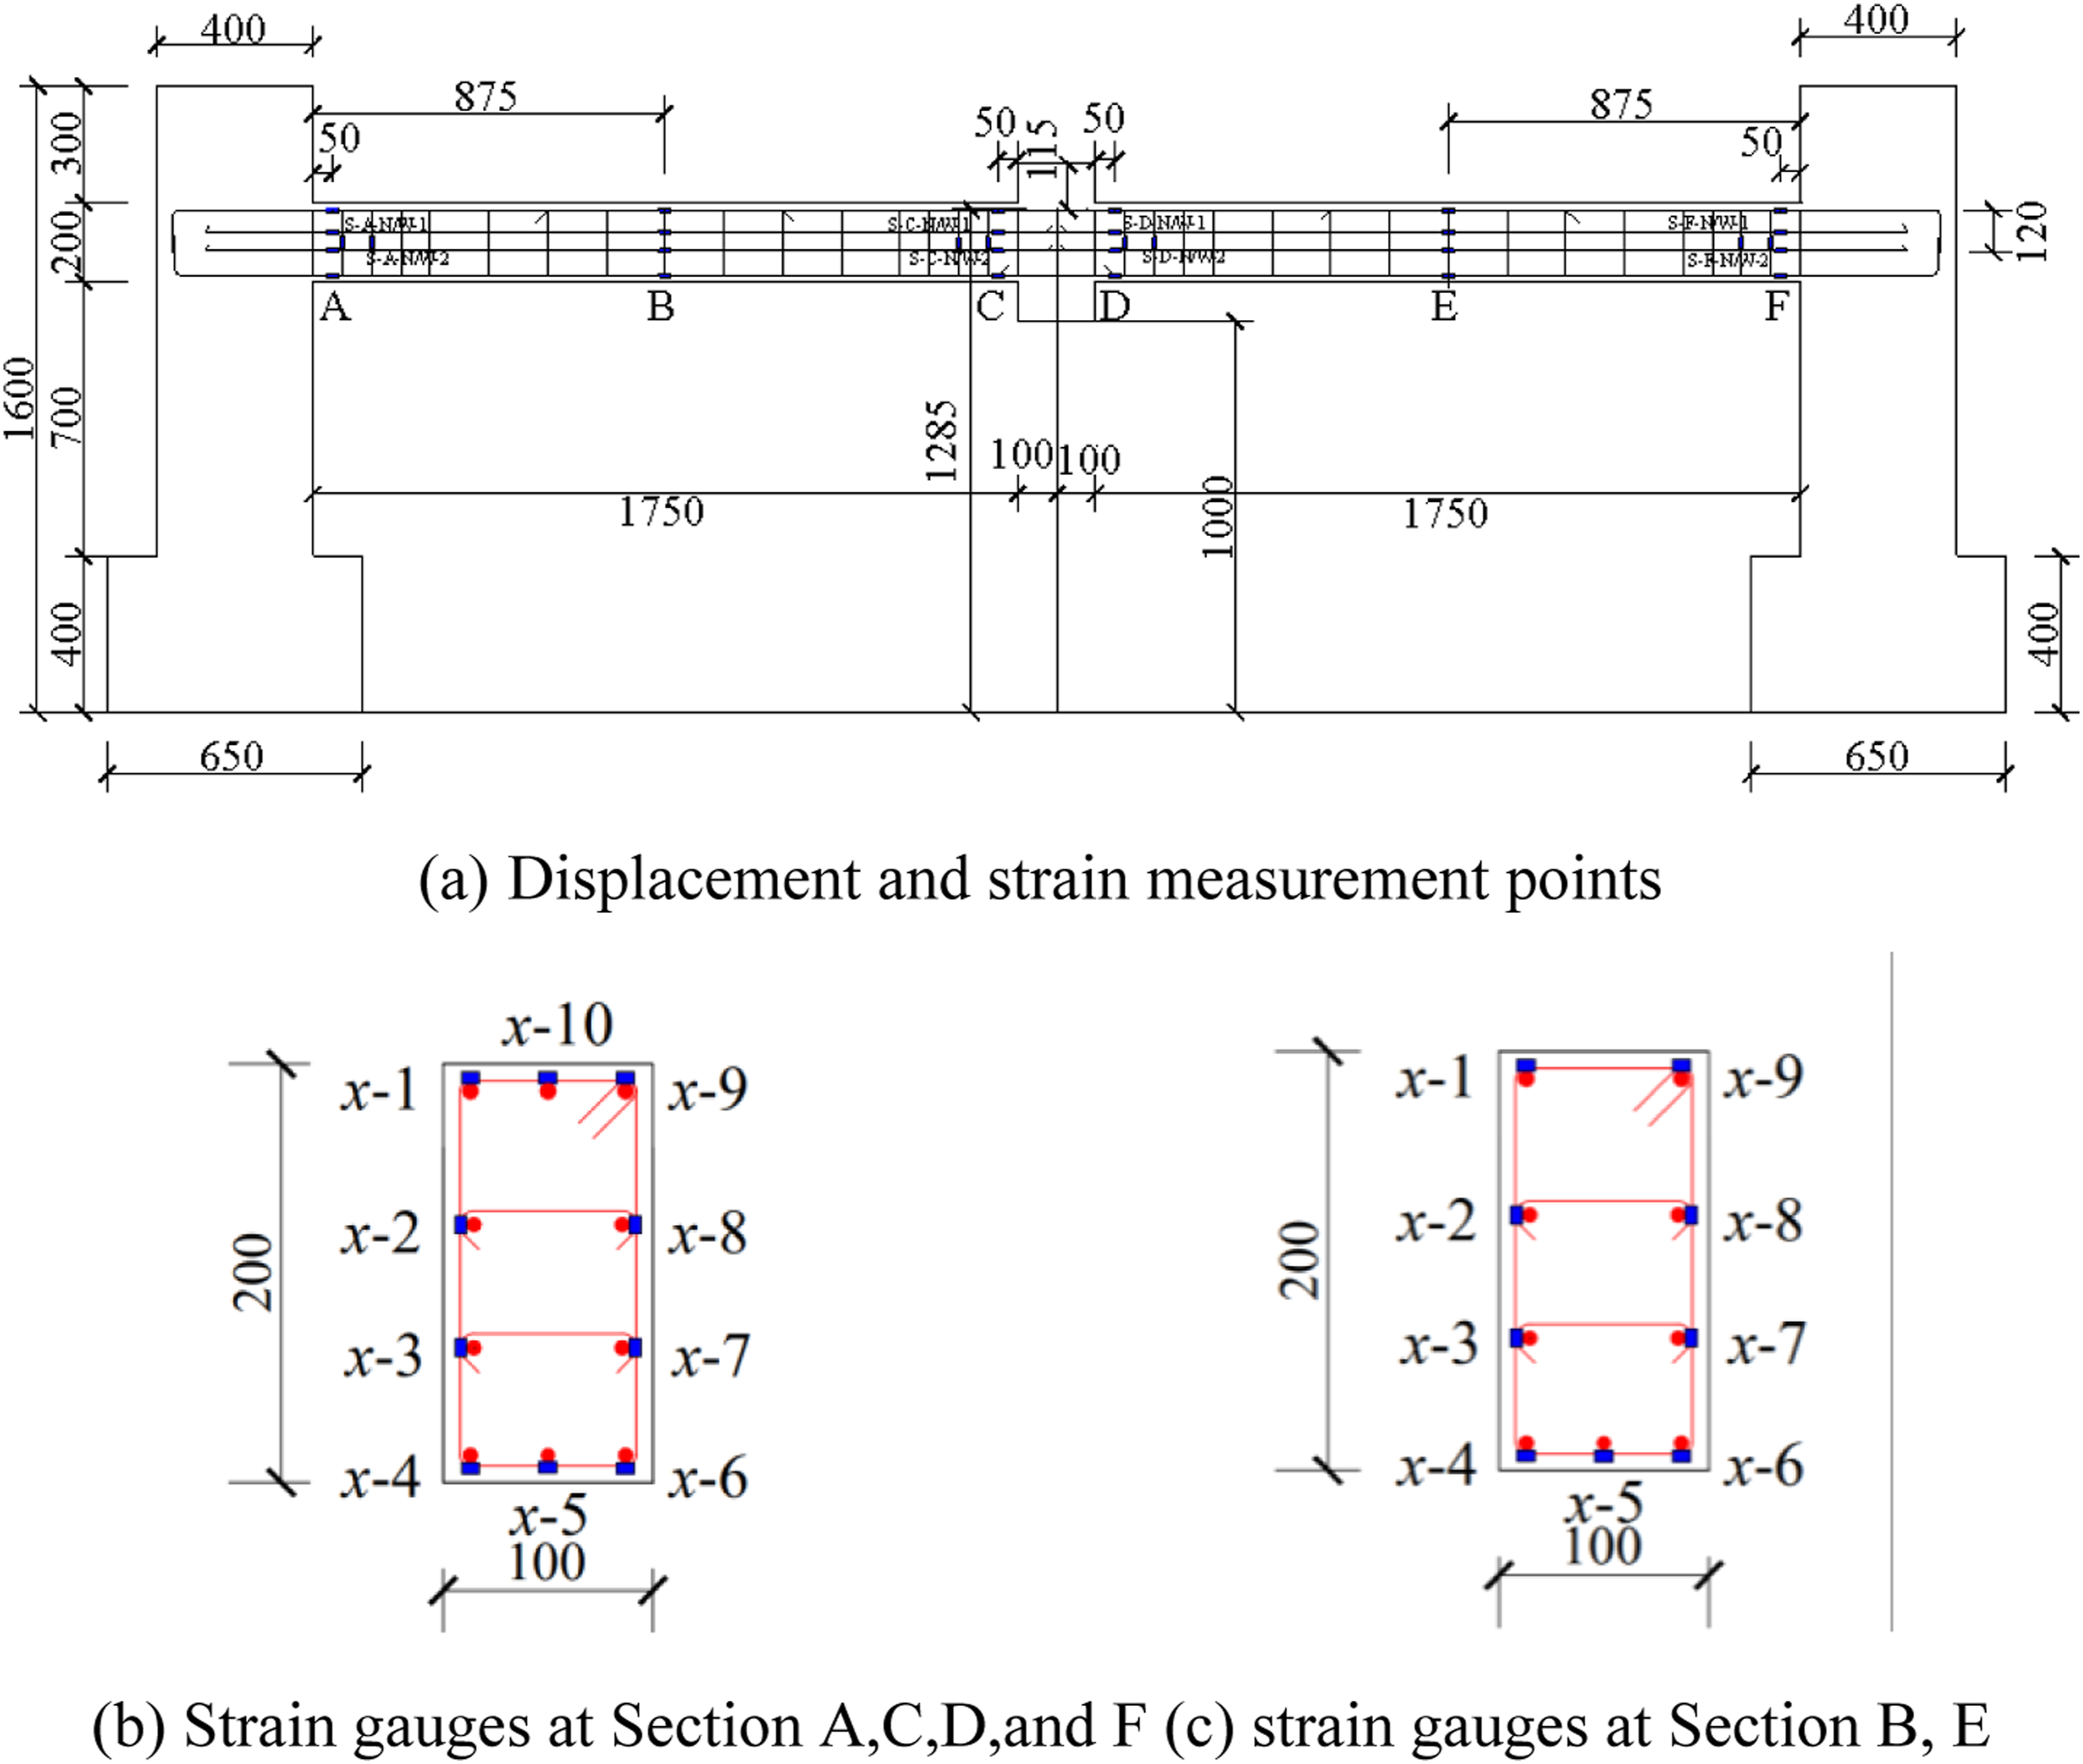
Test results
Material property tests
Measured concrete mechanical properties.
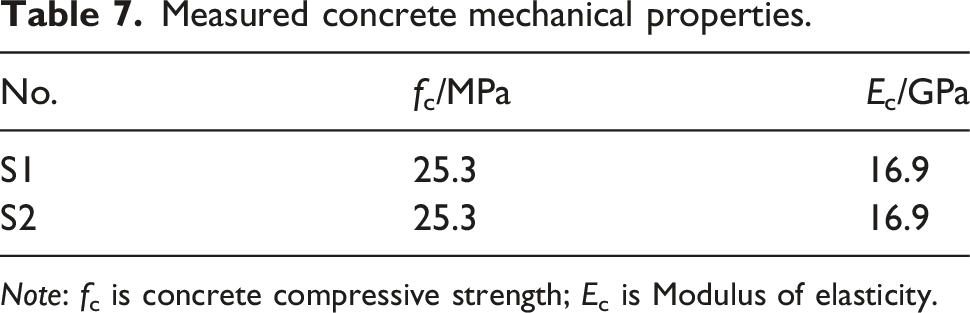
Note: fc is concrete compressive strength; Ec is Modulus of elasticity.
Measured steel reinforcement properties.
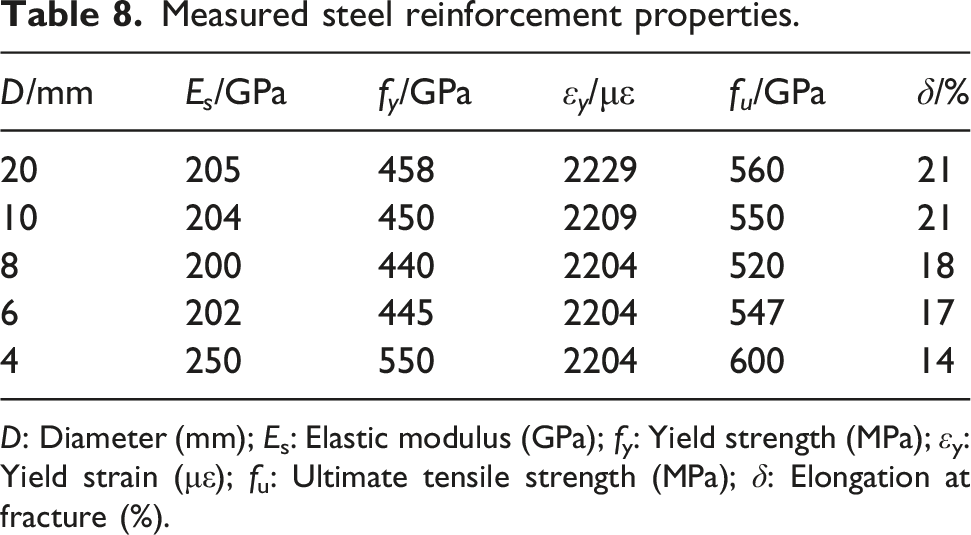
D: Diameter (mm); Es: Elastic modulus (GPa); fy: Yield strength (MPa); εy: Yield strain (με); fu: Ultimate tensile strength (MPa); δ: Elongation at fracture (%).
To ensure the reliability of the material properties, additional details of the testing procedure are provided. For concrete, six standard cube specimens (150 mm × 150 mm × 150 mm) were prepared from the same batch. Among them, three specimens were cured under standard conditions for 28 days, while the remaining three were cured under the same conditions as the structural specimens and tested after the experiment. The tests were carried out in accordance with GB/T 50081-2019.
For reinforcing steel, tensile specimens were sampled from the same batch for different bar diameters (HRB400, including 4 mm, 6 mm, 8 mm, 10 mm, and 20 mm), with three specimens for each diameter. The tensile tests were conducted according to GB/T 228.1-2021.
In addition, the loading procedures followed standard testing practices. For concrete compression tests, a loading rate of approximately 0.3 MPa/s was adopted. For steel tensile tests, a strain-controlled loading with a rate of approximately 3e-4 s-1 was applied.
To evaluate the dispersion of the test results, statistical analysis was conducted on representative material properties. For example, for the HRB400 steel bars with a diameter of 20 mm, the measured yield strength exhibited a standard deviation of 4.19 MPa and a coefficient of variation (COV) of 1.08%, indicating very low dispersion and good consistency of the test results.
The test setups for concrete compression and steel tensile tests are shown in Figure 12. Material tests.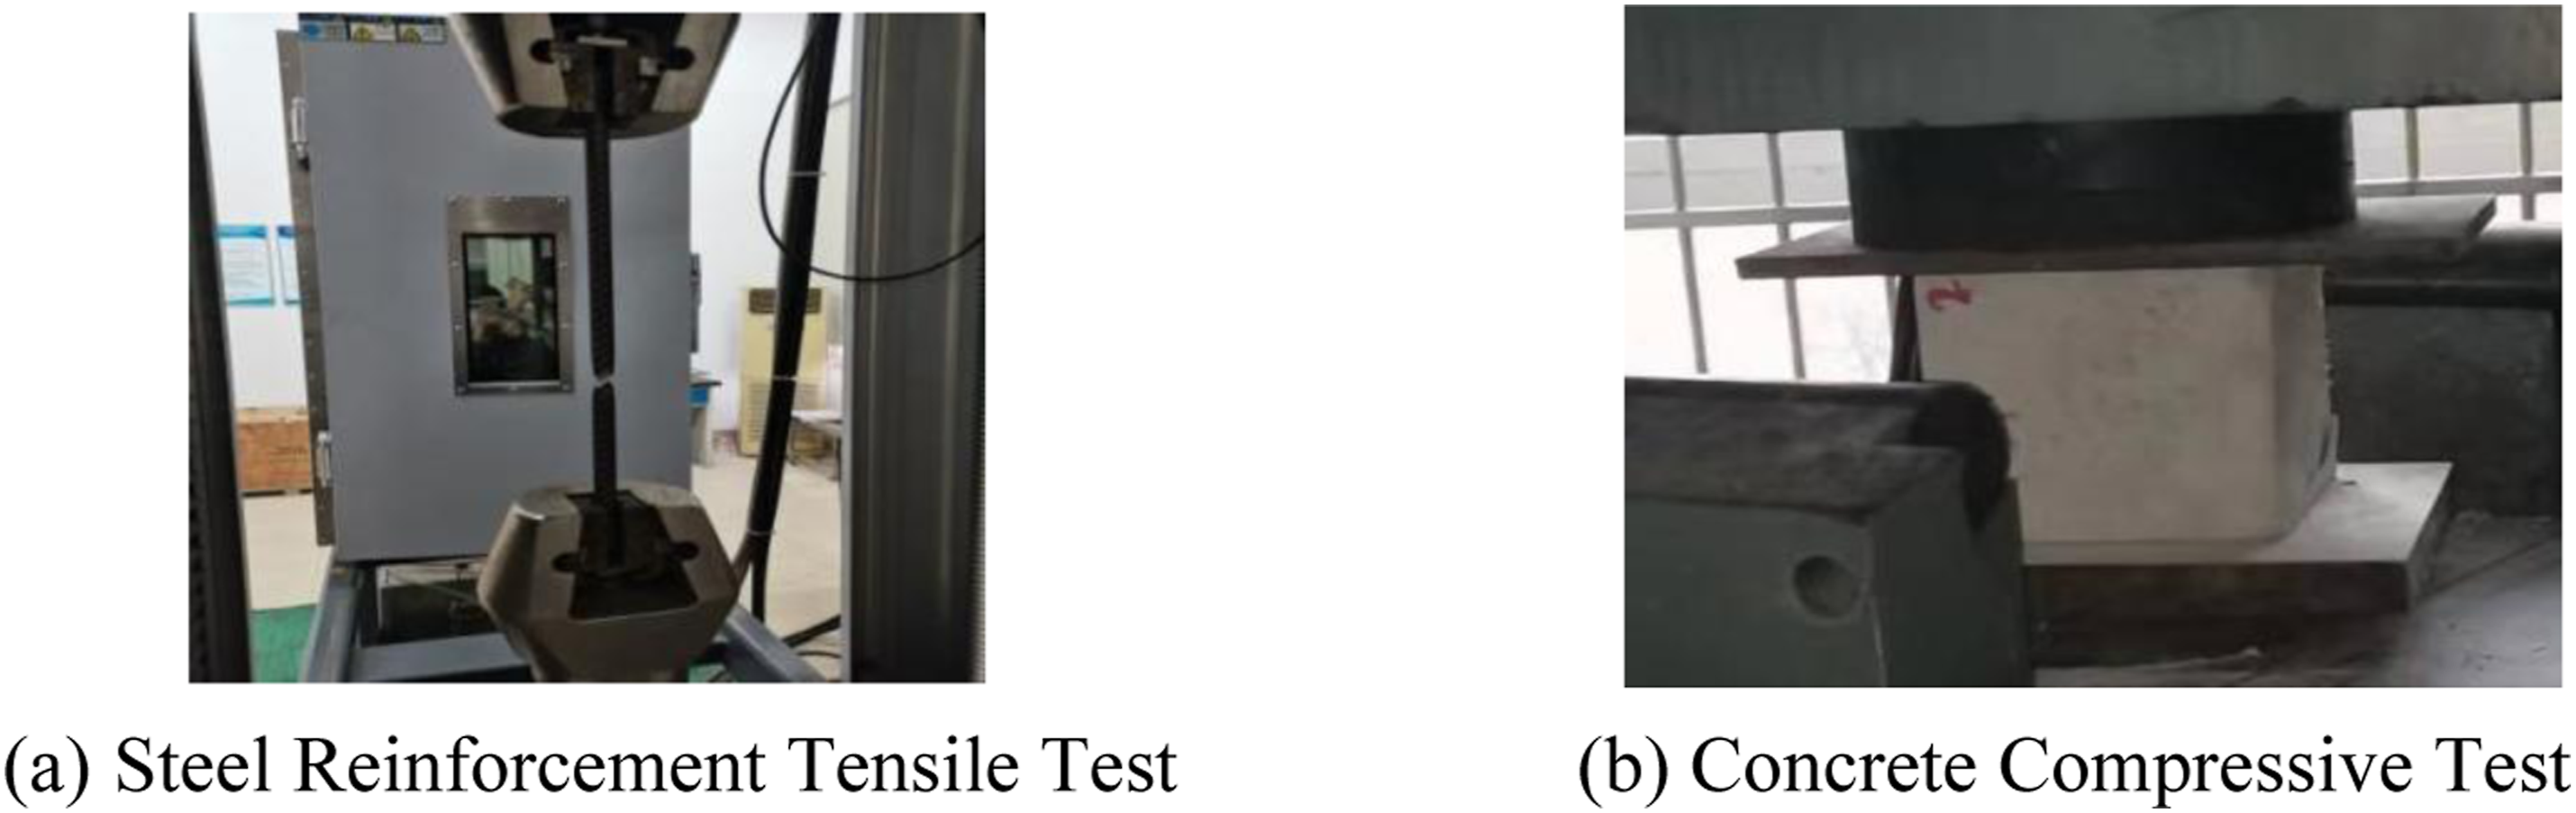
Crack distributions
Specimen S2 displayed asymmetric crack propagation between its intrados (inner curve) and extrados (outer curve). Herein, the side closer to the center of the arc is defined as the inner side, and the opposite side as the outer side (Figure 13). Initial diagram of S2 collapse test.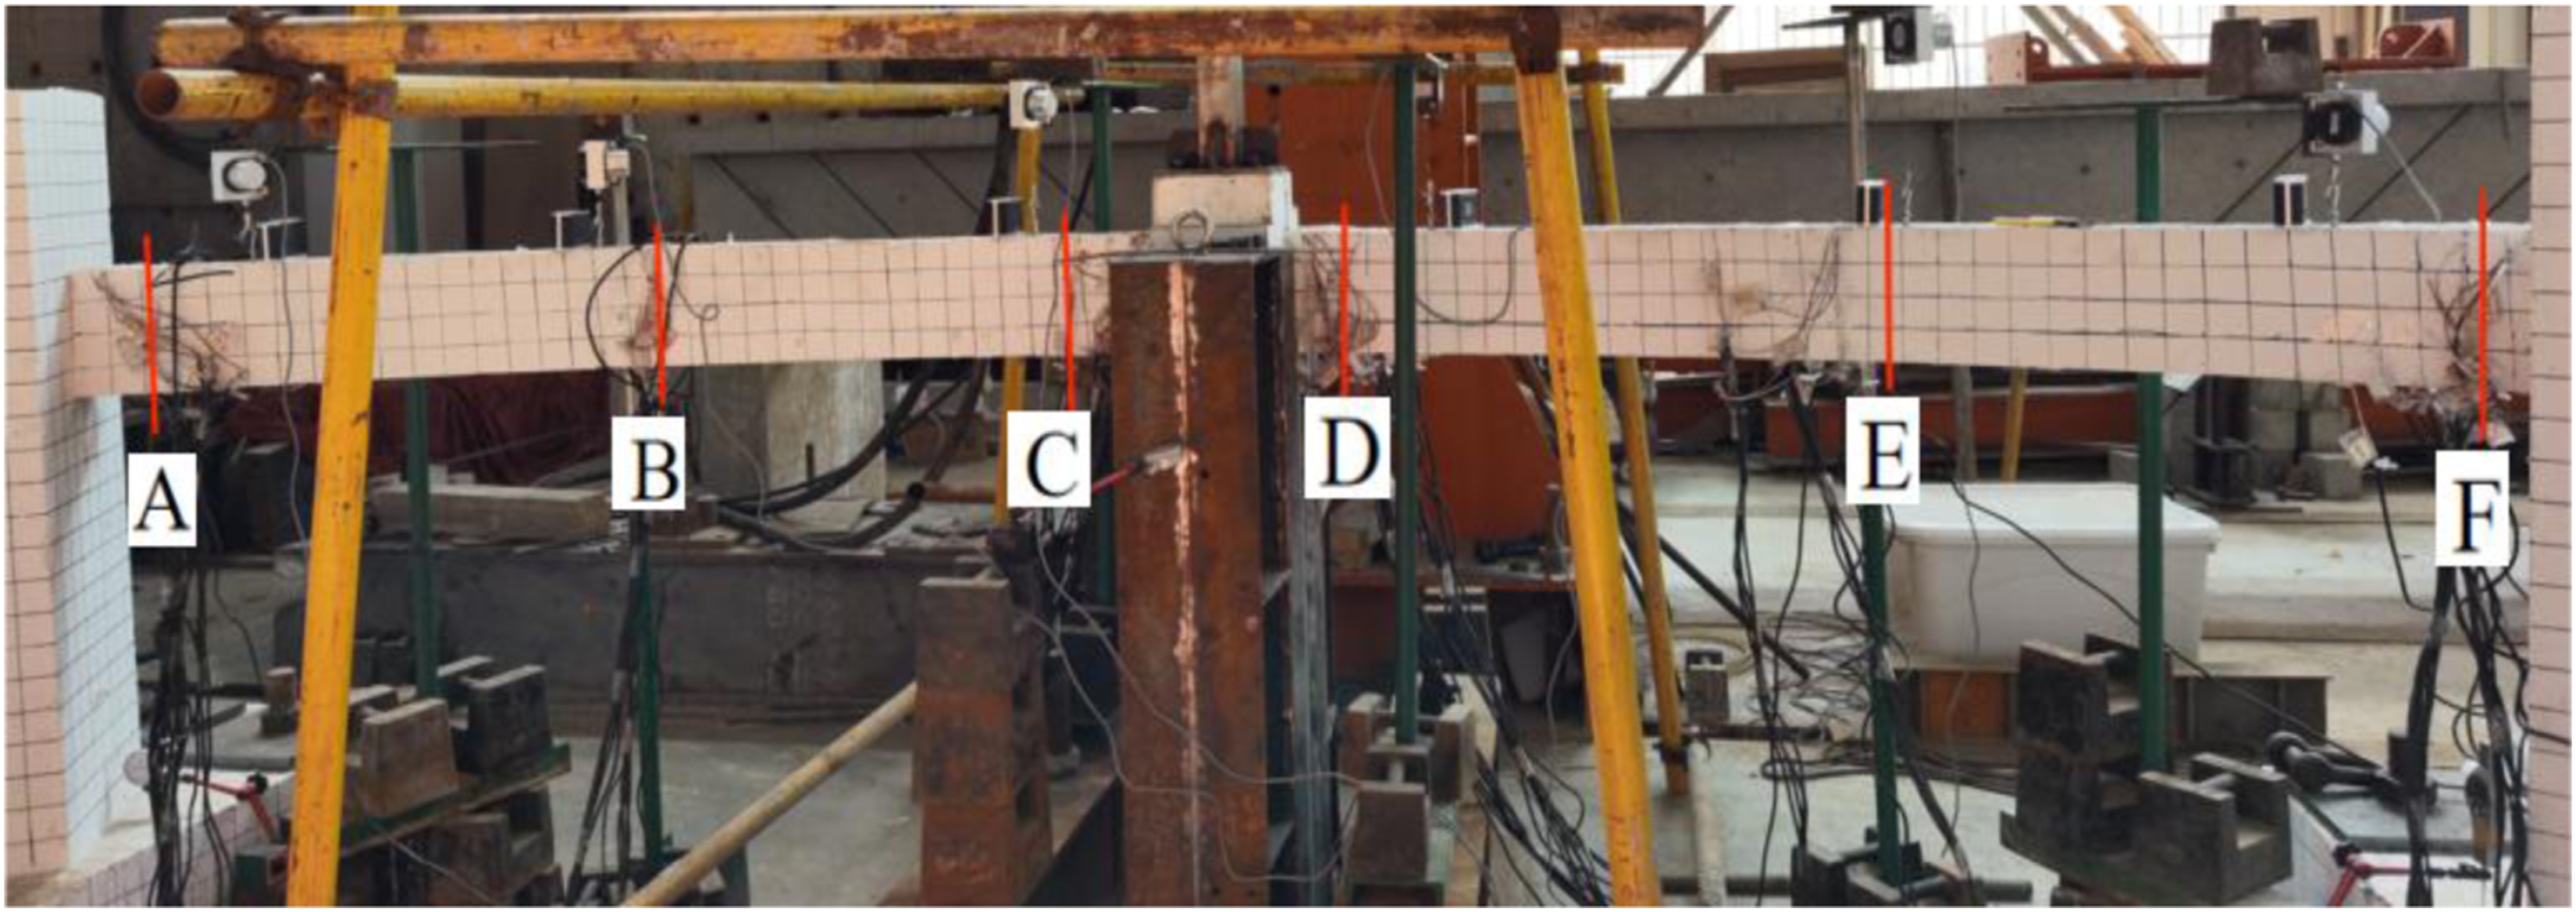
At a vertical displacement of 6 mm (Loading Stage 2), initial cracks formed at the bottom of Sections C and D, propagating upward, and at the top of Sections A and F, extending downward. When displacement increased to 15 mm (Stage 5), cracks propagated rapidly throughout the beam span. These cracks fully penetrated the cross-section, inducing diagonal cracks at the center column joint. By this stage, most outer-side cracks had fully developed. Subsequent loading primarily caused crack widening rather than new crack formation. In the early phase, inner-side cracks exhibited straight patterns with slow propagation, localized near the upper edge of beams and the lower edge adjacent to the center columns. At 27 mm, a diagonal crack initiated on the inner side and propagated rapidly across the mid-span region. During this phase, load resistance was dominated by flexural action at beam ends, resulting in prominent bending cracks. With increasing displacement, outer cracks propagated significantly faster than inner cracks, which transitioned from straight to diagonal patterns.
During the initial loading stage of S1, flexural cracks first appeared at the bottom of the beam near the center column (Sections C), and the top of the beam at the edge columns (Sections A). These regions dominated the flexural resistance of S1 at this stage. The crack distribution pattern in the right span of S1 is illustrated in Figure 14. At a displacement of 41 mm, the longitudinal rebars in both regions yielded sequentially, forming plastic hinges at the beam-column joints. Crack distribution pattern in the left span of S2 under flexural behavior.
Cracks on both sides of S1 developed symmetrically, primarily concentrated at 0.3 L from the edge columns, with minimal cracking in the mid-span region (Figure 15). Crack pattern in the right span of S1 at flexural yielding.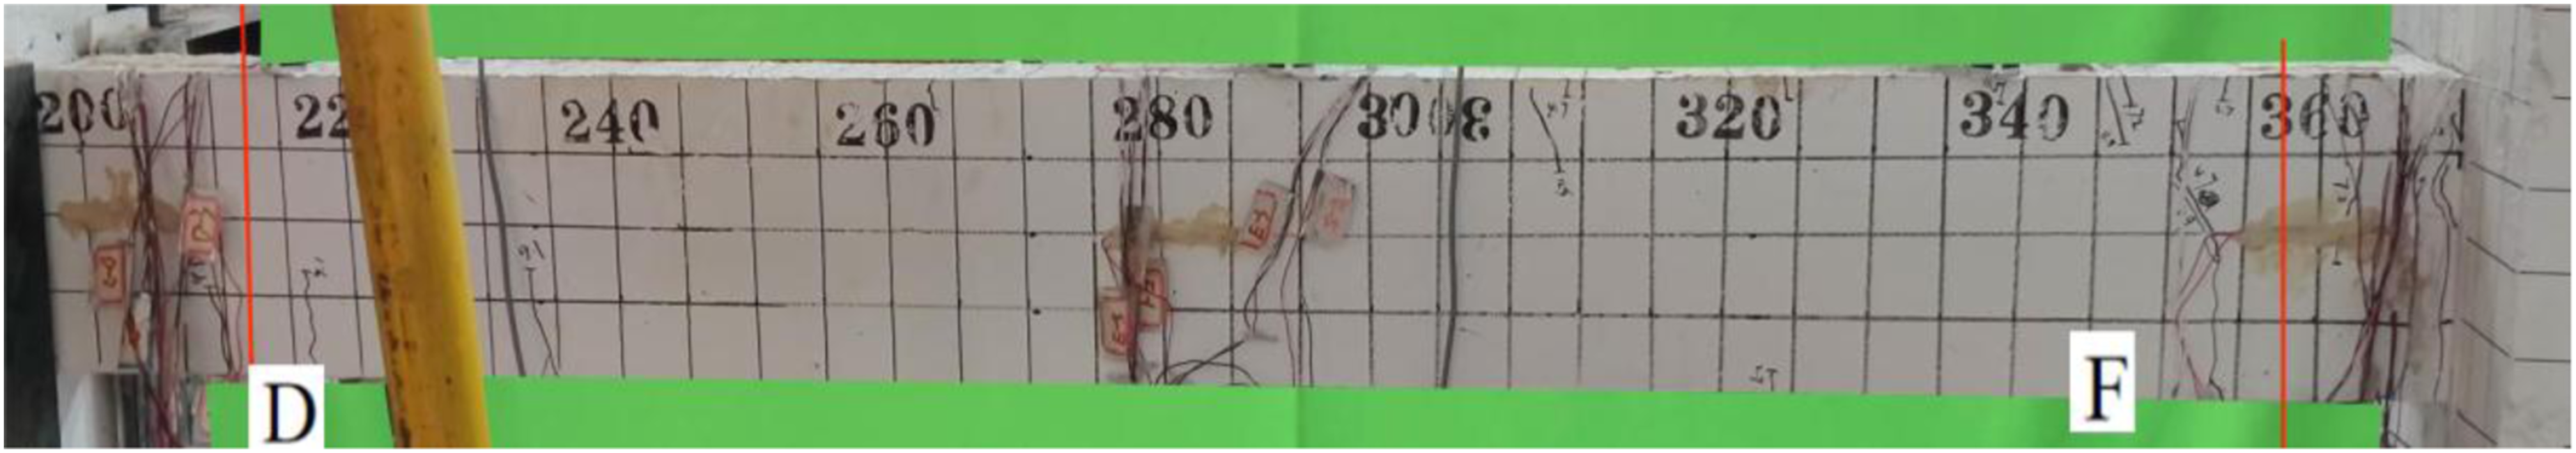
In S2, as displacement increased, crushing was observed at the lower edges of Sections A and F of the curved beam. The upper edges of the C and D sections exhibit a slight arching phenomenon. The development of cracks in the middle region of the beam had slowed, while the outer part of the curved beam no longer developed cracks. In contrast, the inner part of the curved beam near the C and D sections experienced rapid crack development. This is due to the ends of the beam at the A and F sections being subjected to negative bending moments, causing tensile damage to the upper part of the concrete and leading to downward movement of the central section. Negative bending moments at Sections A and F induced tensile damage in the upper concrete, shifting the neutral axis downward. Conversely, positive bending moments at Sections C and D caused tensile cracks in the lower concrete, resulting in an upward neutral axis shift. This results in the neutral axis appearing in the middle, with the sides arching upwards, as shown in Figure 16 below. Crack distribution in the left span of S2 at 38 mm displacement.
When the displacement reached 77 mm, a main crack formed in the C and D sections, and the bottom tensile reinforcement fractured successively. As the displacement continued to increase, it was observed that the concrete at the bottom of the A and F sections was crushed and began to fall off at 143 mm at level 28. The bottom reinforcement started to experience compression flexure, and the concrete in the upper part of the C and D sections warped. At a displacement of 198 mm, the primary crack at the beam-column interface widened, leading to detachment from the center column. And the lower girdle reinforcement was pulled off, and the concrete at the lower end of the A and F sections was crushed, beginning to fall off.
In S1, as the displacement at the center column increased, flexural cracks propagated upward from the bottom of Section A, accompanied by an upward shift of the neutral axis. Meanwhile, downward-propagating flexural cracks formed at the top of Section C, inducing a downward neutral axis shift. This led to a non-uniform neutral axis distribution, while the compression arch effect accelerated flexural crack propagation at the beam ends. Consequently, crack propagation in the mid-span region decelerated, while new flexural cracks emerged in the upper beam region at approximately 0.3 L from the edge columns. These flexural cracks subsequently evolved into diagonal shear cracks. At a column displacement of 54 mm, concrete crushing initiated at the top of sections C and the bottom of sections A. The progressive expansion of crushing zones at beam ends led to significant degradation of flexural capacity.
Comparative analysis revealed distinct crack propagation characteristics between the two specimens. In S1, crack patterns exhibited symmetrical development between the intrados and extrados. S2 displayed asymmetric crack propagation, with the outer-side cracks advancing 20–30% faster than those on the intrados (based on crack width measurements). While S1 showed crack concentration near 0.3 L from the edge columns with sparse mid-span cracking, S2 developed uniformly distributed diagonal shear cracks along the entire span (Figure 17). Crack distribution in the right span of S1 at 44 mm displacement.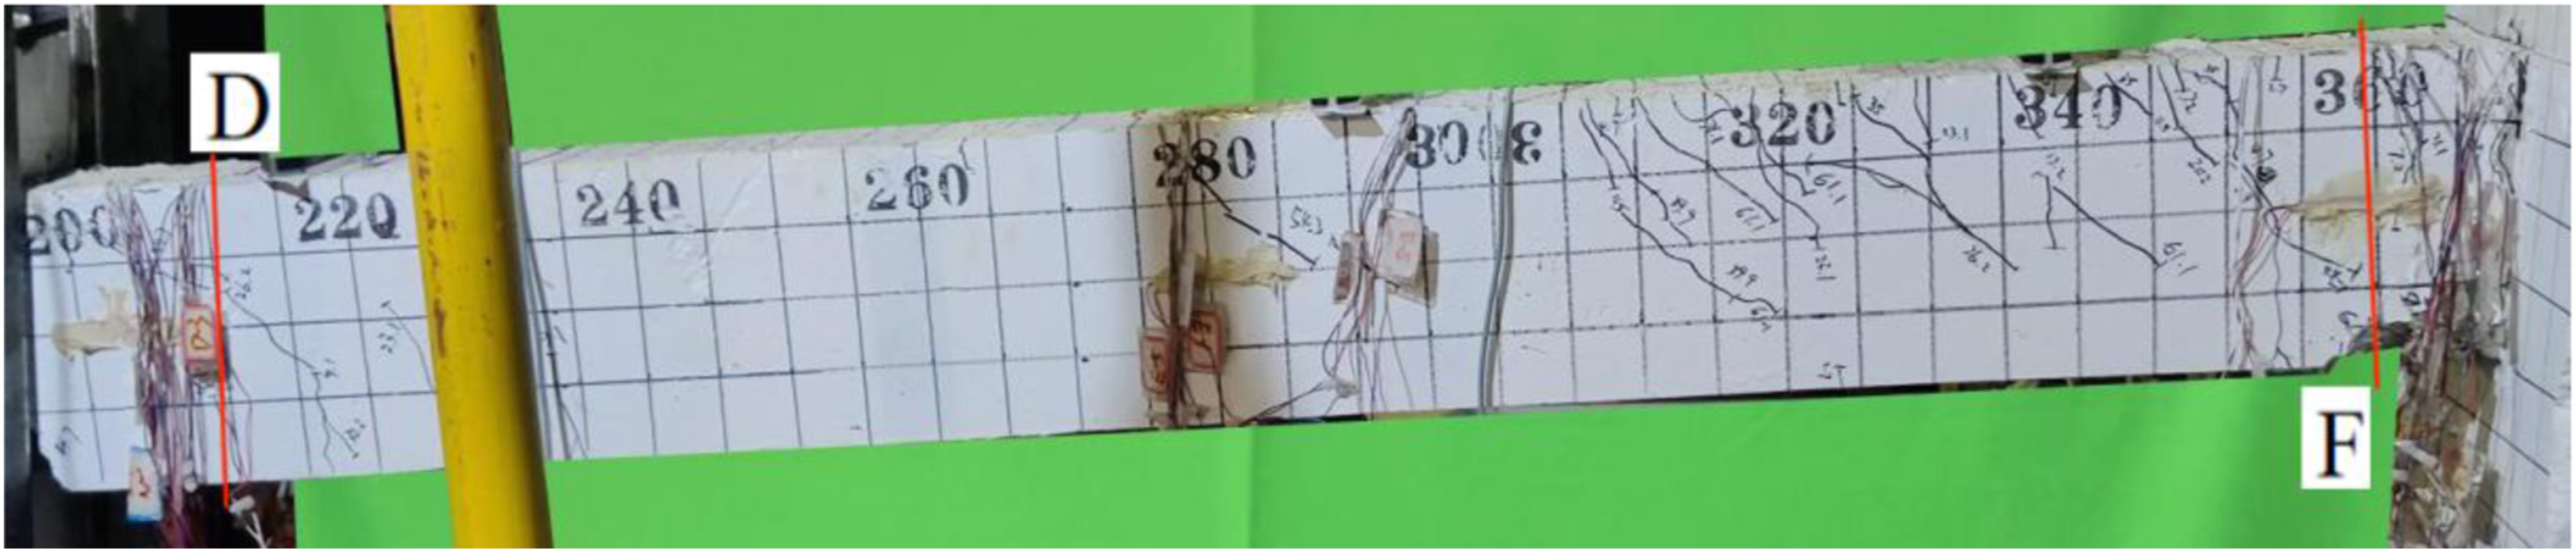
Reinforcement strain
Owing to specimen symmetry about the failed column centerline, symmetrical cross-sections exhibited identical rebar strain development trends. Each symmetrical cross-section is analysed in this section. Strain gauge numbering follows Figure 11(b), with positive (negative) values indicating tensile (compressive) strains respectively. Figure 18 presents the strain-displacement relationships for beam-end rebars of S1. Strain diagram of reinforcement in S1.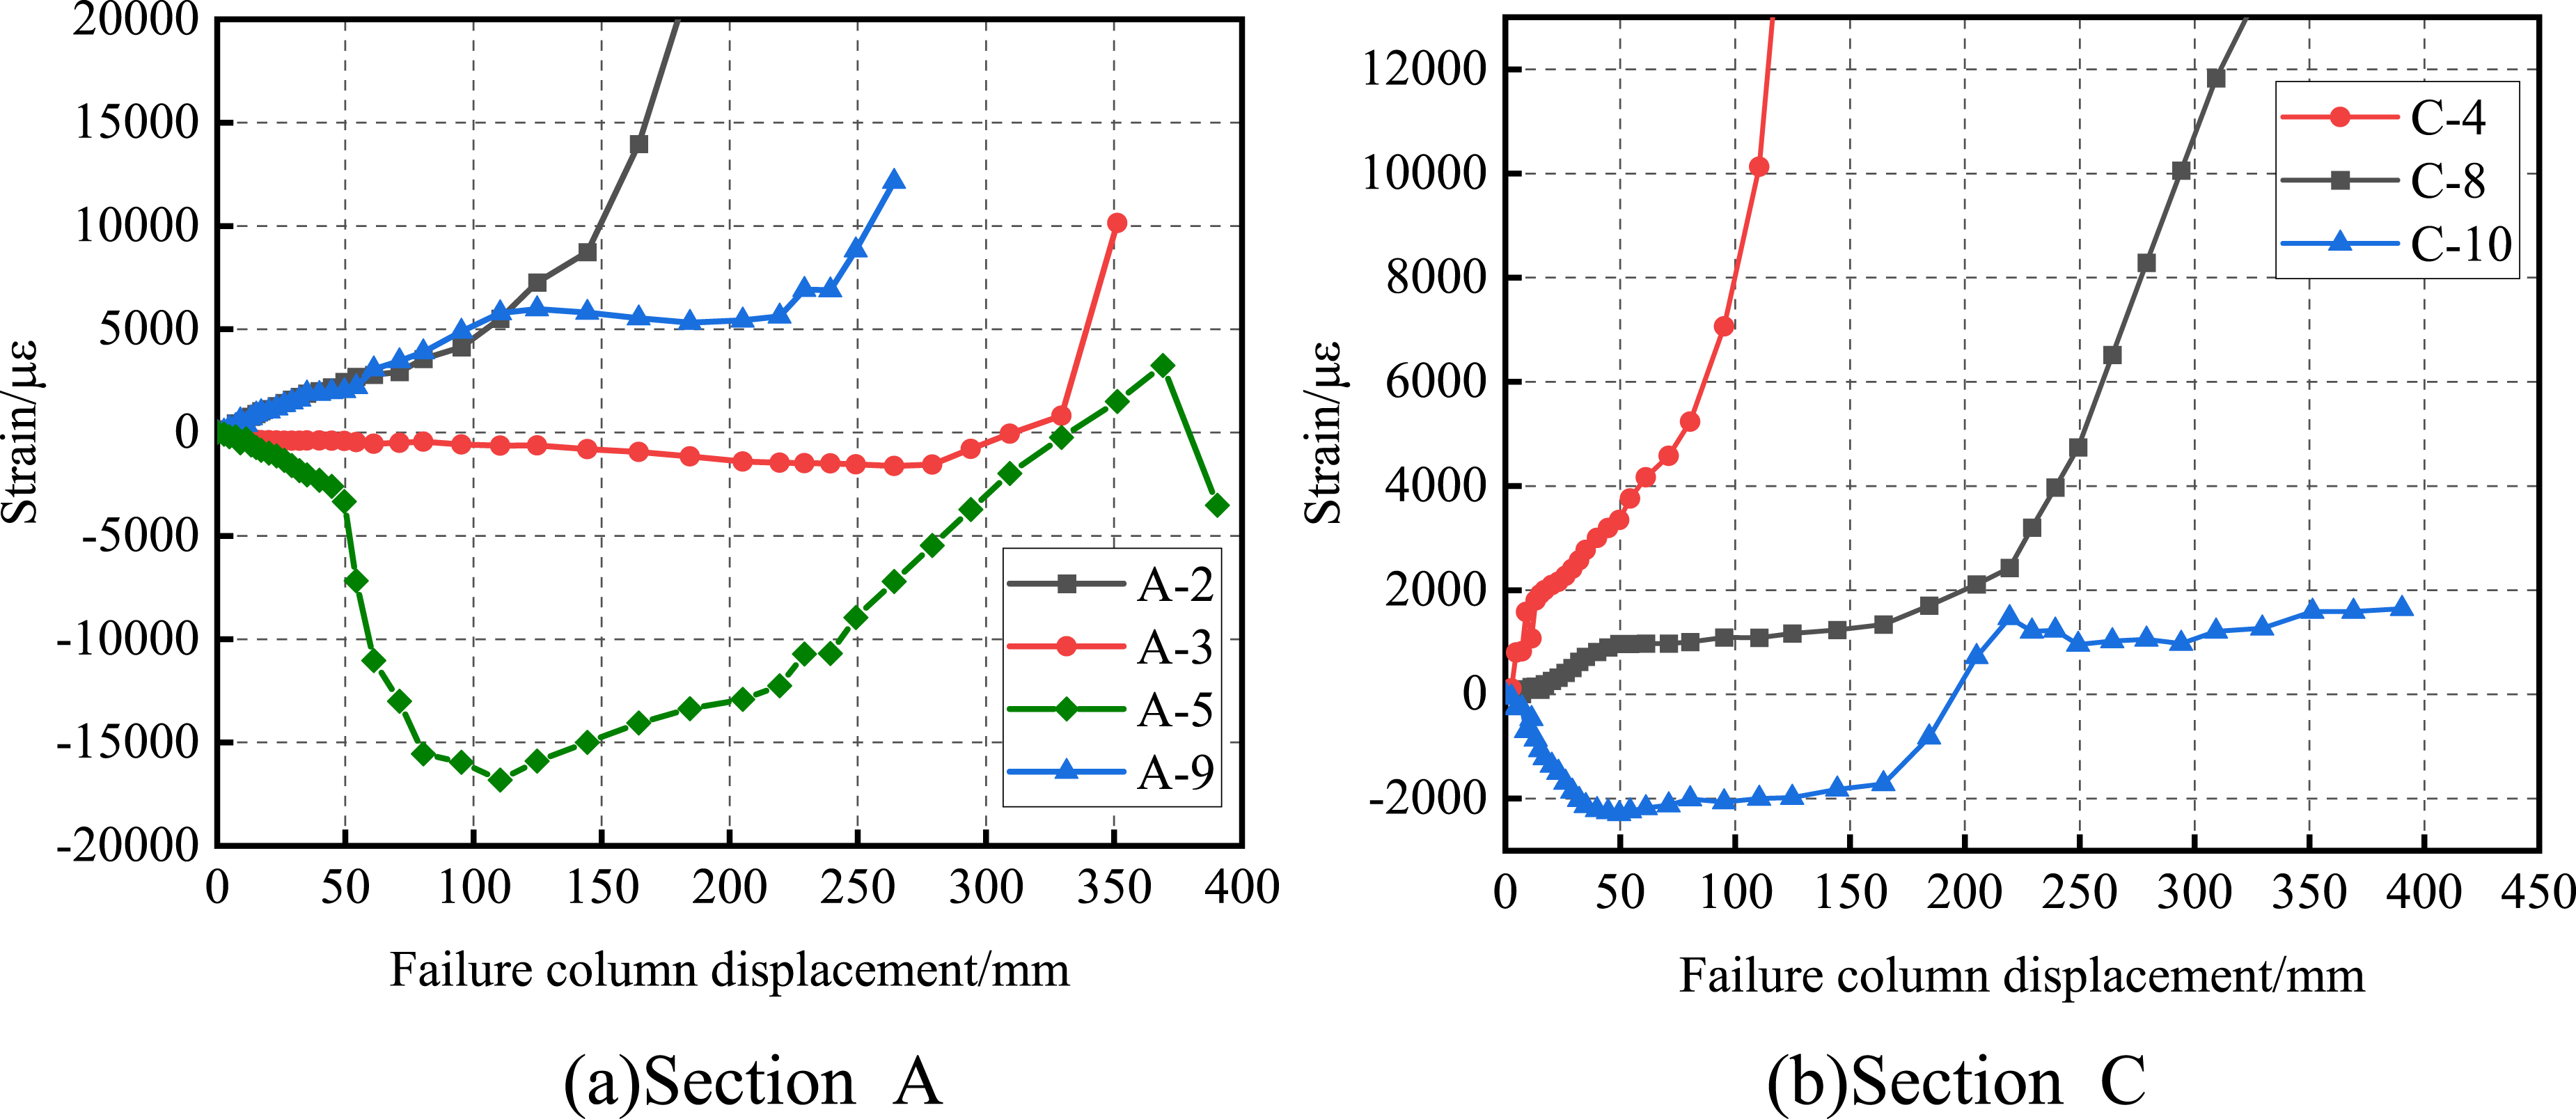
The curved beam’s cross-sectional profile (viewed radially from the arc center) defines the intrados (left) and extrados (right) sides. The strain-displacement curve of the reinforcement at the beam end of S2 is shown in Figure 19. C-section strain at the beam end of column node in S2.
The strain-displacement curves of the reinforcement bars indicate that, for the C section of the near-failure column beam end of the S2, at the beginning of loading, this section is under a negative bending moment. Its top-loaded reinforcement is compressed, while its waist and bottom longitudinal reinforcement are in tension. At equal elevations, outer rebars demonstrated 25–30% faster strain accumulation rates than intrados rebars. For the reinforcement bars at the bottom of the C section of the S1 (C-4), the bending mechanism ceases after the vertical displacement reaches approximately 20 mm, and the reinforcement bars at the bottom of the C section of the S1 (C-3) yield successively, leading to the end of the bending mechanism. Concurrently, compressive strains in rebars A-5 and C-10 increased linearly with displacement up to buckling initiation.
In S2, tensile yielding initiated at the bottom reinforcement upon loading, forming a plastic hinge at the beam end (observed at 15 mm displacement). The tensile strain at the bottom of the beam continued to increase, and after the load reached the peak point of the compression arch mechanism, the development of the girdle bar strain slowed down before continuing to increase. Top rebars maintained compressive strains throughout the monitored range, as shown in Figure 19. The rate of increase in the strain of reinforcement C-4 is significantly greater than that of reinforcement A-2 after the entry of the compression arch mechanism in the S1. The failure of the tensile zone at the bottom of the middle node occurs more rapidly than at the top of the side column node. The reinforcement strains of (C-10, A-9) both peak during the compression arch stage, after which the compressive strain begins to decrease. This is followed by a rapid increase in the strains of the top girders at the beam end section of the side columns (A-2) and the lower girders at the beam end section of the middle columns. The carrying capacity then entered an ascending phase. As the bottom girders of the beam end of the middle node pull off and cracks developed in the compression zone, the compressive strains of the reinforcement bars (C-10) decreased rapidly and transitioned to tensile strains. Due to the low degree of concrete crushing in section A, the compressive strain of reinforcement (A-5) remained in a pressured state, despite decreasing, and finally changed to tensile strain around a displacement of 320 mm.
The strain gauge measurements revealed significant torque-induced asymmetries in S2, contrasting with the symmetric strain distribution in S1 (Figures 18 and 19). Outer arc rebars exhibited faster strain accumulation rates than inner arc rebars at equivalent elevations, demonstrating torque-induced section warping. It can be observed that during the loading process, due to the influence of the torque of S2, the neutral axis of each section did not maintain a horizontal state. The stress development in the reinforcement on the same horizontal plane was non-uniform, the outer reinforcement of the beam yielded first. The reinforcement at the bottom of the beam end in the side columns did not develop tensile stress and thus never reached a fully tensile state across the section.
Comparison of beam rotation-displacement relationships
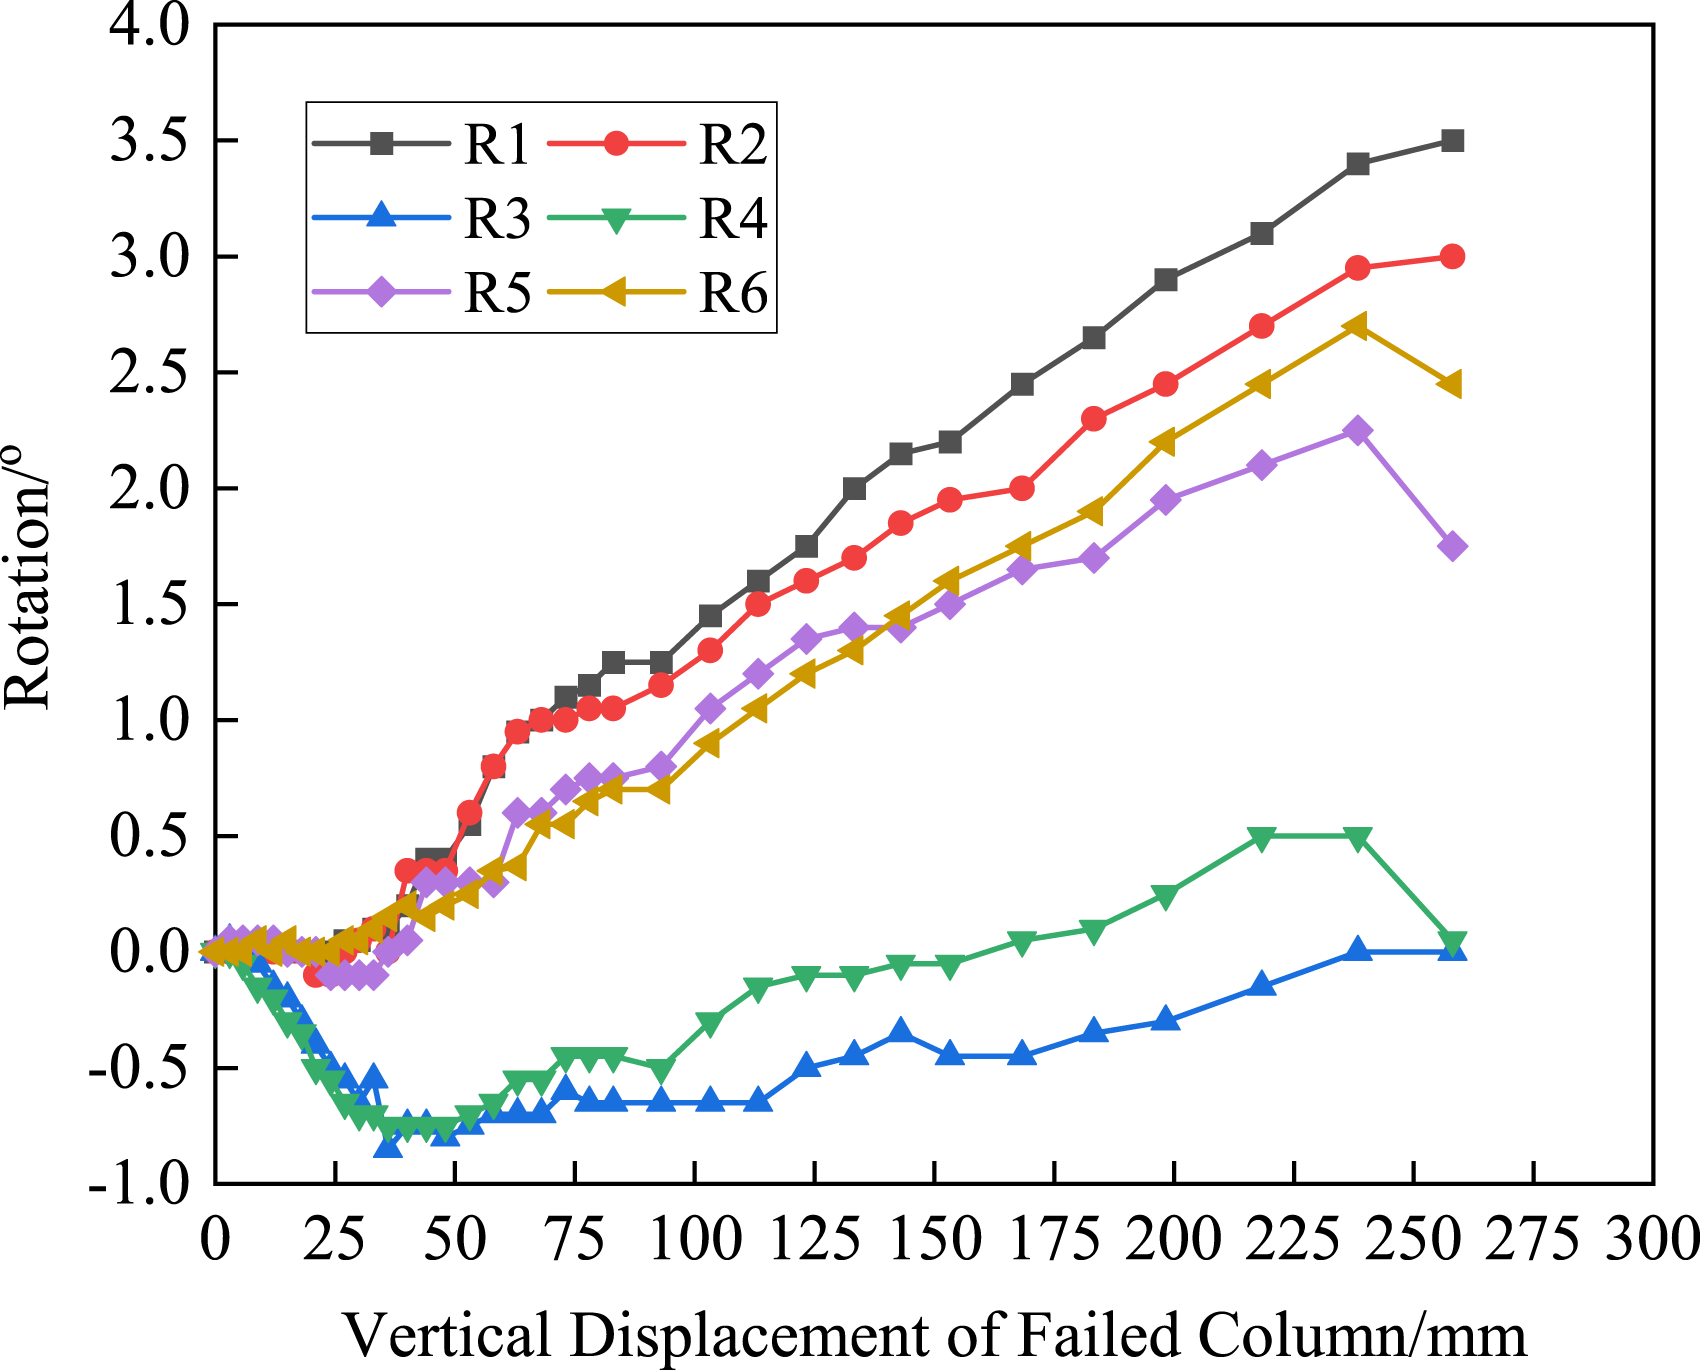
The rotation variations for Specimens S2 and S1 are depicted in Figures 20 and 21, respectively. For S2, the rotation increased towards the edge column, reaching a maximum value of approximately 3.6° at location R1. In contrast, at the measurement points near the center column (R3 and R4), the rotation initially developed in the negative direction. This was followed by a reversal, a behavior attributed to the restraint imposed on both the rotation and horizontal displacement of the center column head. For S1, the rotation increased towards the center column, with a maximum value of about 1.2° observed at R4, near the center column. No negative rotation was observed during the loading process. Following the fracture of the bottom tensile longitudinal rebar, the rotations at points R3 and R4 near the center column ceased to increase with further vertical displacement of the failed column. Rotation angle variation of S1. Rotation angle variation of S2.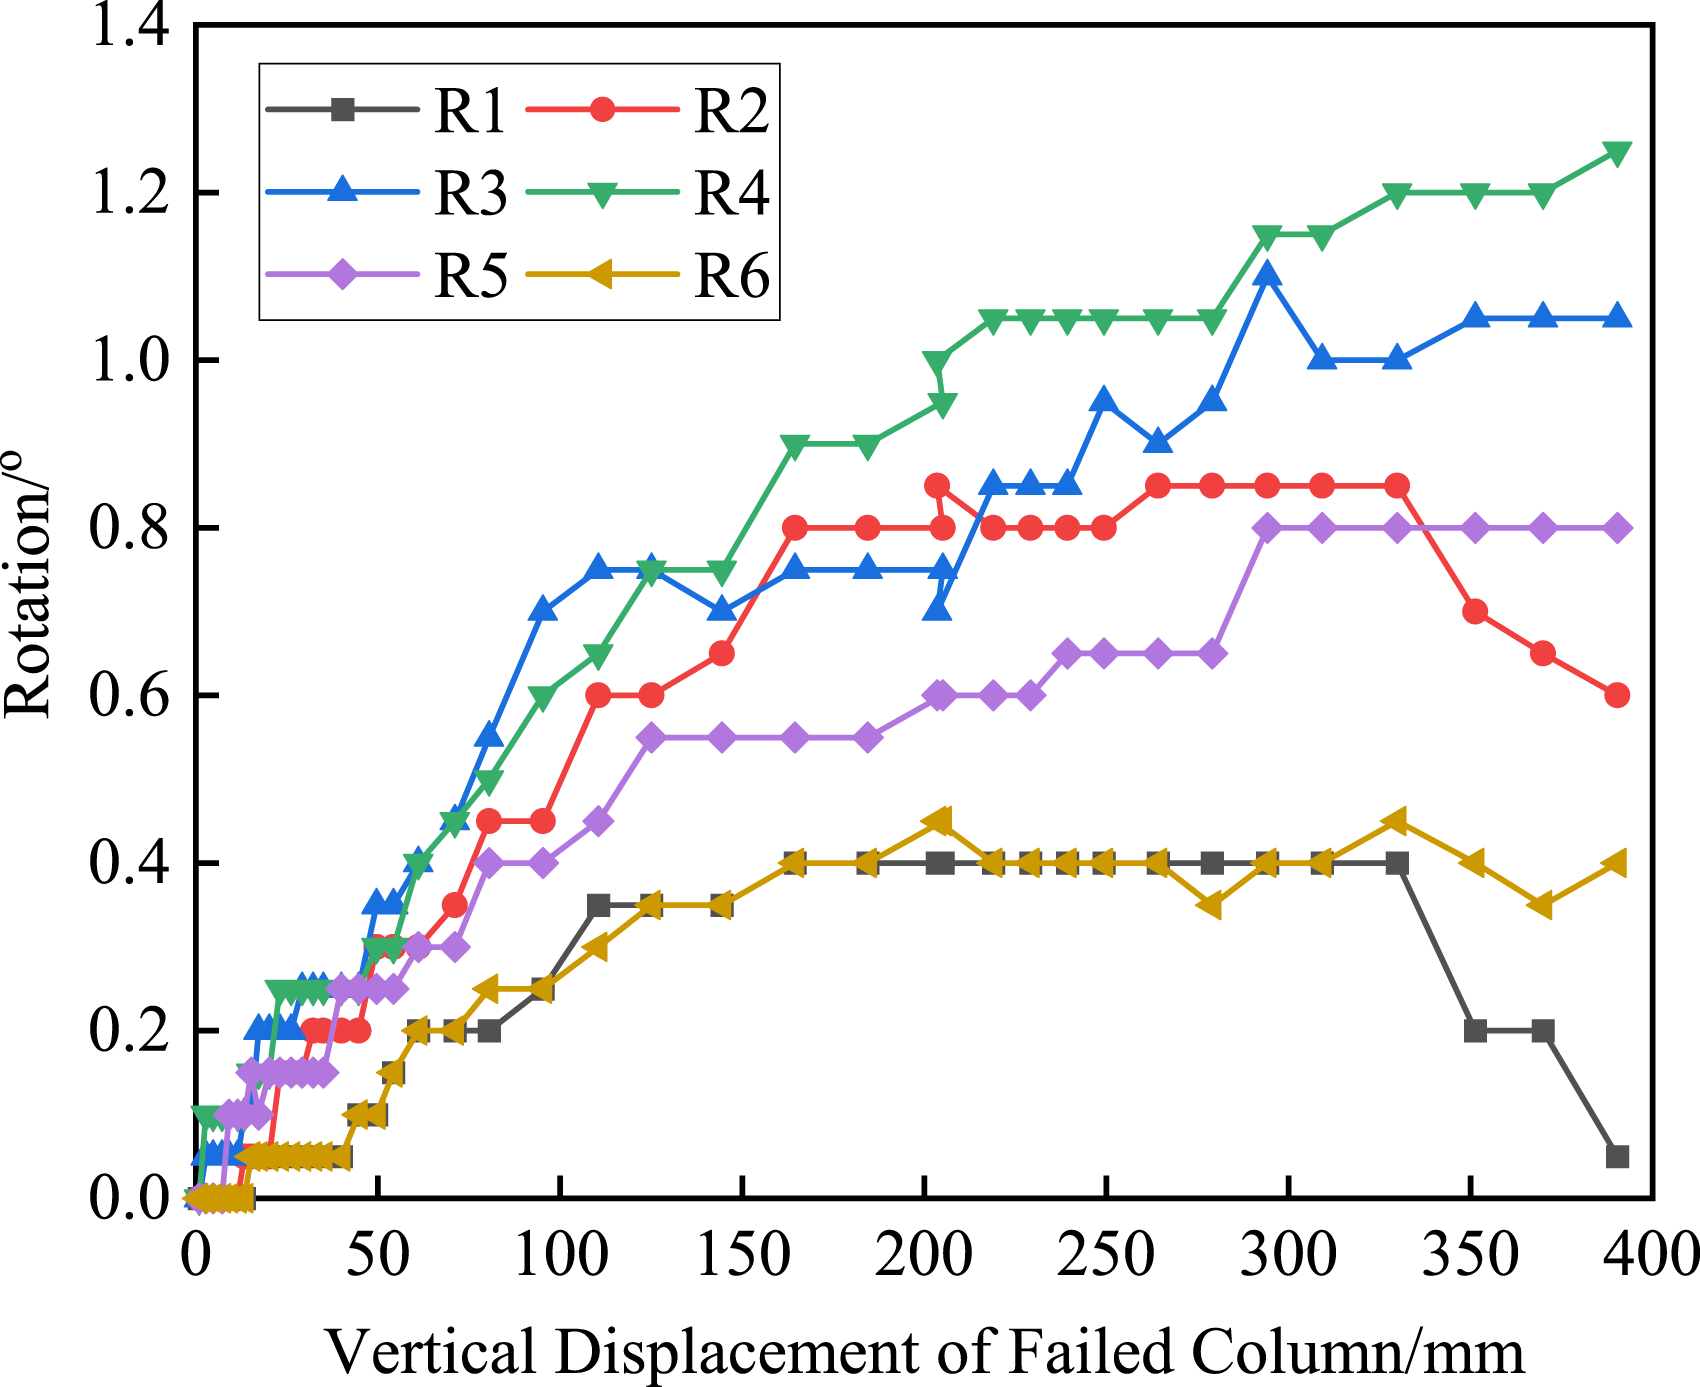
Failure modes of specimens
In S1, with increasing displacement at the failed center column, the lower transverse reinforcement in Sections C and D underwent sequential fracture. The cracks in the mid-span region of the beam progressed slowly. Further loading caused concrete crushing at one-third span from the side columns, accompanied by anchorage failure of the top intermediate longitudinal reinforcement, with 90° hooks pulling out from the concrete (Figure 22). At 278 mm displacement, the top longitudinal rebars in Sections A and F fractured sequentially. The test was terminated at 395 mm displacement following fracture of three bottom longitudinal rebars in Section A, defining the ultimate failure state. Pullout failure of midspan reinforcement in the left-span girder of S1.
Both spans of S1 exhibited similar damage patterns, as illustrated for the right span in Figure 23. Cracks concentrated near the end sections at one-third span were primarily flexural. The D-section exhibited concrete crushing at the top and spalling (>5 mm) at the bottom and middle joint (Figure 23). All top longitudinal bars fractured, and the F-section experienced spalling at the top, crushing at the bottom, and fracture of all longitudinal reinforcement. Failure mode of the right-span beam of S1.
In S2, with increasing displacement, the top outer longitudinal rebar in Section F fractured first. Loading proceeded until the curved beam-column substructure attained its ultimate failure state at 258 mm vertical displacement (Figure 24). In section A, all bottom longitudinal bars buckled in compression, accompanied by concrete crushing. The top inner and outer longitudinal bars, along with the upper outer stirrup, fractured. Section C exhibited concrete crushing at the top and spalling at the bottom, with fracture of all bottom longitudinal bars and stirrups. Section D developed compression cracks (without crushing) at the top, while experiencing severe spalling and rebar fracture at the bottom, including all longitudinal bars and stirrups. In section F, all three bottom bars were compression flexed, and the concrete was crushed, and the top inner and outer longitudinal bars and the outer upper waist bar were pulled off. Failure modes of S2.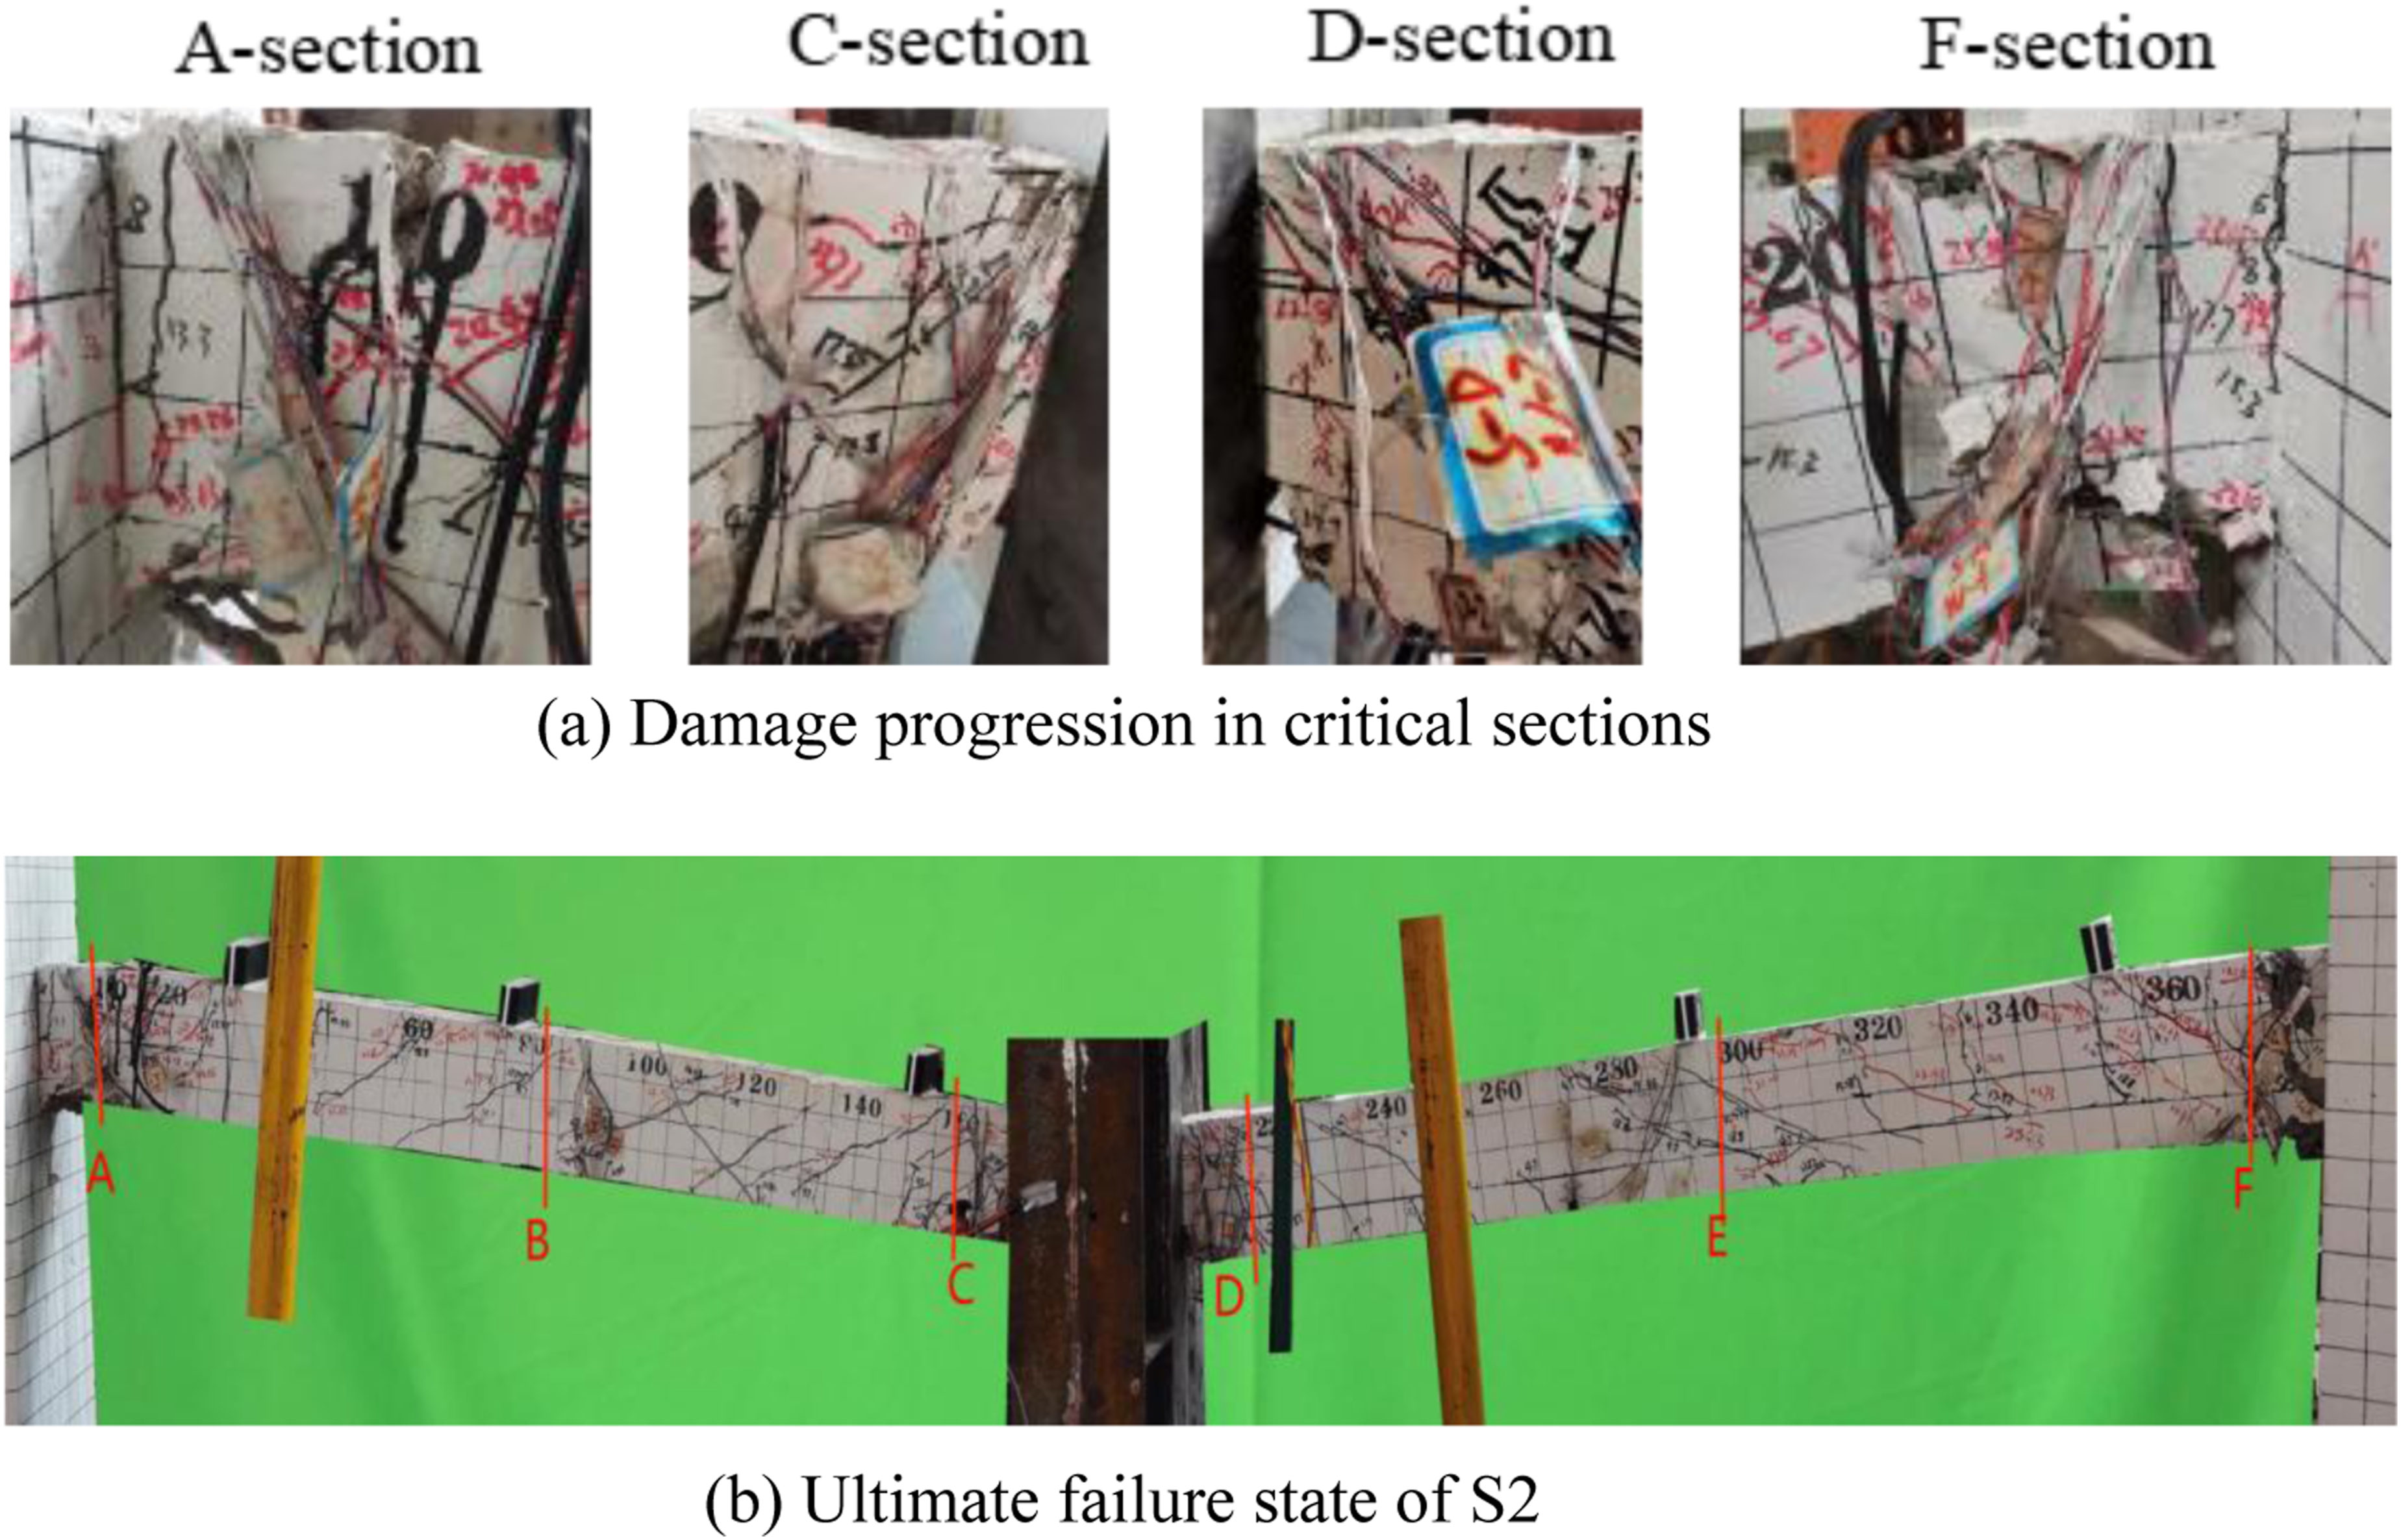
The fracture displacements of the reinforcement in each critical section of S2 were smaller than those of S1, and there was no anchorage failure of the central tensile reinforcement at the top of the beam span, where the allocation of reinforcement was reduced.
The resistance mechanism of S2 evolves through several distinct phases. Initially, cracks develop in the concrete tensile zone at the beam end. Subsequently, the longitudinal reinforcement at the bottom of the failed column’s beam-end section and the top reinforcement of the side column’s beam-end section yield sequentially, marking the completion of the flexural mechanism. Following this, the compression arch effect becomes active, leading to a continued increase in carrying capacity. As cracks propagate into the compression zone, the compression arch effect weakens, causing a slight reduction in capacity. The stirrups then contribute to a renewed increase in resistance. However, the subsequent pull-out of the bottom reinforcement at the failed column’s beam-end section reduces the load capacity further. This is followed by the fracture of the stirrups at the same location, inducing compressive-flexural behavior in the bottom reinforcement of the side column’s beam-end section. A limited capacity recovery occurs due to the catenary action of the top reinforcement, but final failure is triggered by the rupture of the top reinforcement at the side column’s beam-end section.
Due to torsional effects, the load-displacement curve showed only a transient recovery after the compression arch stage minimum, followed by progressive degradation caused by rebar buckling. Throughout the collapse process, the specimen demonstrates sequential contributions from the flexural mechanism, compression arch mechanism, and partial catenary action. The S2 reached its ultimate capacity of 27.24 kN at 198 mm displacement, with final failure occurring at 258 mm.
It should be noted that only two 1/3-scale specimens were tested in this study, and only a single central angle (60°) was considered, which may introduce uncertainties due to the inherent variability of reinforced concrete materials and limit the direct experimental assessment of parameter-dependent behavior. To address these limitations, extensive finite element analyses were conducted based on the validated numerical model established through comparison with experimental results in Section 4.3, including a total of 26 parametric cases. In particular, the influence of different central angles was systematically investigated, thereby providing supplementary validation and enhancing the overall reliability of the conclusions.
Comparisons of anti-progressive collapse performance between straight and curved beam-column structures
Progressive collapse resistance and load-displacement curves
In terms of progressive collapse resistance, straight beams can develop axial tension through large deformations after initial failure, forming a catenary mechanism that provides secondary carrying capacity. Owing to their ability to mobilize catenary action, superior ductility, and higher structural redundancy, straight beam structures generally exhibit enhanced safety performance compared to arched beam structures.
In curved beams, post-failure curvature amplifies torque effects. This amplification induces spatial (three-dimensional) torsional deformation, which accelerates out-of-plane collapse. Concurrently, the beam’s inherent geometric curvature propagates localized damage, leading to spatial instability. Furthermore, the inherent compressive load path cannot naturally transition into a tensile load path after damage, preventing effective development of catenary mechanisms. This results in inadequate ductile deformation capacity, rendering arched beams highly susceptible to progressive collapse triggered by local failure.
As observed from the load-displacement curves (Figure 25), both straight and curved concrete beam-column substructures develop three distinct resistance mechanisms: the flexural mechanism, the compressive arch mechanism, and the catenary mechanism. The schematic diagrams in Figure 26 illustrate these three mechanisms. Schematic diagram of mechanisms. Comparison of load-displacement curves.

A comparative analysis of each stage is presented as follows.
At bending stage (OA and O´A´), both specimens exhibit an approximately linear load–displacement response under small deformation. Since S1 and S2 have identical material properties and boundary conditions with the same span configuration, their initial responses are generally similar. However, due to the eccentric loading induced by geometric curvature, additional torsional effects are generated in S2, resulting in a slightly reduced initial stiffness compared with S1. As loading increases, the response remains approximately linear until point A (21 mm, 19.7 kN) and A’ (20 mm, 22.6 kN), where cracking of the tension zone concrete and yielding of reinforcement occur, marking the end of the bending mechanism. Overall, S1 shows slightly higher stiffness and strength, which can be attributed to the additional tensile stress in longitudinal reinforcement induced by torsion in S2, leading to an earlier reduction in effective flexural capacity.
At compression arch mechanism stage (ABCDE and A´B´C´D´E′), tensile cracking occurs successively in the tension zone of the critical cross-sections under sufficient boundary restraint, leading to a gradual shift of the neutral axis toward the compression zone and outward expansion of the girder toward the edge columns. The resulting axial restraint provided by the edge columns promotes the formation of the compressive arch mechanism.
Both specimens initially exhibit an increase in load-carrying capacity, reaching peak values at B (27.54 kN) and B’. Subsequently, progressive crushing of the compression zone reduces the effective load-carrying area, causing a reduction in resistance toward C and C’. S1 exhibits a relatively stable response with a secondary strength recovery due to the confinement effect of web reinforcement, whereas S2 shows more pronounced fluctuations and reduced stability. For S2, torsional effects induce a coupled compression–bending–shear–torsion stress state, introducing additional tensile stress in longitudinal reinforcement and weakening composite action. This results in a 12% drop from B to C and limited strength recovery during the C→D stage.
At point D (77 mm, 27.28 kN), fracture of the bottom reinforcement at the beam-end section of the failed central column causes a sharp capacity reduction. With further deformation, the specimen continues to experience coupled actions. At point E (198 mm, 20.33 kN), fracture of the lower web bars and bottom longitudinal reinforcement occurs, while the top reinforcement transitions into tension, marking the end of the compressive arch stage. Compared with S1, S2 exhibits earlier degradation and reduced stability due to torsional effects and premature reinforcement failure.
At Catenary action stage (EFG and E´F´G′), the catenary action effect of S1 was significant (21% secondary increase in carrying capacity), while S2 only briefly maintained a 7% increase. This phenomenon stems from spatial curvature restricting full-section tension. In S2, the bottom reinforcement of the edge column remained in compression throughout loading. Consequently, the catenary action was primarily sustained by a subset of rebars, while concurrent torsional effects induced stress concentration. These combined factors precipitated premature failure during the catenary phase, preventing full development of the catenary mechanism.
Compared with straight beams, the torque effect caused by the geometric curvature of curved beams reduces the efficiency of mechanism conversion. This ultimately results in large fluctuations in carrying capacity, poor ductility, and insufficient development of the catenary action.
Finite element verification of a curved RC beam-column substructure under progressive collapse
Material constitutive relationships
Parameters of the concrete constitutive model.
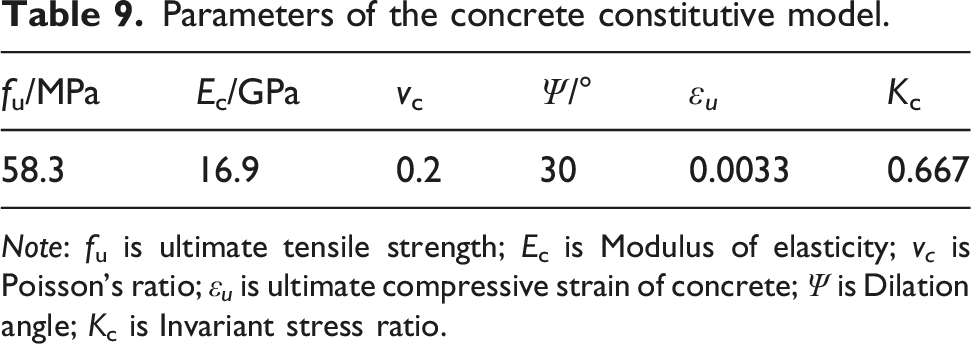
Note: fu is ultimate tensile strength; Ec is Modulus of elasticity; v c is Poisson’s ratio; ε u is ultimate compressive strain of concrete; Ψ is Dilation angle; Kc is Invariant stress ratio.
Parameters of the steel reinforcement constitutive model.
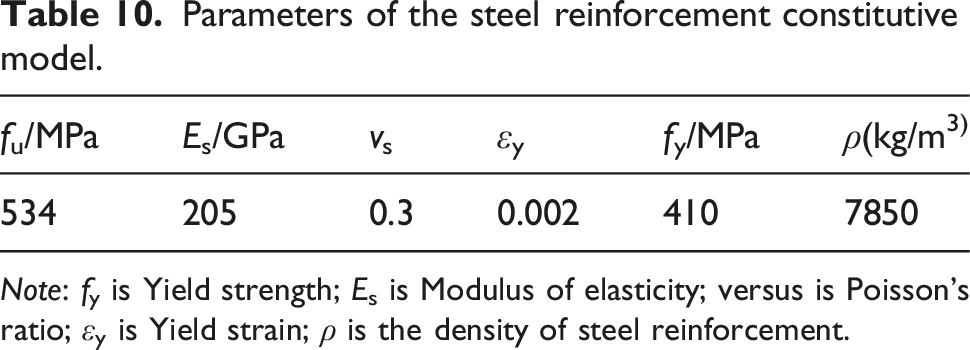
Note: fy is Yield strength; Es is Modulus of elasticity; versus is Poisson’s ratio; εy is Yield strain; ρ is the density of steel reinforcement.
During the progressive collapse resistance of structures, the role of reinforcement is crucial, particularly in the later catenary stage. As concrete cracks and fails, the tension provided by the reinforcement becomes the primary source of structural resistance, making reinforcement fracture inevitable. To accurately simulate the fracture of longitudinal reinforcement in the beam based on the material test results from Section 3, it is essential to employ a complete steel stress-strain curve that accurately describes the hardening and softening phenomena of reinforcement under tension. This study adopts the reinforcement constitutive model proposed by Wang et al. (2007), which accounts for the softening behavior of steel reinforcement. The monotonic tensile loading curve for this model is shown in Figure 27, and the simulation analysis was conducted using data obtained from material tests. Monotonic tensile loading curve of steel reinforcement.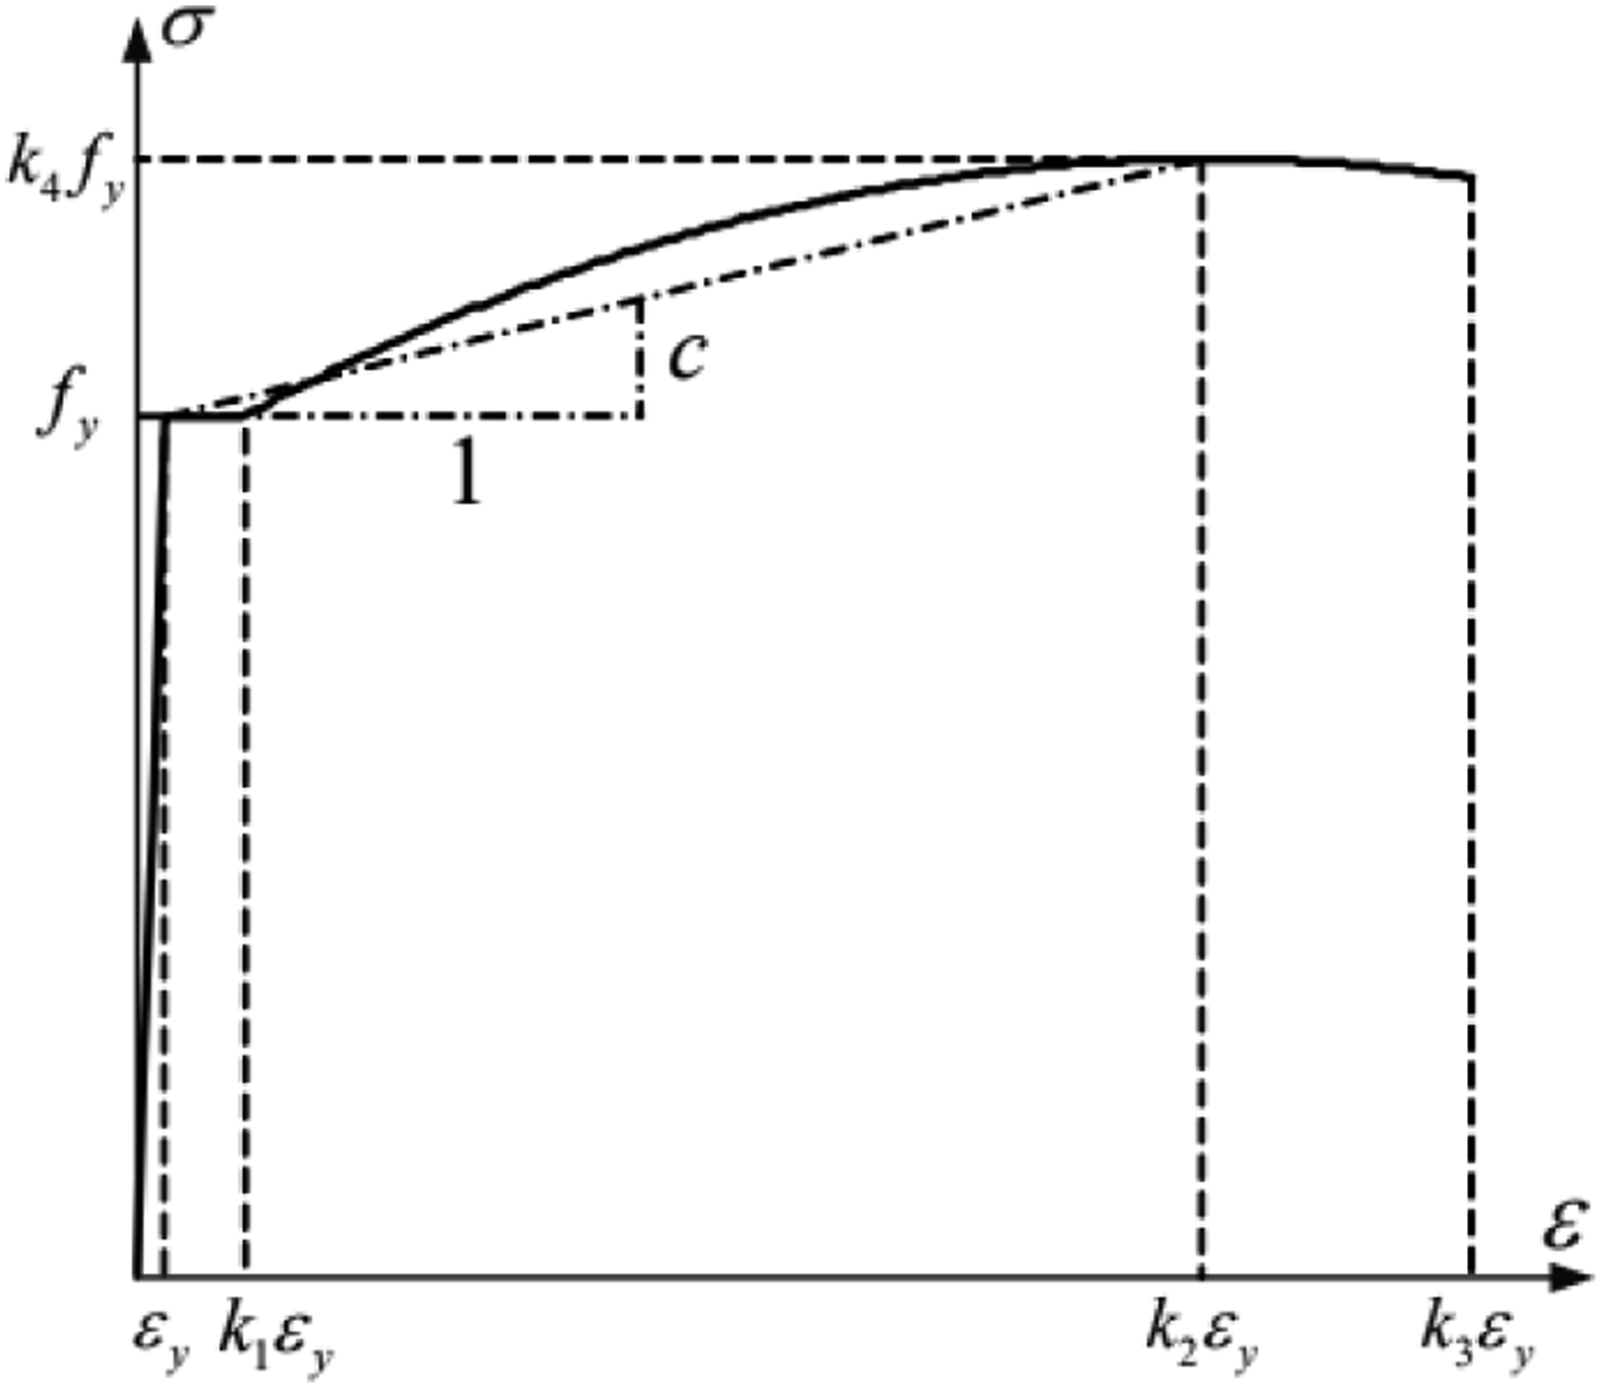
Finite element model setup
Using the ABAQUS, refined collapse models were developed for both linear and curved beam-column substructures. These models incorporate material and geometric nonlinearities, large structural deformations, reinforcement softening, and rebar fracture. The resulting failure modes and force-resisting curves are compared under middle-column removal scenarios to evaluate static resistance and the continuity of collapse mechanisms. In the finite element (FE) analysis, the concrete was modeled using C3D8R elements (8-node linear brick, reduced integration), while the steel reinforcement was modeled with T3D2 elements (2-node linear 3D truss). A three-dimensional solid model was established for the nonlinear finite element analysis of each specimen, as illustrated in Figure 28. Three-dimensional solid models in ABAQUS.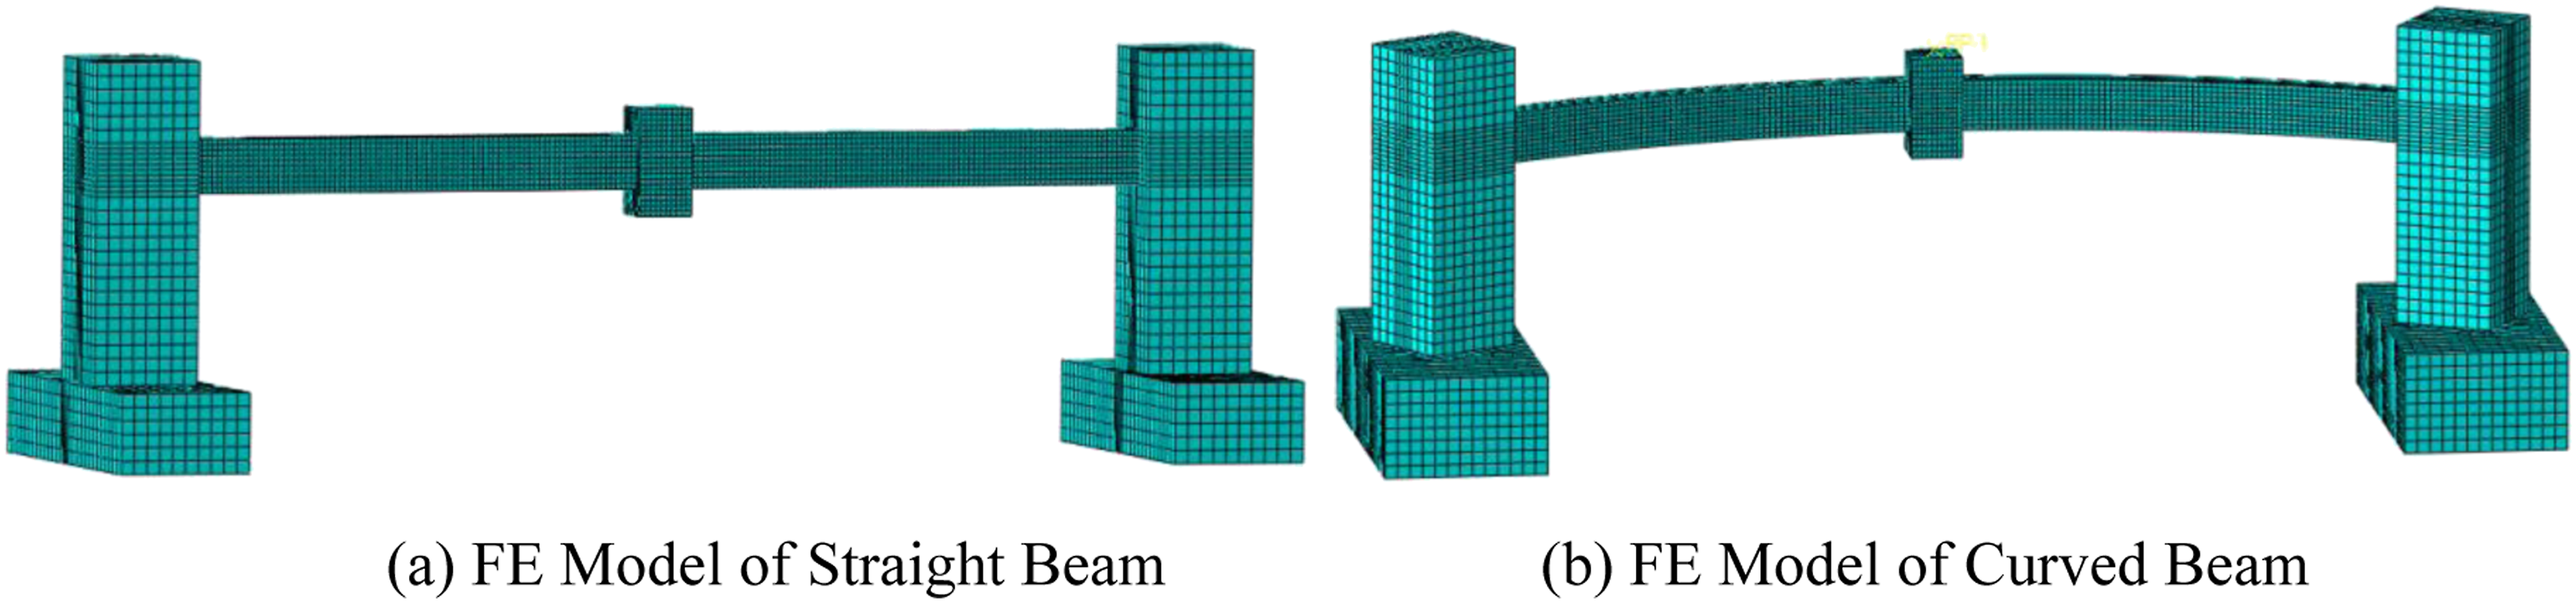
To balance computational efficiency and accuracy, a non-uniform mesh was employed. A finer mesh was applied to the beam region, which experienced significant deformations during the collapse process. In contrast, a coarser mesh was used for the edge columns and piers, where deformations were comparatively small. The boundary conditions were defined as follows: all degrees of freedom were restrained at the base of the piers. To simulate the restraint provided by the anti-collapse device on the failed center column, displacement constraints in the X and Y directions were applied to the corresponding surfaces of the column head.
Regarding the loading protocol, a reference point was created above the failed column node. All degrees of freedom on the top surface of the failed column were coupled to this reference point to prevent localized crushing. A vertical displacement was then applied to this reference point. The analysis was conducted using the dynamic explicit procedure. To achieve a quasi-static loading condition, the displacement was applied at a sufficiently slow rate, ensuring the loading time exceeded ten times the period of the fundamental mode of vibration.
Comparative analysis of experimental and simulated results
Comparative analysis of load-displacement curves
A comparison of the experimental and numerically simulated load–displacement curves of S1 and S2 is presented in Figure 29. The detailed data for each stage are presented in Table 11. As shown in the figure, the finite element analysis (FEA) results closely match the experimental outcomes, with good agreement between the curves, accurately reflecting the behavior of the reinforced concrete beam-column substructure during progressive collapse resistance. The FEA effectively captures the structural resistance mechanisms during progressive collapse, provided by beam-end moments, compressive arch action, and catenary action, which is consistent with established theoretical research and experimental findings on progressive collapse. Comparison of load-displacement curves. Comparison of simulation and test results of S1 and S2. Note: FA represents the flexural action stage; CAA represents the compression arch action stage, while CA denotes the catenary action stage.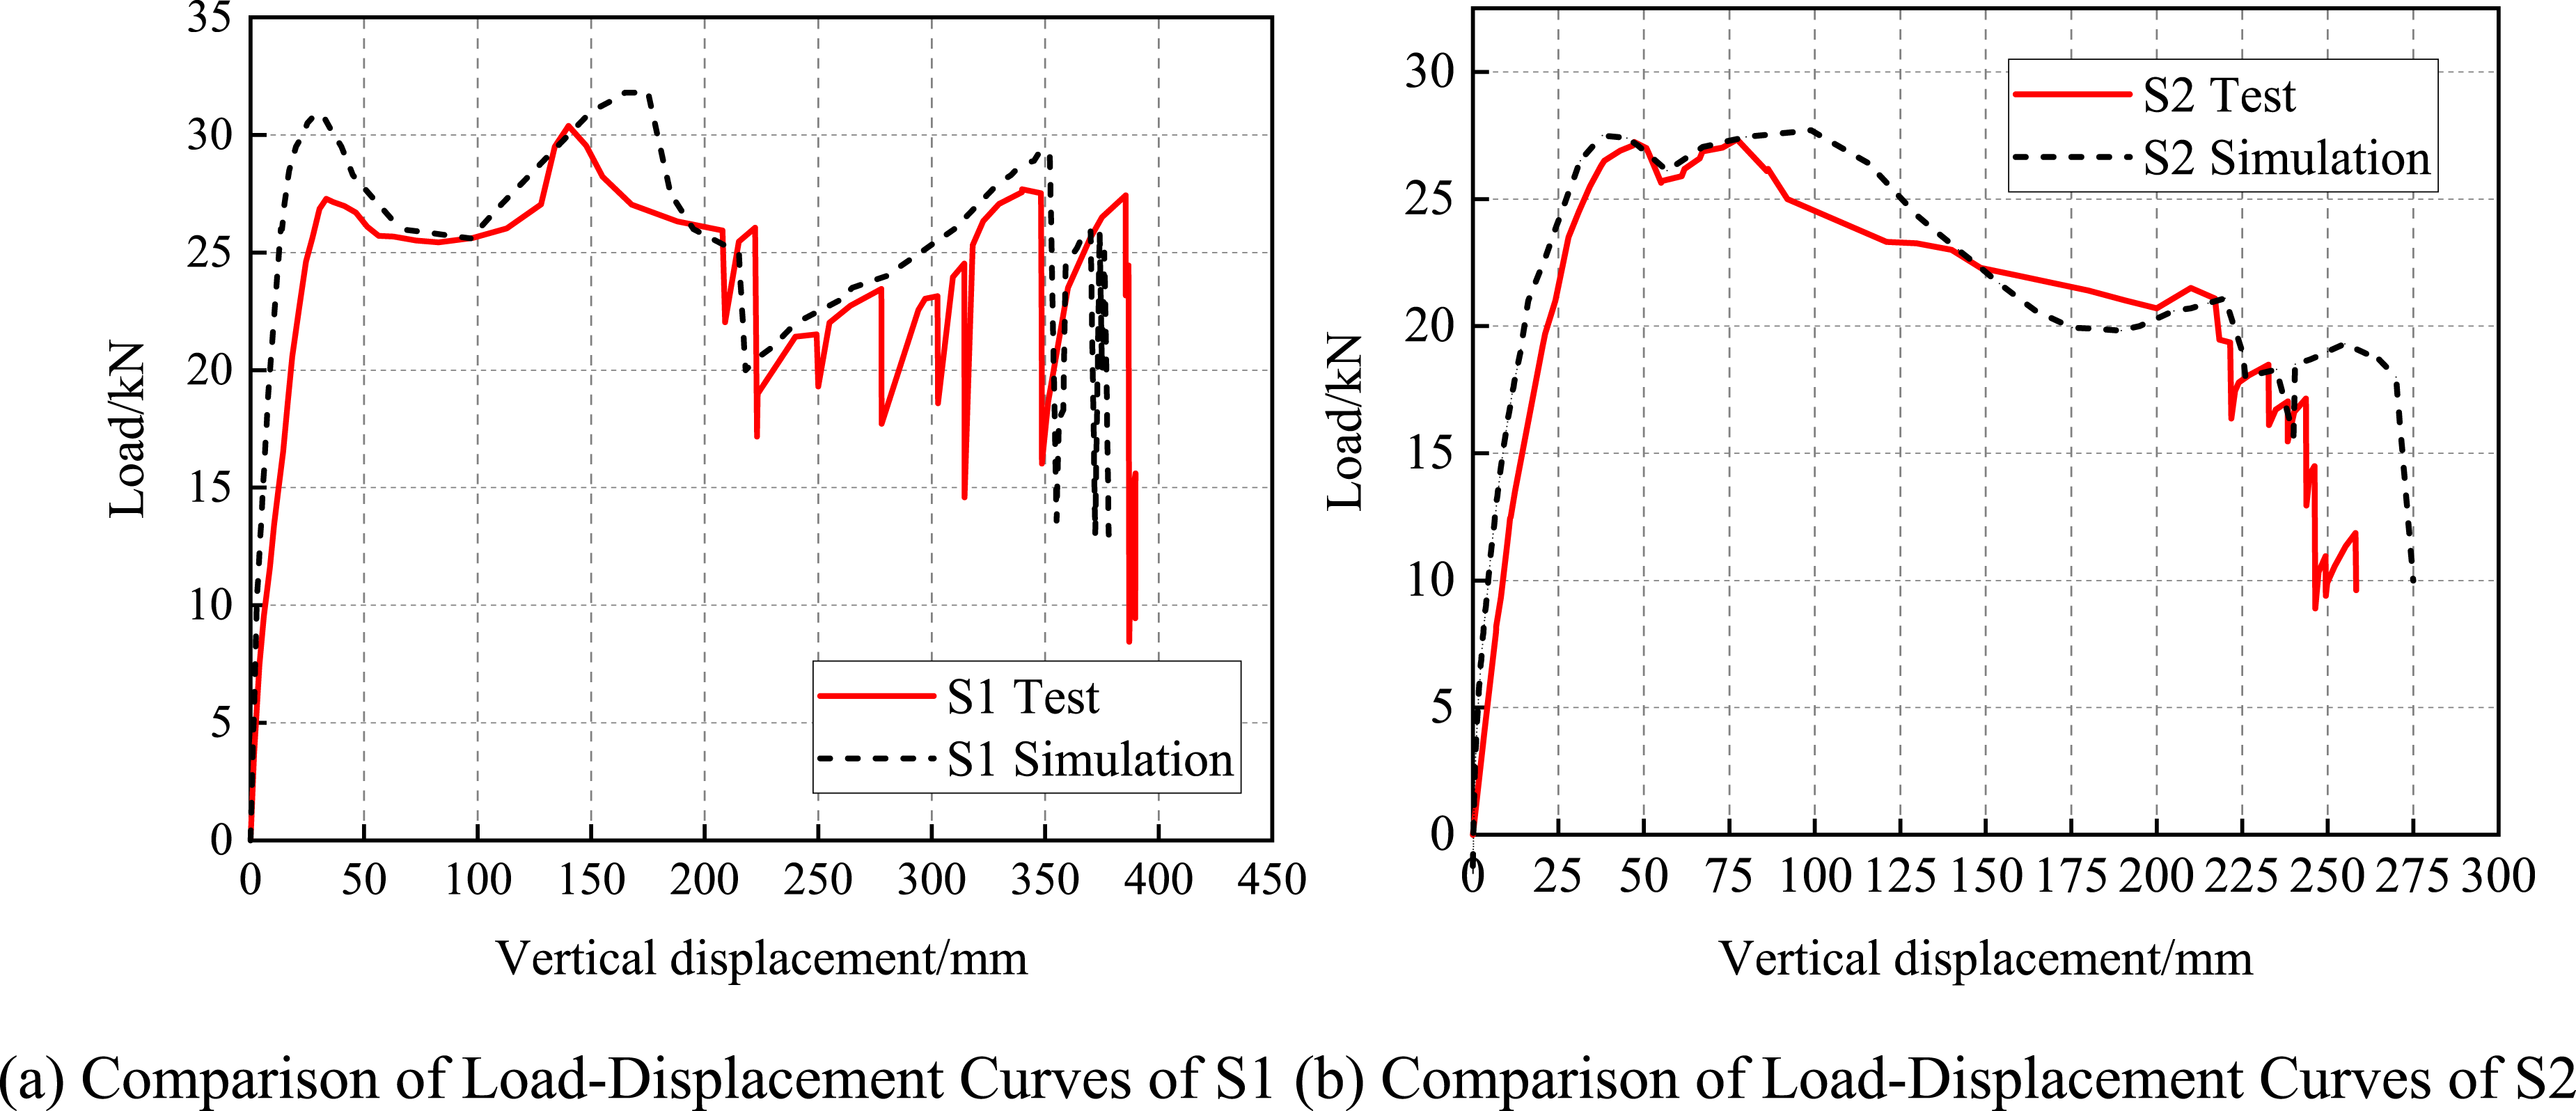
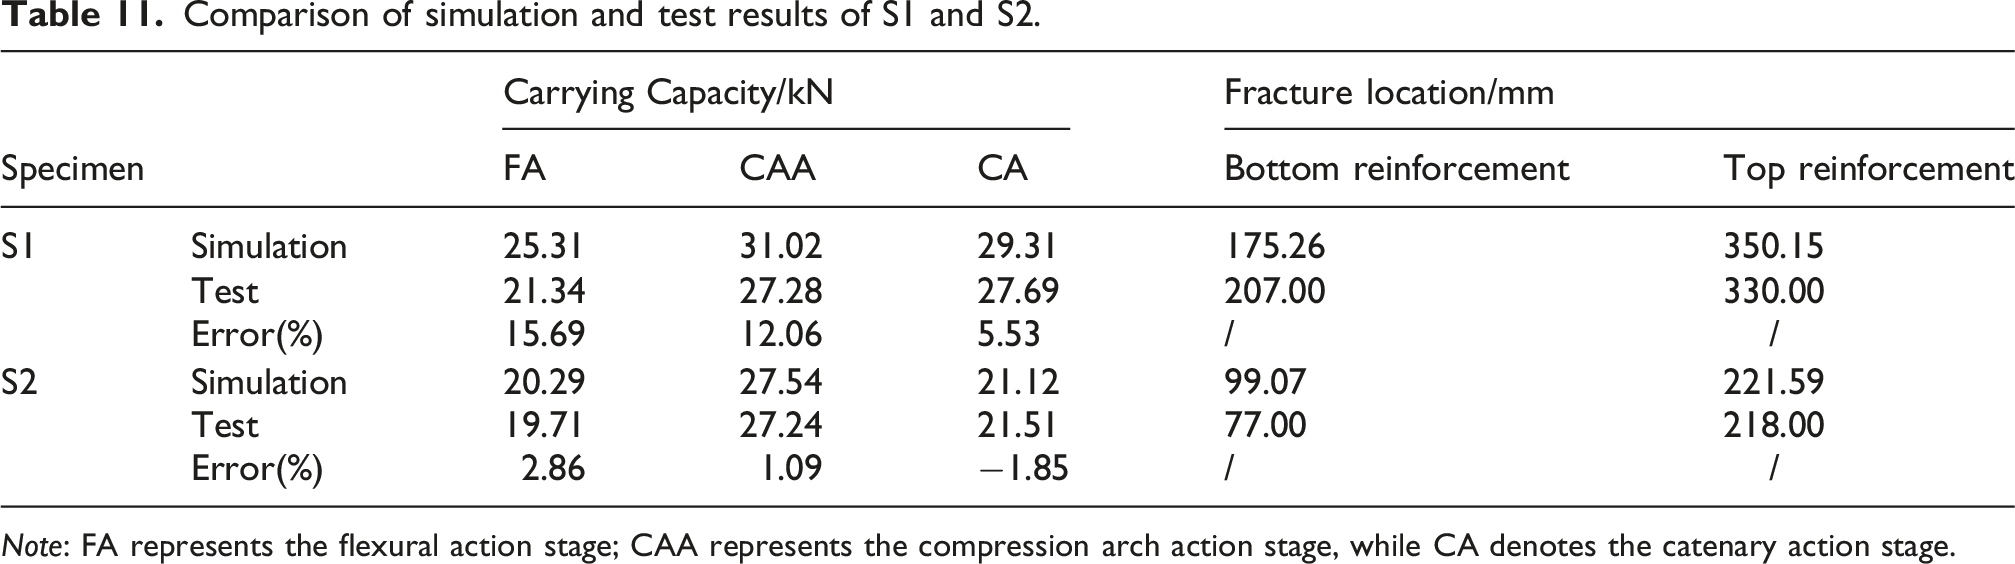
The experimental results exhibit lower initial stiffness than the FEA, primarily because the simulation uses homogeneous material models that cannot capture the inherent uncertainties of concrete casting. And this discrepancy may be attributed to the idealized material constitutive models, the assumption of perfect bond between reinforcement and concrete, and the neglect of initial imperfections and micro-cracking in the simulation. Furthermore, the CDP model in the FEA does not account for material displacement due to cracking, unlike real concrete. This leads to an overestimation of structural stiffness in the simulation.
During the compressive arch stage, the simulated curves exhibit earlier peaks and higher loads than the experimental results. This is primarily because the experimental edge columns provided non-ideal restraints, allowing inward rotation that weakened the arch action. Additionally, the FEA model did not account for rebar-concrete slippage, leading to an overestimated post-peak capacity drop compared to the more gradual degradation observed in tests. For S1, the simulated curve reaches the peak point later in the compressive arch stage. This is because, in the test, the bottom reinforcement at the beam end of the edge column joint buckles in compression at the peak of the compressive arch action, while the FEA, unable to simulate reinforcement buckling in compression, shows a drop in the simulated curve due to fracture of the bottom reinforcement at the middle column joint. Towards the end of loading, the simulated curve exhibits less pronounced oscillation compared to the experimental curve, as the simulation does not account for the impact damage caused by reinforcement fracture and assumes symmetrical fracture of the reinforcement.
Parameters of the finite element model.

The reinforcement ratios (1.03%, 1.37%, and 1.53%) are selected to cover a practical range commonly used in engineering design. Among them, 1.37% corresponds to the reinforcement ratio of the tested specimen, allowing direct validation of the numerical model, while the lower and higher values are adopted to evaluate the sensitivity of structural performance to reinforcement variation.
The reinforcement strength ratios (1.0, 1.44, and 1.6) are selected based on the recommended range specified in the Chinese Code for Design of Concrete Structures, where the typical range is approximately 0.6–1.7. The chosen values represent normal, moderately high, and relatively high strength conditions, enabling assessment of the influence of material strength on load-carrying capacity and failure mechanisms.
Through these parameter selections, a systematic and representative parametric study is achieved, ensuring both engineering relevance and theoretical completeness.
Based on the data in Table 12, the corresponding load-displacement curves are plotted in Figure 30. Among the models with central angles of 60° and 90°, the load-displacement curves follow trends similar to those of the 45° and 120° specimens. For conciseness, only the load-displacement curves for the 45° and 120° cases are provided here. Load-displacement curves of different ζ and ρ model.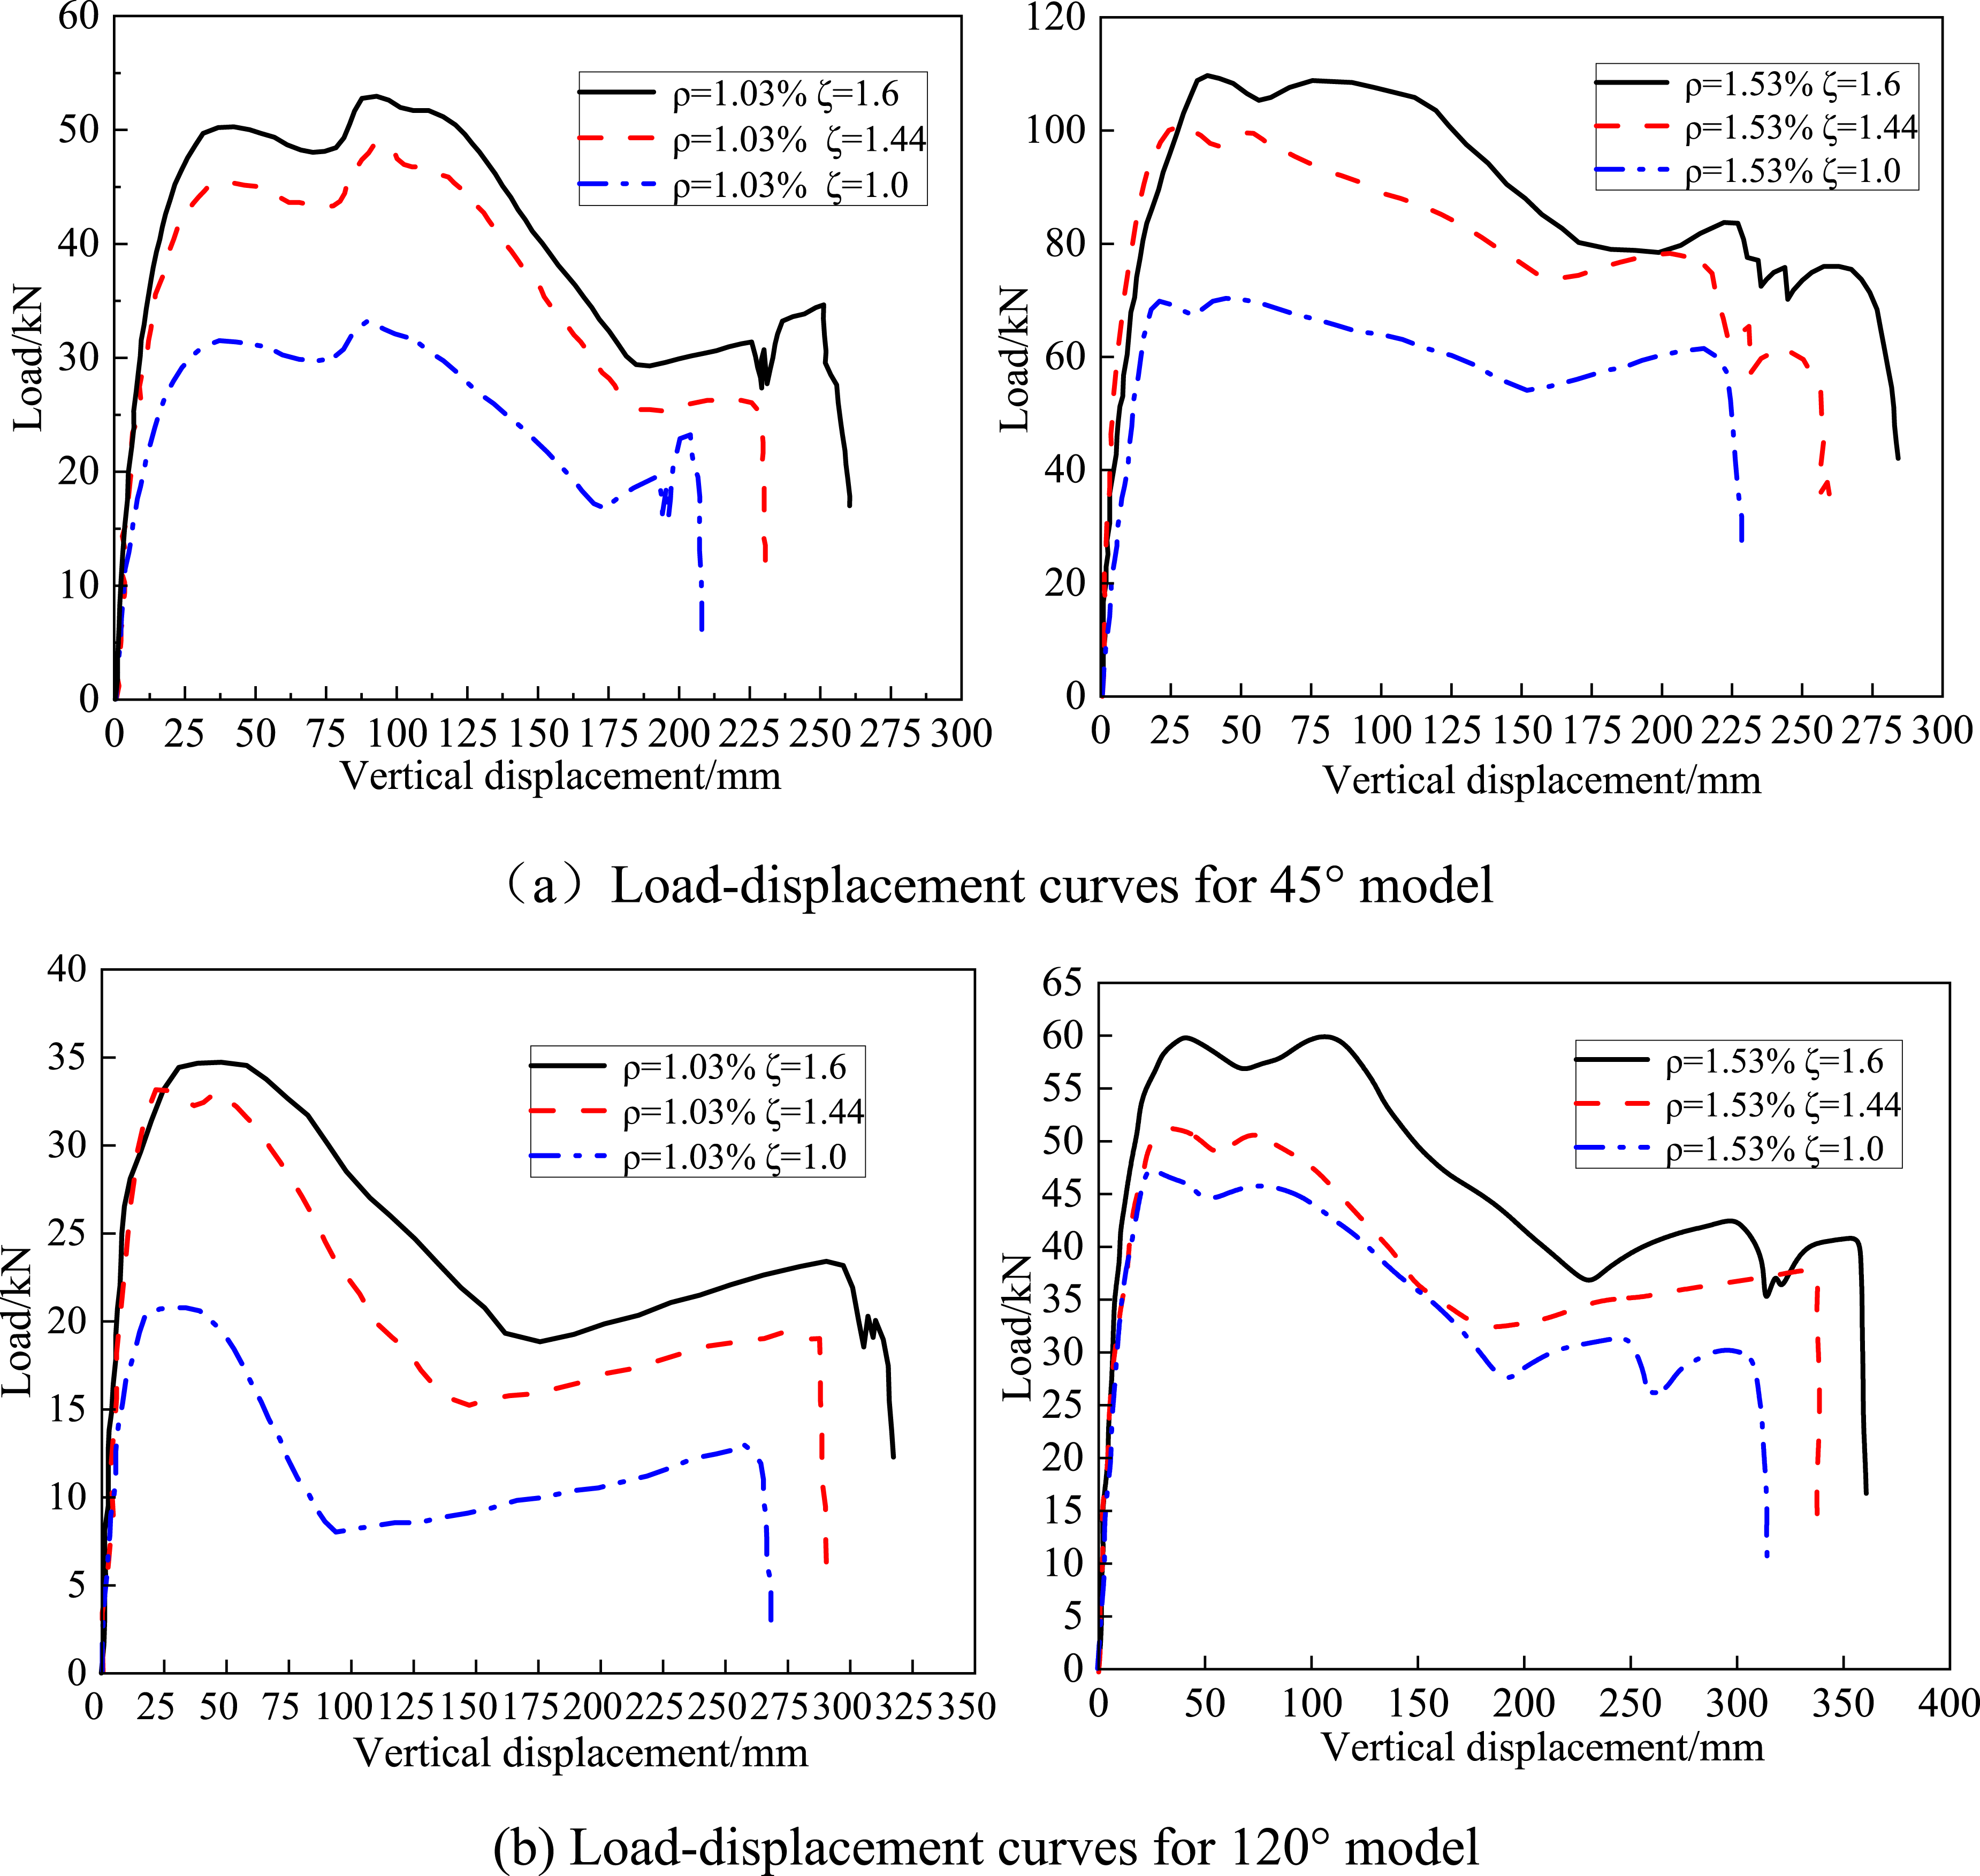
A comparative analysis reveals that all simulated curves exhibit remarkable consistency with the experimental curve in terms of both evolutionary trend and key characteristic stages. Specifically, the structural behavior sequentially transitions through three distinct phases: the initial bending stage, followed by the compressive arch action (CAA) stage, and ultimately culminating in an incomplete catenary action stage. This consistent sequential progression across all simulations strongly validates the accuracy of the experimental observations and the fundamental assumptions of the theoretical model.
For models with different α, the evolution trends of the mechanical behavior and load-displacement curves are generally consistent. However, a reduction in α effectively enhances the carrying capacity of the structure at key stages and increases the displacement at the peak of the compressive arch action. As the torsional moment decreases, the shift of the neutral axis in each section diminishes, resulting in lower compressive stress in the top reinforcement at the beam end near the failed column prior to the complete fracture of the bottom reinforcement. This facilitates its transition to tensile stress and subsequent fracture, thereby reducing the structural failure displacement.
For curved beam-column substructures with different ζ, the mechanical mechanisms are also fundamentally similar. All models exhibit comparable initial stiffness during the flexural mechanism stage. Increasing ζ significantly improves the carrying capacity and effectively mitigates the decline in capacity during the transition phase. During the catenary action stage, an increase in ζ enhances the carrying capacity in this stage but has a limited effect on the failure displacement.
Furthermore, the simulations accurately capture the unique failure mechanism of curved beams, notably the underdeveloped catenary action, which is primarily attributed to the persistent bending-torsion coupling effect that inhibits the full development of the catenary.
Comparative analysis of failure modes
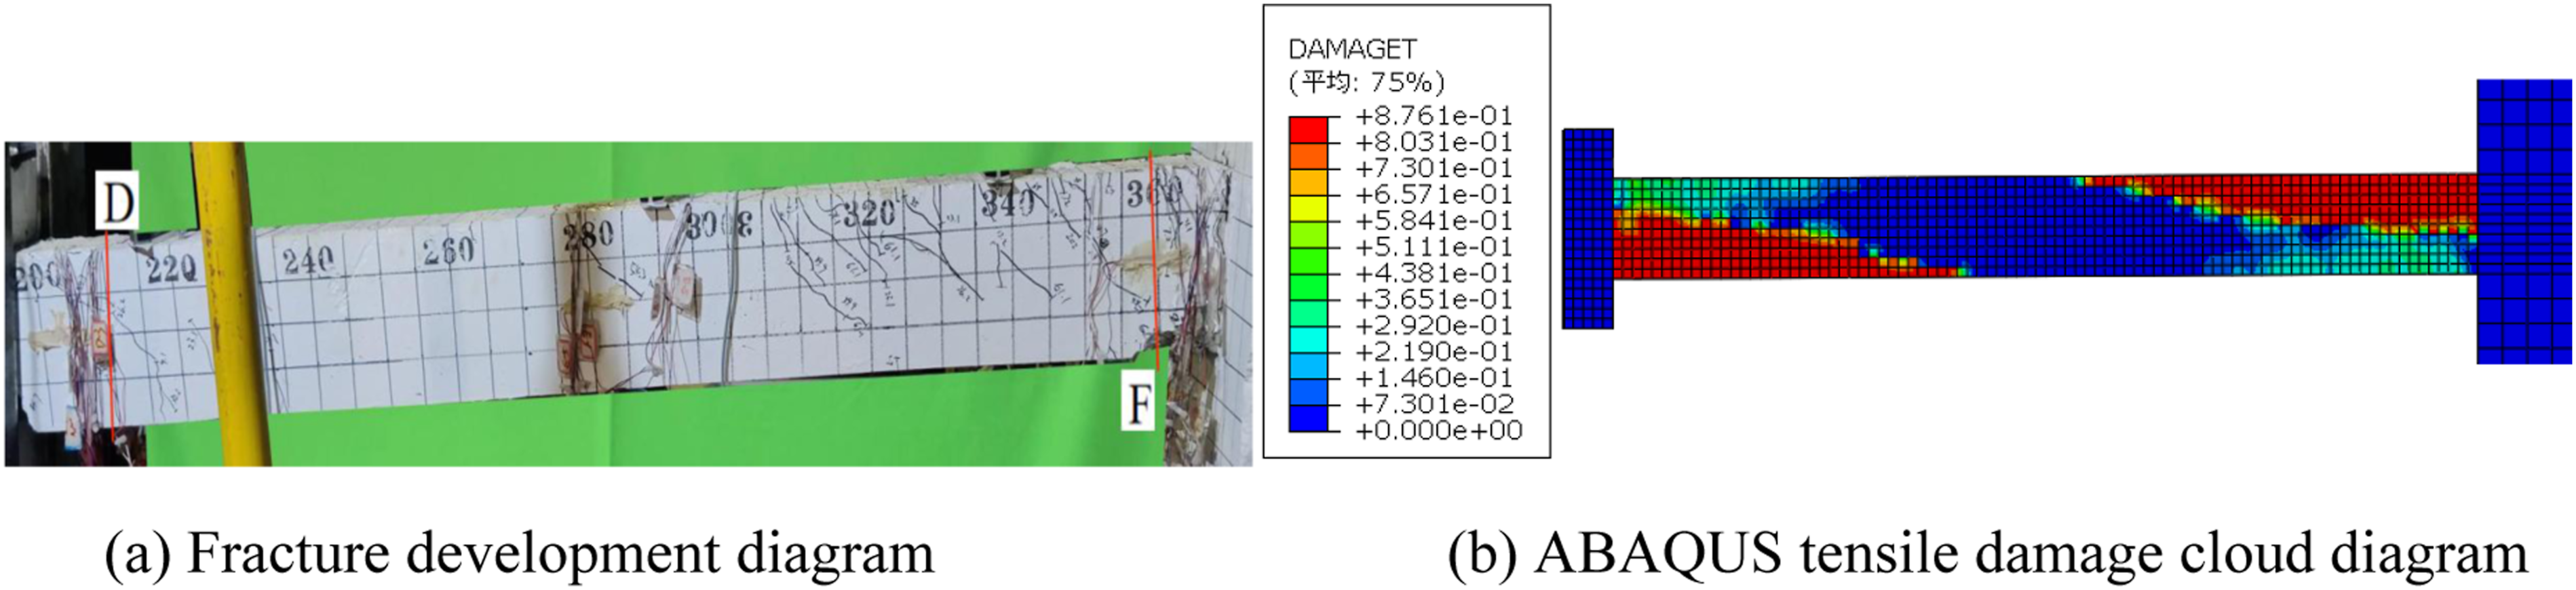
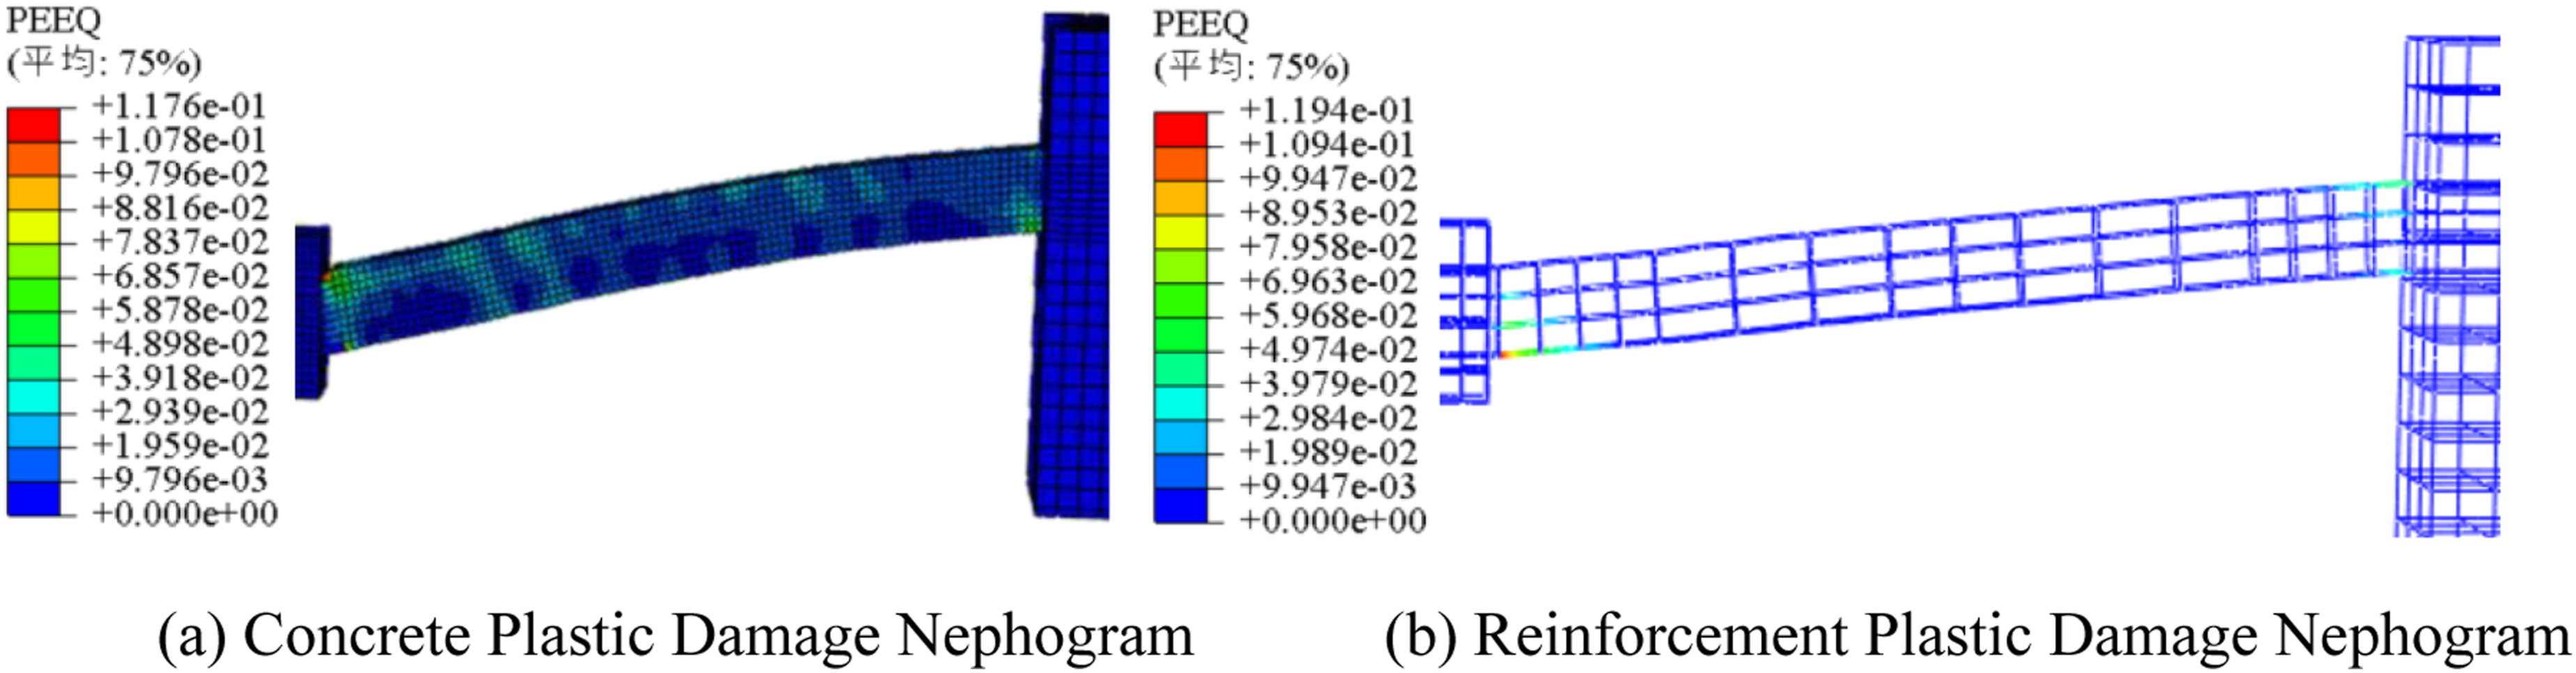
Figures 31 and 32 present the tensile damage distribution nephograms of the beams in the finite element models of S1 and S2. The definitions of the inner side and outer side in figures are consistent with those given in Section 3.3.2. It can be observed that the simulation results generally correspond well with the crack patterns observed in the tests. For S2, during the small deformation stage, tensile damage developed more rapidly on the outer side. The tensile damage in concrete can reflect the variation in the direction of principal crack development with changes in the torsion-to-bending ratio. Half-span substructure damage development of S2. Half-span substructure damage development of S1.
The plastic damage nephograms of S2 and S1 at structural failure are shown in Figures 33 and 34, respectively. The failure modes of both specimens in the simulation are generally consistent with the experimental observations. For S2, the simulation results indicate the formation of a primary crack below the failed column, with fracture of all reinforcing bars except the top reinforcement. Concrete spalling occurred on the outer side at the top of the edge column, accompanied by fracture of the top reinforcement. In the simulation of S1, tensile failure of the concrete at the mid-span of the upper part of the beam exhibited strains exceeding 0.1 in subsequent analysis, while the strain in the reinforcement at this location remained relatively small. This further confirms that the pull-out of the middle top reinforcement in the test was due to anchorage failure caused by concrete failure. Plastic damage nephograms of S2. Plastic damage nephograms of S1.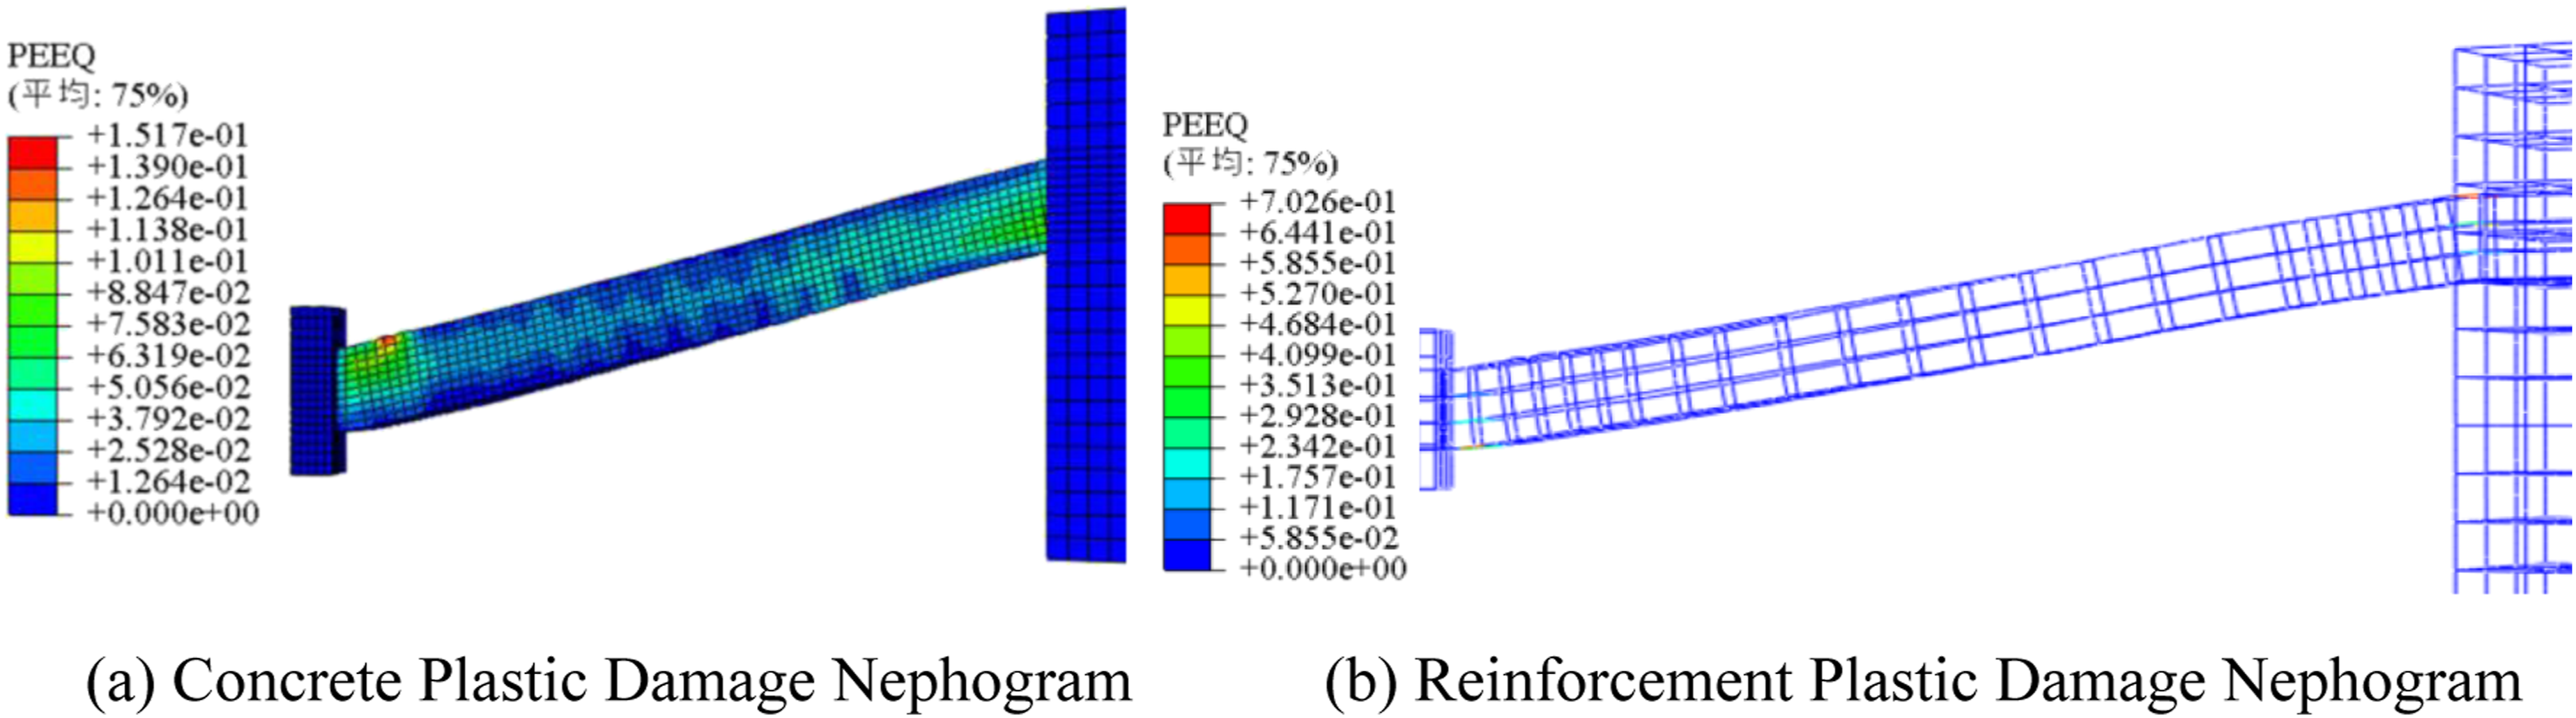
Validation and parametric analysis of carrying capacity
Comparison between theoretical calculations and simulation results.
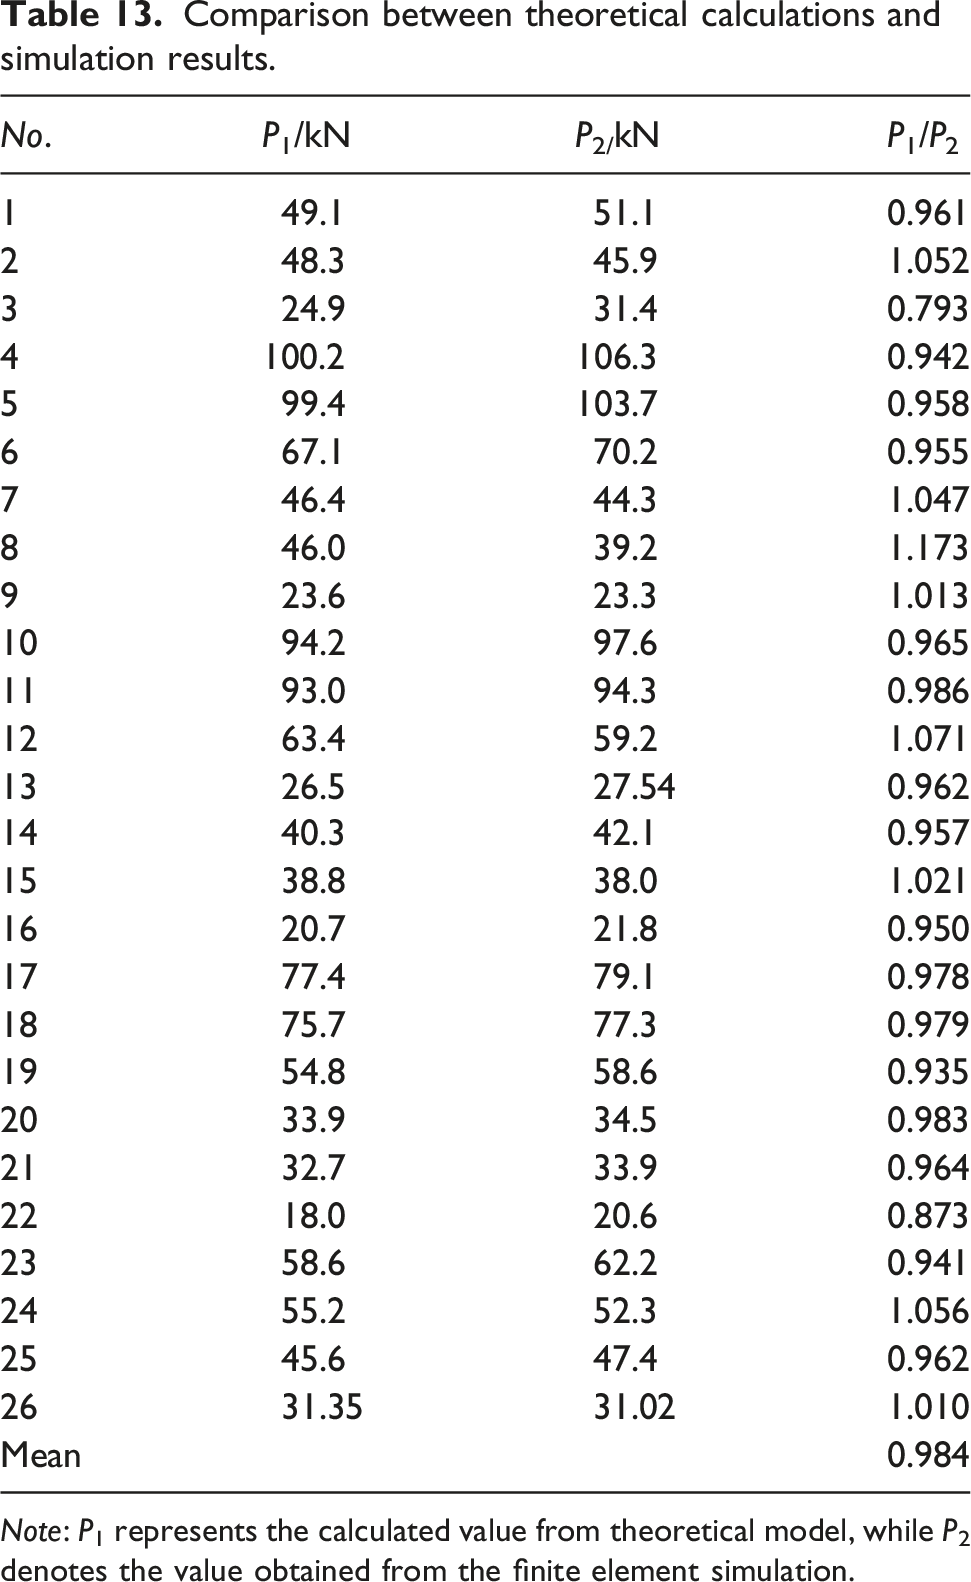
Note: P1 represents the calculated value from theoretical model, while P2 denotes the value obtained from the finite element simulation.
The research results demonstrate that the theoretical calculation method for carrying capacity proposed in this paper can accurately predict the resistance characteristics of curved beam-column substructures, with an overall deviation of less than 10% compared to the simulation results. This validates the effectiveness of the theoretical analysis method for curved beam capacity. The theoretical calculations do not account for strain hardening of reinforcement, redistribution of concrete compressive damage, or factors such as support friction and stiffness degradation. In contrast, the finite element model more accurately reflects these influencing factors, resulting in conservative theoretical predictions.
Comparison between theoretical predictions and experimental results.
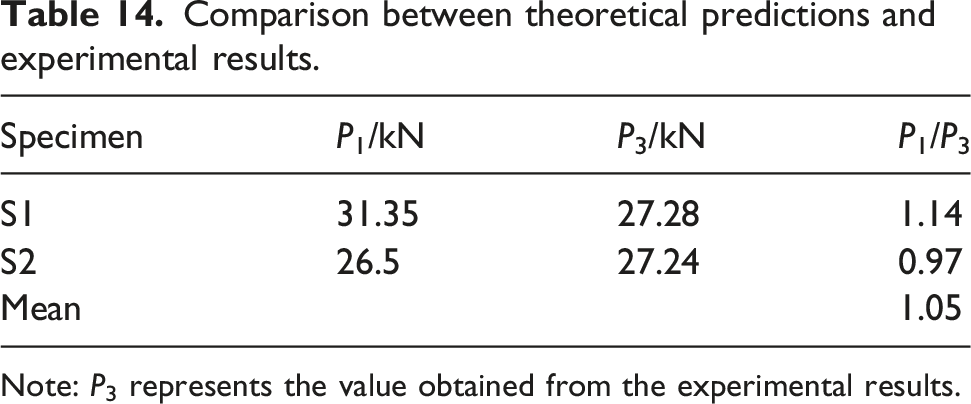
Note: P3 represents the value obtained from the experimental results.
To examine the effects of the reinforcement ratio (ρ), reinforcement strength ratio (ζ), and the central angle (α) on the peak carrying capacity of curved beams, six specimen configurations were analyzed. The reinforcement ratios were set at 1.03% and 1.5%. Two reinforcement ratios (ρ = 1.03%, 1.5%) and three strength ratios (ζ = 1.0, 1.44, 1.6) were considered, generating six unique parameter combinations. The analyzed curved beam is selected with a span L = 3.9 m, cross-section b × h = 200 × 400 mm, and midspan concentrated load. The variation of carrying capacity is illustrated in Figure 35. Influence of ρ, ζ and α on carrying capacity of curved beam.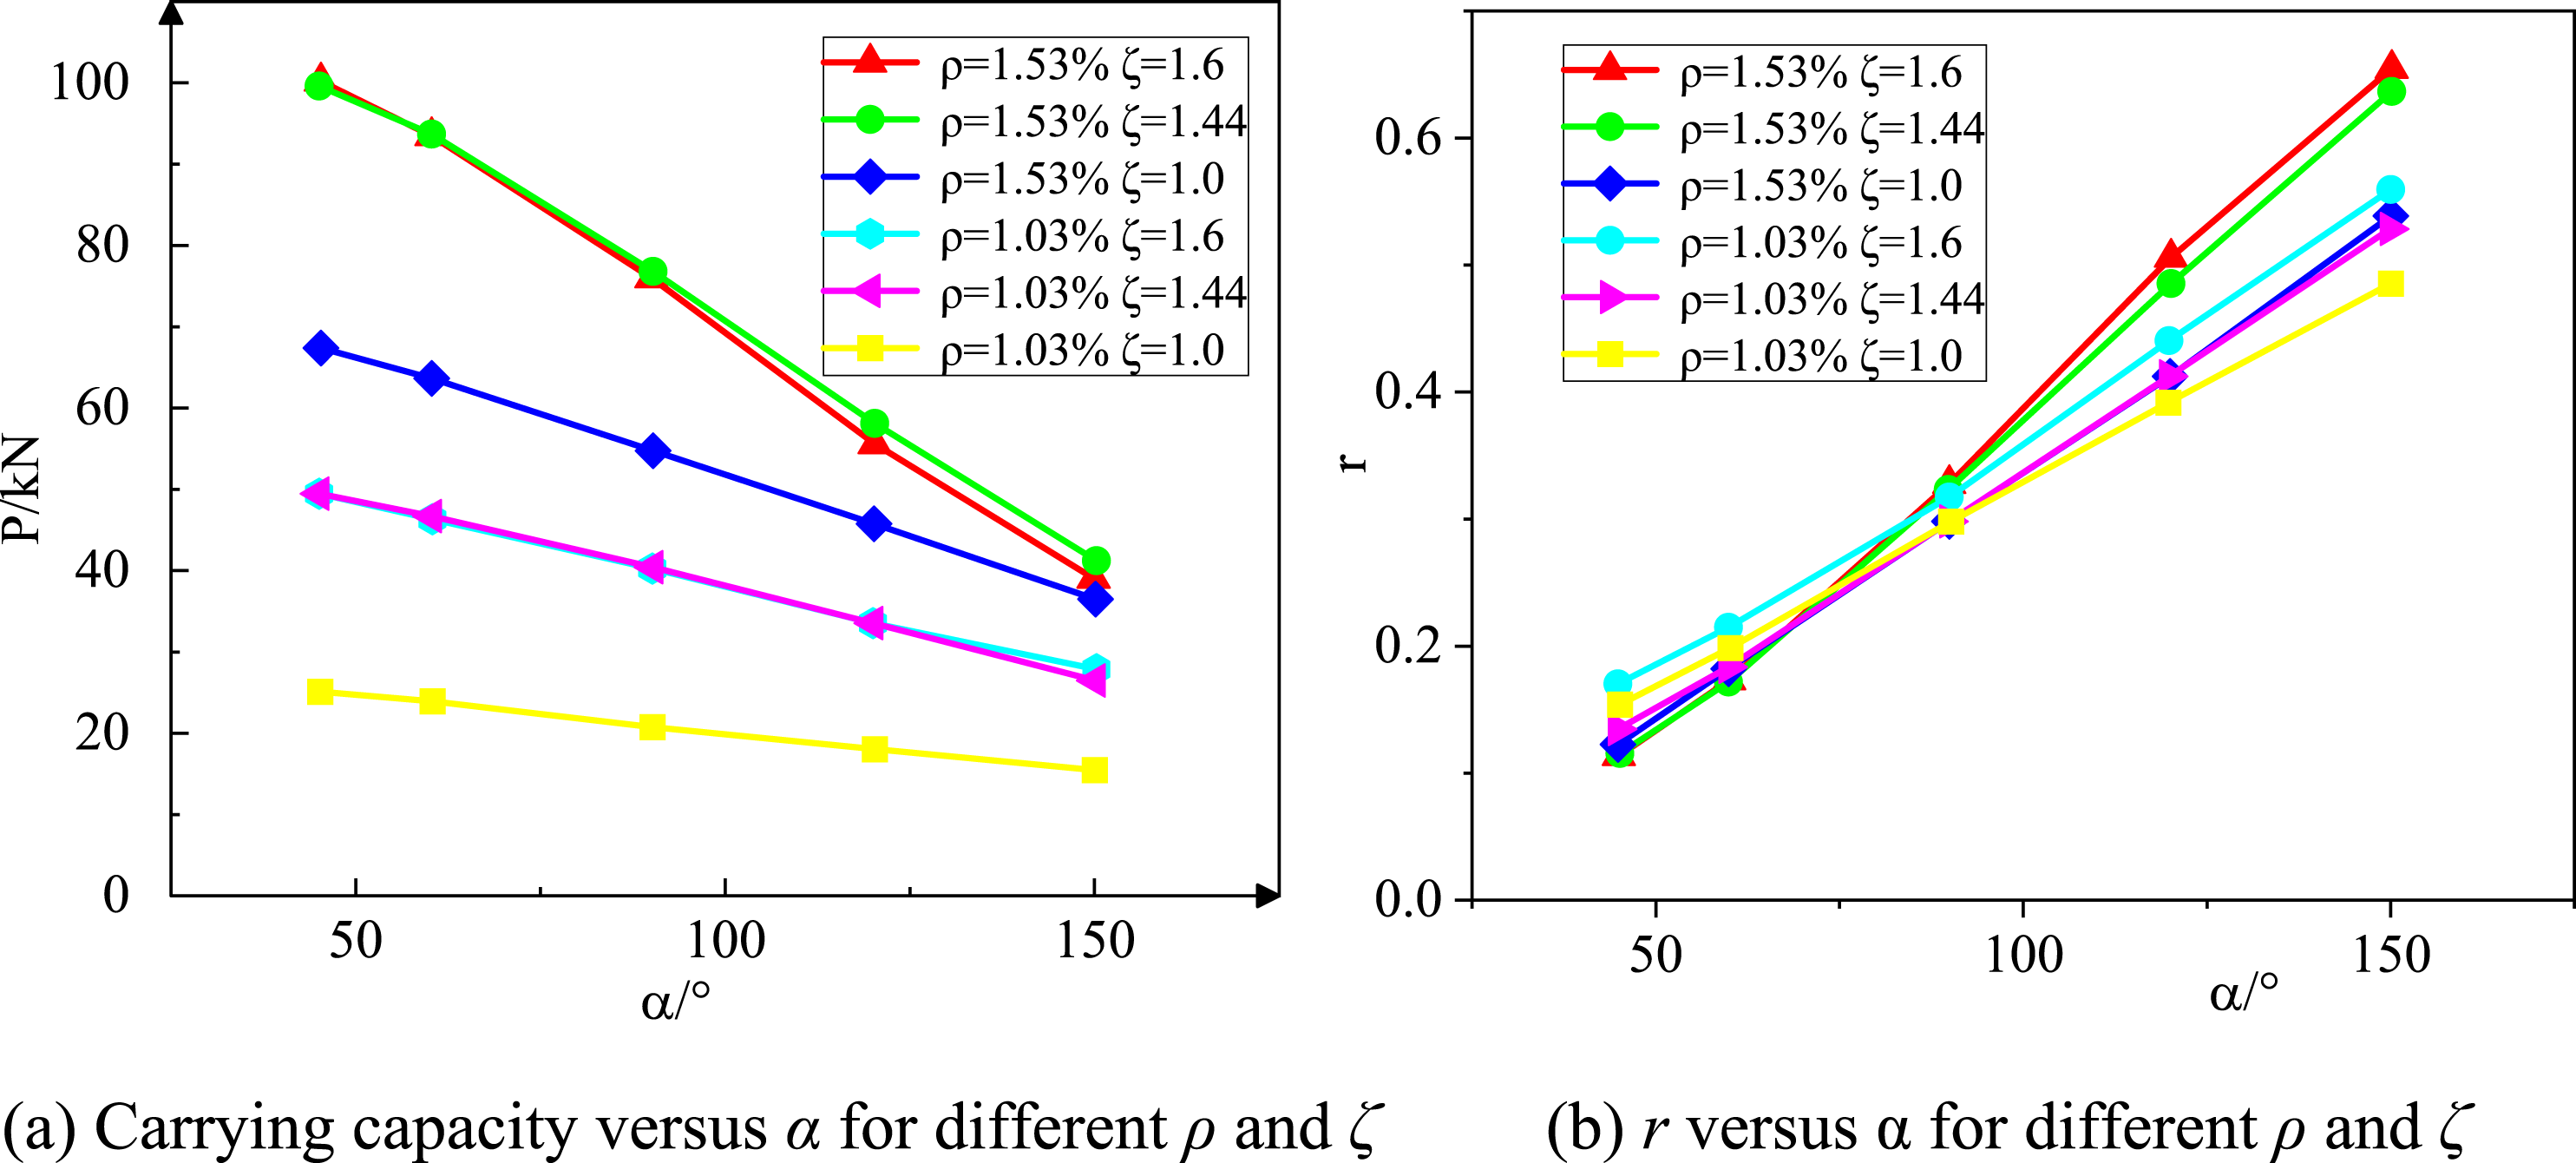
It is seen that, with a given reinforcement ratio (ρ), the ultimate carrying capacities under reinforcement strength ratios of ζ = 1.6 and ζ = 1.44 are closely comparable, whereas a significant reduction occurs at ζ = 1.0. This occurs due to a critical shift in stirrup confinement efficiency. When reinforcement strength ratios exceed 1.4 (ζ > 1.4), stirrups deliver significantly enhanced confinement. It creates a robust constraint field, placing the core concrete in a triaxial compression state. This enhances the concrete’s compressive strength and delays crushing in the compression zone, shifting failure control to tensile yielding of longitudinal reinforcement. Since the longitudinal reinforcement does not yield under these conditions, variations in ζ exert minimal influence on the ultimate capacity. Conversely, at ζ = 1.0, inadequate confinement from stirrups compromises lateral restraint, leading to reduced flexural resistance and a marked decline in carrying capacity. Notably, a higher reinforcement ratio can partially mitigate the confinement loss associated with low ζ, whereas a low reinforcement ratio impedes the effective utilization of confinement even at high ζ due to insufficient stirrup volume. Based on the experimental and theoretical analysis of specimens with α = 60°, the ultimate carrying capacity shows a 16%–21% reduction compared to straight-beam specimens. Moreover, Figure 35(b) demonstrates that the maximum reduction in ultimate load exceeds 60% when the central angle varies between 45° and 150°.
Then, the effects of central angle α are discussed. With a given ρ and ζ, an increase of central angle results in a linear reduction of carrying capacity. This trend originates from bending-torsion coupling effects induced by beam curvature. As the central angle increases, intensified coupling shifts structural failure from flexure-dominated to combined bending-torsion mode. The resulting torque surge reduces reinforcement confinement effectiveness, ultimately causing systematic carrying capacity degradation.
In summary, with a given ρ, the carrying capacity increases with higher ζ. Conversely, with a given ζ, the capacity scales positively with ρ. Collectively, these three parameters govern the ultimate carrying capacity of curved beams.
Conclusions
This study experimentally and theoretically investigated the progressive collapse behavior of curved reinforced concrete beam-column substructures, leading to the following principal conclusions: (1) The curved beam-column substructure exhibits a pronounced asymmetric failure mechanism. Unlike the symmetric failure of straight beams, its failure is dominated by the outer side, with crack propagation and rebar fracture occurring faster on the outer side of the beam-column joint. This originates from the combined bending and torsion stress state induced by curvature. (2) A fundamental relationship is established between a beam’s curvature and its required torsional capacity. Designing the cross-section to match these two parameters is therefore essential for preventing premature failure and achieving robust structural performance. (3) The torsional effect severely inhibits the development of the catenary mechanism in the curved beam. The bending-torsion coupling effect results in a negligible increase in carrying capacity during the catenary action stage (only about 7%), far less than that in the straight beam (about 21%). Furthermore, achieving a full-section tensile state remains unattainable even by increasing the reinforcement strength ratio. This signifies that design methods based on straight members are inadequate for curved structures, and new design guidelines considering the detrimental effects of torsion are essential. (4) A theoretical calculation method for the carrying capacity, which accounts for the bending-torsion coupling effect, was proposed and its effectiveness was validated through finite element analysis. This method can accurately predict the carrying capacity of curved beams, with a mean accuracy of approximately 1.0, thereby providing a reliable and practical tool for addressing progressive collapse in engineering design.
It should be noted that the experimental investigation in this study is limited to a single curved specimen with a central angle of 60°, which restricts the direct experimental verification of parameter-dependent behaviors. Although numerical simulations have been performed to explore the influence of different central angles, further experimental studies covering a wider range of geometric configurations are still needed. Future research should focus on conducting systematic experimental programs to validate and refine the proposed analytical and numerical findings.
Footnotes
Funding
The authors disclosed receipt of the following financial support for the research, authorship, and/or publication of this article: The research is supported by the National Natural Science Foundation of China (Grant No. 52378126, Grant No. 52508154).
Declaration of conflicting interests
The authors declared no potential conflicts of interest with respect to the research, authorship, and/or publication of this article.
Data Availability Statement
The data that support the findings of this study are available from the corresponding author, [Hao Zhou], upon reasonable request.