
Abstract
In the paper, finite element analyses are used to study the effect of media inhomogeneity on the electric field distribution in a sample composed of extracellular matrix and cells, including cells with a lipid droplet in the cytoplasm. In the model, voltage pulses, typical of electrochemotherapy treatments, are considered. The electric field distribution around cells is computed numerically; moreover, the transmembrane potential at the cell membrane is evaluated. In order to study cell behavior in different conditions either the presence of the collagen or the lipid droplet inside the cell cytoplasm are considered. The conductivity of the extracellular medium varied between plain collagen to myxoid, i.e., a gel-like matrix; the combinations of the two cases (a collagen shell around cells immersed in a myxoid environment) is considered too. An increase in the transmembrane potential was found in the case of higher aggregate and collagen presence. However, it is already known that, increasing the cell aggregation, the transmembrane potential increases as well as in the case of the presence of the collagen shell. In the paper, the effect of a lipid droplet is studied too.
Introduction
Electroporation (EP) is a technique used to permeabilize the cell membrane in a reversible (RE) or irreversible (IRE) way using an external pulsed electric field.1–6 This approach is used to electropermealize the membrane to improve gene electrotransfer, or uptake of moleculas in general, but also to ablate tissues as it occurs in irreversible electroporation with recent application in nonthermal ablation in cardiology.2,5,7–13 In all the electroporation applications the external electric field modifies the transmembrane potential up to membrane is temporarily or definitely damaged, depending on the intensity of the applied electric field. 14 In reversible electroporation field, electrochemotherapy (ECT) uses electropermeabilization to improve the delivery of chemotherapeutic agents. This treatment is well-established in clinics across Europe and is deployed for the treatment of some cancers like e.g., melanoma, breast cancer, sarcomas, colon cancers etc.8,15–19 The typical protocol used in ECT clinical practice involves the application of 8 voltage pulses 100 µs long, delivered at 5 kHz, with the amplitude evaluated multiplying the desired electric field in homogeneous condition, e.g., 1000 V/cm, by the electrode distance in [cm], 15 whereas in irreversible electroporation typical pulses have an amplitude up to 3 kV/cm.13,20 Considering ECT, in previous works, authors studied how the tissue inhomogeneity in electrical conductivity can modify the local distribution of the electric field improving or reducing the electroporation effect.21,22 From a clinical point of view, in the presence of a lipid mass in the volume of the treated tumor, Denzi et al. demonstrated that the electric field intensity is reduced due to the presence of fat tissue. 21 Moreover, in 22 authors show that the tissue inhomogeneity in electrical conductivity modifies the electric field distribution affecting the electroporation, as well as in 23 authors show that the local presence of collagen can amplify the electroporation efficiency. Taken together, these findings show that the local conductivity affects the electroporation and in consequence the therapeutic effect of the treatment.
In 24 authors studied, using Finite Element Analysis (FEA), the role of the extracellular matrix (ECM) around cells, focusing on the transmembrane potential able to allow the membrane permeabilization. In fact, the transmembrane potential is a function of tissue electric characteristics.25,26 In particular, it is well known that tumors can have a fibrous or myxoid27–31 stroma. Specifically, myxoid stroma is based on a complex network of fibrous proteins embedded in hydrated glycosaminoglycans,32,33 whereas fibrous stroma is based of collagen fibers.32,34 On the other hand, in this paper, how the fat component (a low conductivity material) inside the cell modifies the reaction to the electric field pulses, is investigated. In 21 the effect of fatty tissues is studied to evaluate electroporation efficiency, based on experimental evidence, at a macroscopic level. In our paper, a microscopic investigation is proposed and transmembrane potential is evaluated.
The effect of collagen around cells was already studied with both simulations and experimental validation that confirmed an electroporation enhancement in presence of collagen shell around cells. For instance, in 24 the effect of cell aggregation in combination with collagen shell, that simulates the spheroid, was studied by FEA and verified with 3D cell culture.
Some types of tumors show cells with lipid component in the cytoplasm, like e.g., liposarcoma, 30 or some tumors could be surrounded by healthy fatty tissue with an abundant lipid components, e.g.,21,22,35 Using FEA it is possible to model a region that includes both stroma and cells as in. 24 Varying the cytoplasm conductivity, it is possible to study the effect of cells filled with lipid droplets within the cytoplasm varying the electrical properties of the external medium. The FEA problem solves a conduction problem as in 36 considering stationary conditions in order to give the electric field distribution in the treated volume. Then, the proposed model could be useful to predict what occurs in tumors with adipose component, but also to evaluate what occurs in tumors surrounded by adipose tissue, or also in gene transfer if the treated volume has a healthy adipose component. Sarcomas is a wide class of tumors that includes adipose tumors, with fibrous and/or myxoid ECM tumors and mixed composition (myxoid and fibrous) with adipose components.30,37–41
With respect to healthy cells that have a cell diameter in the range of 10–20 μm, the adipose cells are larger with a diameter that ranges between 20 to 120 μm. 30 Then, simulations can help to understand the effects of adipose cells in electric field distribution in terms of electrical properties of cell interior and cell diameter. In this study the presence of the lipid component on the cell interior is introduced together with the cell diameter increment, since cells with a fat component have a diameter that ranges from 50 to 100 μm. The cells in this study are grouped closely and together immersed in a collagen shell. Nevertheless, in a preliminary study isolated cells (lower cell density) immersed in a homogeneous material are considered, but the cell interior is modified, and both the cytoplasm and lipid conductivities are considered, respectively. Moreover, a model considers isolated cells and discontinuity in the exterior material, i.e., the 1 × 1 mm square is divided in two half, one with a conductivity of 0.2 S/m, i.e., fibrous stroma, and the other 1.3 S/m, i.e., myxoid stroma. The focus of this work is the evaluation of the transmembrane potential when electroporation pulses are applied to the sample in presence of cell aggregates with a lipid component in the cell interior. In this study is hypothesized that the first pulse modifies the transmembrane potential just before the pore formation.
Materials and methods
Finite element analysis for electric field distribution
The FEA uses the 2D model in Figure 1 to evaluate numerically (by the Finite Element Method) the electric field inside and outside the cells. The 2D model is a square with 1 mm × 1 mm sides with 9 cells-spherically shaped, with diameter ranging from 30 to 50 μm and membrane thickness of 10 nm. The cell–cell distance is about 1 μm corresponding to a local density of cells of 1000 cell/mm2 in case of the cell diameter equal to 30 μm and 350 cell/mm2, cell–cell distance 3.5 μm, when the cell diameter is 50 μm. The 1 × 1 mm square was supplied with a voltage difference applied to the 2 parallel electrodes (line marked in red and black in Figure 1) to estimate the electric field strength and the transmembrane potential. The voltage applied to the upper electrode is 100 V and 0 V is applied to the lower electrode: this way, an electric field of 1000 V/cm in homogeneous condition is obtained. In experimental practice the voltage is applied as a sequence of 8 rectangular pulses 100 μs-long with a rise and fall time of in the range 1–10 μs, depending on the pulse generator. 42 In this paper the electric field distribution is evaluated under the hypothesis that the voltage has reached the plateau phase, it is constant, and the pores are not already formed on the membrane, i.e., the instant before pore formation is considered. The cell membrane, with thickness equal to 10 nm, is made of a non-conductive materials, the lipidic bilayer (σ = 5.3 × 10⁻⁶ S/m), and encapsulates the cell interior made of a conductive material, with a conductivity σC. In the paper, σC = 0.13 S/m and σC = 0.02 S/m is used for cytoplasm and lipid droplet, respectively. In the proposed geometry authors model the lipid droplet as totally cover the cell interior, since in fat cells the volume of cytoplasm and other organelles like nucleus are negligible with respect to the volume of the lipid droplet as shown in Figure 1. It is well known that in fat cells the ratio between the lipid droplet volume on the cytoplasm-nucleus volume is close to 0.9–0.95.30,43–45 The 9 cells group is encapsulated by a collagen shell, a circle with diameter 590 μm and with conductivity σS = 0.2 S/m. 46 The shell is surrounded by a myxoid material with conductivity σS = 1.3 S/m.24,47 Typical values of conductivities used in the simulations are in Table 1.48,49 The 9-cells group is a representative model that would simulate the behavior of a single spheroid surrounded by collagen.
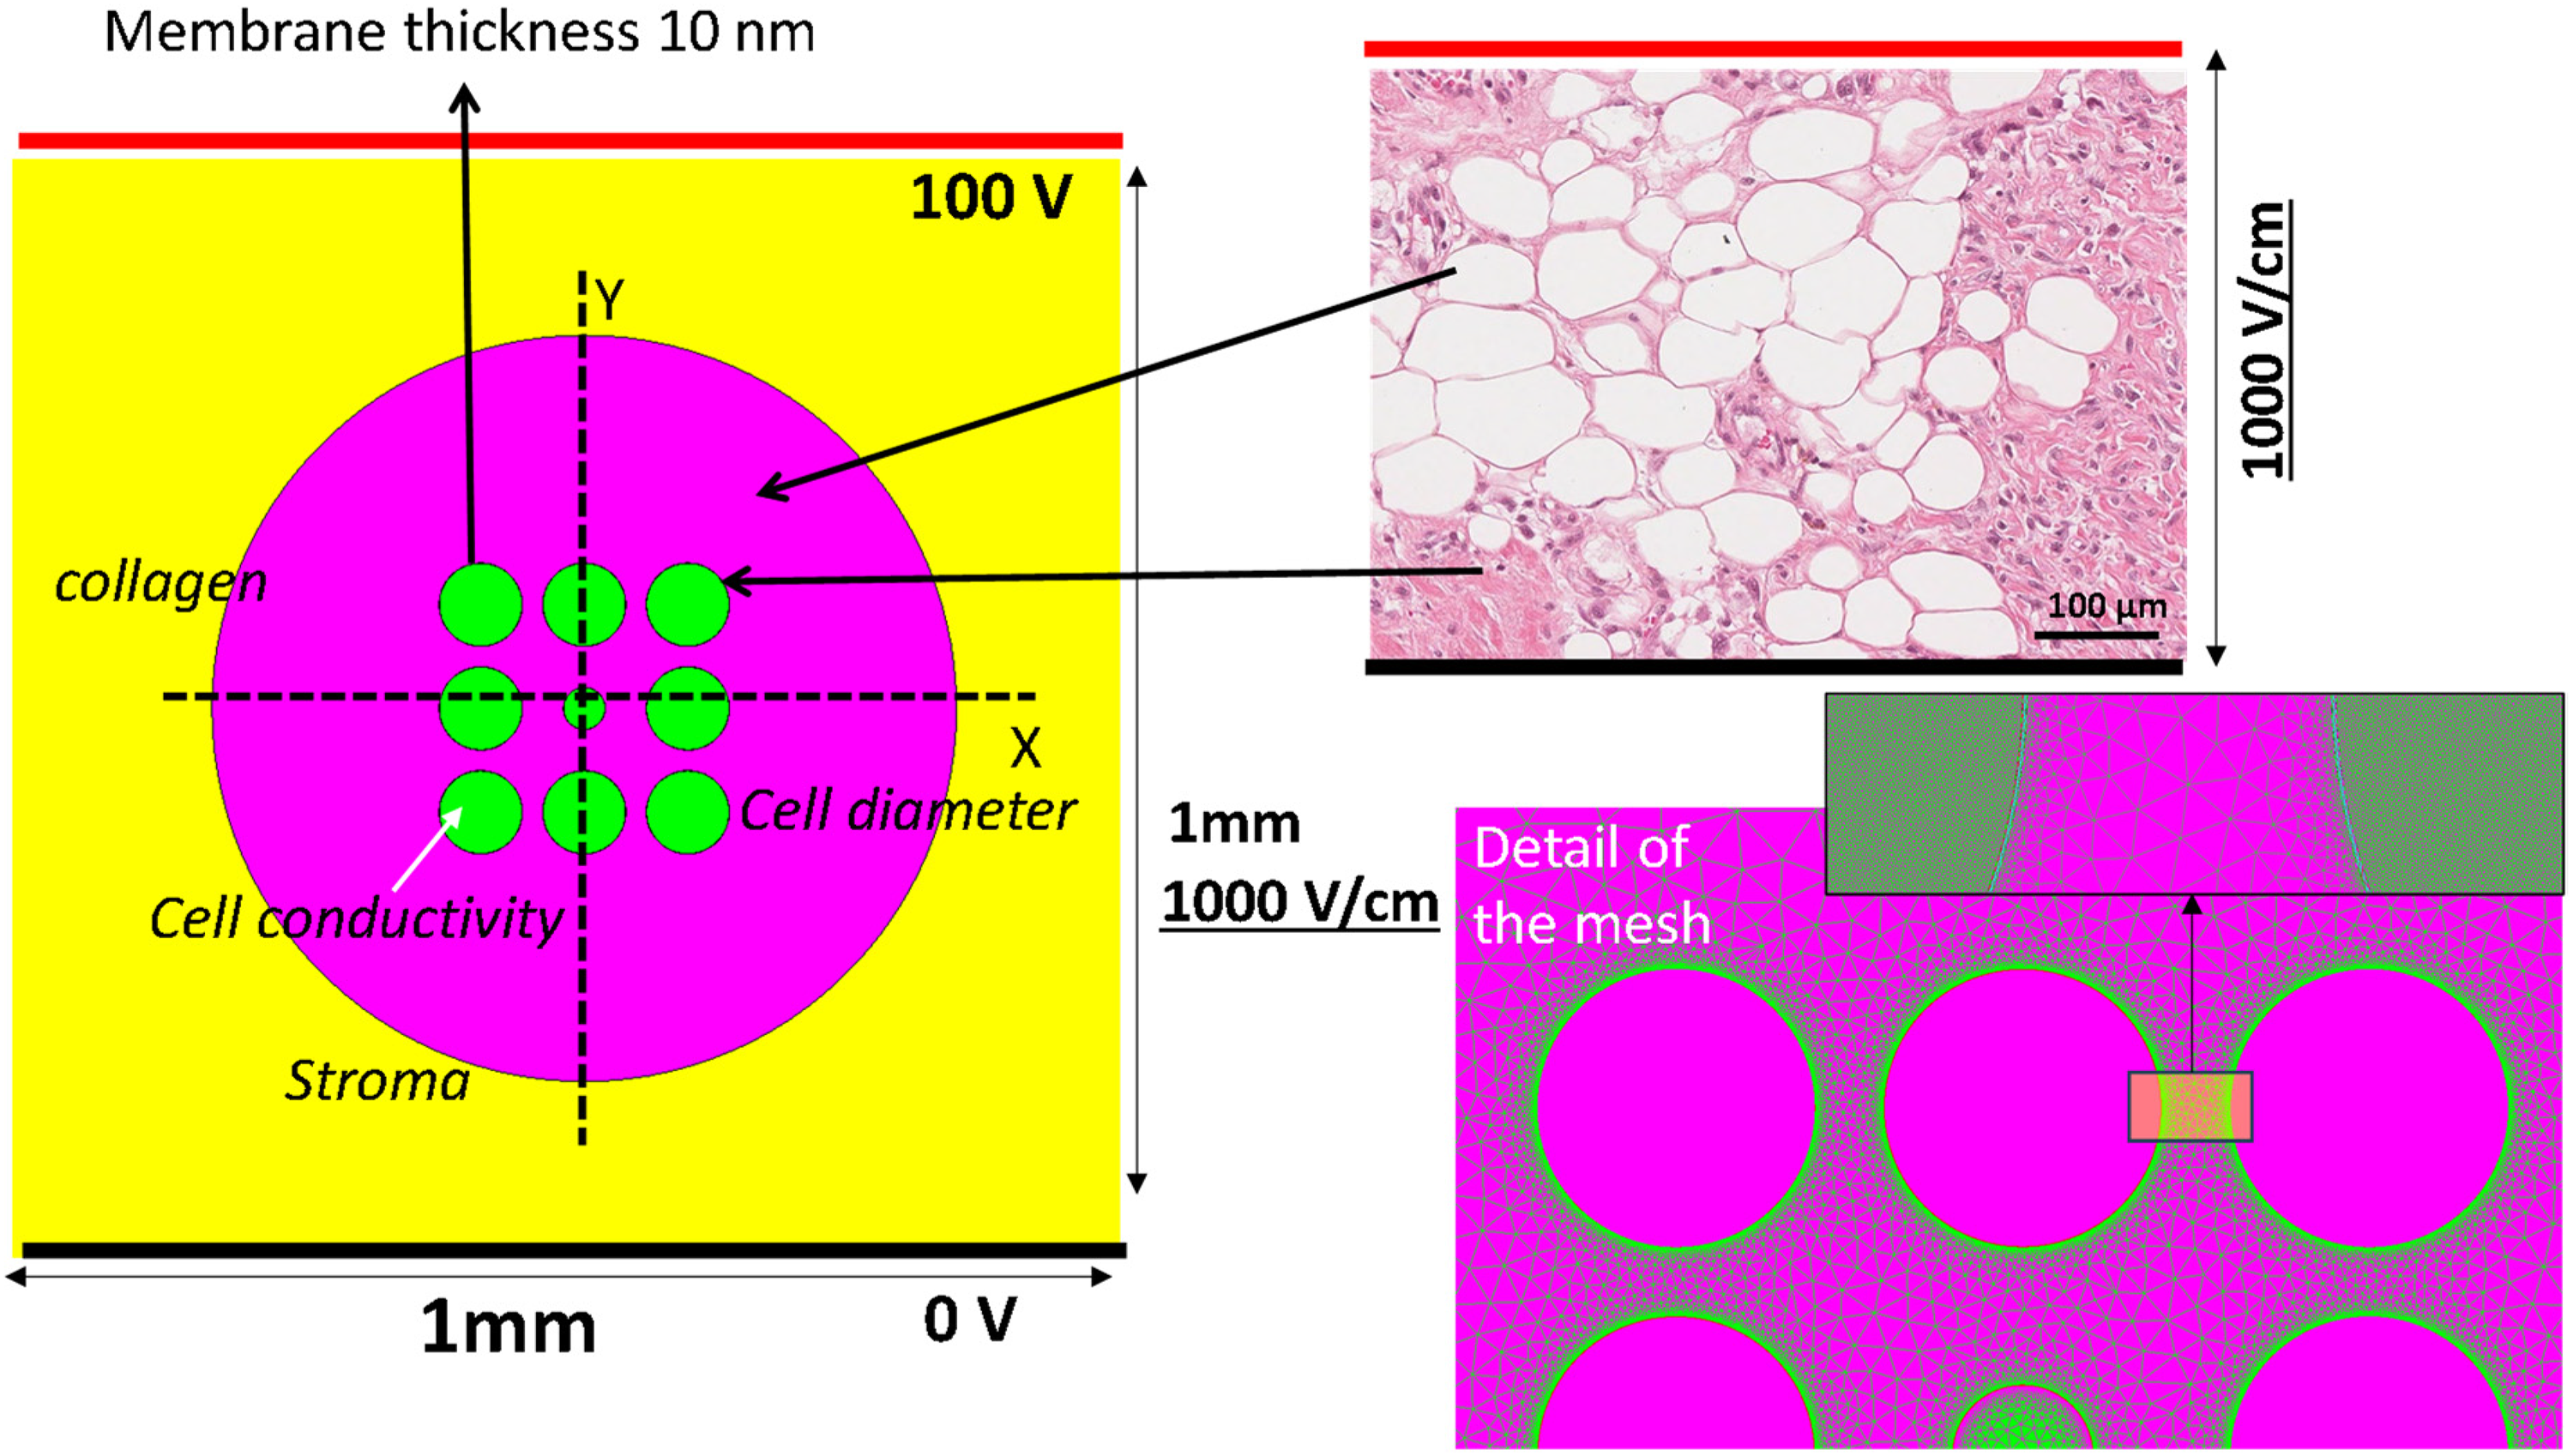
The geometry of the model used in the FEA (left side): group of cells (depending on the case the external ones have lipid droplet inside) in a collagen shell like to a sarcoma slice (white circles are cells with lipid component) stained with hematoxylin/eosin staining of (top right). Electrodes position marked with thick black lines, at 0 V and thick red line at 100 V. Black dashed lines are the lines where the electric field is evaluated. In the bottom right panel, a detail of the mesh for FEA.
Analysis set-up using FEA for different cases.
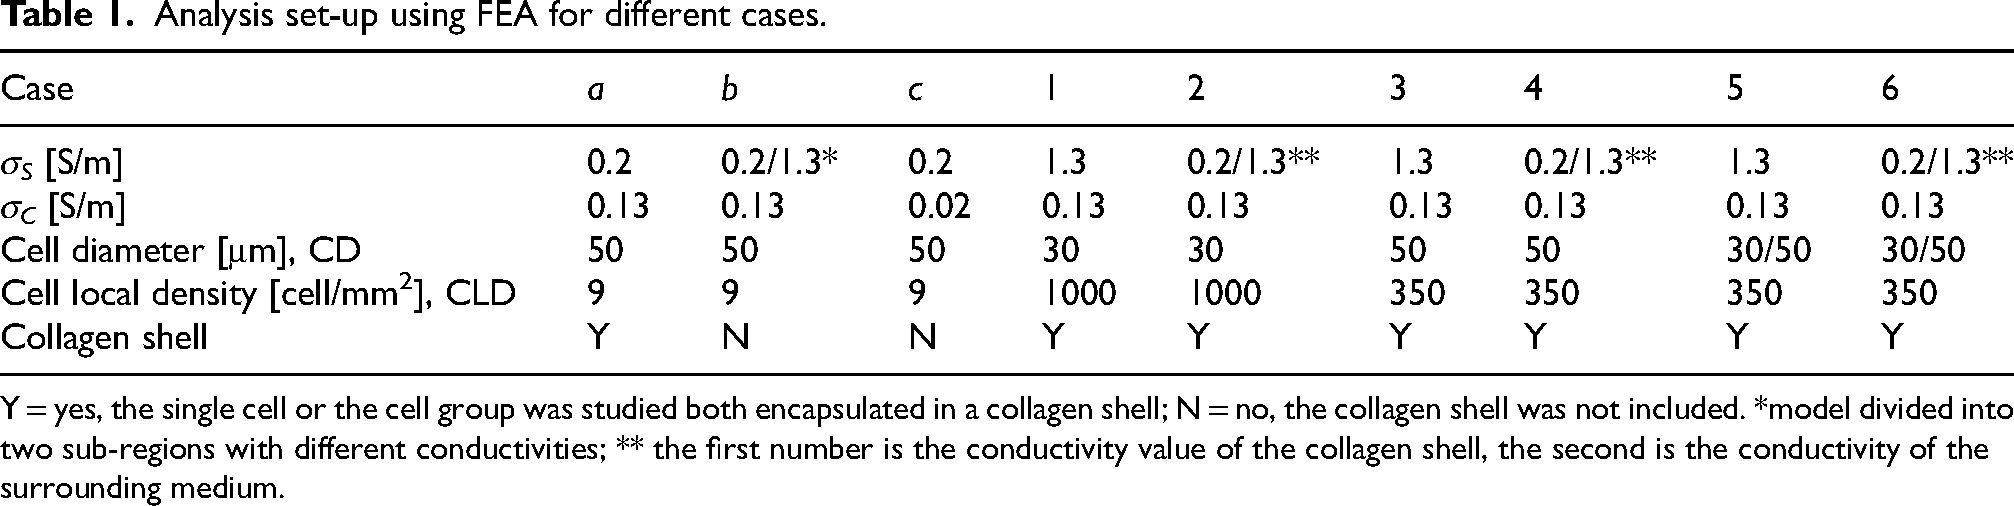
Y = yes, the single cell or the cell group was studied both encapsulated in a collagen shell; N = no, the collagen shell was not included. *model divided into two sub-regions with different conductivities; ** the first number is the conductivity value of the collagen shell, the second is the conductivity of the surrounding medium.
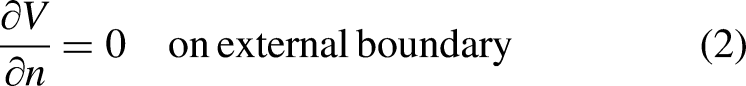
Due to the hypothesis for which the voltage is at the plateau of a rectangular pulse, the electric field intensity is computed using FEA, solving Maxwell's equations in static conditions. Moreover, the electric potential due to the voltage at the electrodes, as proposed by other research groups,36,50 is also evaluated. The electric field intensity and potential are evaluated in the points of the lines in Figure 1 by means of Magnet (Simcenter Magnet, https://plm.sw.siemens.com/it-IT/simcenter, Germany, accessed on October 24, 2023) a commercial finite element simulator that solves a static conduction problem in direct current on electric scalar potential V, i.e., the electric field in a point P(x,y), x,y spatial coordinates, is E(P) = −∇V, and imposing a Dirichlet boundary condition, i.e., constant voltage on the lines in Figure 1 (0 at one line and 100 V in opposite line) that represent the electrodes.
36
The Laplace equation in the scalar potential V, is solved51,52:
The electric field strength is analyzed using the color maps and extracting the electric field along the lines α and β in Figure 1, whereas the electric potential is only analyzed along the line α. In Figure 2, an example of transmembrane potential evaluation is reported. Considering the electric potential in two points, one outside and one inside the cell (i.e., on the dashed lines in Figure 2), it is well known that the i-th transmembrane potential, ΔVi, approximately depends on the cell radius, R1 and the applied electric field, Eext, as2,53–56:
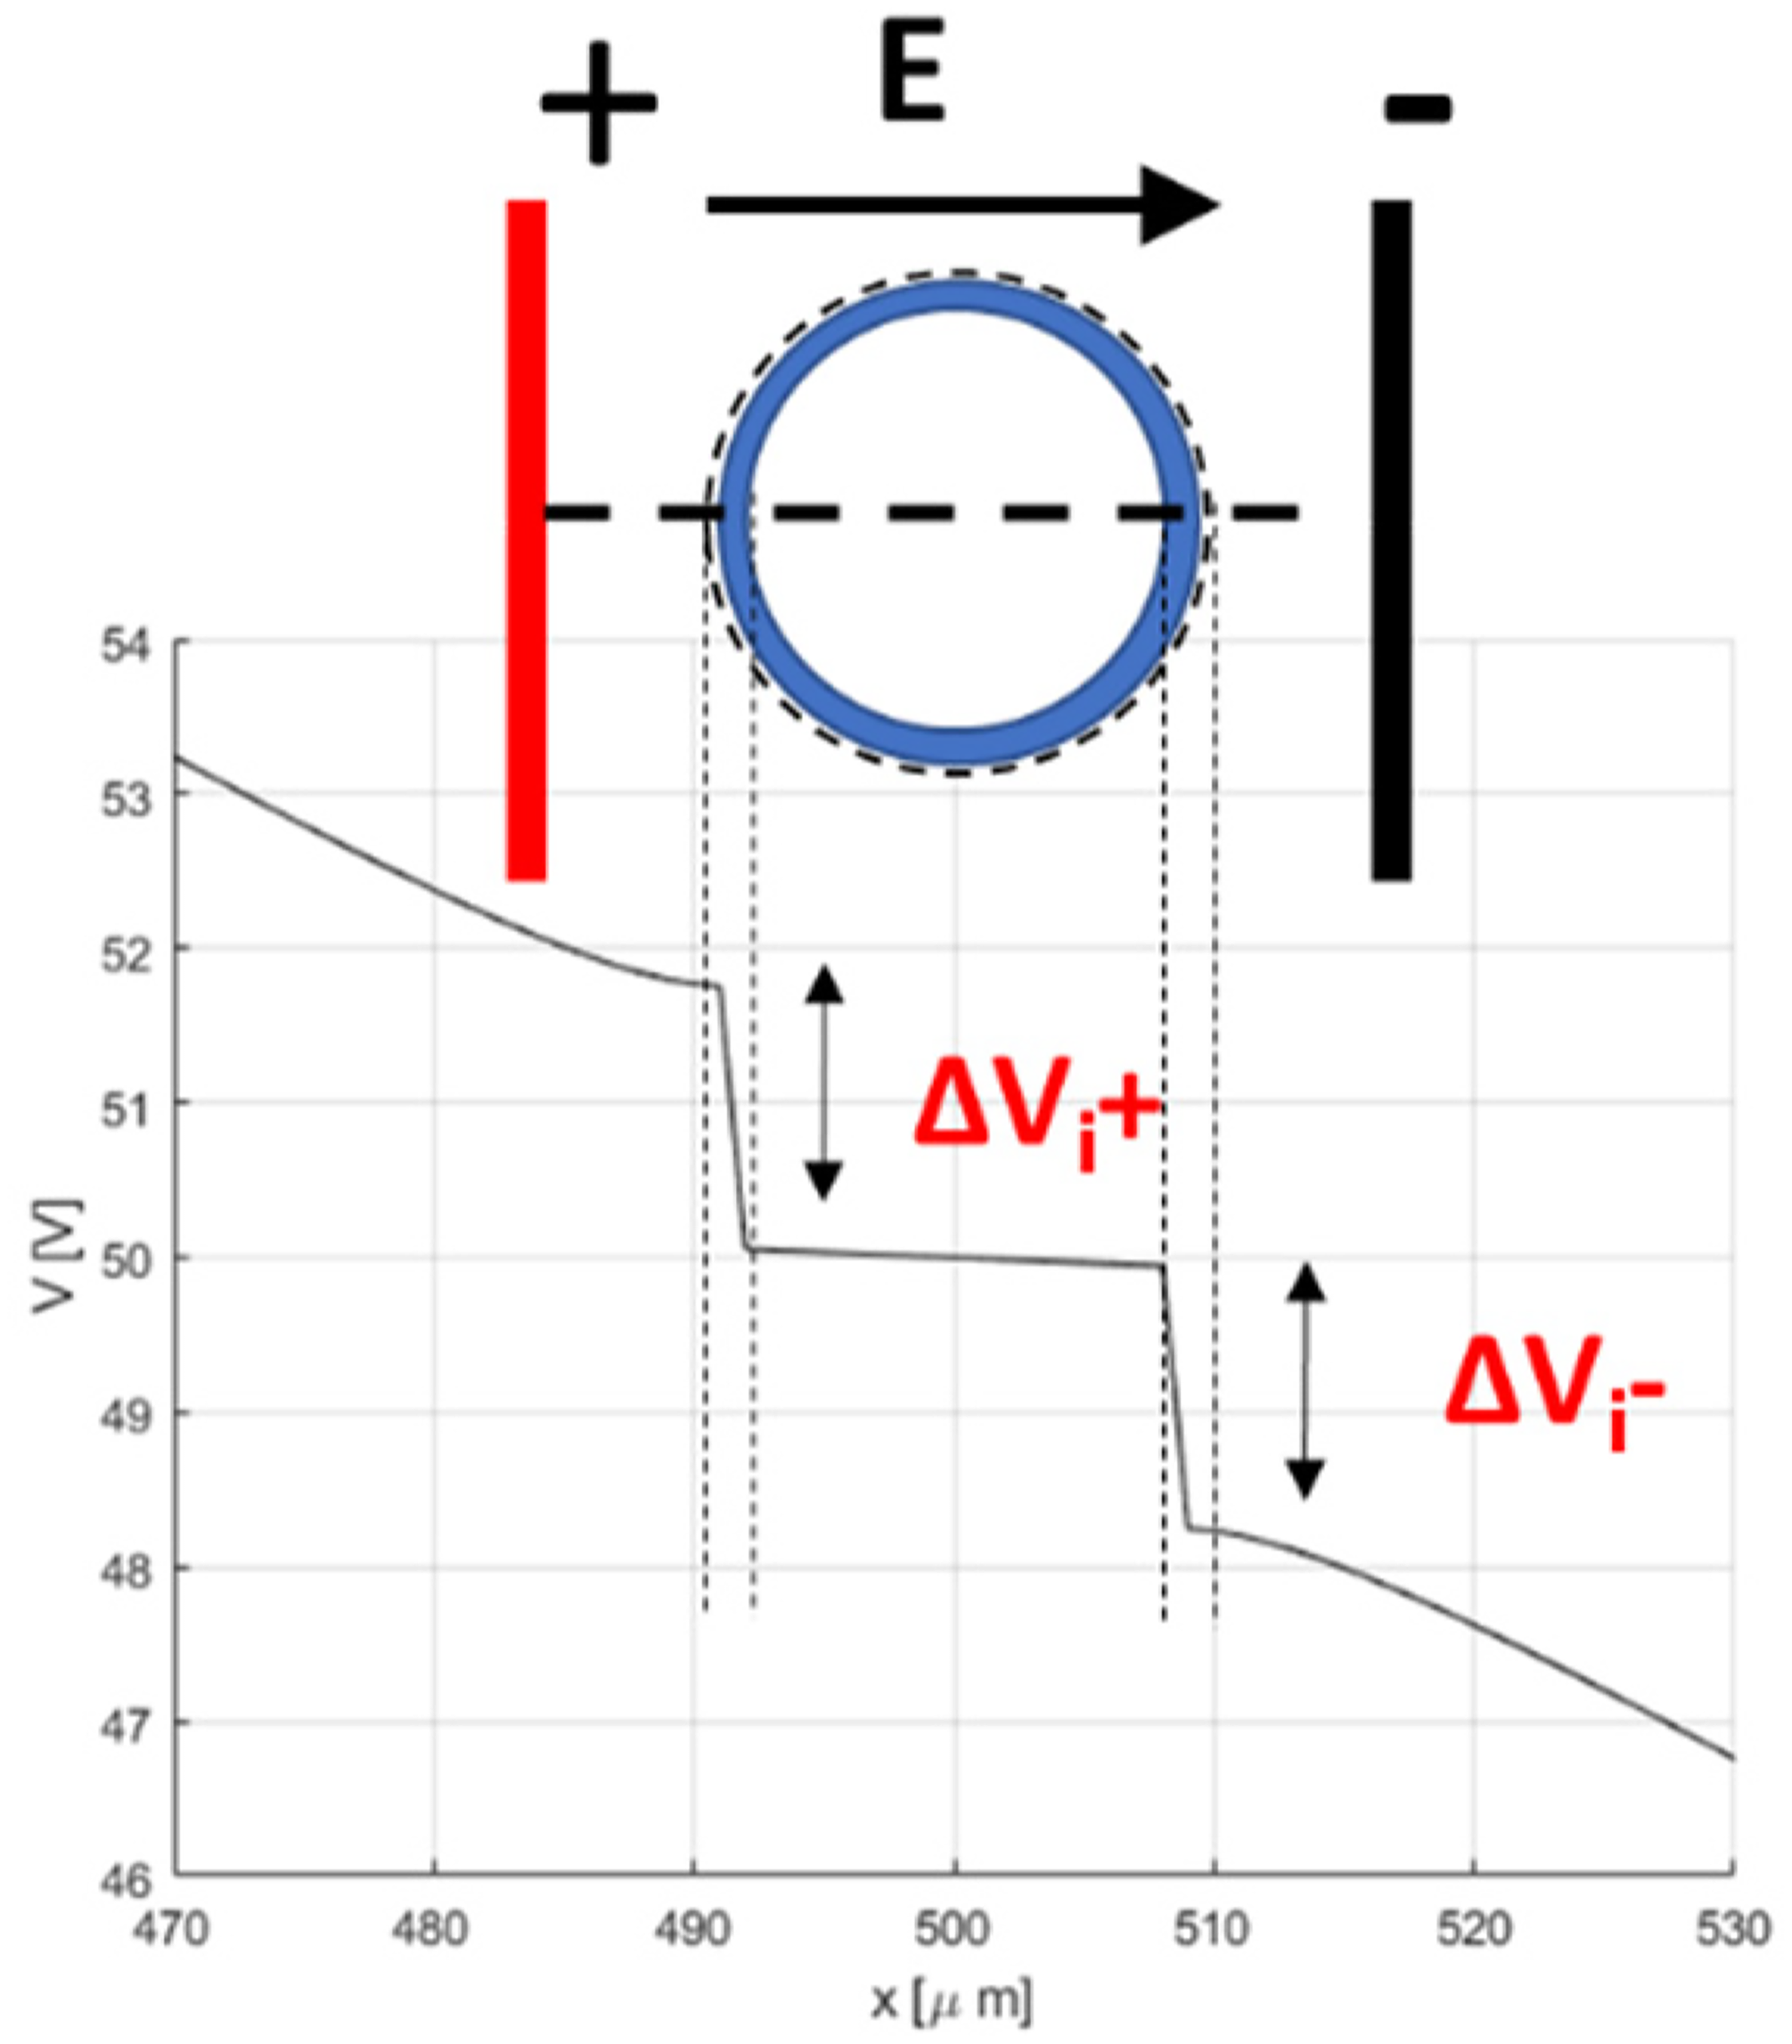
Transmembrane potential. 24
Results
In this study the focus is on the electric field and transmembrane potential when the cell inside is full of lipid components. The electric field strength is analyzed by means of color maps, sampling the electric field along the lines X and Y in Figure 1, and the electric potential along the line Y.
Considering the 9-cells, diameter 50 μm, the following cases are studied:
case a: homogeneous stroma with conductivity σS = 0.2 S/m and cell interior with cytoplasm conductivity σC = 0.13 S/m; case b: cell interior with cytoplasm conductivity σC = 0.13 S/m and stroma divided in two regions, one with conductivity σS = 0.2 S/m, i.e., collagen, and the other with conductivity σS = 1.3 S/m i.e., myxoid stroma; case c: homogeneous stroma and cell interior with lipid droplet conductivity σC = 0.02 S/m; Considering the 9-cells aggregated in a group the following cases are studied: case 1: 30 μm cells (cytoplasm); case 2: central cell: 30 μm cell (cytoplasm), surrounding cells: 30 μm cells (lipid); case 3: 50 μm cells (cytoplasm); case 4: central cell: 50 μm cell (cytoplasm), surrounding cells: 50 μm cells (lipid); case 5: central cell: 30 μm cell (cytoplasm), surrounding cells: 50 μm cells (cytoplasm); case 6: central cell: 30 μm cell (cytoplasm), surrounding cells: 50 μm cells (lipid).
Numerical analysis of preliminary cases
Figure 3 reports the colored maps for the cases a, b and c. In these cases the cell-cell distance was 283 μm. It is possible to note that the conductivity of the stroma affects the electric field distribution around cell as shown by the cases a and b. In particular, in Figure 3(b) the upper part of the model has the conductivity of collagen and the lower part the one of the myxoid stroma, whereas in the case a the stroma is homogeneous and fibrous. Finally, the case c shows the case with the lipid component inside the cell: in this case the electric field inside the cell is higher with respect to the one in the other two cases where cell interior has the cytoplasm conductivity.
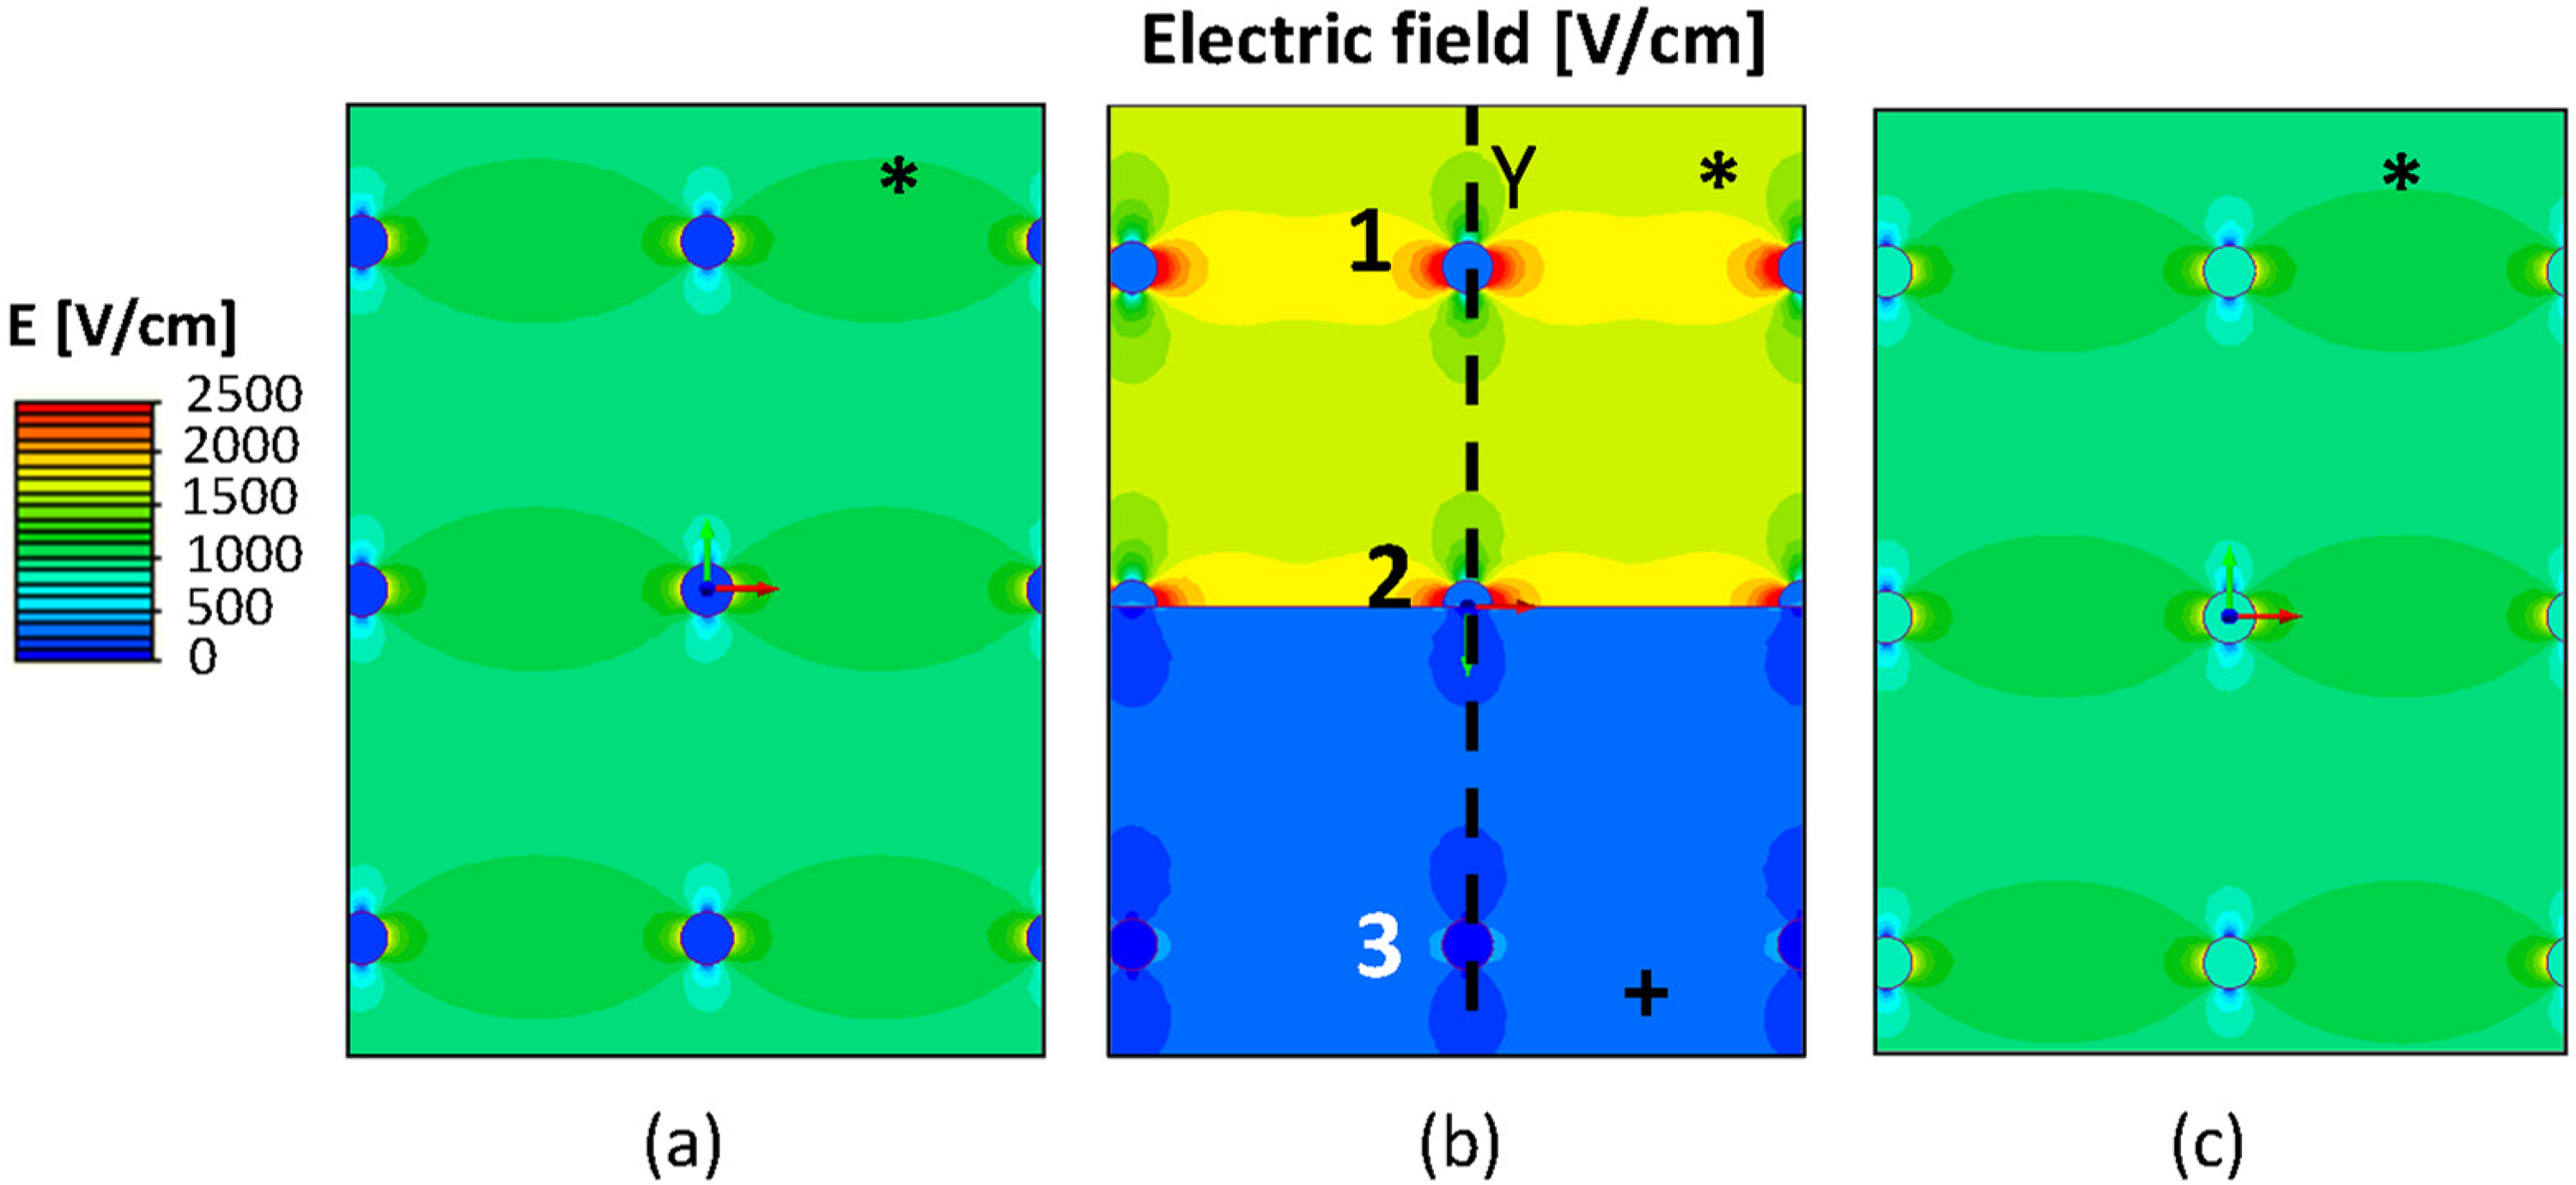
Color maps for cases a, b and c. * Fibrous stroma σ = 0.2 S/m and + Myxoid stroma σ = 1.3 S/m.
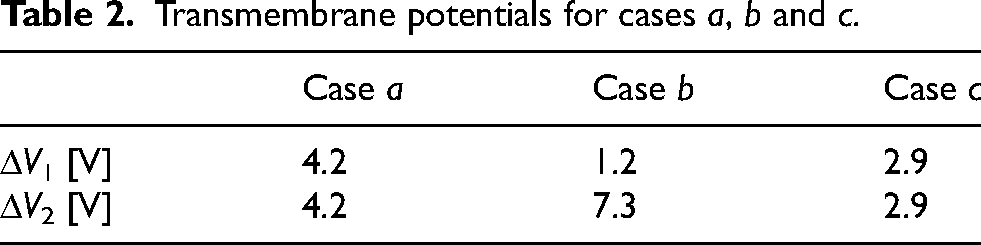
Table 2 reports the transmembrane potential of the central cell at the membrane faced to the upper and bottom electrode, respectively. Only for the case b the two values are different since the considered cell is at the boundary of the material discontinuity.
Transmembrane potentials for cases a, b and c.
Numerical analysis of cell aggregated: Cases 1 and 2
Figure 4 shows the results, colored maps with electric field strength and electric field sampled along line α and β, obtained for the cases 1 and 2 for which all the 9 cells have a diameter of 30 μm, and the 8 cells in the external ring are filled with cytoplasm (first row), with a σC = 0.13 S/m conductivity, or a lipid droplet (second row), with σC = 0.02 S/m. It is worth to notice that the electric field strength inside the cell membrane is about 106 V/cm, whereas inside the cells it is roughly hundreds of V/cm, which means roughly 4 orders of magnitude lower than in the membrane. This is due to the low conductivity of the membrane with respect to the cytoplasm. However, for visualization purposes, in Figures 4–6, these peaks of electric field have been removed, hence they are not visible in the figures.
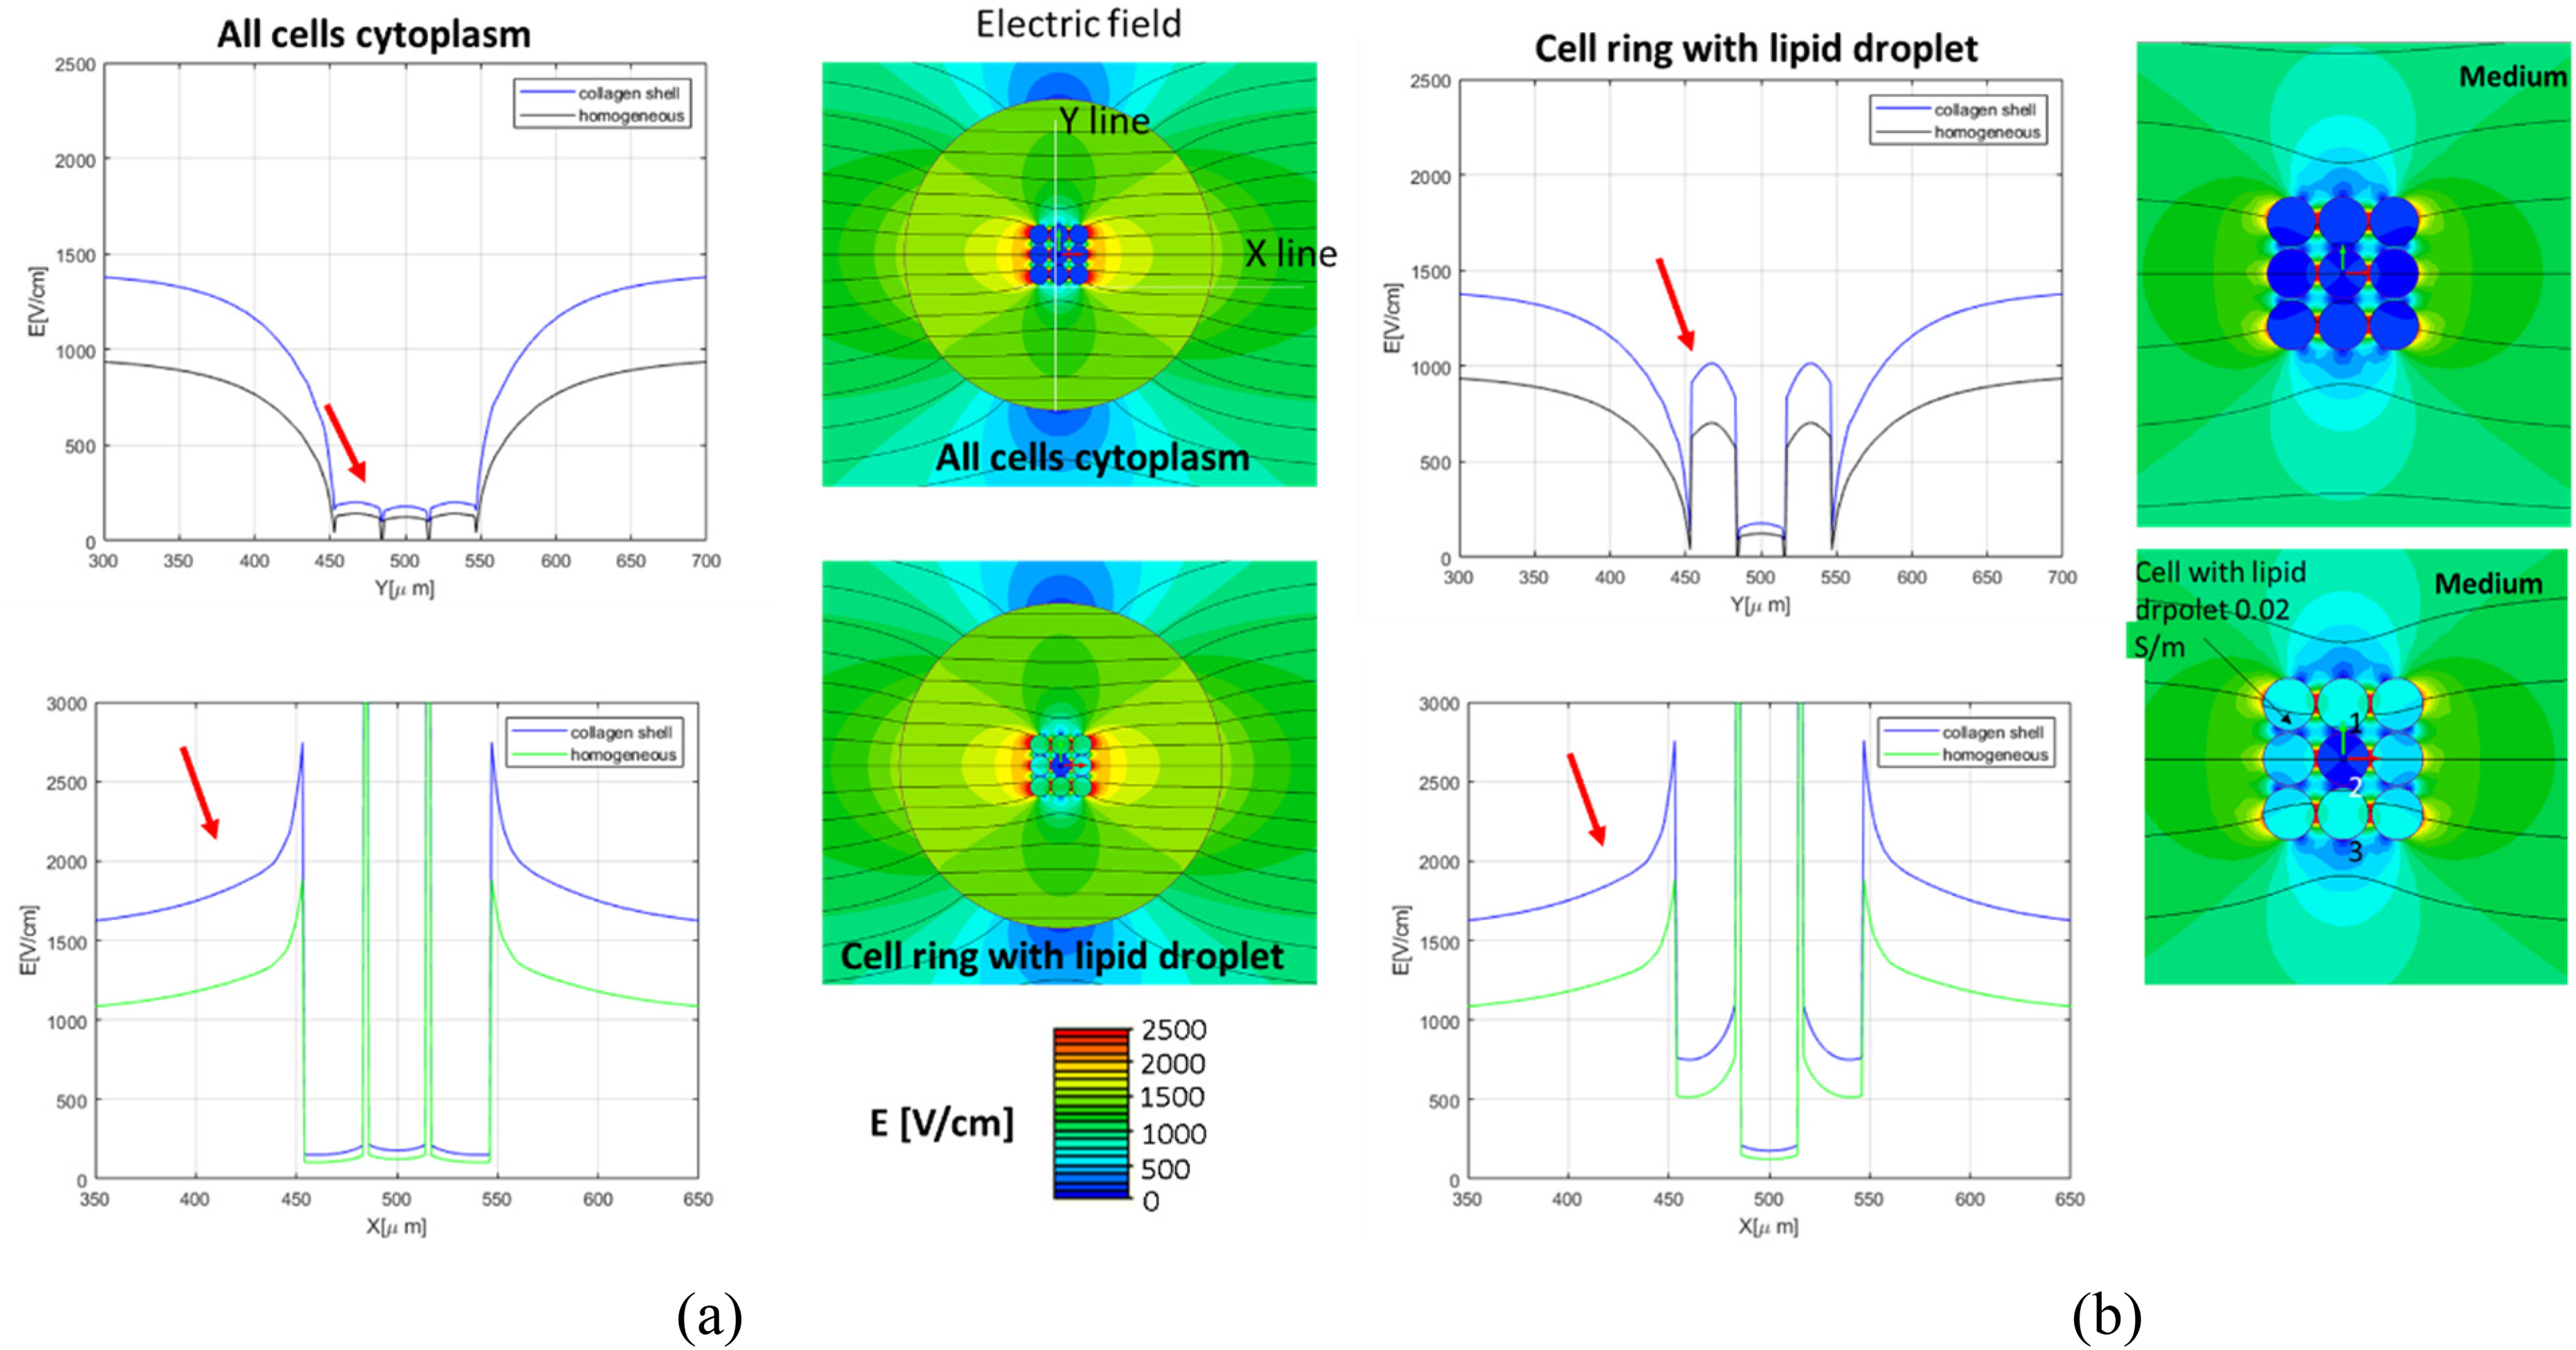
Color maps for cases 1 and 2: (a) with collagen shell and (b) without collagen shell. The 8 cells in the external ring are made of cytoplasm (first row) and lipid droplet (second row).
Color maps for case 4 without (left, first row) and with (right, first row) collagen shell. The 8 cells in the external ring are made of lipid droplet. Electric field along lines X and Y.
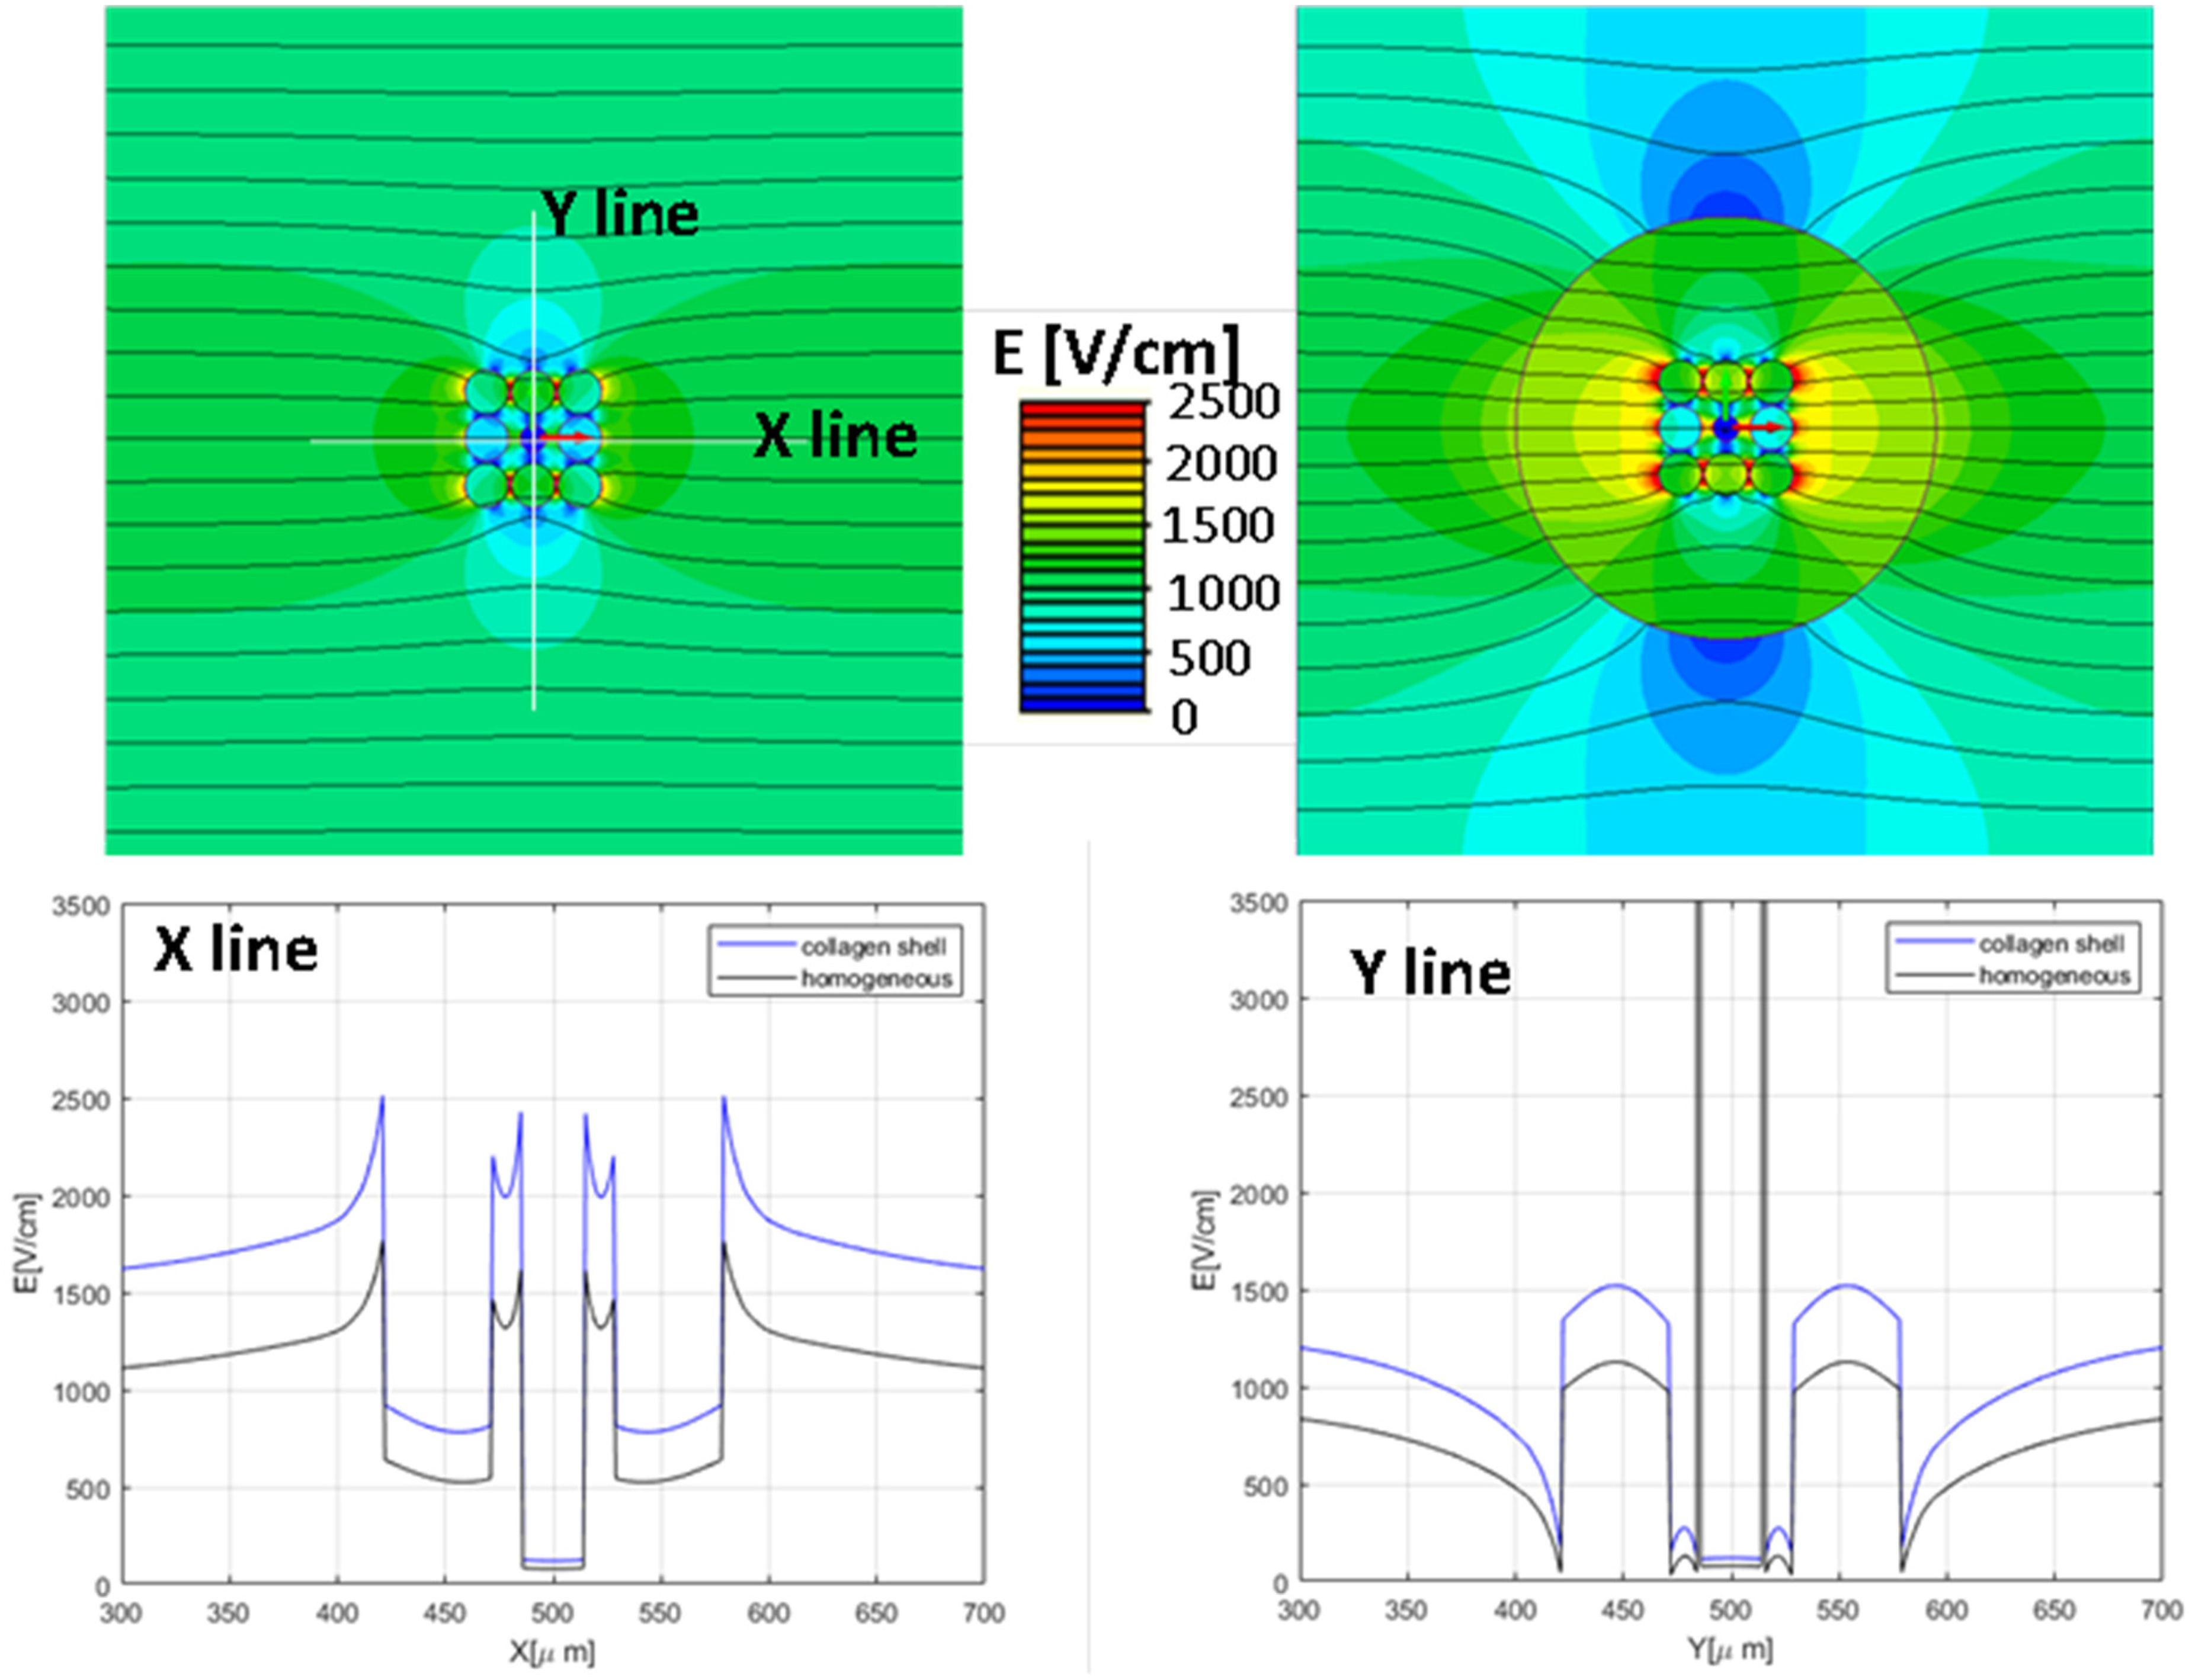
Color maps for case 6 without (left, first row) and with (right, first row) collagen shell. The 8 cells in the external ring with electrical properties of lipid droplet. Electric field along lines X and Y (second row).
In Figure 4(a) the collagen shell is considered, and in Figure 4(b) results refer to absence of the collagen shell. From colored map it is possible to observe the influence of the collagen shell (the big circle) in the modification of the electric field that is also visible in the curve reported in the graph: the electric field in presence of collagen is higher with respect to the one in case of the collagen shell is absent (red arrow). The presence of the lipid droplet inside cells doesn’t affect the electric field outside the cells. Conversely, the electric field strength in the cells filled with lipid is higher with respect to the one on the central cell in which the interior has the electric properties of the cytoplasm. Then a less conductive material like lipid droplet (σC = 0.02 S/m instead of 0.13 S/m) increases locally the electric field strength.
Table 3 reports the transmembrane potential, ΔV, in the different configurations. In the case in which all cells have the same electrical characteristics the ΔV of the central cell is lower with respect to the cell in the external ring in both cases (with or without the collagen shell). Collagen increases the transmembrane potential as reported in. 24 A different behavior of the transmembrane potential of the central cell was found when lipid droplet is inside the cells of the external ring. In this case ΔV of the central cell is higher with respect to the cell in the external ring.
Transmembrane potential along line Y in cases 1 and 2 for the three cells: #1 upper cell, #2 central one and #3 lower cell. Cell diameter 30 μm.

Numerical analysis of cell aggregated: Cases 2 and 3
Table 4 reports the transmembrane potential, ΔV, in cases 3 and 4. Also in these cases the collagen increases the transmembrane potential as reported in 24 and the presence of the ring of cells filled with the lipid droplet increases the transmembrane potential of the central cell. As before, if the cells in the external ring are filled with the lipid droplet, the ΔV of the central cell (cell #2) is higher with respect to the one of the cells in the external ring (cell #1 and #3). In case the cells in the external ring have the electrical properties of cytoplasm, case #3, the transmembrane potential has the behavior reported in 24 and it is lower for the central cell.
Transmembrane potential along line Y in case 3 and 4 for the three cells: #1 upper cell, #2 central one and #3 lower cell. Cell diameter 50 μm.

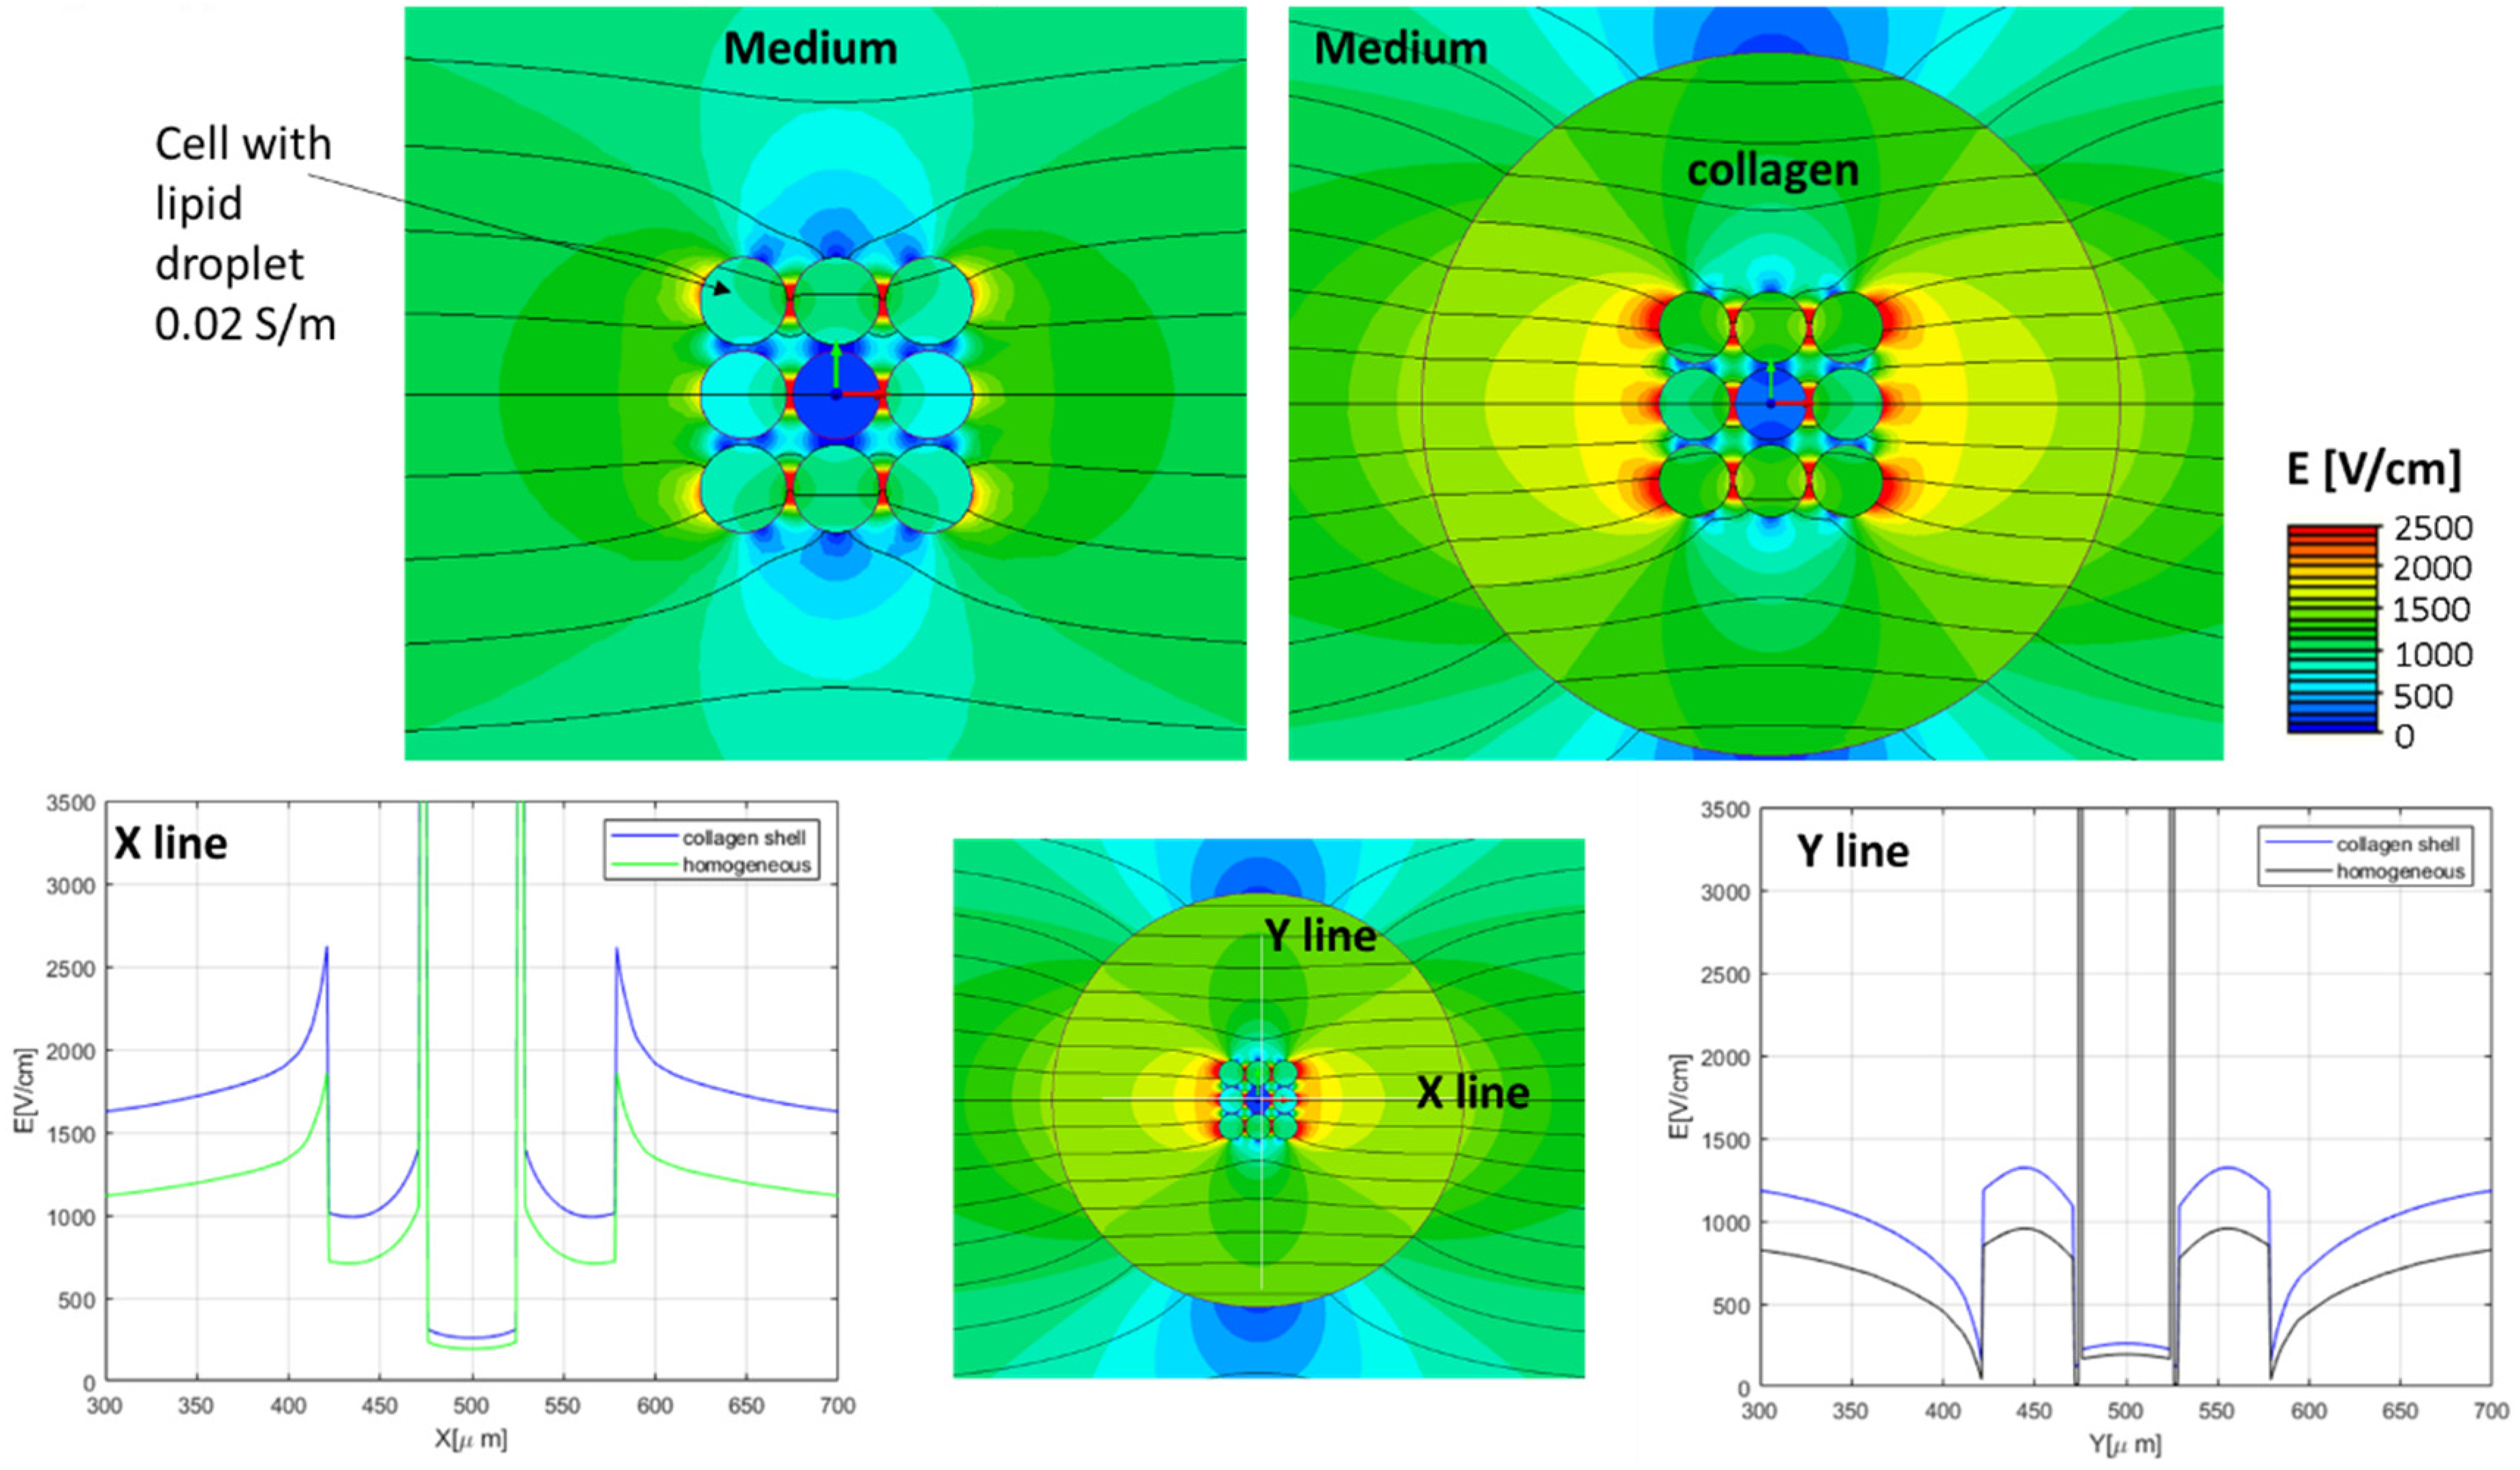
Figure 5 shows the FEA results, colored maps with electric field strength and electric field sampled along line α and β, obtained for the case 3 for which all the 9 cells have a diameter of 50 μm, and the 8 cells in the external ring are filled with a lipid droplet with a σC = 0.02 S/m conductivity. In this analysis both cases, with and without collagen shell, are considered. In the right panel the collagen shell is considered, and in the left panel the results obtained without the collagen shell are shown.
As reported in the previous case (cells with a diameter of 30 μm) it is possible to observe the influence of the collagen shell on the electric field distribution considering case 4. Considering the electric field sampled along the lines X and Y, the electric field inside the cells is higher with respect to the previous cases since the cell diameter is larger, 50 μm instead of 30 μm. Nevertheless, the electric field evaluated along the Y-line outside the cell group is lower with respect to the previous cases.
Numerical analysis of cell aggregated: Cases 5 and 6
After the analysis of the effect of the single parameters, i.e., cell diameter, influence of the collagen shell, and of the cell interior with lipid electric characteristics, the FEA is used to study the behavior of the electric field intensity and transmembrane potential in case the central cell has a smaller diameter, e.g., 30 μm, than the 8 cells in the external ring, e.g., 50 μm.
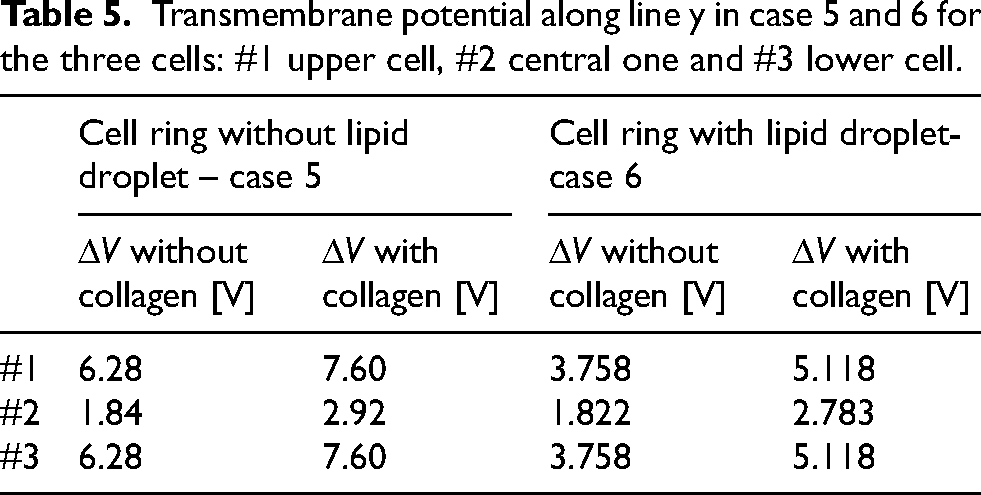
Table 5 reports the transmembrane potential, ΔV, in cases 5 and 6. As reported in previous analysis the collagen presence affects the transmembrane potential that increases with respect to the case without it, as in. 24 Nevertheless, in accordance with equation (3) the transmembrane potential of the central cell with smaller diameter is lower. Comparing these results with the ones of the case 2 (Table 3), i.e., all cells with diameter 30 μm, and the presence of the ring of cells filled with the lipid droplet, it can be remarked that the transmembrane potential of the central cell, in case 6 is lower than in case 2. In case 5, cells in the external ring with electrical properties of cytoplasm, the transmembrane potential confirms the behavior in the previous cases and reported in. 24 Figure 6 shows the FEA results, colored maps with electric field strength and electric field sampled along the lines X and Y, obtained for the case 6.
Transmembrane potential along line y in case 5 and 6 for the three cells: #1 upper cell, #2 central one and #3 lower cell.
In this analysis both the cases (with and without collagen shell) are considered. In the right panel the collagen shell is considered, while on the left panel the results without the collagen shell are shown.
Conclusion
The effect of the presence of lipid cells, e.g., in sarcomas characterized by cells with lipidic components, in electroporation was known in literature, where clinical real cases are described. 21 The presence of the cells with a lipidic component is a condition that limits the therapeutic effect of electroporation. This happens despite these cells have a larger diameter with respect to the cells without lipidic components. In this work, the FEA results show both the effect of inhomogeneity and presence of a lipid droplet on the transmembrane potential in electroporation conditions. Compared to the case with homogeneous electrical properties, the presence of collagen shell around the cell increases the transmembrane potential. The effect related to the presence of cells with the lipid droplet modifies the transmembrane potential too. Hence, this study investigates the effect of different electrical properties of the cells and the presence of inhomogeneities during the application of the voltage pulses for electroporation protocols.
Footnotes
Funding
The authors received no financial support for the research, authorship, and/or publication of this article.
Declaration of conflicting interests
The authors declared no potential conflicts of interest with respect to the research, authorship, and/or publication of this article.